Coping with increased water scarcity: from “Efficiency” to “Productivity” Theib Oweis Director, Integrated Water and Land Management Program, ICARDA, Amman, Jordan Presentation at the 2014 Symposium: Drought in the life, cultures and landscape of the great Plains 1-4, April 2014. Lincoln, Nebraska
Transcript
Coping with increased water scarcity: from “Efficiency” to “Productivity”
Theib Oweis Director, Integrated Water and Land Management Program, ICARDA, Amman, Jordan
Presentation at the 2014 Symposium: Drought in the life, cultures and landscape of the great Plains 1-4, April 2014. Lincoln, Nebraska
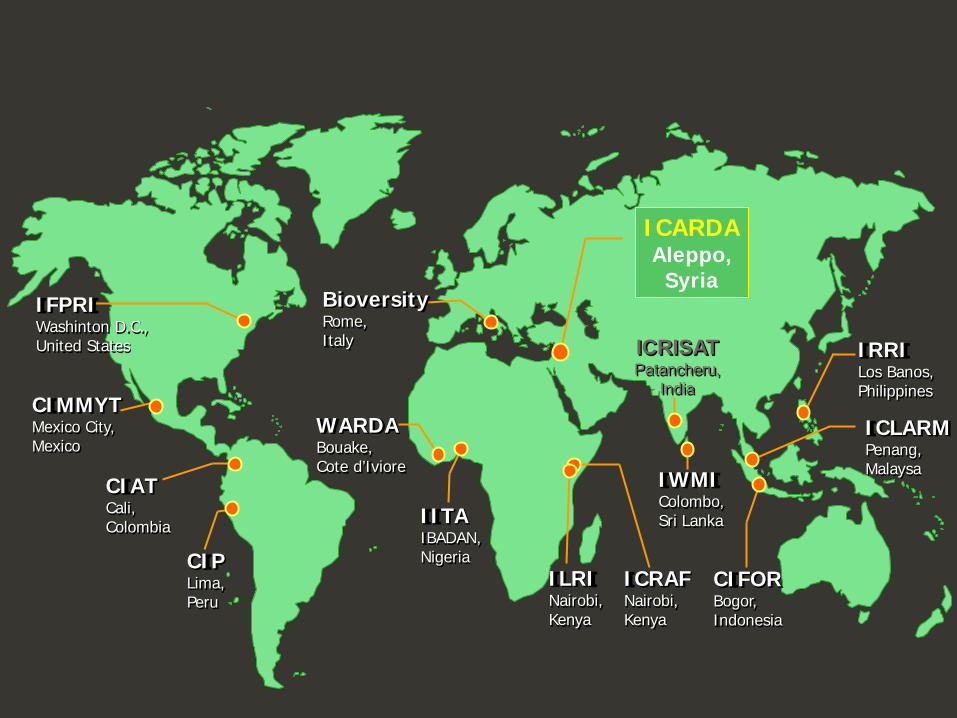
IWMI Colombo, Sri Lanka
CIFOR Bogor, Indonesia
ICLARM Penang, Malaysa
IRRI Los Banos, Philippines
ICRISAT Patancheru,
India
ICRAF Nairobi, Kenya
ILRI Nairobi, Kenya
IITA IBADAN, Nigeria
WARDA Bouake, Cote d’Iviore
Bioversity Rome, Italy
CIP Lima, Peru
CIAT Cali, Colombia
CIMMYT Mexico City, Mexico
IFPRI Washinton D.C., United States
ICARDA Aleppo,
Syria
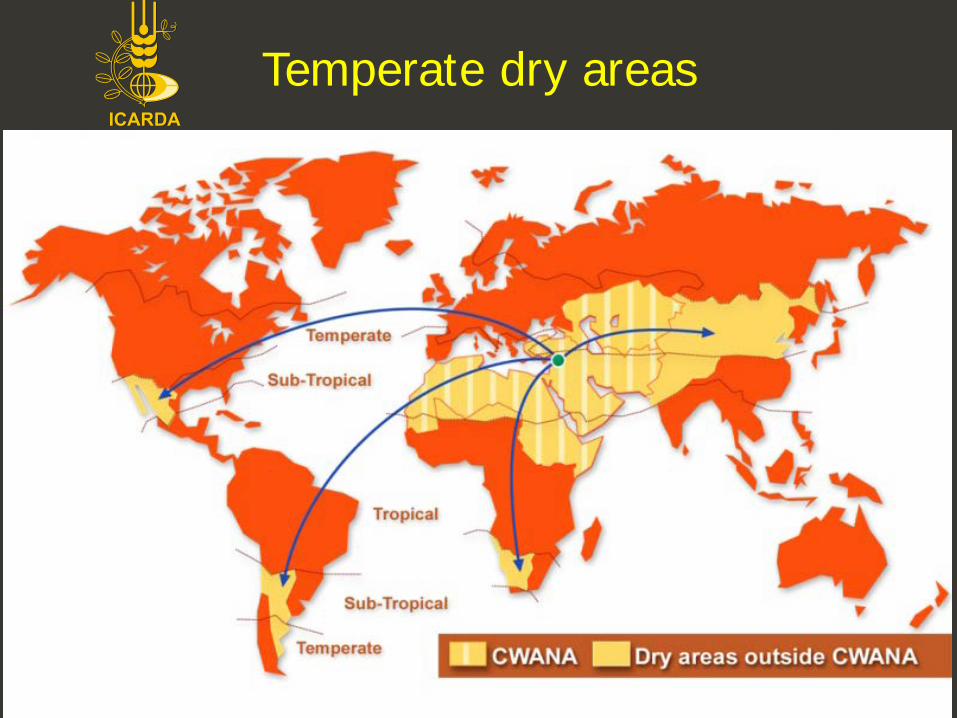
Temperate dry areas
Water use per liter of biofuel production
Liters ET Liters irrigation
China
3800 2500
India 4100 3500
US 1750 300
Brazil 2250 200
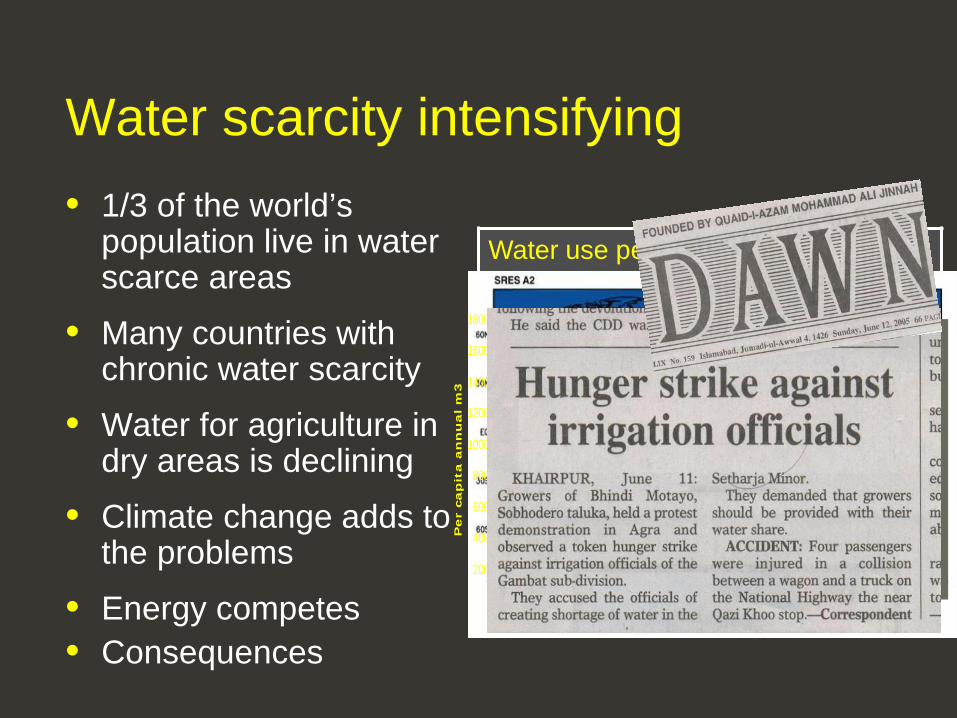
Water scarcity intensifying
• 1/3 of the world’s population live in water scarce areas
• Many countries with chronic water scarcity
• Water for agriculture in dry areas is declining
• Climate change adds to the problems
• Energy competes • Consequences
85 8070
53
0
200
400
600
800
1000
1200
1990 2000 2025 2050
Cu
bic
met
er p
er c
apit
a
0
10
20
30
40
50
60
70
80
90
100
% o
f to
tal w
ater
res
ou
rces
% Agriculture share of totalTotal available water per capitaAgriculture share of water per capita
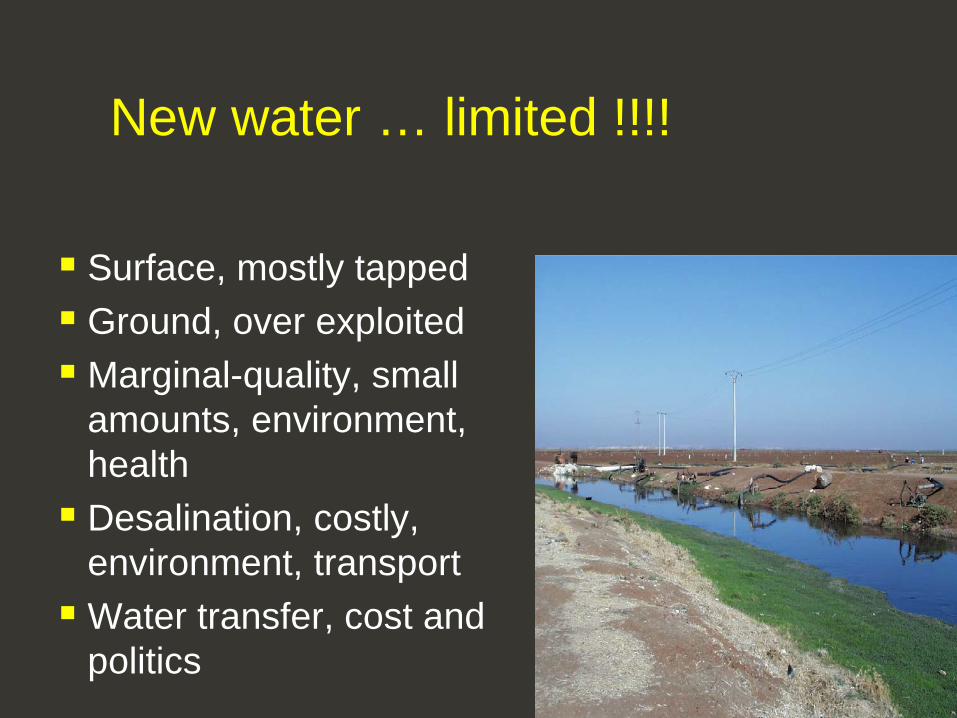
Surface, mostly tapped Ground, over exploited Marginal-quality, small
amounts, environment, health Desalination, costly,
environment, transport Water transfer, cost and
politics
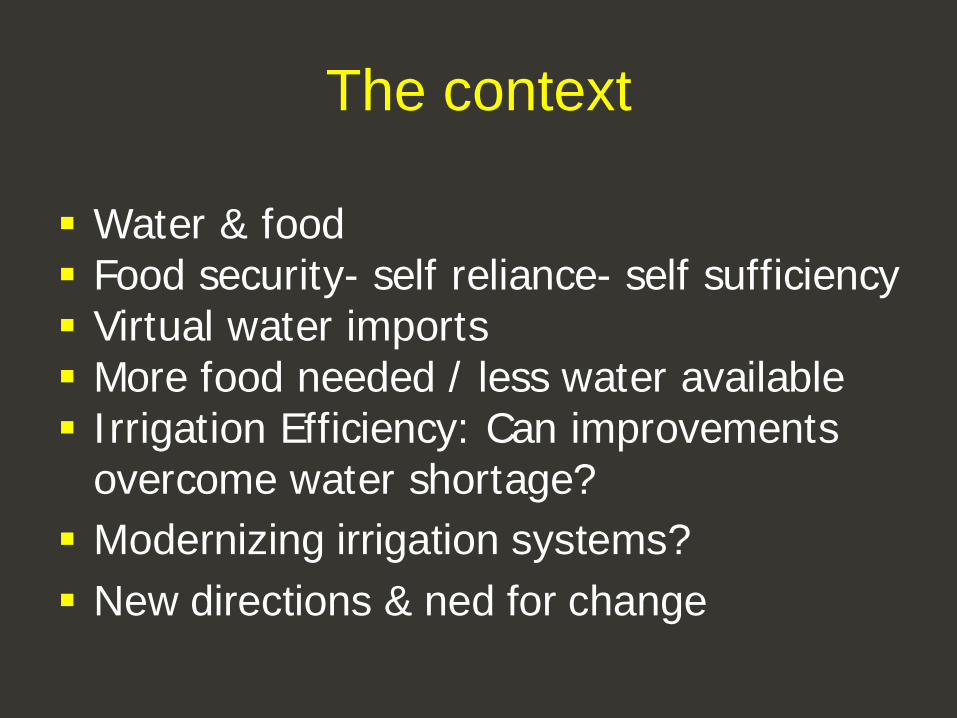
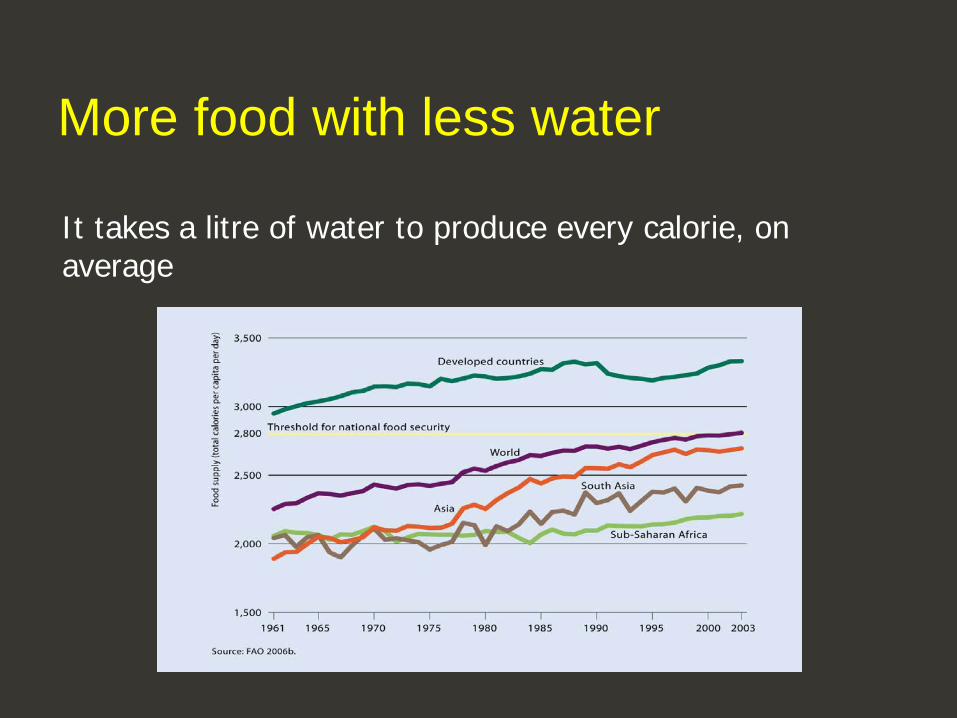
The context
Water & food Food security- self reliance- self sufficiency Virtual water imports More food needed / less water available Irrigation Efficiency: Can improvements
overcome water shortage? Modernizing irrigation systems? New directions & ned for change
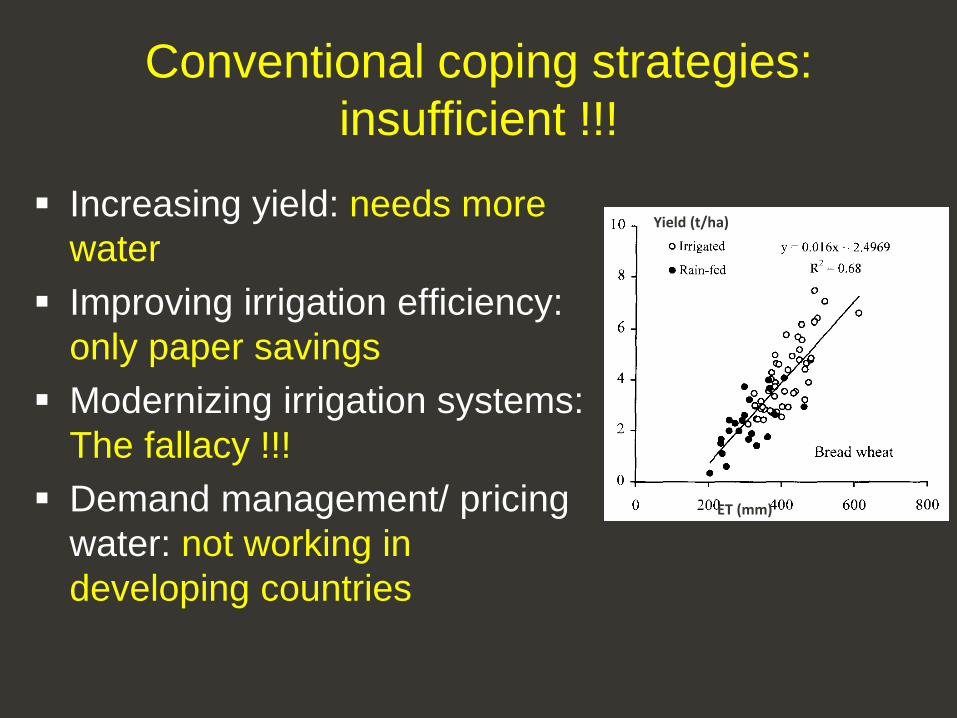
Conventional coping strategies: insufficient !!!
Increasing yield: needs more water
Improving irrigation efficiency: only paper savings
Modernizing irrigation systems: The fallacy !!!
Demand management/ pricing water: not working in developing countries
Yield (t/ha)
ET (mm)
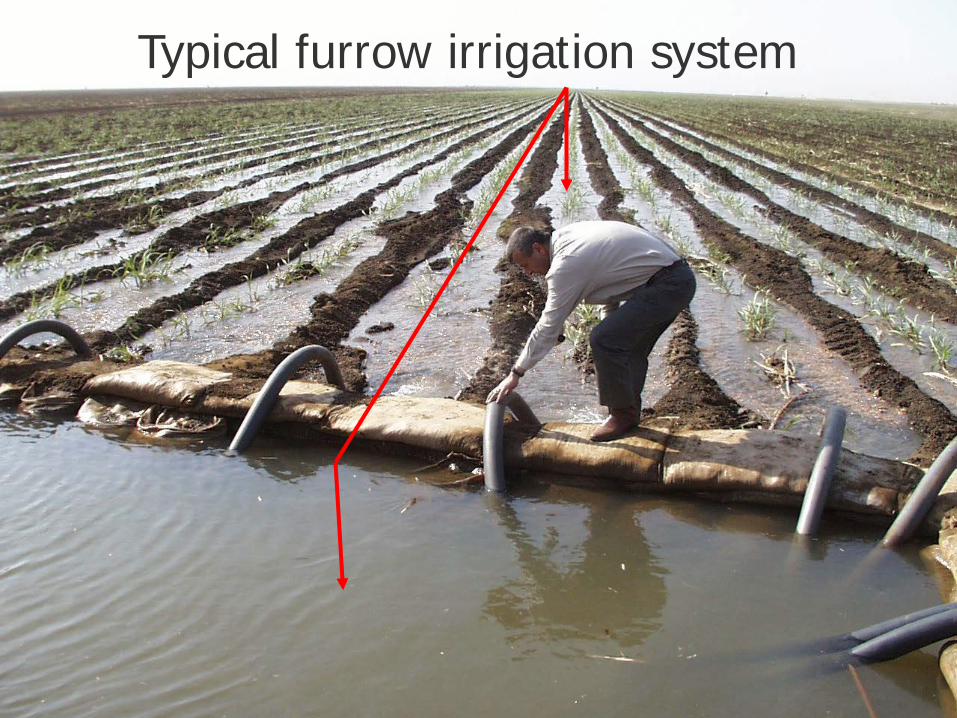
Typical furrow irrigation system
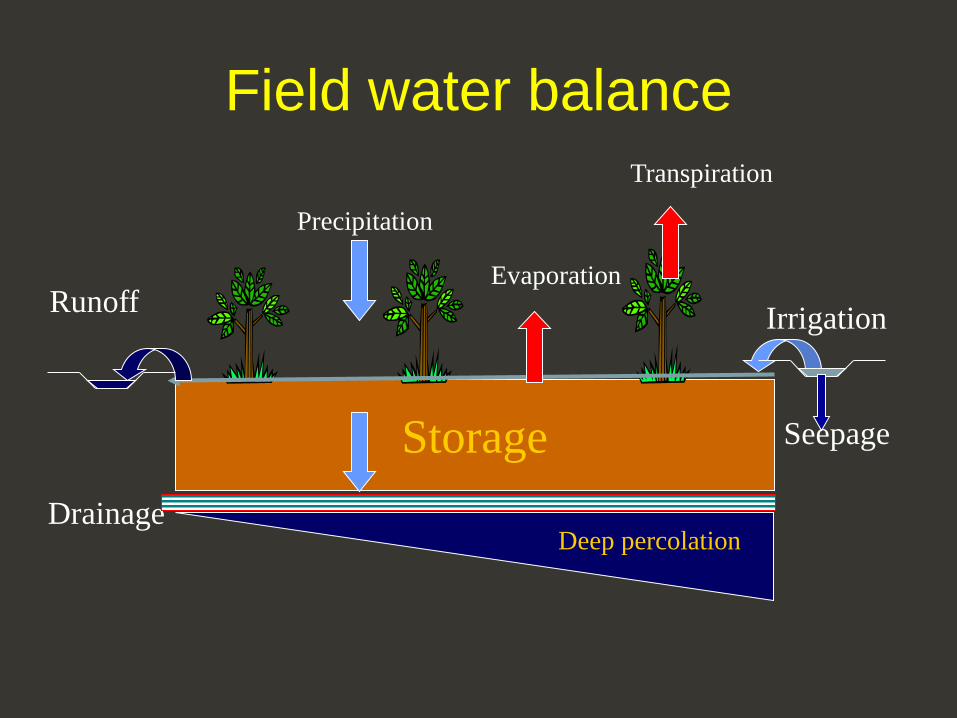
Storage
Irrigation
Precipitation
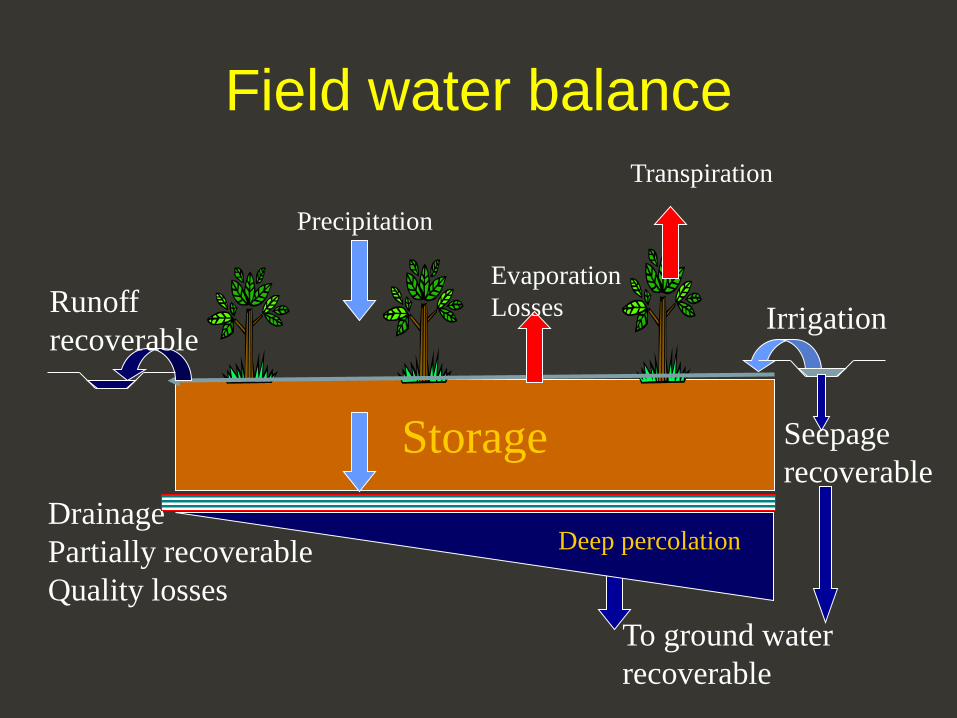
Field water balance
Runoff
Deep percolation Drainage
Seepage
Evaporation
Transpiration
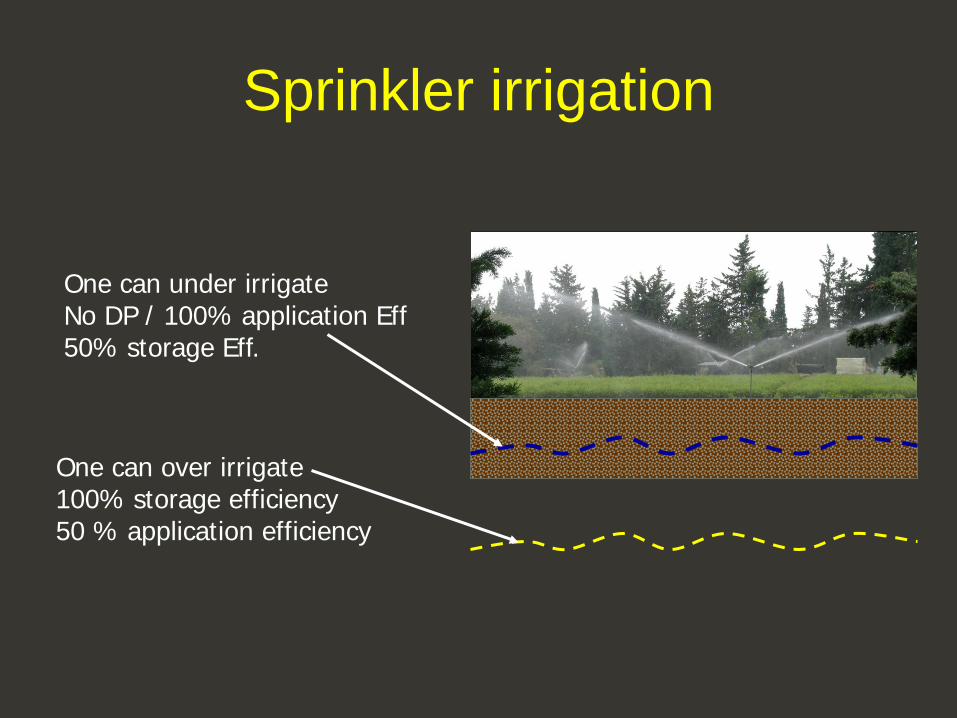
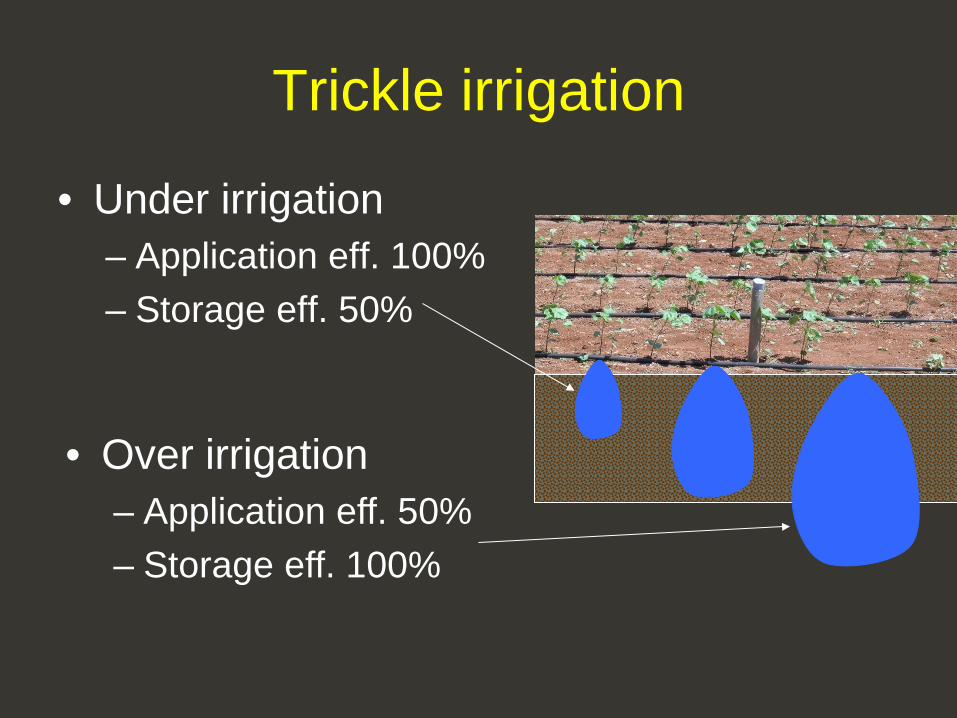
Sprinkler irrigation
One can under irrigate No DP / 100% application Eff 50% storage Eff.
One can over irrigate 100% storage efficiency 50 % application efficiency
Deep percolation Drainage Partially recoverable Quality losses
Seepage recoverable
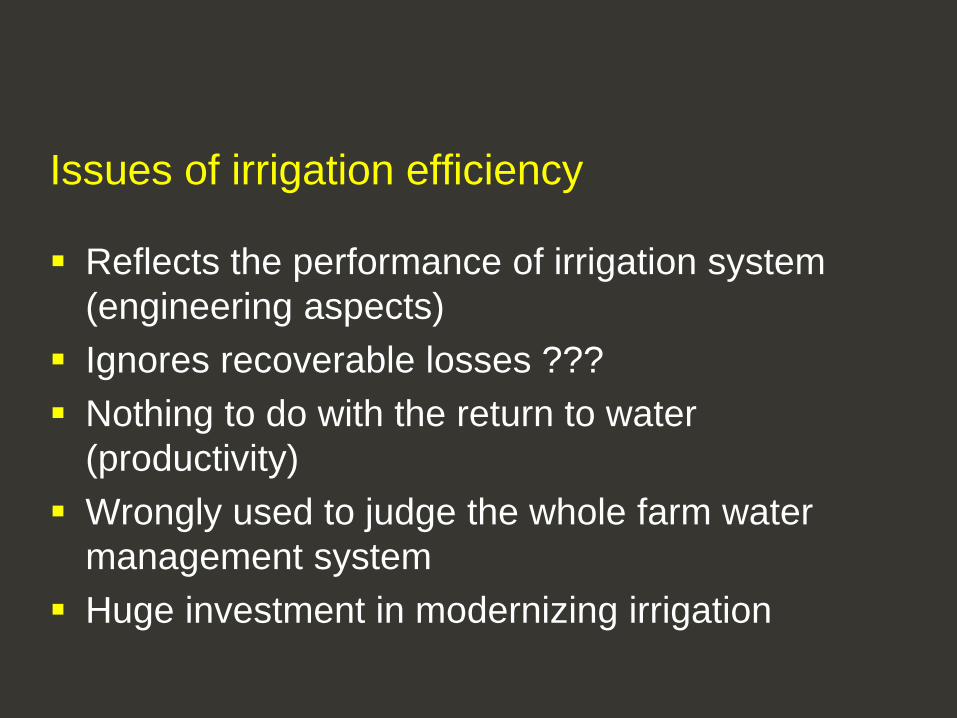
Issues of irrigation efficiency Reflects the performance of irrigation system
(engineering aspects) Ignores recoverable losses ??? Nothing to do with the return to water
(productivity) Wrongly used to judge the whole farm water
management system Huge investment in modernizing irrigation
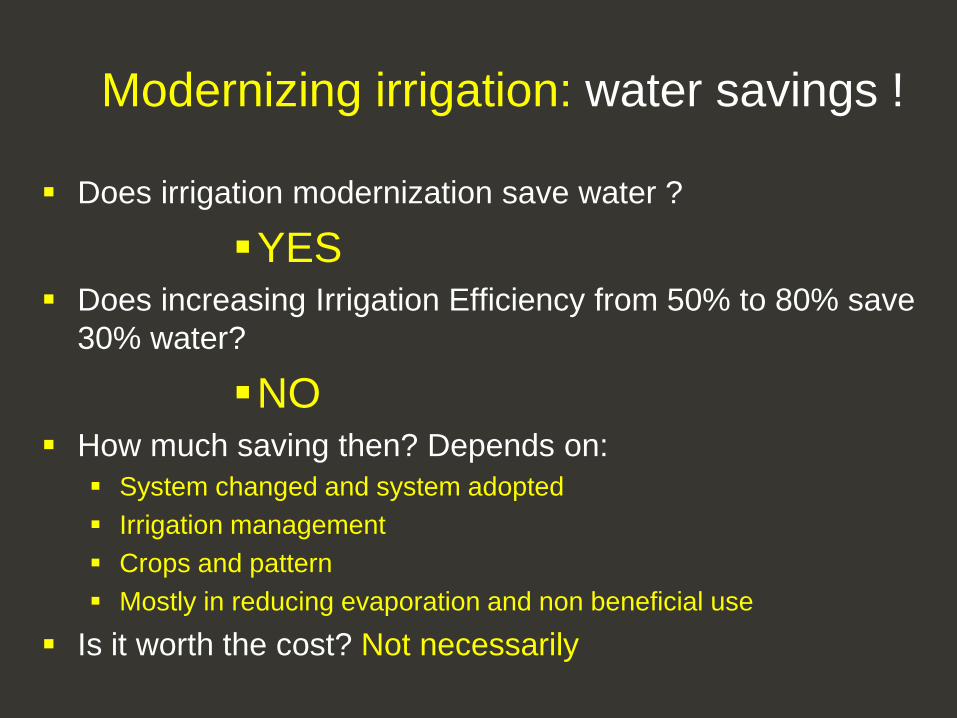
Modernizing irrigation: water savings !
Does irrigation modernization save water ?
YES Does increasing Irrigation Efficiency from 50% to 80% save
30% water?
NO How much saving then? Depends on:
System changed and system adopted Irrigation management Crops and pattern Mostly in reducing evaporation and non beneficial use
Is it worth the cost? Not necessarily
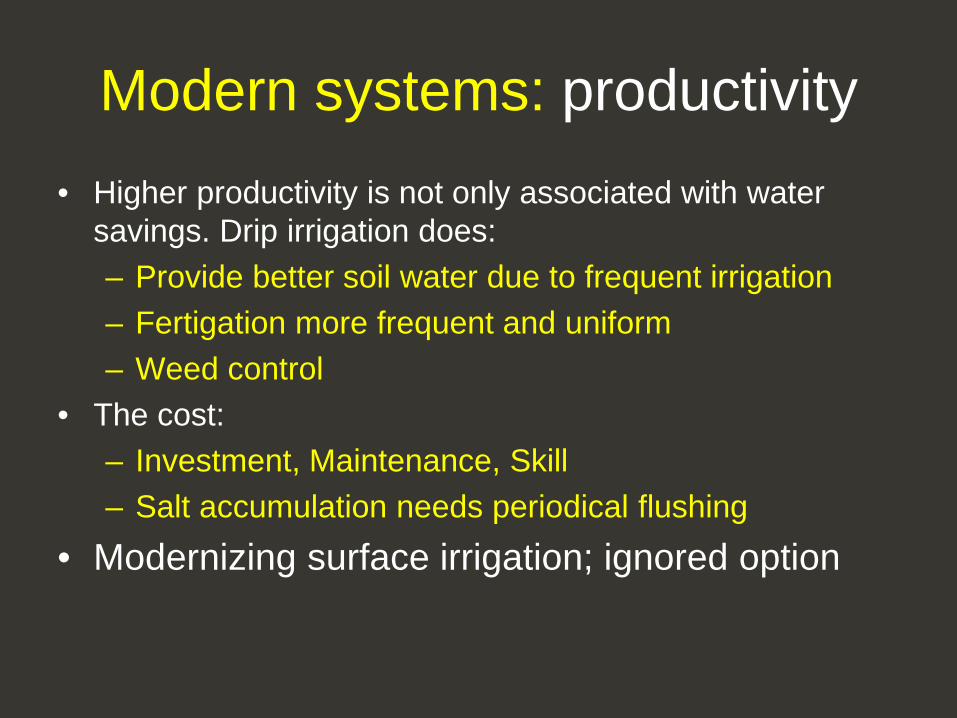
Modern systems: productivity
• Higher productivity is not only associated with water savings. Drip irrigation does: – Provide better soil water due to frequent irrigation – Fertigation more frequent and uniform – Weed control
• The cost: – Investment, Maintenance, Skill – Salt accumulation needs periodical flushing
• Modernizing surface irrigation; ignored option
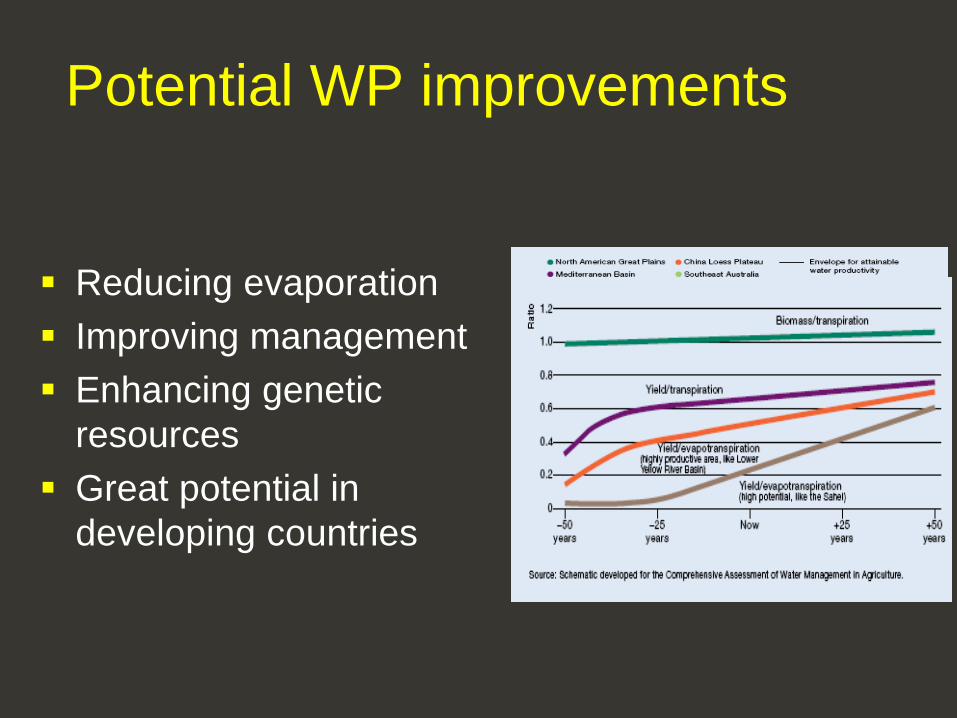
from efficiency
to productivity
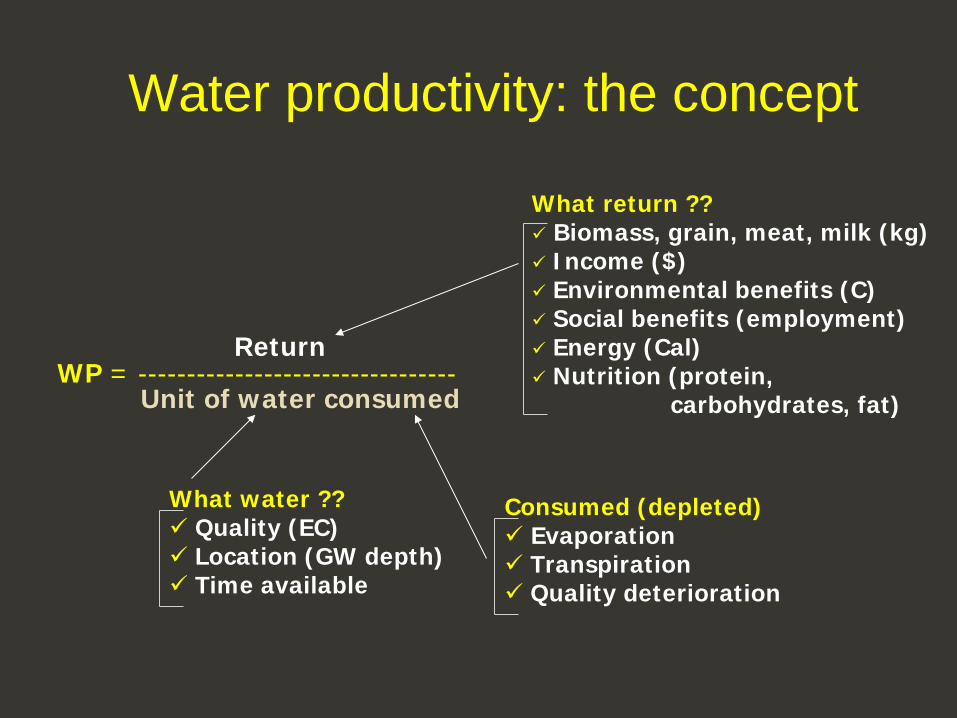
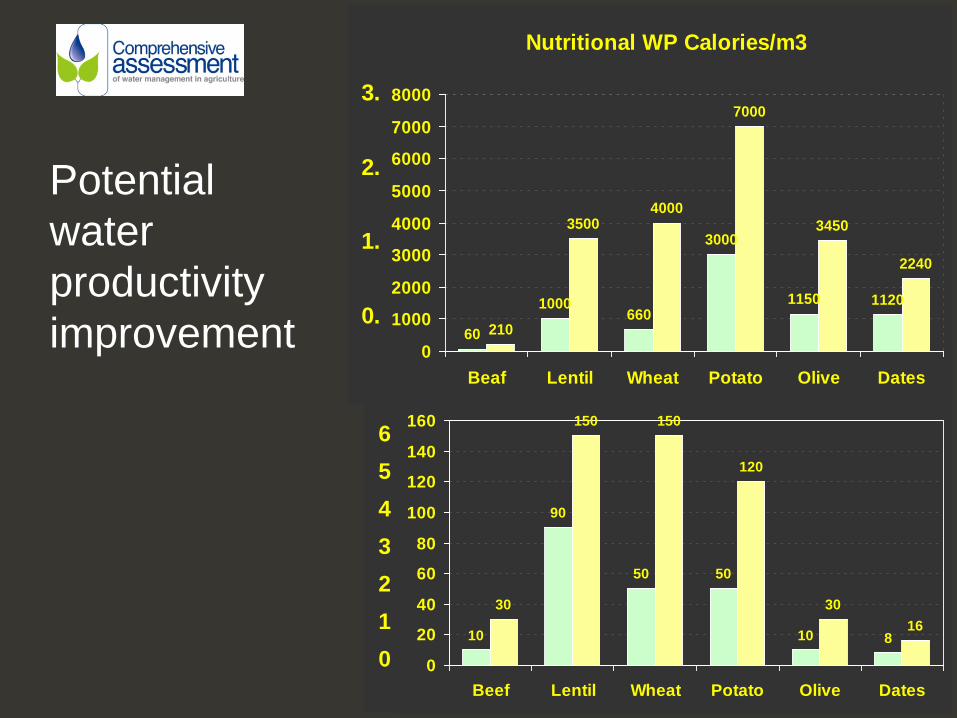
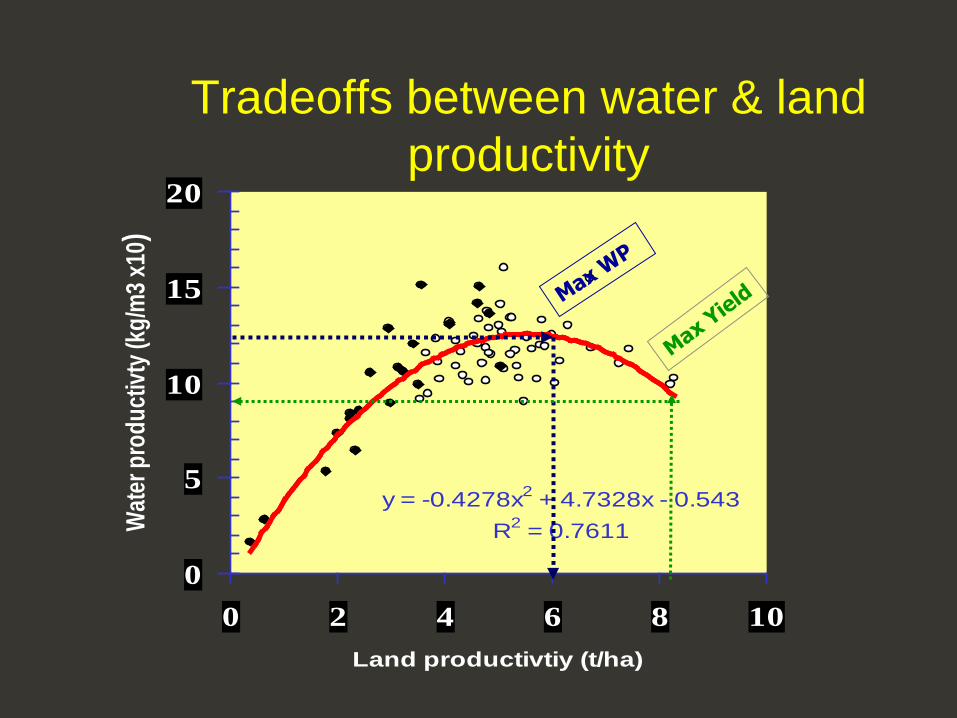
Water productivity: the concept
Return WP = --------------------------------- Unit of water consumed
What return ?? Biomass, grain, meat, milk (kg) Income ($) Environmental benefits (C) Social benefits (employment) Energy (Cal) Nutrition (protein,
carbohydrates, fat)
What water ?? Quality (EC) Location (GW depth) Time available