37
| Date post: | 23-Jan-2017 |
| Category: |
Documents |
| Upload: | mines-and-money |
| View: | 986 times |
| Download: | 0 times |


Li Yusheng Senior Analyst
Beijing Antaike Information Development

Yusheng Li
Beijing Antaike Information Development Co., Ltd.
5th December, 2012 London UK
Copper market analysis and investment climate:
Where we are in the cycle
Mines And Money London 2012

Le
ad
ing
In
form
ati
on
Pro
vid
er
an
d C
on
su
lta
nt
for
Me
tal a
nd
Min
ing
In
du
str
y
4 4
Disclaimer
This document has been prepared with care. However, Beijing Antaike Information Development Co., Ltd. (hereinafter Antaike) makes no warranty of any kind in regard to the contents and shall not be liable for incidental or consequential damages, financial or otherwise, arising out of the use of this document.
Copyright
The contents of this presentation are copyright Antaike
© 2012 Antaike
Disclaimer & Copyright
4

Le
ad
ing
In
form
ati
on
Pro
vid
er
an
d C
on
su
lta
nt
for
Me
tal a
nd
Min
ing
In
du
str
y
5 5
Outline of the presentation
1. Copper price and its driving forces
2. China’s copper supply and demand
3. Prospects for China’s copper supply/demand
4. Copper price outlook in 2013
5

Le
ad
ing
In
form
ati
on
Pro
vid
er
an
d C
on
su
lta
nt
for
Me
tal a
nd
Min
ing
In
du
str
y
1. Copper price and its driving forces
a. Copper price review
6

Le
ad
ing
In
form
ati
on
Pro
vid
er
an
d C
on
su
lta
nt
for
Me
tal a
nd
Min
ing
In
du
str
y
Copper price review
7 Data source: LME , SHFE

Le
ad
ing
In
form
ati
on
Pro
vid
er
an
d C
on
su
lta
nt
for
Me
tal a
nd
Min
ing
In
du
str
y
8 8
Sharp fluctuations in copper price over the past
decade
Copper price started to climb up from Q4, 2003 and soared
in 2006. It rose to the record high of US$8,685 per tonne on
LME and RMB85,500yuan/t on SHFE in the year. Then it
continued to surge and refreshed the highest several times.
But the upward trend came to an end in Q4, 2008, with price
falling to the low of US$2,825 per tonne on LME and
RMB22,320 yuan/t on SHFE. In Feb. 2011, the price once
again went up and reached US$10,190 per tonne on LME
and 75,660 yuan/t on SHFE.
Copper price review

Le
ad
ing
In
form
ati
on
Pro
vid
er
an
d C
on
su
lta
nt
for
Me
tal a
nd
Min
ing
In
du
str
y
1. Copper price and its driving forces
b. Factors affecting copper price
9
Le
ad
ing
In
form
ati
on
Pro
vid
er
an
d C
on
su
lta
nt
for
Me
tal a
nd
Min
ing
In
du
str
y
US dollar index
Inventory
Unpredictable events
Fundamentals: supply-demand
Factors affecting copper price
10

Le
ad
ing
In
form
ati
on
Pro
vid
er
an
d C
on
su
lta
nt
for
Me
tal a
nd
Min
ing
In
du
str
y
Copper inventory vs price
11 Data source: LME, SHFE

Le
ad
ing
In
form
ati
on
Pro
vid
er
an
d C
on
su
lta
nt
for
Me
tal a
nd
Min
ing
In
du
str
y
US dollar index vs copper price
12 Data source: LME, NYMEX

Le
ad
ing
In
form
ati
on
Pro
vid
er
an
d C
on
su
lta
nt
for
Me
tal a
nd
Min
ing
In
du
str
y
Factors affecting copper price
Events
SRB? 2006, 2009
Lehman Brothers 2008
QE1, QE2, and QE3?
Demand/supply
kt 2002 2011 CAGR
Mine copper output 13581.8 16035.5 1.86%
Refined copper output 15269.3 19650.0 2.84%
Refined copper consumption 15155.6 19888.1 3.07%
Data source: ICSG

Le
ad
ing
In
form
ati
on
Pro
vid
er
an
d C
on
su
lta
nt
for
Me
tal a
nd
Min
ing
In
du
str
y
14 14
2. China’s copper supply and demand
“China factor”
14

Le
ad
ing
In
form
ati
on
Pro
vid
er
an
d C
on
su
lta
nt
for
Me
tal a
nd
Min
ing
In
du
str
y
15
China became the biggest copper consumer in the world in
2002. From 2002 to 2011, it witnessed a CAGR of 11.8% in
copper consumption, from 2.68 million tonnes to to 7.33 million
tonnes.
During the same period, China’s copper production increased
quickly, getting to 5.20 million tonnes in 2011, with a CAGR of
13.7%, but shortage of raw materials continued to widen.
Big difference appeared between apparent and actual
consumption of refined copper from 2009, while copper scrap
supply declined.
15
“China factor”

Le
ad
ing
In
form
ati
on
Pro
vid
er
an
d C
on
su
lta
nt
for
Me
tal a
nd
Min
ing
In
du
str
y
China’s copper demand
16
Data source: China Customs, CNIA, Antaike
0
1000
2000
3000
4000
5000
6000
7000
8000
kt
2002 2003 2004 2005 2006 2007 2008 2009 2010 2011
China's refined copper consumption
Actual Apparent

Le
ad
ing
In
form
ati
on
Pro
vid
er
an
d C
on
su
lta
nt
for
Me
tal a
nd
Min
ing
In
du
str
y
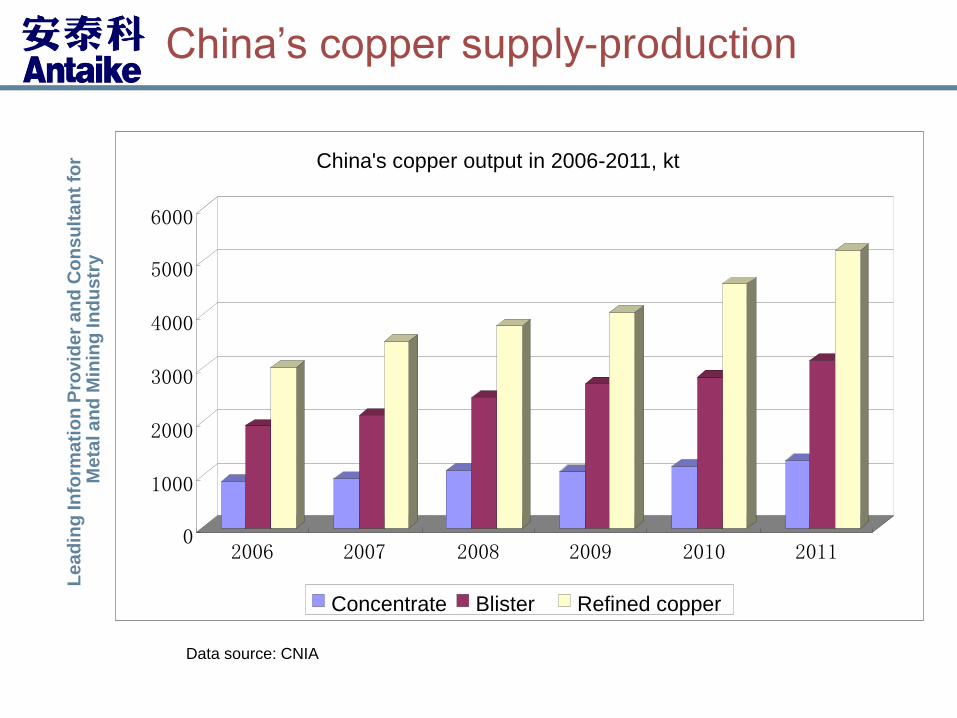
China’s copper supply-production
17
kt 2006 2007 2008 2009 2010 2011
Cu Concentrate 872.9 928.0 1076.1 1044.5 1155.8 1267.2
Copper Blister 1917.5 2111.5 2453.3 2693.9 2825.6 3136.1
Refined Copper 3003.2 3499.4 3794.6 4051.3 4573.5 5196.9
Copper semis 5324.4 6302.1 8367.1 8736.4 9851.3 10281.5
China’s copper production
Data source: CNIA
Le
ad
ing
In
form
ati
on
Pro
vid
er
an
d C
on
su
lta
nt
for
Me
tal a
nd
Min
ing
In
du
str
y
China’s copper supply-production
Data source: CNIA
0
1000
2000
3000
4000
5000
6000
2006 2007 2008 2009 2010 2011
China's copper output in 2006-2011, kt
Concentrate Blister Refined copper

Le
ad
ing
In
form
ati
on
Pro
vid
er
an
d C
on
su
lta
nt
for
Me
tal a
nd
Min
ing
In
du
str
y
China’s copper supply-import
kt 2007 2008 2009 2010 2011
Cu Concentrate 4516.2 5192.1 6130.9 6468.1 6375.5
Copper Scrap 5584.7 5576.9 3998.1 4364.3 4687.3
Copper Blister 172.8 197.6 228.1 399.0 416.3
Refined Cu (imp) 1493.7 1456.4 3185.2 2922.1 2835.4
Refined Cu (exp) 125.9 96.1 72.9 38.7 156.3
Refined Cu (net import) 1367.8 1360.3 3112.3 2883.4 2679.1
Data source: China Customs

Le
ad
ing
In
form
ati
on
Pro
vid
er
an
d C
on
su
lta
nt
for
Me
tal a
nd
Min
ing
In
du
str
y
China’s copper supply-import
Data source: China Customs
0
1000
2000
3000
4000
5000
6000
7000
2006 2007 2008 2009 2010 2011
China's copper imports in 2006-2011, kt
Concentrate Cu scrap Refined Cu Cu Blister
Le
ad
ing
In
form
ati
on
Pro
vid
er
an
d C
on
su
lta
nt
for
Me
tal a
nd
Min
ing
In
du
str
y
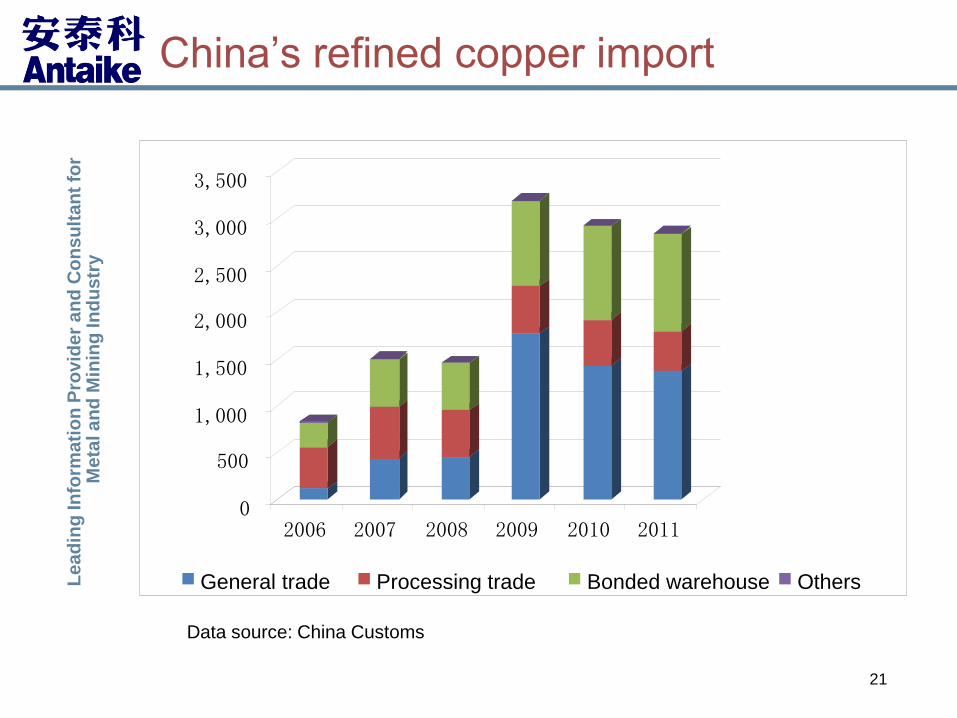
China’s refined copper import
21
kt
Data source: China Customs
0
500
1,000
1,500
2,000
2,500
3,000
3,500
2006 2007 2008 2009 2010 2011
General trade Processing trade Bonded warehouse Others

Le
ad
ing
In
form
ati
on
Pro
vid
er
an
d C
on
su
lta
nt
for
Me
tal a
nd
Min
ing
In
du
str
y
22
Copper scrap import declined significantly in 2009
SRB restocked
Copper financing-collateral for loan

Le
ad
ing
In
form
ati
on
Pro
vid
er
an
d C
on
su
lta
nt
for
Me
tal a
nd
Min
ing
In
du
str
y
23 23
3. Prospects for China’s copper supply/demand
23

Le
ad
ing
In
form
ati
on
Pro
vid
er
an
d C
on
su
lta
nt
for
Me
tal a
nd
Min
ing
In
du
str
y
24
Production, kt Jan-Sep, 2011 Jan-Sep, 2012 Y-o-Y
Cu Concentrate 919.2 1155.0 13.8%
Refined Copper 3932.6 4205.6 7.3%
Copper Semis 7572.9 8389.1 9.4%
Import & Export, kt Jan-Sep, 2011 Jan-Sep, 2012 Y-o-Y
Cu Concentrate 4633.6 5347.0 15.4%
Copper Blister 307.6 384.5 25.0%
Copper Scrap 3429.5 3551.5 3.6%
Refined Copper (imp) 1789.2 2681.9 49.9%
Refined Copper (exp) 153.6 214.8 39.8%
Net Import 1635.6 2467.1 50.8%
China copper market review
24 Data source: CNIA, China Customs
China’s Copper supply in January-September, 2012

Le
ad
ing
In
form
ati
on
Pro
vid
er
an
d C
on
su
lta
nt
for
Me
tal a
nd
Min
ing
In
du
str
y
25
Supply:
From January to September, 2012, China’s refined copper
output was 4.21 million tonnes with an increase of 7.3% y-o-y,
and net import of refined copper increased by 50.8% y-o-y to
2.47 million tonnes, and refined copper supply rose to 6.67
million tonnes with an increase of 19.8% y-o-y.
Demand:
From January to September, 2012, China’s refined copper
consumption was 5.71 million tonnes, the rate of demand
growth slowed down to 4.6 % y-o-y.

Le
ad
ing
In
form
ati
on
Pro
vid
er
an
d C
on
su
lta
nt
for
Me
tal a
nd
Min
ing
In
du
str
y
26
Major industrial product output
Data source: NBS
Le
ad
ing
In
form
ati
on
Pro
vid
er
an
d C
on
su
lta
nt
for
Me
tal a
nd
Min
ing
In
du
str
y
27
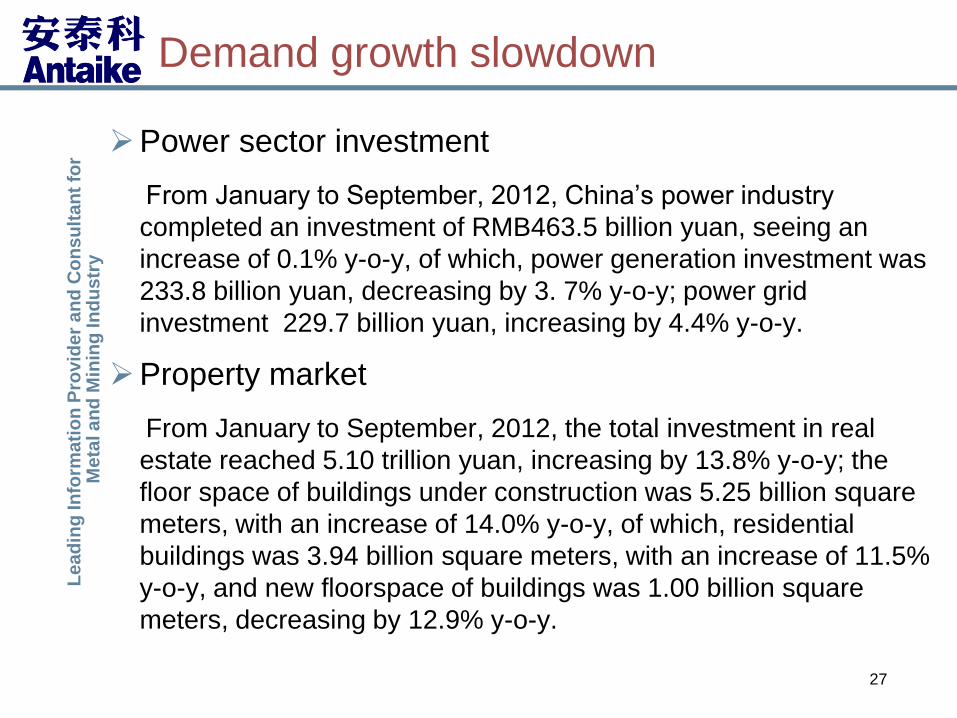
Demand growth slowdown
Power sector investment
From January to September, 2012, China’s power industry
completed an investment of RMB463.5 billion yuan, seeing an
increase of 0.1% y-o-y, of which, power generation investment was
233.8 billion yuan, decreasing by 3. 7% y-o-y; power grid
investment 229.7 billion yuan, increasing by 4.4% y-o-y.
Property market
From January to September, 2012, the total investment in real
estate reached 5.10 trillion yuan, increasing by 13.8% y-o-y; the
floor space of buildings under construction was 5.25 billion square
meters, with an increase of 14.0% y-o-y, of which, residential
buildings was 3.94 billion square meters, with an increase of 11.5%
y-o-y, and new floorspace of buildings was 1.00 billion square
meters, decreasing by 12.9% y-o-y.
Le
ad
ing
In
form
ati
on
Pro
vid
er
an
d C
on
su
lta
nt
for
Me
tal a
nd
Min
ing
In
du
str
y
28
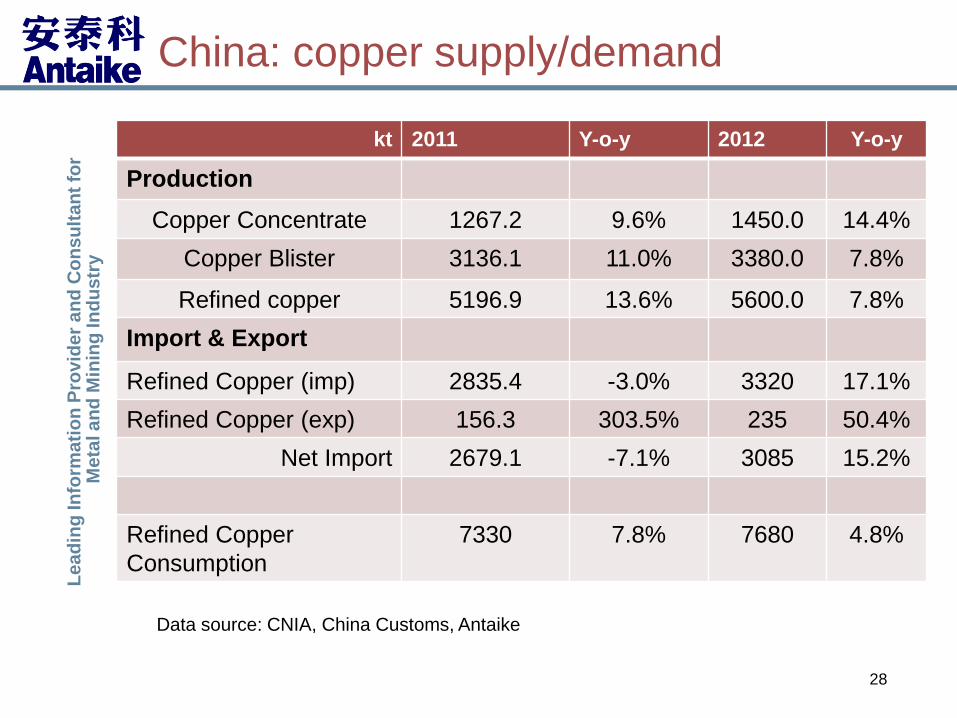
China: copper supply/demand
kt 2011 Y-o-y 2012 Y-o-y
Production
Copper Concentrate 1267.2 9.6% 1450.0 14.4%
Copper Blister 3136.1 11.0% 3380.0 7.8%
Refined copper 5196.9 13.6% 5600.0 7.8%
Import & Export
Refined Copper (imp) 2835.4 -3.0% 3320 17.1%
Refined Copper (exp) 156.3 303.5% 235 50.4%
Net Import 2679.1 -7.1% 3085 15.2%
Refined Copper
Consumption
7330 7.8% 7680 4.8%
Data source: CNIA, China Customs, Antaike

Le
ad
ing
In
form
ati
on
Pro
vid
er
an
d C
on
su
lta
nt
for
Me
tal a
nd
Min
ing
In
du
str
y
China copper supply/demand by 2015
29
mlt 2013 2014 2015
Production
Concentrates 1.55 1.64 1.74
Refined copper 6.10 6.60 7.00
Consumption
Refined copper 8.10 8.53 8.90
Balance -2.00 -1.93 -1.90
Data source: Antaike

Le
ad
ing
In
form
ati
on
Pro
vid
er
an
d C
on
su
lta
nt
for
Me
tal a
nd
Min
ing
In
du
str
y
30 30
4. Copper price outlook in 2013
30

Le
ad
ing
In
form
ati
on
Pro
vid
er
an
d C
on
su
lta
nt
for
Me
tal a
nd
Min
ing
In
du
str
y
Copper price outlook in 2013
Production: the year of 2013 will be the last year for a number of
copper smelting projects to come on-stream. It is forecasted
China’s copper smelting and refining capacity would be 5.59 Mt
and 9.76 Mt in 2013, respectively, up by 920kt and 1.4 Mt
compared to 2012. The refined copper output will be 6.1 Mt in 2013,
up by 8.9% y-o-y.
Consumption: soft demand leads to slowdown in growth of copper
consumption in China in 2012 and Chinese government released a
package of stimulus policies to encourage the real economy. The
economic environment is expected to get better in 2013 and copper
demand may rebound slightly. It is forecasted the Chinese refined
copper consumption would be 8.1 Mt in 2013, up by 5.5% y-o-y.
Balance: Chinese refined copper production would be a bit more
than that of consumption in 2013. The gap between the output and
consumption would shrink to about 2 Mt.

Le
ad
ing
In
form
ati
on
Pro
vid
er
an
d C
on
su
lta
nt
for
Me
tal a
nd
Min
ing
In
du
str
y
Copper price outlook in 2013
It is expected that global economy will recover a
little bit in 2013, but might see “uneven” between
different regions or countries. Generally speaking,
the economy is difficult to get warm quickly. In
addition, growth in demand from China will remain
moderately low, so copper price will continue to
move in a even wider range than that in 2012,
staying at about US$7,900 per tonne on average on
international market and RMB 57,500-58,000 yuan/t
in China.

Le
ad
ing
In
form
ati
on
Pro
vid
er
an
d C
on
su
lta
nt
for
Me
tal a
nd
Min
ing
In
du
str
y
Copper industry is facing the challenges from the
slowing demand conditions.
China will remain as the largest copper consuming
country and continue to be a key support to world
copper market, although the growth rate will be
slow down in next five years.
Raw material supply shortage will increase to
Chinese copper companies with their involvement
in copper mining projects overseas.
Summary
33

Le
ad
ing
In
form
ati
on
Pro
vid
er
an
d C
on
su
lta
nt
for
Me
tal a
nd
Min
ing
In
du
str
y
34 34
Thank you!
34

Le
ad
ing
In
form
ati
on
Pro
vid
er
an
d C
on
su
lta
nt
for
Me
tal a
nd
Min
ing
In
du
str
y
35 35
About Antaike
○ Regular research reports ○ Consultancy ○Metal Events
The Most Essential and Authoritative Source for Chinese Metals Market
The Leading Information Provider and Consultancy for the Global Metals and Mining
Industry
Since being established in 1992, Antaike has built a reputation for its authoritative, strategic, and in-depth analysis
of the Chinese metals industries and markets. It also provides news, trade and production data, prices and
forecast.
Working under China Nonferrous Metals Industry Association (CNIA) and directly overseen by the Information
Center of China National Nonferrous Metals Industry, Antaike has become a key center for information collection
and delivery within the country and across the world.
Antaike has a team of nearly 100 highly skilled employees, including more than 30 senior metals analysts, who
have all been involved in the metals and mining industry for over a decade. It offers customized consulting
assignments to deliver high quality and specialized advice and business intelligence.
Antaike has built up good relationship with thousands of Chinese miners, smelters, refineries, fabricators, metals
consumers and traders, as well as Chinese government departments. At the same time, it has been working with
a large number of international metals and mining corporations, associated organizations and research institutes.
It has more than 10,000 clients, both in China and abroad.
Antaike’s metal events have been attracting more and more attendees in recent years. They have become the
biggest and most informative gatherings in China and even the world, with their focus on specific metals such as
copper, aluminum, lead and zinc, nickel and cobalt, gold and silver, indium, and others.
Antaike’s motto is to supply the best services to our clients and to use our information to create business value.
35
Le
ad
ing
In
form
ati
on
Pro
vid
er
an
d C
on
su
lta
nt
for
Me
tal a
nd
Min
ing
In
du
str
y
36 36
Contact:
Yusheng Li
Beijing Antaike Information Co., Ltd.
2nd Floor, 12B Fuxing Road, Beijing 100814, CHINA
Tel:+86 10 6396 5357
Fax: +86 10 6397 1647
Email:[email protected]
website:www.antaike.com


