T HEMATICR ESEARCHOctober 11, 2010 GOLD/COPPER DEPOSITS"The New Darlings"The purpose of this report is to review the major gold/copper deposits around the world as these assets have become "in vogue." Gold companies are looking to acquire these types of deposits as they provide exposure to gold (and significant size to reserves and resources), add to mine life as they generally have longer mine lives than gold only projects, and also come with low cash costs (especially if by-product accounting is used with copperrevenue deducted from the operating costs). Furthermore, these types ofdeposits provide gold companies with some commodity diversification. Turning to these gold/copper deposits, it is important to first highlight that the majority are located in Chile, Canada, Australasia and Asia. A closer look at these deposits shows that their average gold production is in excess of350,000 oz, with copper production averaging 300 mln pounds per annum. Operating costs are generally under $400/oz for gold (GFMS global cash cost is currently at $535/oz) or under $0.85/lb for copper. Mine lives of these deposits are usually greater than 20 years. Capital costs to build these assets are extensive, commonly more than $2 billion. These significant deposits are lower grade in nature, with the average gold grade under 0.5 g/t gold (1.3 g/t gold equivalent) and copper under 0.5% forreserves. Looking at the ratio of the gold value to copper value (at current metal prices of $1,300/oz and $3.50/lb copper), the average for these deposits is 0.71x for reserves and 0.67x for resources. The top five senior producers have stated that part of their growth strategy includes acquiring or adding further exposure to gold/copper deposits. These companies have already been active in acquiring exposure to these types ofdeposits. In general, purchase prices have been about $45/oz for gold equivalent reserves and $25/oz for gold equivalent resources in 2010 (based on gold/copper prices at the time of acquisition announcement). This report focuses on the technical/geological characteristics of these deposits; however, location, infrastructure support, political jurisdictions and environmental permitting are also important in determining the ultimate economic value of these deposits. All dollar amounts in US$ unless otherwise noted. Industry Rating (Precious Metals): Overweight (NBF Economics & Strategy Group) Tanya Jakusconek, M.Sc. Applied 416.869.6766 [email protected]Associate: Joanne van Ballegooi e 416.869. 6767 joanne.vanballegooie@nbf inancial.com Associate: Christopher Martino 416.869.6517 christo pher.martino@nbfinancial.com Associate: Greg Chu, CFA 416.869.8042 greg.chu@nbfinanc ial.com
The purpose of this report is to review the major gold/copper deposits
around the world as these assets have become "in vogue." Gold companies
are looking to acquire these types of deposits as they provide exposure to
gold (and significant size to reserves and resources), add to mine life as
they generally have longer mine lives than gold only projects, and also come
with low cash costs (especially if by-product accounting is used with coppe
revenue deducted from the operating costs). Furthermore, these types of
deposits provide gold companies with some commodity diversification.
Turning to these gold/copper deposits, it is important to first highlight that themajority are located in Chile, Canada, Australasia and Asia. A closer look a
these deposits shows that their average gold production is in excess of
350,000 oz, with copper production averaging 300 mln pounds per annum
Operating costs are generally under $400/oz for gold (GFMS global cash
cost is currently at $535/oz) or under $0.85/lb for copper. Mine lives of these
deposits are usually greater than 20 years. Capital costs to build these
assets are extensive, commonly more than $2 billion.
These significant deposits are lower grade in nature, with the average gold
grade under 0.5 g/t gold (1.3 g/t gold equivalent) and copper under 0.5% fo
reserves. Looking at the ratio of the gold value to copper value (at current
metal prices of $1,300/oz and $3.50/lb copper), the average for these
deposits is 0.71x for reserves and 0.67x for resources.
The top five senior producers have stated that part of their growth strategy
includes acquiring or adding further exposure to gold/copper deposits. These
companies have already been active in acquiring exposure to these types o
deposits. In general, purchase prices have been about $45/oz for gold
equivalent reserves and $25/oz for gold equivalent resources in 2010 (based
on gold/copper prices at the time of acquisition announcement).
This report focuses on the technical/geological characteristics of these
deposits; however, location, infrastructure support, political jurisdictions and
environmental permitting are also important in determining the ultimate
economic value of these deposits.
All dollar amounts in US$ unless otherwise noted.Industry Rating (Precious Metals): Overweight (NBF Economics & Strategy Group)
GOLD/COPPER DEPOSITS "THE NEW DARLINGS" OCTOBER 11, 2010
TANYA JAKUSCONEK 3
THE LATEST PURCHASES
The main senior producers have stated that part of their growth strategy includes acquiring
or adding further exposure to gold/copper deposits. These include Barrick, Goldcorp,
Newmont, Gold Fields and AngloGold Ashanti.
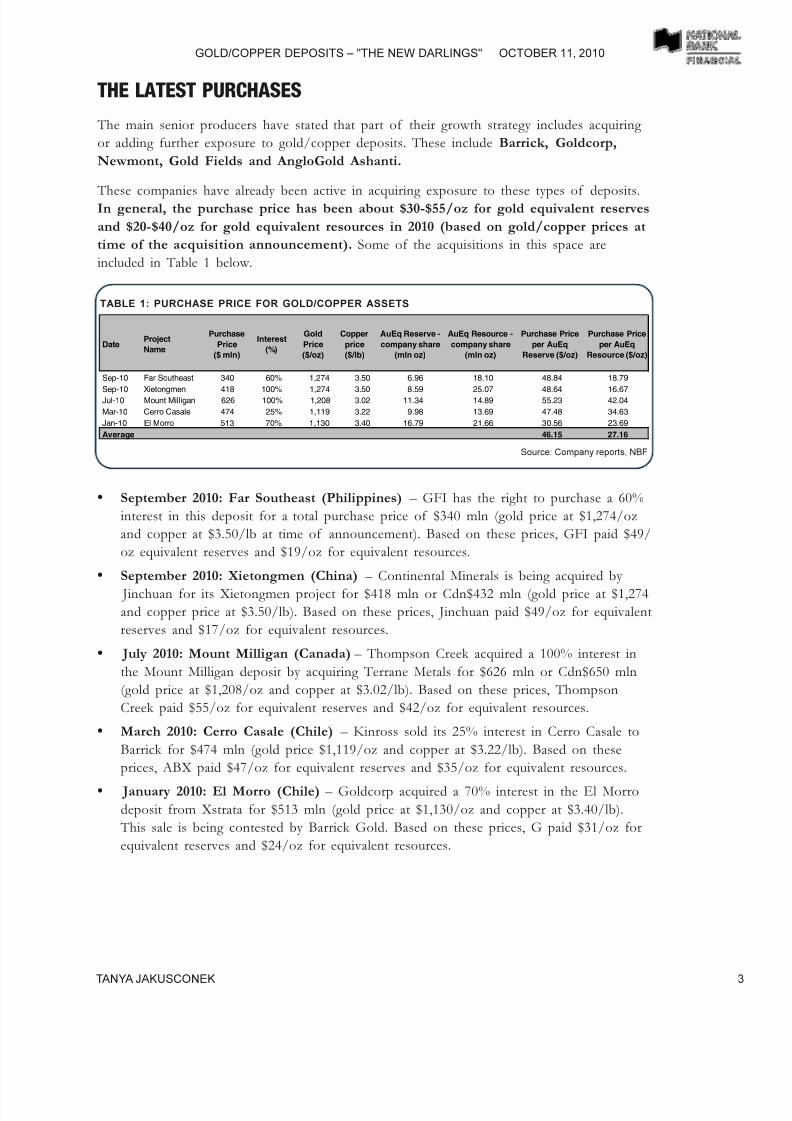
These companies have already been active in acquiring exposure to these types of deposits.In general, the purchase price has been about $30-$55/oz for gold equivalent reserves
and $20-$40/oz for gold equivalent resources in 2010 (based on gold/copper prices at
time of the acquisition announcement). Some of the acquisitions in this space are
included in Table 1 below.
September 2010: Far Southeast (Philippines) GFI has the right to purchase a 60%
interest in this deposit for a total purchase price of $340 mln (gold price at $1,274/oz
and copper at $3.50/lb at time of announcement). Based on these prices, GFI paid $49/
oz equivalent reserves and $19/oz for equivalent resources.
September 2010: Xietongmen (China) Continental Minerals is being acquired by
Jinchuan for its Xietongmen project for $418 mln or Cdn$432 mln (gold price at $1,274and copper price at $3.50/lb). Based on these prices, Jinchuan paid $49/oz for equivalent
reserves and $17/oz for equivalent resources.
July 2010: Mount Milligan (Canada) Thompson Creek acquired a 100% interest in
the Mount Milligan deposit by acquiring Terrane Metals for $626 mln or Cdn$650 mln
(gold price at $1,208/oz and copper at $3.02/lb). Based on these prices, Thompson
Creek paid $55/oz for equivalent reserves and $42/oz for equivalent resources.
March 2010: Cerro Casale (Chile) Kinross sold its 25% interest in Cerro Casale to
Barrick for $474 mln (gold price $1,119/oz and copper at $3.22/lb). Based on these
prices, ABX paid $47/oz for equivalent reserves and $35/oz for equivalent resources.
January 2010: El Morro (Chile) Goldcorp acquired a 70% interest in the El Morro
deposit from Xstrata for $513 mln (gold price at $1,130/oz and copper at $3.40/lb).
This sale is being contested by Barrick Gold. Based on these prices, G paid $31/oz for
equivalent reserves and $24/oz for equivalent resources.
GOLD/COPPER DEPOSITS "THE NEW DARLINGS" OCTOBER 11, 2010
TANYA JAKUSCONEK 6
WHAT TO LOOK FOR…
On the following pages, we have charted various important characteristics of these gold/
copper deposits that gold companies are likely to focus on when considering acquisition
targets. This includes gold and gold equivalent reserves, overall resources, grade, capital per
ounce to build and gold content value versus copper value. Location, of course, is another
criterion as both political risk (although individual companies hold varying views on politicalrisk and their own political risk profiles) and infrastructure availability play a role.
Environmental permitting is also another parameter of importance when considering the
ultimate economics of a project, but it is hard to quantify. The following can be highlighted:
Based on proven and probable gold reserves, Grasberg stands out as having the largest
gold reserves at more than 70 mln oz. KSM is second at just over 30 mln oz and Cerro
Casale third at more than 20 mln oz.
Based on gold equivalent reserves, Grasberg again stands out with reserves over 200 mln
oz gold. Sarcheshmeh and Los Pelambres have over 50 mln oz of gold equivalent.
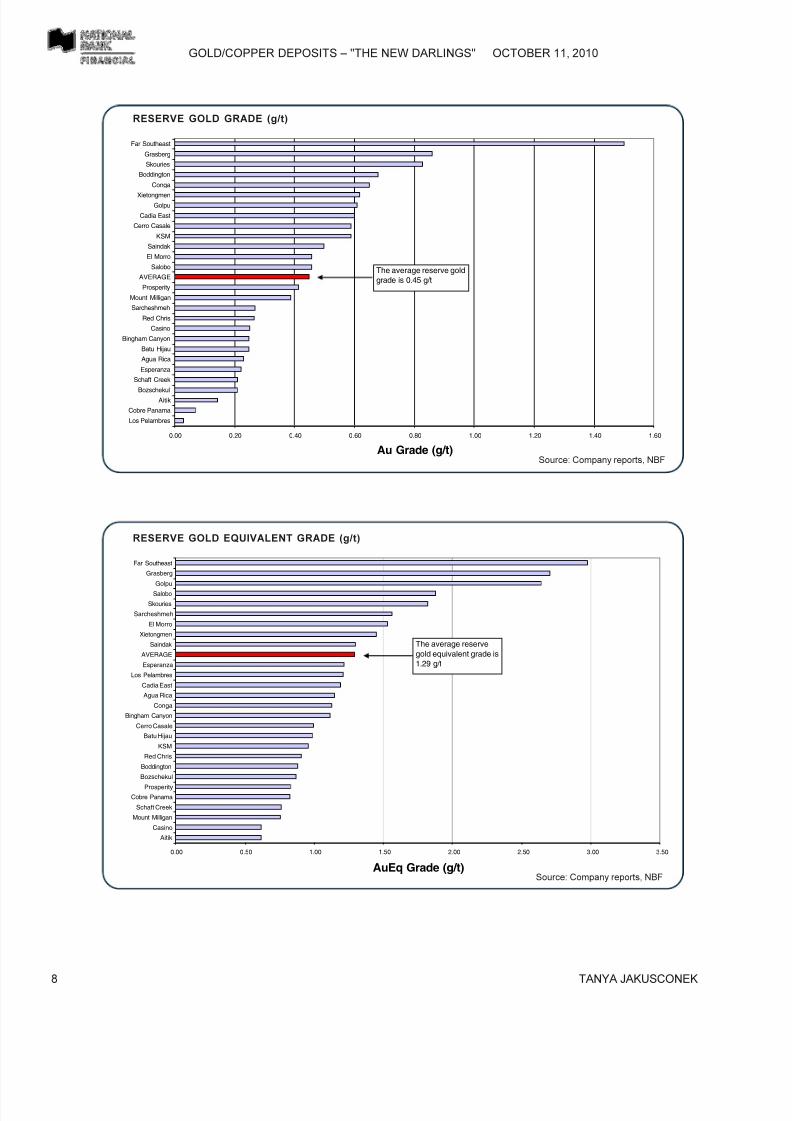
Reserve gold grade shows the Far Southeast Project having the highest grade at about
1.5 g/t and Grasberg at 0.86 g/t. The average reserve gold grade is about 0.45 g/t.
Gold equivalent reserve grade shows the Far Southeast having the highest grade at
almost 3.0 g/t. Grasberg is second at 2.7 g/t. The average gold equivalent grade is 1.29
g/t.
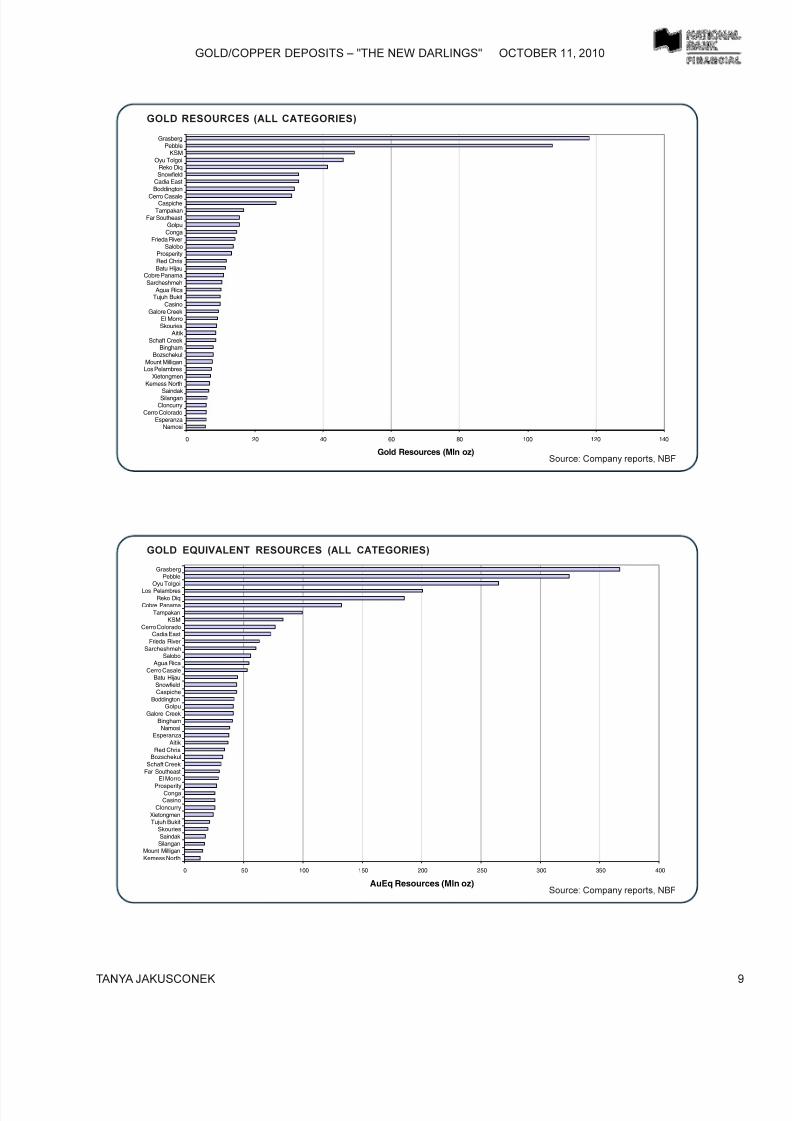
Based on overall gold resources (2P, M&I and Inferred), Grasberg again stands out
having the largest gold resources followed by Pebble and KSM.
Based on overall gold equivalent resources (2P, M&I and Inferred), Grasberg is the
largest, followed by Pebble and Oyu Tolgoi.
Resource gold grade shows the Far Southeast project at over 1.6 g/t and Silangan and
Skouries at just over 0.80 g/t. The average resource gold grade is about 0.39 g/t. Gold equivalent resource grade shows the Far Southeast deposit at over 3.0 g/t with the
Silangan deposit the second highest at about 2.36 g/t. The average gold equivalent grade
is about 1.19 g/t.
Looking at the ratio of gold value to copper value in reserves, Boddington stands out at
3.35x, followed by KSM and Cerro Casale. The average gold to copper ratio average is
about 0.71x.
Looking at the ratio of gold value to copper value in the total resource, Boddington
stands out at 3.17x, followed by Snowfield and Caspiche. The average gold to copper
ratio average being about 0.67x.
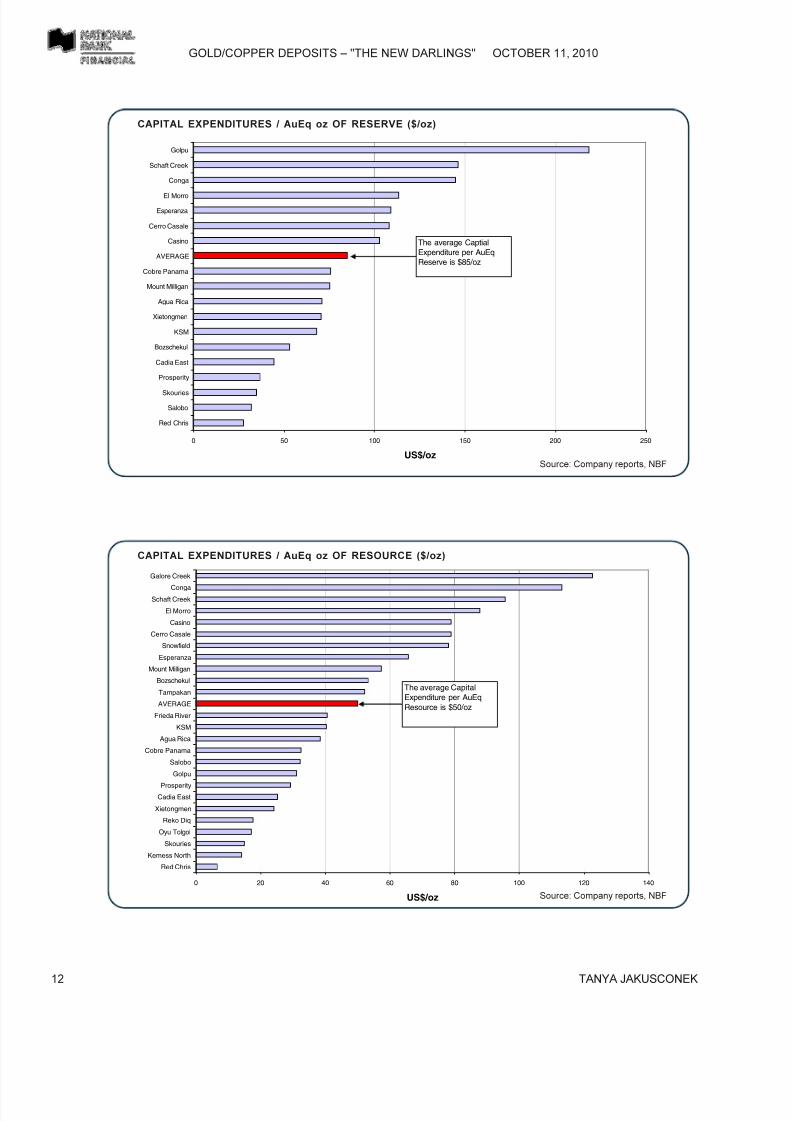
Looking at the initial capital cost to build a project, the average is about $85/oz gold
equivalent reserve. The highest development cost per equivalent ounce is Golpu, followed
by Schaft Creek.
Looking at the initial capital cost to build a project, the average is about $50/oz gold
equivalent resource. The highest development cost per equivalent ounce is Galore Creek,
GOLD/COPPER DEPOSITS "THE NEW DARLINGS" OCTOBER 11, 2010
TANYA JAKUSCONEK 13
CONCLUSION
Many of the senior producers have stated that part of their growth strategy includes
acquiring or adding further exposure to gold/copper deposits. From our analysis the
following can be noted:
Size:Gold companies want large gold reserves and resources.
Target is over 5 mln oz
gold equivalent with the average content value of gold higher than copper.
Grade: Average gold reserve grade in these deposits are 0.45 g/t and about 1.29 g/t
equivalent. On the resource front, it is 0.39 g/t and 1.19 g/t, respectively. We believe
companies are looking at grades above 0.5 g/t on a reserve basis.
Capital Cost: Capital to build these deposits is extensive, generally more than $2 billion.
We think a minimum cost target of at least $100/oz equivalent reserve is required
to build a project.
Acquisition Cost: In this environment, about $45/oz for gold equivalent reserves
is being paid for these assets. Intangible factors are hard to quantify: These include political risk (different
companies have different risk profiles based on the jurisdiction in which they operate).
In general, deposits in Canada, Chile and Australia bode well on the political risk front.
Permitting represents another factor with various deposits facing permitting challenges.
Finally, infrastructure and regional challenges are other factors that individual companies
will need to assess.
In short; the following projects stand out:
Grasberg (Freeport McMoRan Copper & Gold) stands out as one of the worlds
largest gold/copper deposits. Although it contains a lot of gold, its value is greater incopper.
Pebble (Northern Dynasty), KSM (Seabridge) and Oyu Tolgoi (Ivanhoe) deposits
stand out with significant resources. However, the gold equivalent resource grades are
below average for Pebble and KSM. Oyu Tolgoi has more copper value than gold (Rio
Tinto owns about 34% of Ivanhoe). Rio Tinto also owns almost 20% of Northern
Dynasty (Pebble Project).
Overall, the Skouries deposit (European Goldfields) shows well in grade and value of
gold versus copper; and it is of a large size at over 8 mln oz gold equivalent.
Of note, Mount Milligan (Thompson Creek) and Prosperity (Taseko Mines) haveboth sold gold streams to Royal Gold and Franco-Nevada, respectively. As a result they
are less likely to be of interest to gold companies.
Agua Rica (Yamana Gold) has made public statements that it would like to surface
value in its Agua Rica gold/copper project in Argentina. It is open for joint venturing,
sale or partial sale of the asset.
With the recent acquisition of Red Back by Kinross, we believe Kinross will likely sell
its remaining 25% interest in Cerro Casale (joint venture ABX). The likely buyer is
GOLD/COPPER DEPOSITS "THE NEW DARLINGS" OCTOBER 11, 2010
TANYA JAKUSCONEK 15
DISCLOSURES
Ratings And What They Mean:
PRIMARY STOCK RATING: NBF has a three-tiered rating system that is relative to the coverage universe of the particular analyst.
Here is a brief description of each: Outperform The stock is expected to outperform the analysts coverage universe over the next
12 months;
Sector Perform The stock is projected to perform in line with the sector over the next 12 months; Underperform The stock is
expected to underperform the sector over the next 12 months.
SECONDARY STOCK RATING: Under Review - Our analyst has withdrawn the rating because of insufficient information and is
awaiting more information and/or clarification; Tender - Our analyst is recommending that investors tender to a specific offering for
the companys stock; Restricted - Because of ongoing investment banking transactions or because of other circumstances, NBF
policy and/or laws or regulations preclude our analyst from rating a companys stock.
INDUSTRY RATING: NBF has an Industry Weighting system that reflects the view of our Economics & Strategy Group, using itssector rotation strategy. The three tiered system rates industries as Overweight, Market Weight and Underweight, depending on the
sectors projected performance against broader market averages over the next 12 months.
RISK RATING: NBF utilizes a four-tiered risk rating system, Low, Average, Above Average and Speculative. The system attempts to
evaluate risk against the overall market. In addition to sector-specific criteria, analysts also utilize quantitative and qualitative criteria
in choosing a rating. The criteria include predictability of financial results, share price volatility, credit ratings, share liquidity and
balance sheet quality.
General
National Bank Financial (NBF) is an indirect wholly owned subsidiary of National Bank of Canada. National Bank of Canada is a
public company listed on Canadian stock exchanges.
The particulars contained herein were obtained from sources which we believe to be reliable but are not guaranteed by us and may
be incomplete. The opinions expressed are based upon our analysis and interpretation of these particulars and are not to beconstrued as a solicitation or offer to buy or sell the securities mentioned herein .
Research Analysts
The Research Analyst(s) who prepare these reports certify that their respective report accurately reflects his or her personal opinion
and that no part of h is/her compensation was, is, or will be directly or indirectly related to the specific recommendations or views as
to the securities or companies.
NBF compensates its Research Analysts from a variety of sources. The Research Department is a cost centre and is funded by the
business activities of NBF including, Institutional Equity Sales and Trading, Retail Sales, the correspondent clearing business, and
Corporate and Investment Banking. Since the revenues from these businesses vary, the funds for research compensation vary. Noone-business line has a greater influence than any other for Research Analyst compensation.
Canadian Residents
In respect of the distribution of this report in Canada, NBF accepts responsibility for its contents. To make further inquiry related to
this report, Canadian residents should contact their NBF professional representative. To effect any transaction, Canadian residents
should contact their NBF Investment advisor.
U.S. ResidentsNBF Securities (USA) Corp., an affiliate of NBF, accepts responsibility for the contents of this report, subject to any terms set out
above. Any U.S. person wishing to effect transactions in any security discussed herein should do so only through NBF Securities(USA) Corp.
UK Residents
In respect of the distribution of this report to UK residents, NBF has approved this financial promotion for the purposes of Section21(1) of the Financial Services and Markets Act 2000. NBF and/or its parent and/or any companies within or affiliates of the National
Bank of Canada group and/or any of their directors, officers and employees may have or may have had interests or long or short
positions in, and may at any time make purchases and/or sales as principal or agent, or may act or may have acted as market
maker in the relevant securities or related financial instruments discussed in this report, or may act or have acted as investment
and/or commercial banker with respect thereto. The value of investments can go down as well as up. Past performance will not
necessarily be repeated in the future. The investments contained in this report are not available to private customers. This report
does not constitute or form part o f any offer for sale or subscription of or solicitation of any offer to buy or subscribe for the securities
described herein nor shall it or any part of it form the basis of or be relied on in connection with any contract or commitment
whatsoever.
This information is only for distribution to non-private customers in the United Kingdom within the meaning of the rules of the
Regulated by the Financial Services Authority.
Copyright
This report may not be reproduced in whole or in part, or further distributed or publ ished or referred to in any manner whatsoever,
nor may the information, opinions or conclusions contained in it be referred to without in each case the prior express written consentof National Bank Financial.
NBF is a member of CIPF
NBF quarterly ratings summary and the total ratings by month can be found on our website under Research and Analysis/
The NBF Research Dissemination Policy is available on our website under Legal/Research Policy (link attached) http://www.nbcn.ca/cmst/site/index.jhtml?navid=712&templateid=243
GOLD/COPPER DEPOSITS "THE NEW DARLINGS" OCTOBER 11, 2010
TANYA JAKUSCONEK 16
ADDITIONAL COMPANY RELATED DISCLOSURES
If a company specific disclosure is not found herein for a listed company, NBF at this time does not provide research coverage
or stock rating for the company in question
CG
In the past 12 months NBF acted as financial advisor, fiscal agent, or underwriter to the company that is the subject of this report andreceived remuneration for its services.
NBF is an indirect wholly owned subsidiary of the National Bank of Canada. From time to time the National Bank of Canada may enter into lending or financia l arrangements with companies that are the subject of NBF Research Reports. At the date of this report, National
Bank of Canada is not a lender to the company which is the subject of this report.
NBF and/or its Affiliates may have a position in the securities mentioned herein and may make purchases and/or sales of these securities
from time to time in the open market or otherwise. On the last day of the month preceding the date of this report, NBF and its Affiliates
held in the aggregate less than 1% of the outstanding shares (of any class of equity securities) of this issuer.
NBF is a Registered Trader on the Toronto Stock Exchange for the company that is the subject of this report. (1)
RGL
In the past 12 months NBF acted as financial advisor, fiscal agent, or underwriter to the company that is the subject of this report and
received remuneration for its services.
NBF is an indirect wholly owned subsidiary of the National Bank of Canada. From time to time the National Bank of Canada may enter
into lending or financia l arrangements with companies that are the subject of NBF Research Reports. At the date of this report, National
Bank of Canada is not a lender to the company which is the subject of this report.
NBF and/or its Affiliates may have a position in the securities mentioned herein and may make purchases and/or sales of these securities
from time to time in the open market or otherwise. On the last day of the month preceding the date of this report, NBF and its Affiliatesheld in the aggregate less than 1% of the outstanding shares (of any class of equity securities) of this issuer. (2)
AEM, FNV
In the past 12 months NBF has not acted as financial advisor, fiscal agent or underwriter for the company that is the subject of this report.
NBF may act in such a capacity in the future and receive, or expect to receive, compensation for such activities. NBF is an indirect wholly
owned subsidiary of the National Bank of Canada. From time to time the National Bank of Canada may enter into lending or financialarrangements with companies that are the subject of NBF Research Reports. At the date of this report, National Bank of Canada is a
lender to the company which is the subject of this report.
NBF and/or its Affiliates may have a position in the securities mentioned herein and may make purchases and/or sales of these securities
from time to time in the open market or otherwise. On the last day of the month preceding the date of this report, NBF and its Affiliates
held in the aggregate less than 1% of the outstanding shares (of any class of equity securities) of this issuer. (14)
LGG
In the past 12 months NBF has not acted as financial advisor, fiscal agent or underwriter for the company that is the subject of this report.
NBF may act in such a capacity in the future and receive, or expect to receive, compensation for such activities. NBF is an indirect wholly
owned subsidiary of the National Bank of Canada. From time to time the National Bank of Canada may enter into lending or financial
arrangements with companies that are the subject of NBF Research Reports. At the date of this report, National Bank of Canada is not a
lender to the company which is the subject of this report.
NBF and/or its Affiliates may have a position in the securities mentioned herein and may make purchases and/or sales of these securities
from time to time in the open market or otherwise. On the last day of the month preceding the date of this report, NBF and its Affiliates
held in the aggregate less than 1% of the outstanding shares (of any class of equity securities) of this issuer.
NBF is a Registered Trader on the Toronto Stock Exchange for the company that is the subject of this report. (9)
GOLD,HW, ELD, IMG, RBI, YRI
In the past 12 months NBF has not acted as financial advisor, fiscal agent or underwriter for the company that is the subject of this report.
NBF may act in such a capacity in the future and receive, or expect to receive, compensation for such activities. NBF is an indirect wholly
owned subsidiary of the National Bank of Canada. From time to time the National Bank of Canada may enter into lending or financial
arrangements with companies that are the subject of NBF Research Reports. At the date of this report, National Bank of Canada is not a
lender to the company which is the subject of this report.
NBF and/or its Affiliates may have a position in the securities mentioned herein and may make purchases and/or sales of these securities
from time to time in the open market or otherwise. On the last day of the month preceding the date of this report, NBF and its Affiliates
held in the aggregate less than 1% of the outstanding shares (of any class of equity securities) of this issuer. (10)
National Bank Financial (the Firm) is an indirect wholly owned subsidiary of National Bank of Canada.The particulars contained herein were obtained from sources which we believe reliable but are not guaranteed by us and may be incomplete. The opinions expressed are based upon our analysis andinterpretation of these particulars and are not to be construed as a solicitation or off er to buy or sell t he securities mentioned herein. The Firm may act as financial advisor, fiscal agent or underwriterfor certain of the companies mentioned herein and may receive a remuneration for its services. The Firm and/or its officers, directors, representatives, associates, may have a position in the securitiesmentioned herein and may make purchases and/or sales of these securities from time to time in the open market or otherwise.To U.S. residents: NBF Securities (USA) Corp., an affiliate of the Firm, accepts responsibility for the contents of this report, subject to any terms set out above. Any U.S. person wishing to effecttransactions in any security discussed herein should do so only through NBF Securities (USA) Corp.This report may not be reproduced in whole or in part, or further distributed or published or referred to in any manner whatsoever nor may the information, opinions or conclusions contained in it bereferred to without in each case the prior express consent of National Bank Financial.
Oil and GasGrant Hofer 403.290.5436 Associate: Dale Lewko 403.290.5446
Dan Payne 403.290.5441
Matthew Taylor 403.290.5625
Oil and Gas Intermediates/TrustsMenal Patel 403.290.5622 Associate: Jeremy McCrea 403.290.5627 Associate: Gilbert Bong 403.290.5624
FERTILIZERS
Hari Sambasivam 416.869.7801 Associate: Jing Feng 416.869.6515
FINANCIAL SERVICES
Banking & InsurancePeter Routledge 416.869.7442 Associate: Grant Connor 416.869.6420
North Bay680 Cassells Street, Suite 101North Bay ON P1B 4A2705.476.6360
Oak Bay211-2186 Avenue Oak BayVictoria BC V8R 1G3250.953.8400
OttawaMetLife Centre50 OConnor StreetSuite 1602Ottawa ON K1P 6L2613.236.0103
360 Albert Street,Suite 1020Ottawa ON K1R 7X7613.235.3303
Penticton305 - 399, Main StreetCity Center BuildingPenticton BC V2A 5B7250.487.2600
Pointe-Claire1, rue Holiday, Tour estBureau 145Pointe-Claire QC H9R 5N3514.426.2522
Portage La Prairie2 - 602, Saskatchewan Ave E.Portage la Prairie MB R1N 0K5204.857.4749
Québec900, boul. René Lévesque estBureau 640Québec QC G1R 2B5418.649.2525
5500, boul. des Galeries,bureau 105Québec QC G2K 2E2418.627.5777
Québec - Everest2875, boul. Laurier Bureau A 515Québec QC G1V 2M2418.651.0680
Repentigny534, rue Notre-DameBureau 201Repentigny QC J6A 2T8450.582.7001
Rimouski180, rue des GouverneursBureau 004Rimouski QC G5L 8GL418.721.6767
Rivière-du-Loup10, rue BeaubienRivière-du-Loup QCG5R 1H7418.867.7900
Saskatoon410-22nd Street EastSuite 420Saskatoon SK S7K 5T6306.683.1400
Sherbrooke455, rue King ouestBureau 600Sherbrooke QC J1H 6E9819.566.7212
Sidney2537, Beacon Ave. Suite 205Sidney BC V8L 1Y3
250.657.2200Sorel26, Pl. Charles-de-MontmagnySorel QC J3P 7E3450.743.8474
St-Bruno1307, rue RobervalSt-Bruno QC J3V 5J1(450) 441-3300
St-Hyacinthe1355, rue Johnson Ouest, Ste 4100St-Hyacinthe QC J2S 8W7450.774.5354
Ste-FoyPlace de la Cité2600, boulevard Laurier, Ste 700Ste-Foy QC G1V 4W2418.654.2323
St-Lambert - Everest594, rue Victoria, 1er étageSt-Lambert QC J4P 2J6450.465.1393
St-Sauveur-des-Monts11, rue Robert,St-Sauveur-des-Monts QC J0R 1R6450.227.2777
Steinbach102-344 Main StreetSteinbach MB R5G 1Z1204.320.9536
Sudbury10 Elm Street, 5th Floor Sudbury ON P3C 1S8705.671.1160
TorontoThe Exchange Tower 130 King St. W., 4th Floor Podium,Toronto, Ontario M5X 1J9416.869.3707
121 King Street WestSuite 600
Toronto ON M5H 3T9416.865.7400
The Exchange Tower 130 King Street WestSuite 3030Toronto ON M5X 1J9416.869.8840
Toronto - Aquilon280 King Street EastToronto ON M5A1K7416.363.3050
Trois-Rivières7200, rue MarionTrois-Rivières QC G9A 0A5819.379.0000
Val d’Or647, 3e AvenueVal dOr QC J9P 1S7819.824.3687
VancouverPark Place666 Burrard Street, Suite 3300Vancouver BC V6C 2X8
604.623.6777Vernon3100 - 30th Avenue, Suite 101Vernon BC V1T 2C2250.260.4580
Victoria700-737 Yates StreetVictoria BC V8W 1L6250.953.8400
Victoriaville650, rue Jutras EstBureau 150Victoriaville QC G6S 1E1819.758.3191
WaterlooAllen Square180 King Street SouthSuite 340Waterloo ON N2J 1P8519.742.9991
Whistler8649 Forest Ridge Drive RR8Whistler BC V0N 1B8604.649.4510
White Rock1688 - 152nd StreetSuite 108South Surrey BC V4A 4N2604.541.4925
Windsor1 Riverside Drive WestSuite 600Windsor ON N9A 5K3519.258.5810
Winnipeg801-400 St. Mary AvenueWinnipeg MB R3C 4K5204.946.0297
International New York65 East 55th Street, 31st Floor New York, NY 10022Tel.: 212.632.8610
London (NBF Securities UK)(Regulated by The Financial Services Authority)71 Fenchurch Street, 11th floor London, England EC3M 4HDTel.: 44 (0) 20.7680.9370
Geneva (NBF INTERNATIONAL S.A.)15 rue du Cendrier CH-1201 Geneva, SwitzerlandTel.: 41.22.716.4747
Member Investment Dealers Association of Canada Canadian Investor Protection Fund
Winnipeg Commodities Exchange Securities Industry Association
Montreal Exchange Toronto Stock Exchange
National Bank of CanadaFinancial Inc.
New York65 East 55th Street, 34th Floor New York, NY 10022Tel.: 212.546.7500
Boston1 Federal Street, 25th Floor Boston, MA 02110Tel.: 617.357.5757