71
Copyright © 1997-2009 by T-Metrics, Inc.
| Date post: | 17-Dec-2015 |
| Category: |
Documents |
| Upload: | ernest-taylor |
| View: | 215 times |
| Download: | 0 times |

Copyright © 1997-2009 by T-Metrics, Inc.

What drives caller satisfaction?What drives caller satisfaction?
Copyright © 1997-2009by T-Metrics, Inc.
Presented by:
Terry Dunigan
704-525-5551
4321 Stuart Andrews Blvd
Charlotte, North Carolina 28217
HDI NC

Trends?Trends? 1999 to 2009 1999 to 2009
• The percentage of calls answered in less than 10 seconds fell nearly 12%.
• The average time it takes to answer jumped 69%, from 23 seconds to 39.
• The percentage of calls abandoned by those tired of waiting for an agent more than doubled, from 6% of calls to 13.6%.
Copyright © 1997-2009 by T-Metrics, Inc.

Your goalYour goal
Caller Satisfaction• Answering the call is the highest priority• Abandons-Losing a call is the worst thing that can
happen (callers threshold of pain)
• Average speed of answer should always be 20-50% below the average wait time for abandonment
Copyright © 1997-2009 by T-Metrics, Inc.

Some more of our goalsSome more of our goals
• A help desk tries to answer 90% of all question correctly during the first call.
• Next to that they require that 80% of the calls is answered within 20 seconds waiting.
• Increasing agents by 1 reduces AWT by a factor of 3
• No more than 3% of the calls abandons before getting a representative.

Copyright © 1997-2009 by T-Metrics, Inc.
What drives caller What drives caller satisfaction?satisfaction?
First &Final
AdherenceSLA
Reduce %Abandon
Speed of
Answer
Queue
Time
Complaints
resolution

Life of the callLife of the call
Copyright © 1997-2009 by T-Metrics, Inc.
Set-up queue Talk time
Talk Time Wrap up
The total time line of the call
From the callers perspective
Agents perspective
Equipment & Network People or agents
Network

Highlights of the ACDHighlights of the ACDor the equipment pieceor the equipment piece
• Provide greetings, menus, routing and queuing.
• Provide supervisors with the tools to manage people, view real time information and historical reports
Copyright © 1997-2009 by T-Metrics, Inc.

Copyright © 1997-2009 by T-Metrics, Inc.
What drives caller What drives caller satisfaction?satisfaction?
First &Final
AdherenceSLA
Reduce %Abandon
Speed of Answer
Queue
Time
Complaints
resolution

Copyright © 1997-2009 by T-Metrics, Inc.
What drives caller What drives caller satisfaction?satisfaction?
Most important
Least important

First Call resolutionFirst Call resolution
• The most important performance indicator for effectiveness is the First-time-resolution
• With high FTR, few follow-up calls are not needed.
• Increasing the FTR and reducing the AHT is a major objective in call centers.
• It is mainly obtained by proper training of
agents

68 % 68 %
If you are average you need to understand that 32 % of your total call volume is coming from customers who have to call back because their issue wasn’t resolved the first time.
First Call Resolution averageFirst Call Resolution average

Low caller Low caller satisfactionsatisfaction
“Caller satisfaction ratings for the company in general and for the CSR will be 35 to 45 percent lower when a second call is made for the same issue.”
Copyright © 1997-2009 by T-Metrics, Inc.

The Top 10 Agent Errors that Lead to The Top 10 Agent Errors that Lead to
Repeat CallsRepeat Calls
1. Improper transfer2. Agent told customer to call back3. Didn’t listen to the customer’s request/issue4. Agent gave customer incorrect information5. Did not set proper expectations. 6. Did not advise on using self-service tools (Web or IVR)7. Next steps were not followed/agent did not follow through on commitments8. Customer lacks confidence in agent’s answer9. Didn’t give the answer the customer was looking to hear
(also known as the “shopper”)10. Only answered the question asked, but did not anticipate the real customer issue In the healthcare world, quoting insurance benefits is one of the most complex, confusing and time-consuming activities that can take place in the call center. There are many different benefits that can be asked about and quoted. The flaw we often find in those call centers (and non-healthcare call centers, too) is that the agent only answers the question that the customer asked but doesn’t anticipate the full impact of the original question.

First Call Resolution First Call Resolution Industry ResearchIndustry Research
• Measuring FCR is still relatively new
43% of call centers measure1
• 68% FCR Rate is current industry standard
Average of 1.32 calls required to resolve issue
• Companies that only use self-reporting/internal FCR measurements are failing to take into account the customer’s perspective2
• Customer’s view of FCR is usually lower than the internal view3
• 1% improvement in FCR = 1% improvement in Customer Satisfaction4
1 First Call Resolution Workshop – EUCI Conference2 Article: Measuring the things that matter. Data from Service Quality Measurement Group (SQM)3 Achieving First Call Resolution: The Ascent Group Benchmark Study, Dec 20064 Article: Measuring the things that matter. Data from Service Quality Measurement Group (SQM)

Callback Windows Callback Windows by Call Typeby Call Type
Call Type Callback Window
Billing 21 days
Collections 21 days
Outdoor Lighting 14 days
Power Outage 3 days
Escalation/Supervisor 7 days
Service Order 14 days
Based on the frequency distribution of callbacks within 30 days
Window of time determined by when the greatest number of callbacks occur
Billing Callbacks
0.00
10.00
20.00
30.00
40.00
50.00
60.00
70.00
80.00
90.00
100.00
1 2 3 4 5 6 7 8 9 10 11 12 13 14 15 16 17 18 19 20 21 22 23 24 25 26 27 28 29 30 31
Days
Cu
m P
erce
nt
A power company

FCR Rate CalculationFCR Rate Calculation
Or, in other words…

79.2 % of contact centers consider FCR 79.2 % of contact centers consider FCR to be eitherto be either
• How do you measure?– Can the agent tag it as final resolution?
Maybe using activity items tag it as a 1st, 2nd, 3rd etcActivity item identifying as a return call
– Can the supervisor pull reports? Running call detail for a period of days and exporting to
excel and sorting on caller ID . Look for the same caller ID appearing more than once.
– Can the customer comment ?Objective caller survey

Activity entered by Activity entered by the agentthe agent
Copyright © 1997-2009 by T-Metrics, Inc.

Copyright © 1997-2005 by T-Metrics, Inc.
Agent SurveyAgent Survey
• Generate an accurate customer-satisfaction survey scores for contact center agents.
• The number of customers who take the survey is should be regulated by the supervisor.
• The survey is a generic set of questions that the caller responds to with a DTMF key between 1 and 6.
• The Agent Survey Module allows customers to provide objective feedback without the agent they dealt with knowing
• The recorded call and video let the supervisor review with the score card.
• Customers can be candid because the survey is private.

Cost of the call Cost of the call centercenter
Copyright © 1997-2009 by T-Metrics, Inc.
5%

How do you save How do you save money?money?
$500,000.00 call center• Save 10% of labor= $32,500• Save 10% of the network= $17,500• Save 10% of the equipment =$2,500
• You should spend the money on the right equipment to help manage your network and labor cost.
Copyright © 1997-2009 by T-Metrics, Inc.

The Equipment The Equipment
Copyright © 1997-2009 by T-Metrics, Inc.Only 5% of the call center cost
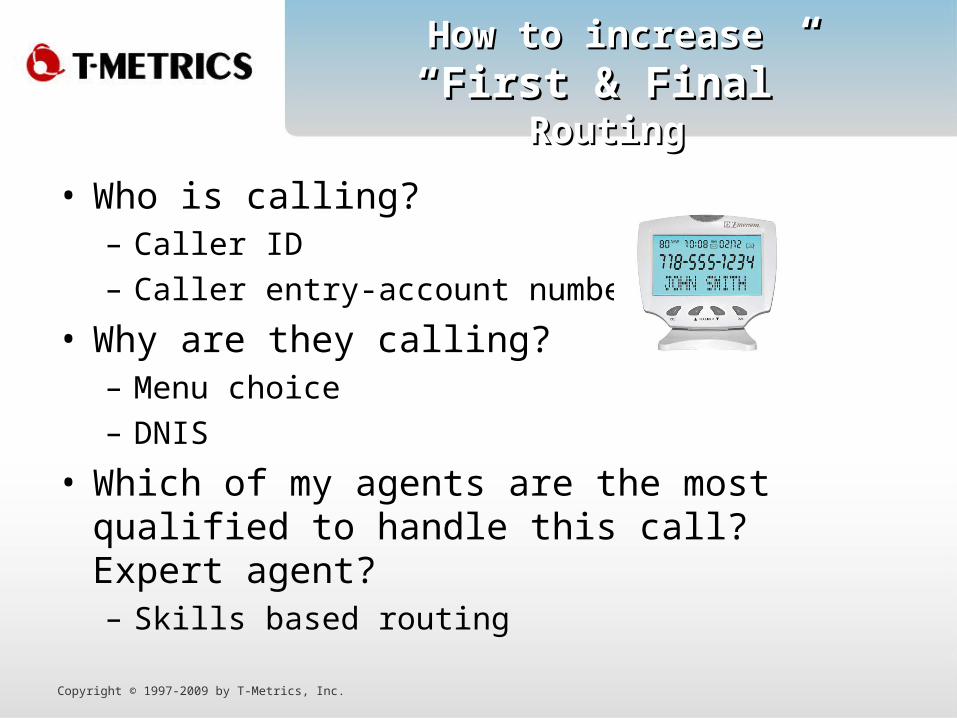
How to increase How to increase “First & Final”“First & Final”
RoutingRouting
• Who is calling?– Caller ID– Caller entry-account number
• Why are they calling?– Menu choice– DNIS
• Which of my agents are the most qualified to handle this call? Expert agent?– Skills based routing
Copyright © 1997-2009 by T-Metrics, Inc.

What is Skills based What is Skills based routing?routing?
• The ability to match incoming calls with the agent most qualified and/or capable to handle that particular call.
• The ability to assign multiple skills to agents at the same time, so they can be serving many types of calls simultaneously.
• This is in contrast to traditional "gate, queue and split" routing in which an agent was assigned to a single group only and calls were offered to that group as a whole.
Copyright © 1997-2009 by T-Metrics, Inc.

Skills based routingSkills based routing
• An agent can be a member of multiple skills, groups or queues.
• Agents are assigned a proficiency level in each skill.
• When the call arrives for a specific skill, the
system considers available agents with the highest proficiency level that have been available the longest in that skill, they will be presented with that call before lower level agents.
Copyright © 1997-2009 by T-Metrics, Inc.
Copyright © 1997-2009 by T-Metrics, Inc.
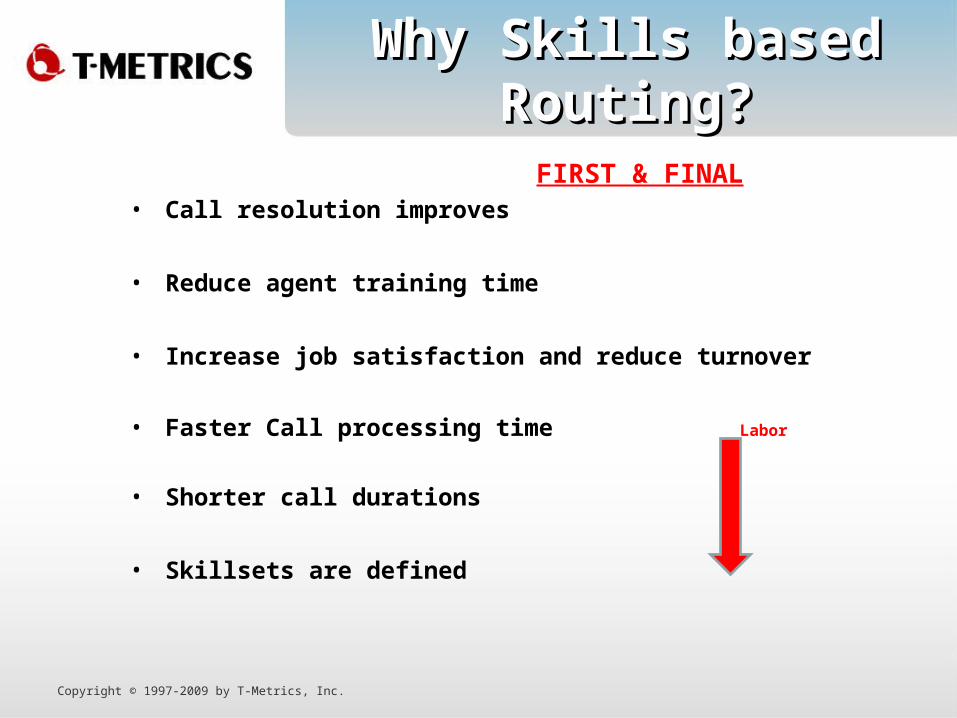
Why Skills based Why Skills based Routing?Routing?
FIRST & FINAL• Call resolution improves
• Reduce agent training time
• Increase job satisfaction and reduce turnover
• Faster Call processing time Labor
• Shorter call durations
• Skillsets are defined
Copyright © 1997-2009 by T-Metrics, Inc.
• Reduce the number of calls in queue• Reduce the time in queue• Reduce agent talk time
How do you reduce the cost How do you reduce the cost of the network side?of the network side?

Copyright © 1997-2009 by T-Metrics, Inc.
Long holding times?Long holding times?
• Long delays for customers to get through to “the next available agent”
• Customers are often left on hold for extended periods of time
– When he’s finally connected with an agent, he talks– but some of that time is spent complaining about his long wait!
– Note that many callers in this situation would abandon the queue before reaching an agent and retry the call later, resulting in additional toll costs for your contact center.
12:00 12:01 12:02 12:03 12:04 12:05 12:06 12:07 12:08 12:09 12:10 12:11Queue Time Agent talk time
Abandons Retry Please stay on the line your call is important to us but your time
isn’t.
Copyright © 1997-2009 by T-Metrics, Inc.
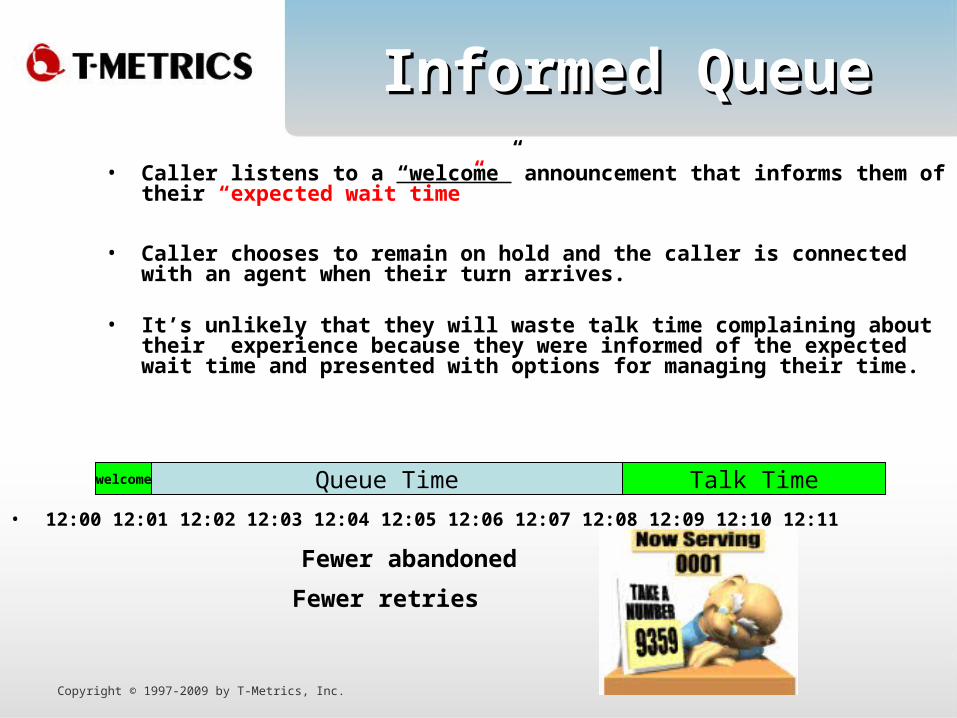
Informed QueueInformed Queue
• Caller listens to a “welcome” announcement that informs them of their “expected wait time”
• Caller chooses to remain on hold and the caller is connected with an agent when their turn arrives.
• It’s unlikely that they will waste talk time complaining about their experience because they were informed of the expected wait time and presented with options for managing their time.
• 12:00 12:01 12:02 12:03 12:04 12:05 12:06 12:07 12:08 12:09 12:10 12:11
welcome Queue Time Talk Time
Fewer abandoned
Fewer retries

Copyright © 1997-2009 by T-Metrics, Inc.
Intelligent queueIntelligent queue
• Caller listens to a “welcome” announcement that informs them of their “expected wait time”
• A caller who is treated by the Intelligent queuing system can choose to hold or to receive a return call in the same amount of time as if they waited on hold.
• The caller leaves their phone number, name and a brief message, the caller hangs up the phone and an Intelligent queue reserves their spot in the queue. This “Intelligent queue time” saves toll charges (because the customer is not on the line) and frees up the customer’s valuable time.
• When the customer callback message is delivered to the agent , the agent will be presented with a “customer callback information” window When the agent clicks on listen to message their phone will ring with the message.
• 12:00 12:01 12:02 12:03 12:04 12:05 12:06 12:07 12:08 12:09 12:10 12:11
Welcome Leave message Intelligent queue time Talk Time
Save toll chargesLess hardware Increase first & final

Copyright © 1997-2009 by T-Metrics, Inc.
Benefits of Intelligent Queuing Benefits of Intelligent Queuing SolutionsSolutions
By eliminating wasted queue time, your contact center will:
• Reduce ASA – return calls don’t go to queue until an agent is available
• Reduce abandons – callers have an alternative (up to 50% reduction)for service without waiting on hold
• Increase labor efficiency – calls have shorter handle times (10% reduction)and better distribution
• Reduce toll costs – “Intelligent queue” time does not incur toll charges (up to 90% reduction) or switch resources (trunks, announcements etc..)
• Increase caller satisfaction – show respect for your callers’ valuable time. ( increase up to 30%)

How do you know your call How do you know your call center isn’t working properly?center isn’t working properly?
• Frequent shuffling of customers from agent to agent ( Labor)– You need skills based routing– Your greeting may need tuning– Do you have expert agents?– Do you have presence?
• Customer issues that frequently require multiple contacts before they are resolved– Does the caller need to re-explain their problem all over
again to a new agent or does the agent that answered need to transfer the call
Copyright © 1997-2009 by T-Metrics, Inc.

NeverNever give out an agent give out an agent telephone numbertelephone number
• People will have a tendency to get attached to helpful agents.– This will over burden certain agents– This will destroy your skills based routing – Your reports would be skewed
• How does a caller get back to an agent that has been working on their problem?– This has to be at the discretion of the agent– The agent should be able to generate a PIN that expires
after a pre set period of time or once it is used.– The PIN routes the caller to the agent
Copyright © 1997-2009 by T-Metrics, Inc.

How do you know your call How do you know your call center isn’t working properly?center isn’t working properly?
• No way to measure caller satisfaction—or, if there is, scores are low– Caller satisfaction survey
• A poor understanding of metrics or performance– What do the real time statistics tell me– What is my FCR rate– What historical reports are available
Copyright © 1997-2009 by T-Metrics, Inc.

Copyright © 1997-2009 by T-Metrics, Inc.
Service Level AgreementsService Level Agreements
• The service level is the percentage of incoming calls answered within a specified number of seconds.
• You may have the objective, “80 percent of calls are answered within 20 seconds.”
• Your actual service level, may be “77 percent of calls are answered within 20 seconds.”
A good SLA helps the call center “promise what is possible to deliver” and “deliver what is promised”.

3 minute calls3 minute calls250 calls per ½ hour 250 calls per ½ hour
Agents SLA % ASA # of Ports
30 24 209 35
31 45 75 16
32 61 38 10
33 73 21 8
34 82 13 6
35 88 8 5
36 92 5 4
37 95 3 4
38 97 2 3
39 98 1 3
40 99 1 3
41 99 1 2
42 100 0 2
Copyright © 1997-2009 by T-Metrics, Inc.
Poor staffing means more ports

Why SLA’s are Why SLA’s are importantimportant
• Agent scheduling is a game plan
• Service levels reveal how well schedules are matching agents to workload or incoming calls-The Score
• SLA’s expose problem areas
Copyright © 1997-2009 by T-Metrics, Inc.

Copyright © 1997-2009 by T-Metrics, Inc.
All the technology in the world All the technology in the world can’t replace staffingcan’t replace staffing
1 n ports
SLA -80% of calls answered in 20 seconds Average call duration 180 seconds 500 calls in the busy hour
PSTN500 callsIn one hour
Number of agents 34 31 30
Average speed of answer
13seconds
75 seconds
209seconds
SLA 100% 45% 24%
# of
Ports 6 16 35
DMS100

Copyright © 1997-2009 by T-Metrics, Inc.

How do you control How do you control the people side?the people side?
Copyright © 1997-2009 by T-Metrics, Inc.

• Total working time is defined as the total talk time plus the wrap-up time.
• The denominator -the time that the agent spends on calls plus the time that the agent is available for receiving calls.– But should we count the time for breaks as
well? And training?
• Depending on the definition of productivity very different numbers can occur.
What counts as What counts as productivityproductivity
Total working timeTotal working time =--------------------------------------------------------------x 100% =--------------------------------------------------------------x 100%
Total time working and time availableTotal time working and time available
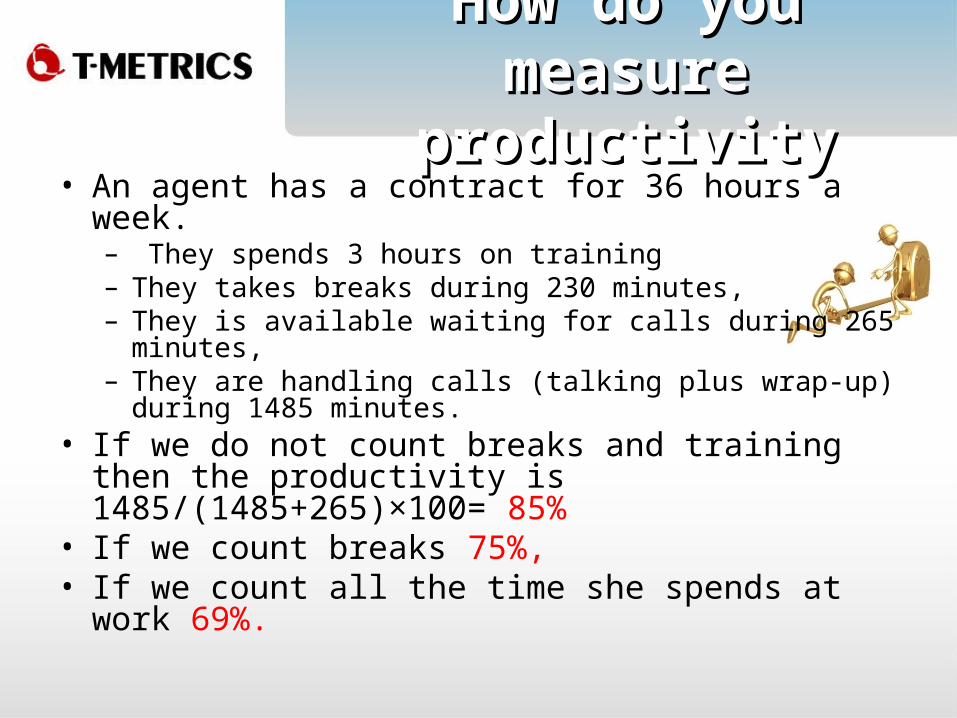
How do you measure How do you measure productivityproductivity
• An agent has a contract for 36 hours a week. – They spends 3 hours on training– They takes breaks during 230 minutes, – They is available waiting for calls during 265
minutes, – They are handling calls (talking plus wrap-up)
during 1485 minutes.• If we do not count breaks and training then
the productivity is 1485/(1485+265)×100= 85%
• If we count breaks 75%, • If we count all the time she spends at work
69%.
Consolidation!Consolidation!
• Merging two call centers leads to economies-of-scale advantages.
• However, the physical costs of such a merger can be high! Calculations based on the Erlang model can quantify the expected cost reduction.
• This way a reasonably accurate cost trade-off can be made.

Economies of scaleEconomies of scale
• A firm has two small decentralized call centers, each with the same parameters: λ = 1and β = 5 minutes. – With 8 agents the average waiting time is
approximately 17 seconds 17 seconds in each call center.• If we join these call centers “virtually”, then we have a
single call center with λ = 2 and 16 agents. • The average waiting time is now less than 3 seconds3 seconds,
and employing only 14 agents gives a waiting time of only 13 seconds13 seconds.
• An additional advantage is that there is more flexibility in the assignment of agents to call centers, as there is only a constraint on the total number of agents (although there will probably be physical constraints, NOT A FACTOR IN VIRTUAL CALL CENTERS, such as the number of work places in a call center).

Relative gain of merging call Relative gain of merging call centers decreases as the size centers decreases as the size
increasesincreases
• Consider four call centers, each with λ = 10 and β = 2 minutes, and 80% of the calls should be served within 20 seconds.
• If all call centers are separate then we need 24 agents in each call center, 96 total agents.
• 45 agents in each when they are merged two by twotwo by two• =90 agents total
• 86 agents when we have one single call centerone single call center. -------------------------------------------------
• Merging two centers with arrival rate 10 saves 3 agents, • Merging two with arrival rate 10 saves 4. • But divided by the arrival (that is, relative to the size), the• economies are higher when the small centers are
merged.

What cost can you What cost can you control?control?
• Contact length• Agent occupancy-how busy your agents
are with current contacts • Average cost of putting an agent online
(wages, benefits, overhead, and so on)• Repeat contacts from customers who
don’t get an accurate or complete answer on the first try
• Nonproductive agent time (time away from the phone)
Copyright © 1997-2009 by T-Metrics, Inc.
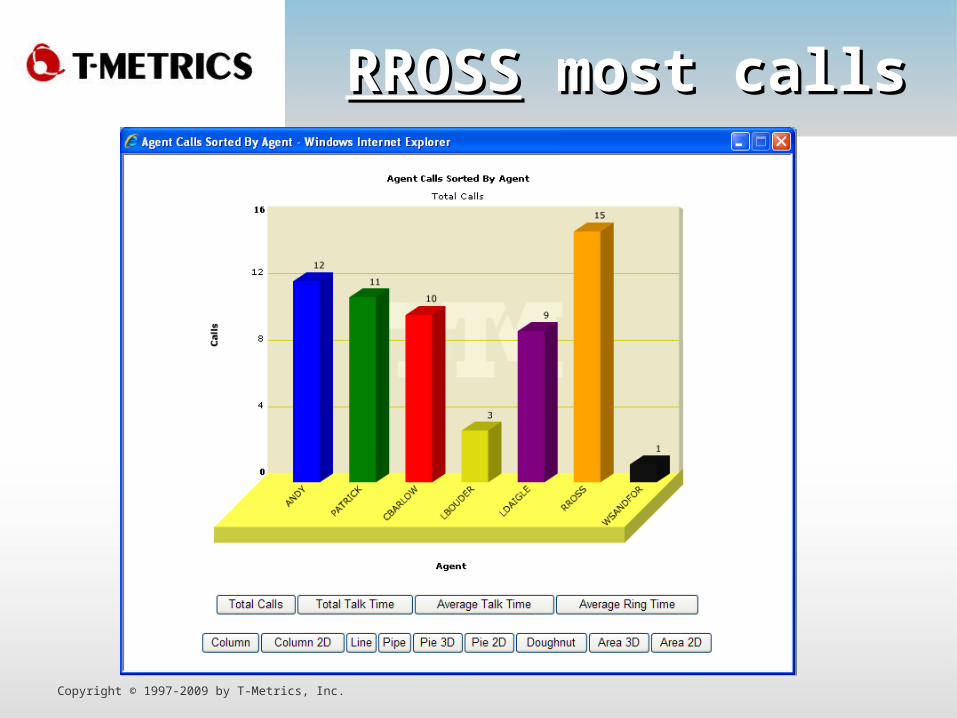
RROSSRROSS most calls most calls
Copyright © 1997-2009 by T-Metrics, Inc.

ANDY ANDY spent more spent more time talkingtime talking
Copyright © 1997-2009 by T-Metrics, Inc.
And
y ha
d th
e hi
ghes
t FC
R

Copyright © 1997-2009 by T-Metrics, Inc.
• status and phone time
• agents available and ready per skill set
• Service level agreement per skill set
• average speed of answer
• abandons real time
•Age of oldest callin queue
What should the supervisor What should the supervisor see?see?

Copyright © 1997-2009 by T-Metrics, Inc.
Screen popScreen pop
•ACD should use:– caller ID,– number dialed–digits entered by the caller
to pop records from any Customer Relationship Management (CRM) package
1. MS Outlook
2. Help Desk - BMC Remedy
3. OBDC compliant database
4. HTML programs
55

Copyright © 1997-2009 by T-Metrics, Inc.
Why Screen POP?Why Screen POP?
PRODUCTIVITY IMPROVEMENTS•Initial Screen Pop 10 - 15%Based on Average Talk Time of 120 second.Industry figures based on information found in “Computer Telephony Integration” by Robert Walters.
AssumptionsTelephone Line and Equipment Charges $ 0.08 per minute (Toll Free Calls)Personnel Charges at 85% Utilization $35,000 per yearWorkstation and System Administration $5,000 per year

Copyright © 1997-2009 by T-Metrics, Inc.
0
50,000
100,000
150,000
200,000
250,000
300,000
350,000
400,000
450,000
500,000
100
200
300
400
500
600
700
800
900
1000
1100
1200
1300
1400
1500
1600
1700
Calls per Hour -- One Shift
$
0
50,000
100,000
150,000
200,000
250,000
300,000
350,000
400,000
450,000
500,000
100
200
300
400
500
600
700
800
900
1000
1100
1200
1300
1400
1500
1600
1700
Calls per Hour -- One Shift
An
nu
al I
ncr
emen
tal
Do
llar
s S
aved
18 secs/call
12 secs/call
50 Agents @ 15 calls/hr = 750 calls/hourA 10% or 18 seconds savings on a 3 minute call yields an annual savings of $215,000 for a single shift call center
CTI $avings

Pick the KPI to showPick the KPI to show
Copyright © 1997-2009 by T-Metrics, Inc.
The following agent items can be individually selected for viewing:
Agent name Extension number Skill set agent is conversing with
Real time state of every agent’s telephone Length or duration of telephone state
Agent status Status duration Number of ACD calls per agent
Average duration of ACD call per agent Non ACD calls per agent
Time on non ACD calls per agent Last/current ACD caller ID
The following Skill set items can be individually selected for viewing:
Number of calls in queue per skill Age of oldest call in queue per skill
Agents available Agents ready Number of messages per skill
Total calls per skill Answered Abandoned
Abandoned average Abandoned % SLA
Average speed of answer Skill sets selected
Copyright © 1997-2009 by T-Metrics, Inc.
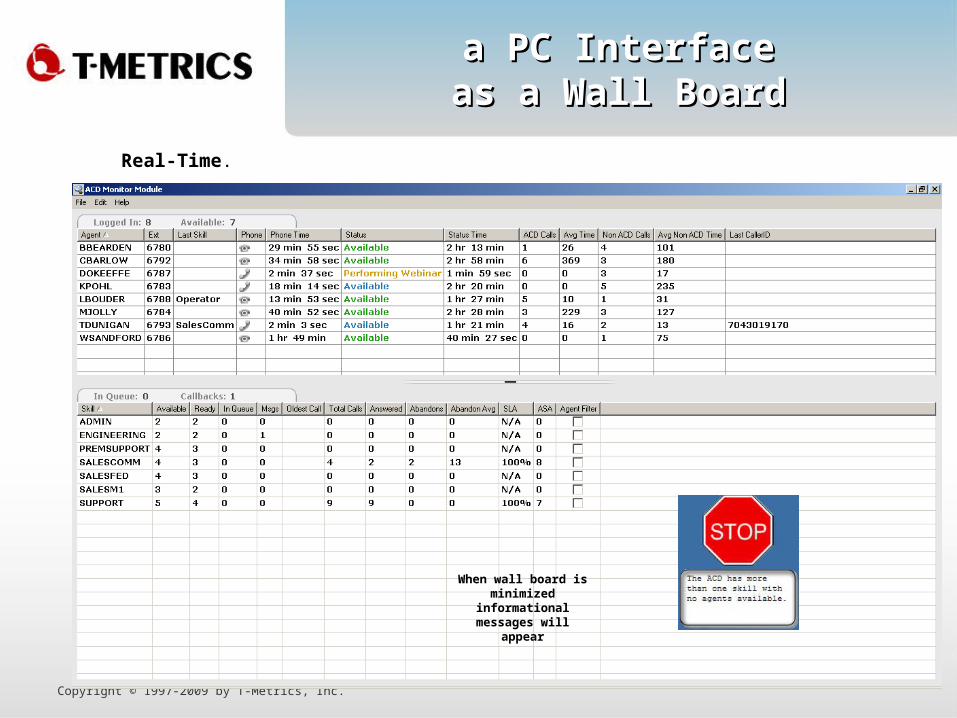
Real-Time.
When wall board is minimized
informational messages will appear
a PC Interfacea PC Interfaceas a Wall Boardas a Wall Board

Copyright © 1997-2009 by T-Metrics, Inc.
Supervisor Call Center Supervisor Call Center ManagementManagement
• Real-time caller, agent, and Departmental status information
• View the agents screen Local or Remote
• Control changes to agent status
• Listen to agents conversation local or remote
• Provides real time and historical reports
If you can’t measure it you can’t Manage it.

Supervisor toolsSupervisor tools
• See real time information– How old is the oldest call in queue– How many calls are in queue– Am I meeting my SLA goals– How many agents are logged in– View agents desktop
• Run historical reports• Record calls for training or caller resolution • Change call center on fly
– Schedules– Greetings– Agent status– Send immediate messages
Copyright © 1997-2009 by T-Metrics, Inc.

Building the report Building the report should be easyshould be easy
• Select dates to report on
• Select skill(s) to report on
• Select category to report on
• Select type of report
Copyright © 1997-2009 by T-Metrics, Inc.

Run the reportRun the report
TEXT
EXCEL
Graphical
Copyright © 1997-2009 by T-Metrics, Inc.

Queue TimeQueue Time
Copyright © 1997-2009 by T-Metrics, Inc.
Copyright © 1997-2009 by T-Metrics, Inc.

Work Force ManagementWork Force Management
YEARLY VACATION VIEW
The yearly vacation planning view allows agents toplan or review their entire year’s vacation at aglance. Detail views are also available.© 2002 Pipkins, Inc
MONTHLY SCHEDULE REPORT
Advanced Forecasting
Scheduling in Skill-Based environments
Schedule Management tools
ACD Integration for Data Collection across multiple sites and time zones
Workload distribution/automation
Comprehensive Reporting capability –e-mail, export, or schedule reports
Attendance Preferences
Vacation Planning
Budgeting
Agent Productivity Reporting

Problem resolutionProblem resolution
• I don’t know who I talked with but they were rude.
• We have a caller who calls in multiple times trying to get different answers from different people.
• How many times in a week does this caller use our services?
Copyright © 1997-2009 by T-Metrics, Inc.
Appr
oxim
atel
y w
hat d
ay d
id y
ou c
all?
Wha
t tel
epho
ne n
umbe
r did
you
cal
l in
from
?

Problem resolutionProblem resolution
Copyright © 1997-2009 by T-Metrics, Inc.
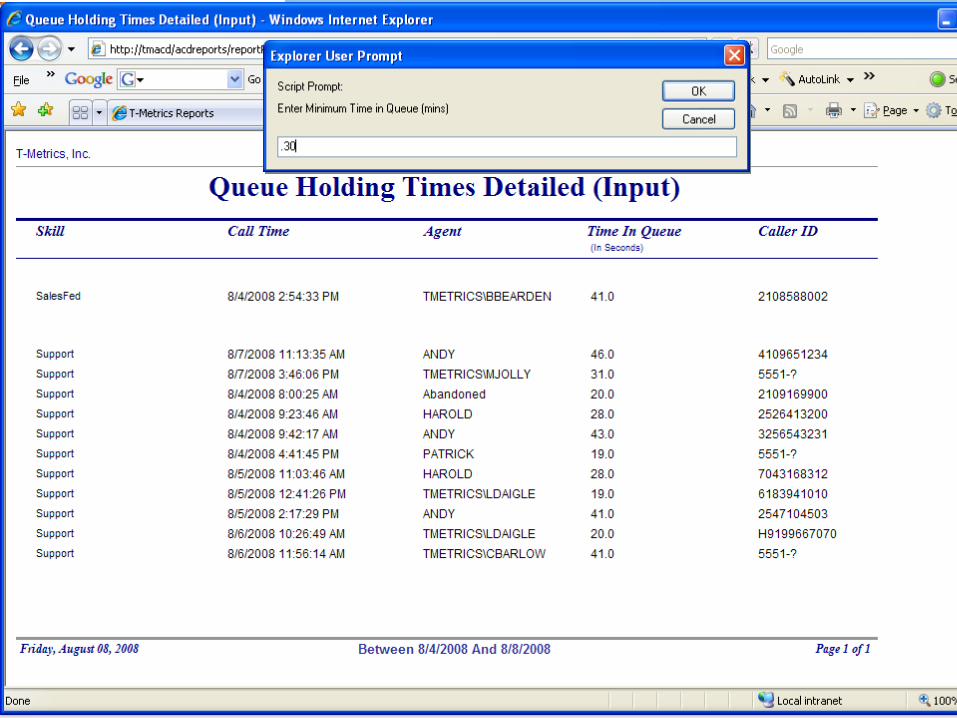
Abandoned callsAbandoned calls
• The abandon rate is the percentage of calls that are abandoned compared to
calls received.
• Abandon rate are the number one most closely watched performance measure that call center managers use to determine their call center performance.
Copyright © 1997-2009 by T-Metrics, Inc.

Copyright © 1997-2009 by T-Metrics, Inc.
5 agents

If there was only one metric to measure a contact If there was only one metric to measure a contact center bycenter by
FCR FCR would be the measure to pick. would be the measure to pick.
• This is because FCR improves customer satisfaction/loyalty,
• it improves employee satisfaction (fewer irate calls due to customers calling back repeatedly for the same issue),
• it reduces operating costs (by improving efficiency) and it reduces revenue at risk.

Caller SatisfactionCaller Satisfaction
Faster call processing• Skills based routing• Adhering to SLA’s• Activity selection of FCR• Higher FCR• Reduced abandons• Intelligent queuing• Agent call back• Agent survey
Copyright © 1997-2009 by T-Metrics, Inc.
First &Final

First Call ResolutionFirst Call Resolution
Copyright © 1997-2009 by T-Metrics, Inc.
Copyright © 1997-2009 by T-Metrics, Inc.

Copyright © 1997-2009 by T-Metrics, Inc.
Access TM2000 Information www.tmetrics.com
or
Call us at 704-525-5551
And ask for
Terry Dunigan
For More Information aboutFor More Information about
T-MetricsT-Metrics


