Page 1
Copyright © 2003 Marta Tienda for THEOP. All rights reserved.
Affirmative Action and its Affirmative Action and its Discontents: Lessons from Discontents: Lessons from the Texas Top 10% Planthe Texas Top 10% Plan
Marta TiendaUniversity of Michigan
October 29, 2003
Image Credit: http://www.cscc.edu/bmgtoadm/images/graduation%20cap%20and%20diploma.jpg
Page 2
Copyright © 2003 Marta Tienda for THEOP. All rights reserved.
Allocating Scarce Slots: From Allocating Scarce Slots: From Ascription to AttributionAscription to Attribution General affirmative action debate
Conceptions of “merit”—rising focus on standardized test scores
Mismatch hypothesis instantiates debate: Bowen & Bok: dismiss for blacks Alon & Tienda: dismiss for Hispanics and blacks using
national data as well as C&B Increasing demand for relatively fixed slots at
selective and highly selective institutions Deserving vs undeserving students Changing demography: numbers and composition
Page 3
Copyright © 2003 Marta Tienda for THEOP. All rights reserved.
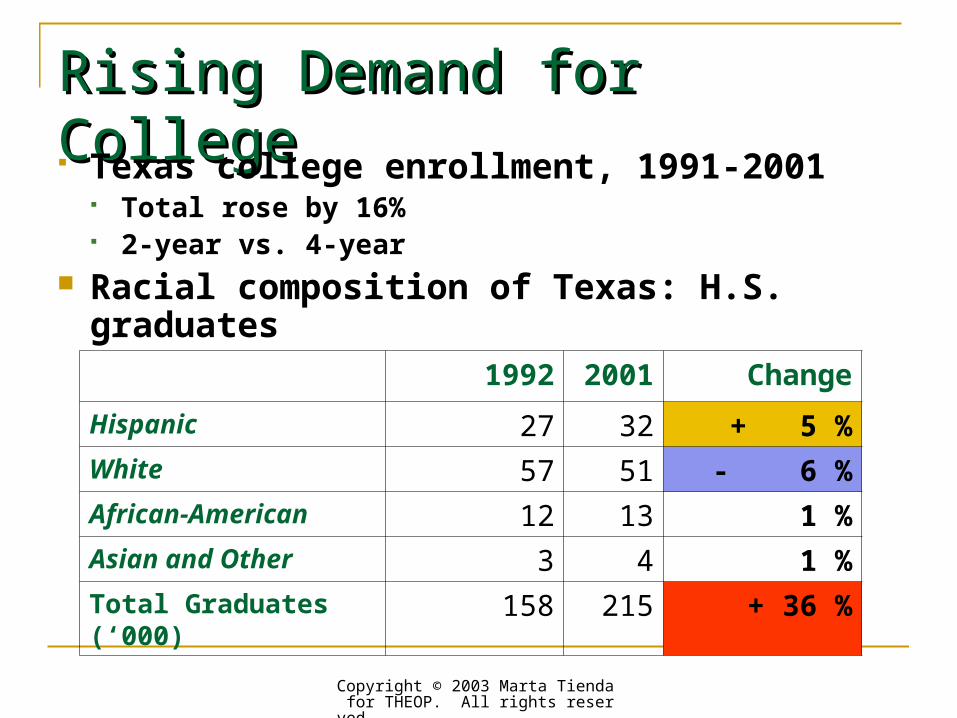
Rising Demand for CollegeRising Demand for College
Texas college enrollment, 1991-2001 Total rose by 16% 2-year vs. 4-year
Racial composition of Texas: H.S. graduates
1992 2001
Change
Hispanic 27 32 + 5 %White 57 51 - 6 %African-American 12 13 1 %Asian and Other 3 4 1 %Total Graduates (‘000) 158 215 + 36 %
Page 4
Copyright © 2003 Marta Tienda for THEOP. All rights reserved.
Texas shifted terms of Texas shifted terms of affirmative action affirmative action debate…debate…
Relevance of race for admission
versus
School quality as basis for exclusion
Page 5
Copyright © 2003 Marta Tienda for THEOP. All rights reserved.
Path to Top 10 Percent PlanPath to Top 10 Percent Plan: : HopwoodHopwood and its Aftermath and its Aftermath Context:
Infamous 1996 Hopwood decision; Texas growing rapidly and becoming majority minority state.
The Texas’ response: Bold bi-partisan leadership and interagency cooperation birth of HB588—the Texas Top 10% Law
Rationale: Grades are better predictors of college success than test scores Equalizing higher educational opportunity means leveling playing
field to promote access Seeds of Discontent:
Shifting conception of “merit” from test scores to class rank Shifting debate from deserving vs. undeserving race/ethnic
groups to deserving vs. undeserving schools
Page 6
Copyright © 2003 Marta Tienda for THEOP. All rights reserved.
Percent Plans: Facts and Percent Plans: Facts and FictionFiction Appeal
Build on merit “Politically correct” affirmative action Allegedly “race neutral” Uniform standard for ALL schools—high and low performing; no
preference for the elite schools Limitations
Capitalize on segregation Compromise full file review for a single indicator Can overwhelm admissions process and saturate the classes Requires massive outreach and retention investments for
students from low performing schools
Page 7
Copyright © 2003 Marta Tienda for THEOP. All rights reserved.
Texas Plan is Texas Plan is Unique…Unique…
Unrestricted access to public flagships— completed application required
Choice of major (though has been restricted) Accompanied by vigorous outreach and
fellowship support by public flagships By law, out of state admissions to state
institutions are limited Tuition is low relative to other state universities
Page 8
Copyright © 2003 Marta Tienda for THEOP. All rights reserved.
The Supreme Court has The Supreme Court has Spoken: Spoken: What now for Texas public What now for Texas public institutionsinstitutions Admissions Autonomy: return to affirmative action
“as we knew it”
Admissions under scrutiny: full file review with threats of lawsuits by affirmative action opponents
Symbolic Autonomy Constrained: Gratz and Grutter as footnotes to HB588 and Prop209
Page 9
Copyright © 2003 Marta Tienda for THEOP. All rights reserved.
Highlights to ComeHighlights to Come
Thumbnail sketch of Texas Higher Education Opportunity Project
Overview of Texas demographics Initial insights from administrative data Early insights from survey data (including
preliminary results for W2) Policy implications in light of Supreme Court
decision
Page 10
Copyright © 2003 Marta Tienda for THEOP. All rights reserved.
The Texas Higher The Texas Higher Education Opportunity Education Opportunity ProjectProject
Funded by the Ford Foundation, in cooperation with the Mellon and Hewlett Foundations.
Page 11
Copyright © 2003 Marta Tienda for THEOP. All rights reserved.
THEOP: Primary Research THEOP: Primary Research QuestionsQuestions How does the Top 10% law influence minority
enrollment at Texas public institutions that vary in the selectivity of their admissions? Cascading vs. catapulting Public vs private institutions
How does the Top 10% law influence high school seniors’ college planning and enrollment decisions? Is there a brain drain out of the state from students who attend
the most competitive high schools? Does the Top 10% guarantee encourage minority students to
apply and enroll in 4-yr. institutions? Are students from noncompetitive high schools even aware of
the provisions of HB 588?
Page 12
Copyright © 2003 Marta Tienda for THEOP. All rights reserved.
Data CollectionData Collection
Administrative Records Records on college applicants, admits & matriculants
from 12 Texas colleges and universities of varying selectivity 1992 – present
Permits comparisons of outcomes pre- and post-Hopwood as “quasi-natural experiment”
Survey Data Statewide survey of high school seniors & sophomores in
2002 Follow-up interviews with high school senior cohort for 6
years Follow-up interviews with sub-samples of high school
sophomore cohort during senior year
Page 13
Copyright © 2003 Marta Tienda for THEOP. All rights reserved.
TEXAS ChallengesTEXAS Challenges
Growing population diversificationPersisting educational inequalityRising demand for higher education
Page 14
Copyright © 2003 Marta Tienda for THEOP. All rights reserved.
5344
13
12
3140
1020
5261
1112
3226
3232
0%10%20%30%40%50%60%70%80%90%
100%
Total Pop,1990
Total Pop,2000
College-Age,1990
College-Age,2000
AsianHispanicBlackAngloOther
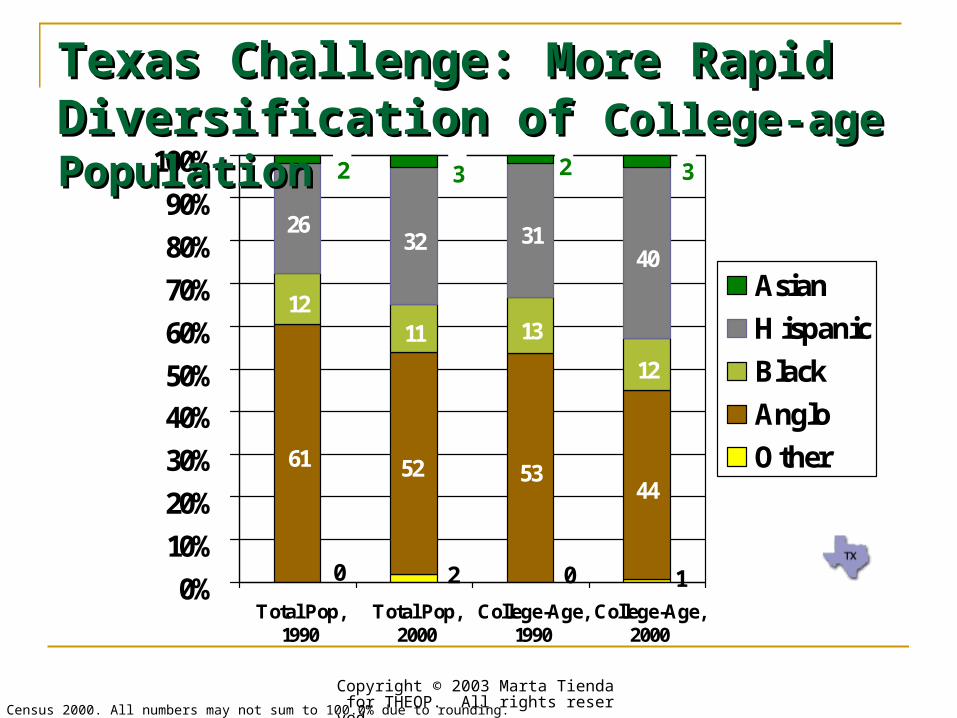
Texas Challenge: More Rapid Texas Challenge: More Rapid Diversification of Diversification of College-age College-age PopulationPopulation
Source: Census 2000. All numbers may not sum to 100.0% due to rounding.
Page 15
Copyright © 2003 Marta Tienda for THEOP. All rights reserved.
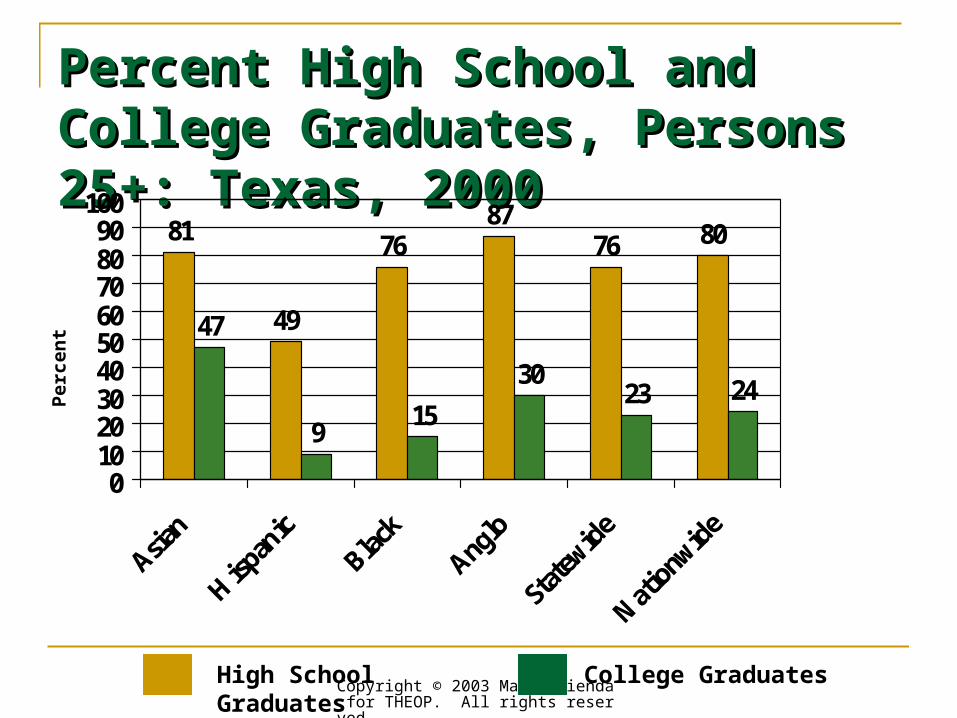
Percent High School and Percent High School and College Graduates, Persons College Graduates, Persons 25+: Texas, 200025+: Texas, 2000
81
49
7687
76 80
47
915
3023 24
0102030405060708090
100
Asian
Hisp
anic
Black
Anglo
State
wide
Nati
onwi
de
Per
cen
t
High School Graduates College Graduates
Page 16
Copyright © 2003 Marta Tienda for THEOP. All rights reserved.
Admission Admission Probabilities—Pre- Probabilities—Pre- and Post and Post HopwoodHopwood
Initial findings from the University of Texas at Austin
Page 17
Copyright © 2003 Marta Tienda for THEOP. All rights reserved.
Glimpse of Texas Public Glimpse of Texas Public Flagships: 2000Flagships: 2000
U Texas at Austin Texas A&M
Student Body 49,996 45,083
Undergraduates 38,162 36,775
Graduate & Prof. Students 11,834 8,308
Freshman Admits 13,256 11,777
Admission Rate 61.5% 68.1%Source: University of Texas at Austin Fact Sheet; Texas A&M University Office of Institutional Research
Page 18
Copyright © 2003 Marta Tienda for THEOP. All rights reserved.
Class Rank
1st Decile 2nd Decile 3rd Decile +
Pre- Post- Pre- Post- Pre- Post-
African American 93.1 99.6 78.7 73.8 53.5 43.4
Hispanic/Latino 93.8 99.7 81.8 79.5 56.6 48.1
Asian American 92.0 99.9 75.3 92.4 48.6 63.8
White 93.7 99.9 80.4 91.1 52.5 61.3
Feeder HS 92.4 100.0 89.1 97.3 56.4 61.4
Admission Probability to UT – Admission Probability to UT – Pre- Pre- Hopwood and 3 Years PostHopwood and 3 Years Post
Page 19
Copyright © 2003 Marta Tienda for THEOP. All rights reserved.
Early Lessons from Early Lessons from Administrative Records---Administrative Records---The First Three YearsThe First Three Years Top 10% law has capacity to restore some diversity
to flagship public institutions, but not optimal All minority groups are not benefiting uniformly
from top 10% law; Asians appear to benefit most Blacks appear to benefit least
Students from “feeder” schools do not appear to be hurt by 10% law, yet perceptions and reports (based on media sources) are exactly opposite
Top 10% law broadens opportunity in higher education for nonminority excluded groups
Page 20
Copyright © 2003 Marta Tienda for THEOP. All rights reserved.
24,000
10,000
6,000
20,02519,562
15,53115,80913,663 13,694
9,319 9,472 10,079 10,777 11,413 11,024
6,3406,6646,0005,5295,5475,157
0
5,000
10,000
15,000
20,000
25,000
30,000
1992 1994 1996 1998 2000 2001 2003
APPLIED ADMITTED ENROLLED
Applicant, Admission, & Fall Applicant, Admission, & Fall Enrollment Enrollment Undergraduate Trends: UT Austin, Undergraduate Trends: UT Austin, 1992-2003 1992-2003
Source: The University of Texas at Austin, Office of Institutional Studies
Page 21
Copyright © 2003 Marta Tienda for THEOP. All rights reserved.
Aftermath of HB588 over Next Aftermath of HB588 over Next Three Years : UT Admissions Three Years : UT Admissions Squeeze Squeeze Rising number of applicants (24K in 2003); falling number admitted (10K)
Rising class saturation with top 10% admits 43% for 1996 cohort 47% for 2000 cohort 52% for 2002 cohort 63% for 2003 cohort 72% for 2004 current cohort
Major guarantee to top 10% admits now capped at 75%
Will the Legislature revoke HB588?
Page 22
Copyright © 2003 Marta Tienda for THEOP. All rights reserved.
Highlights from Highlights from Survey DataSurvey Data
Initial insights about students’ perceptions of the top 10% law and their college intentions
Page 23
Copyright © 2003 Marta Tienda for THEOP. All rights reserved.
THEOP: Two-Cohort THEOP: Two-Cohort Longitudinal DesignLongitudinal Design
Cohort 2002 2003 2004 2005
SeniorWave 1
N=13,803
Wave 2
N=6,000
Wave 3
N=6,000*
SophomoreWave 1
N=19,969
Wave 2
N=3,0002,000 Stayers
1,000 Movers
*The actual number of surveys will depend on the completed number in Wave 2 (probably in excess of 6,000) minus attrition, which is expected to be circa 10% or less.
Page 24
Copyright © 2003 Marta Tienda for THEOP. All rights reserved.
Statewide Baseline Statewide Baseline SurveySurvey Fielded Spring, 2002 108 schools in sample: 93% cooperation
rate 98 cooperating (87 in-class administration; 11
mail) 3 ineligible; 7 non-cooperating (2 refusal; 5
recalcitrant) 34,000 surveys completed
14K seniors & 20K sophomores Mostly in-class censuses; 12 mail only
Page 25
Copyright © 2003 Marta Tienda for THEOP. All rights reserved.
Senior Survey DataSenior Survey Data
Wave 1 Demographics Course taking/grades Knowledge/perceptions of
Top 10% Law School attitudes/behavior Peer information College plans Extracurricular activities Self-esteem Language Interaction with counselors Plans for future Knowledge of class rank
Wave 2 Demographics Current enrollment or
employment status Work & college experiences College preparedness Reasons for college choice College finances Psych well-being Civic activity Admission by college rank Family status/living
arrangements Future plans/expectations
Page 26
Copyright © 2003 Marta Tienda for THEOP. All rights reserved.
Demographic Composition of Demographic Composition of SamplesSamples Sophomores Seniors
% Female 51.7 52.0
Race/Ethnicity
% White 48.5 51.2
% Black 11.7 10.3
% Hispanic 34.2 32.6
% Asian 3.7 3.8
% Other 2.1 2.0
% U.S. Born 84.2 86.6
% Speak Second Language at Home 38.7 38.1
% Father Absent 33.7 33.7
N* 19,969 13,803
*N’s vary across items due to missing information and filtered questions.Photo Credit: http://www.uic.edu/cba/Acadprgms/students.jpg
Page 27
Copyright © 2003 Marta Tienda for THEOP. All rights reserved.
Father’s Educational Father’s Educational Attainment by Ethnicity: All Attainment by Ethnicity: All SeniorsSeniors
39
7
21
812
36
50
11
0
10
20
30
40
50
White Black Hispanic Asian
B.A. or Higher Less than High School Diploma
Per
cen
t
Page 28
Copyright © 2003 Marta Tienda for THEOP. All rights reserved.
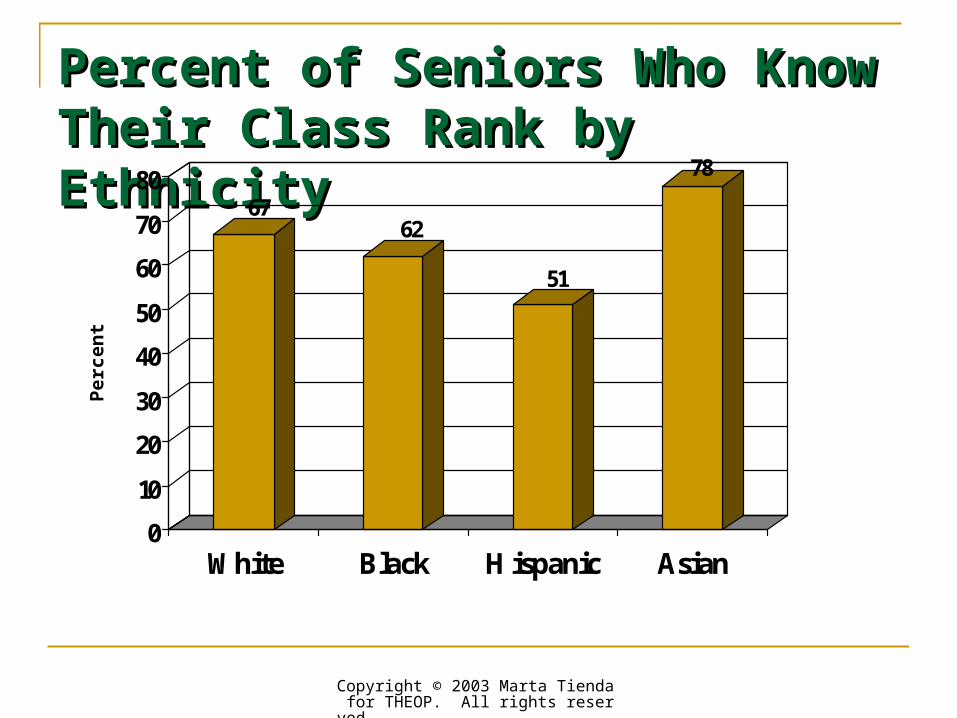
Percent of Seniors Who Percent of Seniors Who Know Their Class Rank by Know Their Class Rank by EthnicityEthnicity67
62
51
78
0
10
20
30
40
50
60
70
80
White Black Hispanic Asian
Per
cen
t
Page 29
Copyright © 2003 Marta Tienda for THEOP. All rights reserved.
Percent of Seniors Who Know “A Percent of Seniors Who Know “A Lot” About 10% Law by EthnicityLot” About 10% Law by Ethnicity
31
22
16
49
05
101520253035404550
White Black Hispanic Asian
Per
cen
t
Page 30
Copyright © 2003 Marta Tienda for THEOP. All rights reserved.
College Plans by Ethnicity: All College Plans by Ethnicity: All SeniorsSeniors
77
58
72
5462
46
87
68
0
10
20
30
40
50
60
70
80
90
White Black Hispanic Asian
College is Primary Post-High School Activity Applied to College
Per
cen
t
Page 31
Copyright © 2003 Marta Tienda for THEOP. All rights reserved.
When Did You First Think When Did You First Think About Going To College?: All About Going To College?: All SeniorsSeniors
68
1116
61
16 19
53
14
27
71
916
0
10
20
30
40
50
60
70
80
90
White Black Hispanic AsianAlways or During Elementary School During Middle School During High School
Per
cen
t
Page 32
Copyright © 2003 Marta Tienda for THEOP. All rights reserved.
When Did You First Think When Did You First Think About Going To College?: Top About Going To College?: Top 10% Seniors10% Seniors83
84
67
19
10
71
11 14
85
7 7
0
10
20
30
40
50
60
70
80
90
White Black Hispanic Asian
Always or During Elementary School During Middle School During High School
Per
cen
t
Page 33
Copyright © 2003 Marta Tienda for THEOP. All rights reserved.
Intentions versus Intentions versus Attendance—who shows Attendance—who shows up on Campus?up on Campus?
Paper presented at policy conference in California with Kalena Cortes and Sunny Niu
Page 34
Copyright © 2003 Marta Tienda for THEOP. All rights reserved.
College Intentions by Demographic Group College Intentions by Demographic Group & Class Rank& Class Rank
Class Rank
10 % 11-20%
30-100%
Group Average
% Seniors who reported college plans
White 94 90 77 77
Black 90 89 70 72
Hispanic 89 81 62 62
Asian Pacific Islander 98 86 81 87
Page 35
Copyright © 2003 Marta Tienda for THEOP. All rights reserved.
Seniors:Seniors:Actualization of College PlansActualization of College Plans
Fulfillment:
2- or 4-year preference and enrollment Community college backup:
unspecified preference, enrolled 2-year Scaled back aspirations:
4-year preference, 2-year enrollment Understated intentions:
2-year or no preference, 4-year enrollment Dreams deferred:
2 or 4-year preference, no enrollment
Page 36
Copyright © 2003 Marta Tienda for THEOP. All rights reserved.
Actual Enrollment by IntentionsActual Enrollment by Intentions
Enrollment
Intentions No College 2-Year 4-Year Col %
No Plans 62 27 11 100 22
2-Year Only 24 72 4 100 5
2- & 4-Year 14 74 12 100 10
4-Year Only 7 17 76 100 50
College Bound 21 50 29 100 13
Average Share 22 33 46 100 Fulfillment Community college backup Scaled back aspirations
Understated intentions Dreams deferred
Page 37
Copyright © 2003 Marta Tienda for THEOP. All rights reserved.
Multivariate ResultsMultivariate Results
Knowledge of Law Timing of college orientation Class rank differentials Race/Ethnic differentials Factors that influence college choice
Page 38
Copyright © 2003 Marta Tienda for THEOP. All rights reserved.
Policy RecommendationsPolicy Recommendations
Calls to repeal legislation may be premature Raise enrollment rates of minority population,
especially Hispanics Strengthen institutional links
High school to college 2- to 4-year institutions
Make college affordable
Page 39
Copyright © 2003 Marta Tienda for THEOP. All rights reserved.
Should HB 588 be repealed Should HB 588 be repealed or modified? or modified? Do highly qualified students from the most
competitive high schools leave the state because they rank below the guaranteed admission threshold?
Do students “game the system” by transferring high schools to improve their rank standing?
What role does knowledge of HB588 play in college decision-making and type of institution attended?
Are capable students postponing college, and if so, who are these students?
Page 40
Copyright © 2003 Marta Tienda for THEOP. All rights reserved.
Policy Questions…Policy Questions…Sustainability: Taxing the carrying capacity of public flagships or expanding educational opportunity by creating more flagships?
Challenges: Has the balance of Inclusion, Opportunity, and Standards been compromised?
Criteria: Given the demography of Texas, is 10% the appropriate threshold? Should any criterion serve as an admission guarantee?
Page 41
Copyright © 2003 Marta Tienda for THEOP. All rights reserved.
Thank YouThank You
Texas Higher Education Opportunity Projectwww.texastop10.princeton.edu