53
10 - 1 Copyright © 2003 McGraw-Hill Ryerson Limited. All rights reserved.
| Date post: | 27-Mar-2015 |
| Category: |
Documents |
| Upload: | sarah-kidd |
| View: | 233 times |
| Download: | 3 times |
10 - 1
Copyright © 2003 McGraw-Hill Ryerson Limited. All rights reserved.
10 - 2
Copyright © 2003 McGraw-Hill Ryerson Limited. All rights reserved.
Define null and alternative hypothesis and hypothesis testing
Define Type I and Type II errors
Describe the five-step hypothesis testing procedure
Distinguish between a one-tailed and a two-tailed test of hypothesis
When you have completed this chapter, you will be able to:
10 - 3
Copyright © 2003 McGraw-Hill Ryerson Limited. All rights reserved.
Conduct a test of hypothesis about a population mean
Conduct a test of hypothesis about a population proportion
Explain the relationship between hypothesis testing and confidence interval estimation
Compute the probability of a Type II error, and power of a test
10 - 4
Copyright © 2003 McGraw-Hill Ryerson Limited. All rights reserved.
Terminology
Hypothesis…is a statement about a population distribution such that:
ExamplesExamples …the mean monthly income for all systems analysts is $3569.
…the mean monthly income for all systems analysts is $3569.
…35% of all customers buying coffee at Tim Horton’s return within a week.
…35% of all customers buying coffee at Tim Horton’s return within a week.
(i) it is either true or false, but never both, and(ii) with full knowledge of the population data, it is possible to identify, with certainty,
whether it is true or false.
10 - 5
Copyright © 2003 McGraw-Hill Ryerson Limited. All rights reserved.
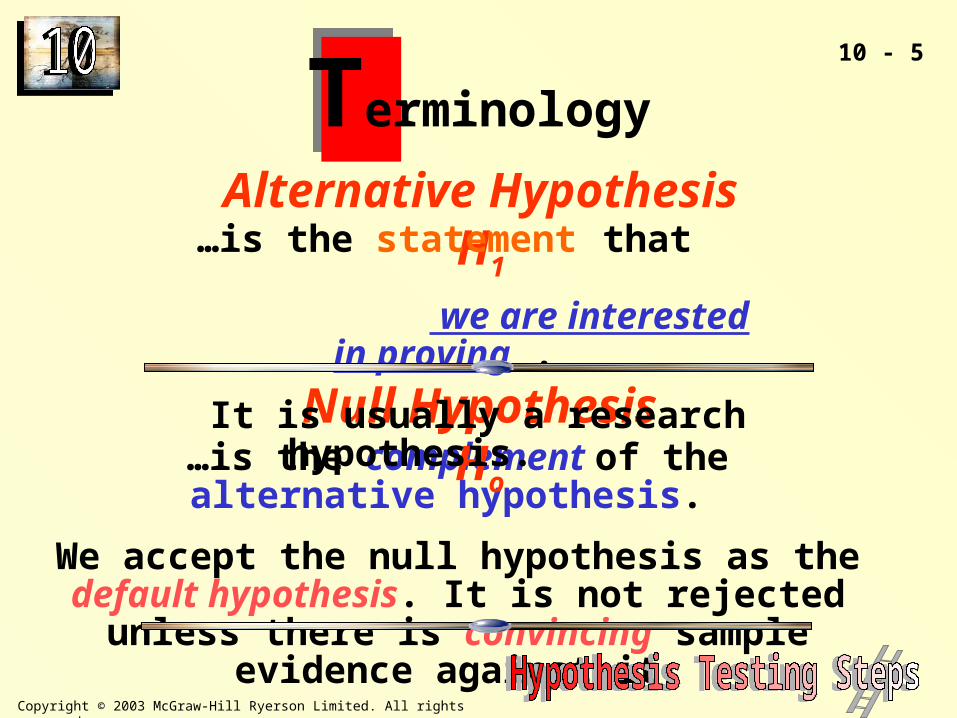
Terminology
…is the complement of the alternative hypothesis.
We accept the null hypothesis as the default hypothesis. It is not rejected unless there is
convincing sample evidence against it.
Null Hypothesis Ho
Alternative Hypothesis H1…is the statement that we are interested in proving
.
It is usually a research hypothesis.
10 - 6
Copyright © 2003 McGraw-Hill Ryerson Limited. All rights reserved.
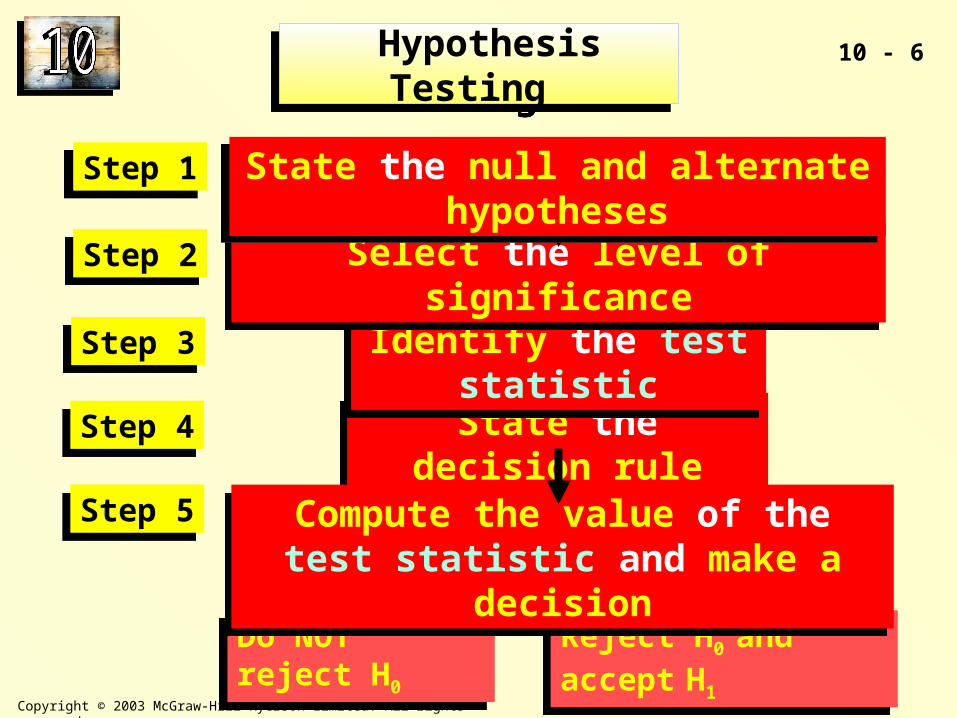
State the decision ruleState the decision rule
Identify the test statisticIdentify the test statistic
Do NOT reject H0Do NOT reject H0 Reject H0 and accept H1
Reject H0 and accept H1
Compute the value of the test statistic and make a decision
Compute the value of the test statistic and make a decision
Step 1Step 1
Select the level of significanceSelect the level of significanceStep 2Step 2
Step 3Step 3
Step 4Step 4
Step 5Step 5
Hypothesis Testing Hypothesis Testing
State the null and alternate hypothesesState the null and alternate hypotheses
10 - 7
Copyright © 2003 McGraw-Hill Ryerson Limited. All rights reserved.
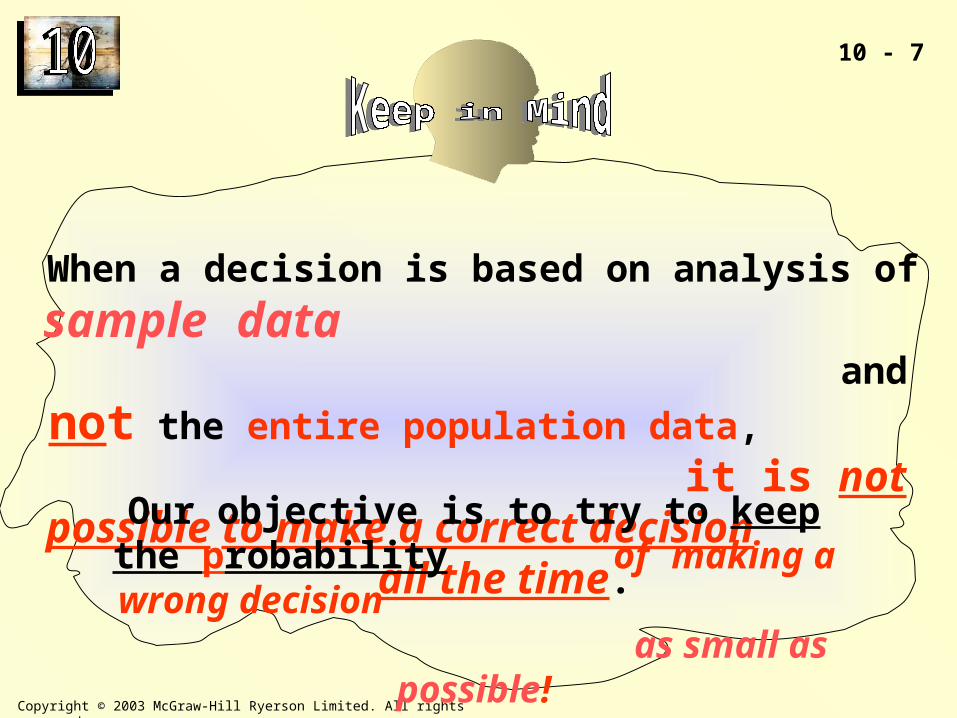
When a decision is based on analysis of sample data
and not the entire
population data, it is not possible to make a correct decision all the time.
Our objective is to try to keep the probability of making a wrong decision
as small as possible!

10 - 8
Copyright © 2003 McGraw-Hill Ryerson Limited. All rights reserved.
Let’s look at the Canadian legal system for an analogy...Let’s look at the Canadian legal system for an analogy...
1. …the accused person is innocent
2. …the accused person is guilty
Two hypotheses:
After hearing from both the prosecution and the defence, a decision is made, declaring the accused either:
After hearing from both the prosecution and the defence, a decision is made, declaring the accused either:
Innocent! But do the courts always make the “right”
decision?Guilty!
10 - 9
Copyright © 2003 McGraw-Hill Ryerson Limited. All rights reserved.
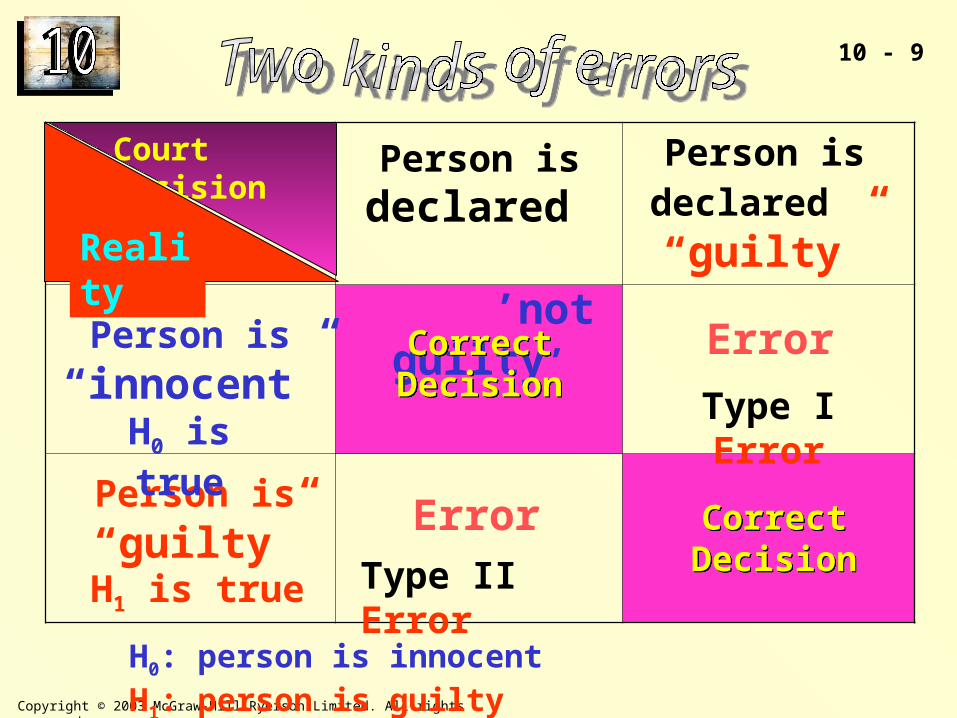
Person is “innocent”
Person is “guilty”
Person is declared
’not guilty’
Person is declared “guilty”
Correct DecisionCorrect Decision
Correct DecisionCorrect Decision
Error
Error
H0: person is innocent H1: person is guilty
H0 is true
H1 is true Type II Error
Type I Error
Court Decision
Reality
10 - 10
Copyright © 2003 McGraw-Hill Ryerson Limited. All rights reserved.
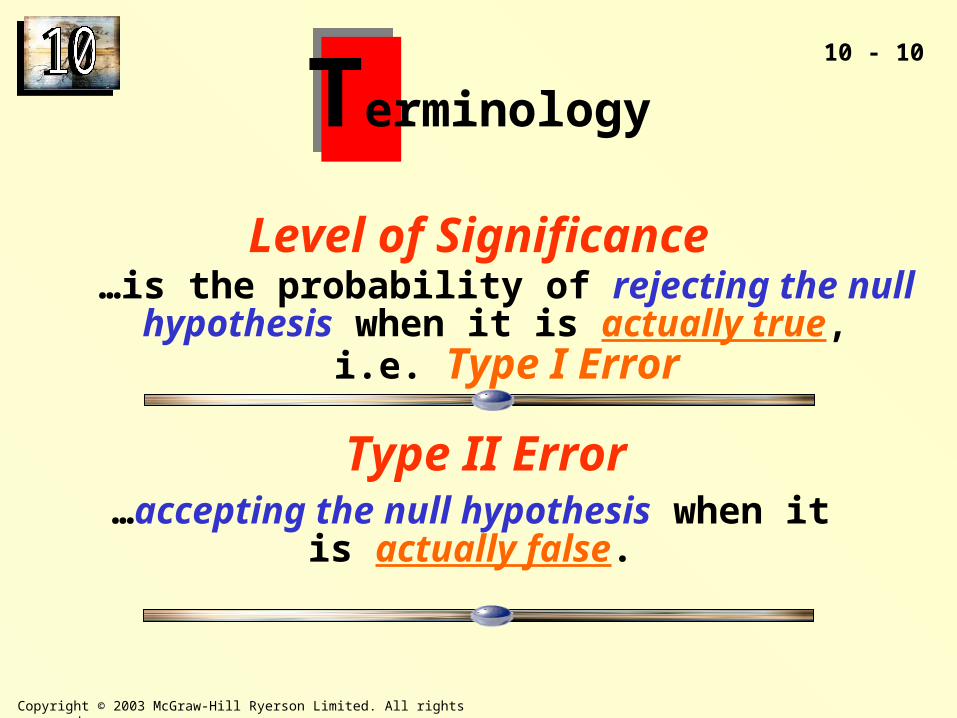
Terminology
Level of Significance…is the probability of rejecting the null hypothesis
when it is actually true, i.e. Type I Error
…accepting the null hypothesis when it is actually false.
Type II Error
10 - 11
Copyright © 2003 McGraw-Hill Ryerson Limited. All rights reserved.
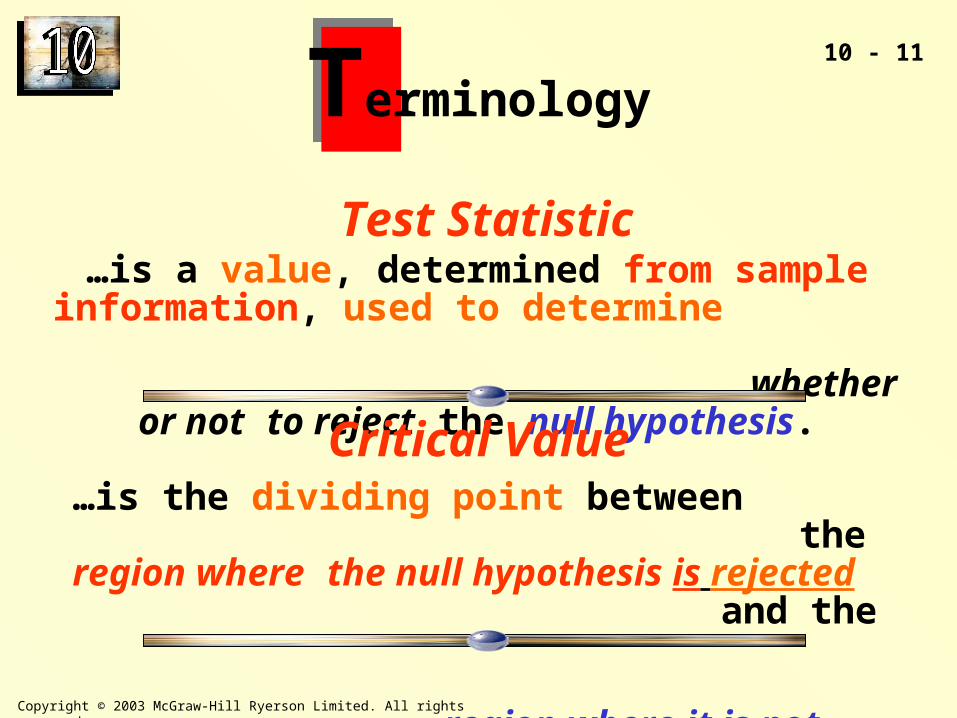
Terminology
Test Statistic…is a value, determined from sample information,
used to determine whether or not to reject the null hypothesis.
Critical Value…is the dividing point between the region where the null hypothesis is rejected and the region where it is not rejected.
10 - 12
Copyright © 2003 McGraw-Hill Ryerson Limited. All rights reserved.
TestsTests
10 - 13
Copyright © 2003 McGraw-Hill Ryerson Limited. All rights reserved.
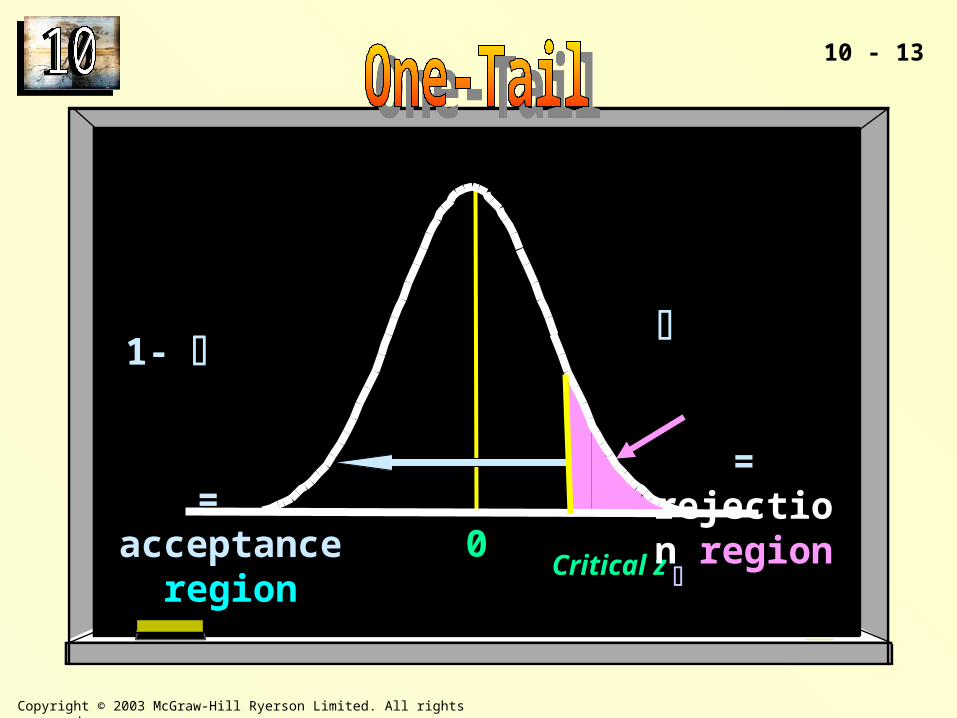
0Critical z
=
rejection region
1- =
acceptance region
10 - 14
Copyright © 2003 McGraw-Hill Ryerson Limited. All rights reserved.
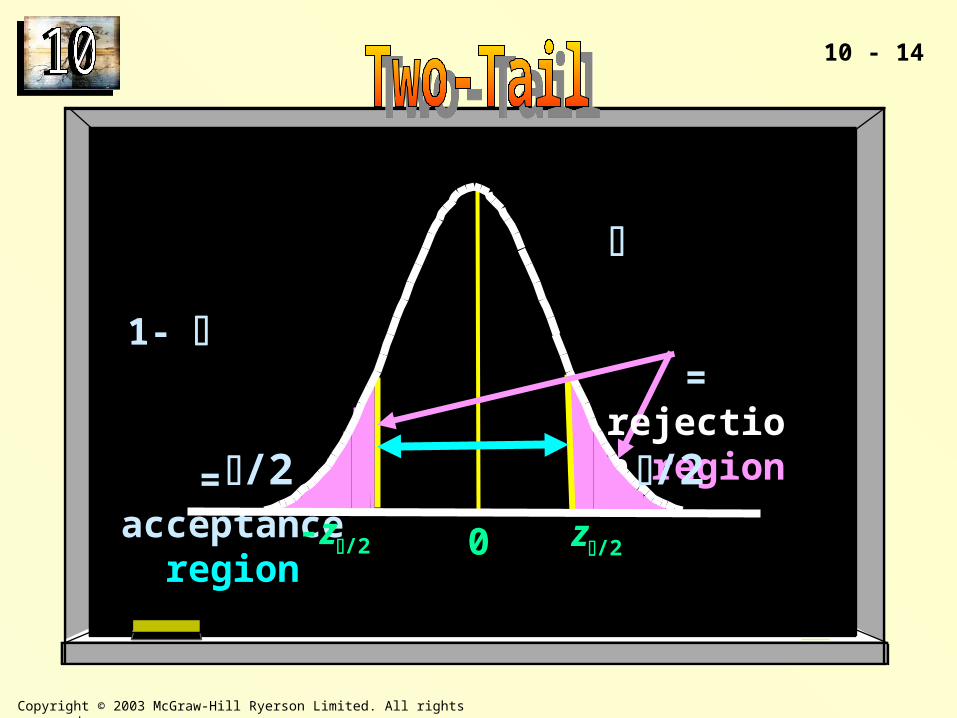
0
=
rejection region
1- =
acceptance region
z/2-z/2
/2 /2
10 - 15
Copyright © 2003 McGraw-Hill Ryerson Limited. All rights reserved.
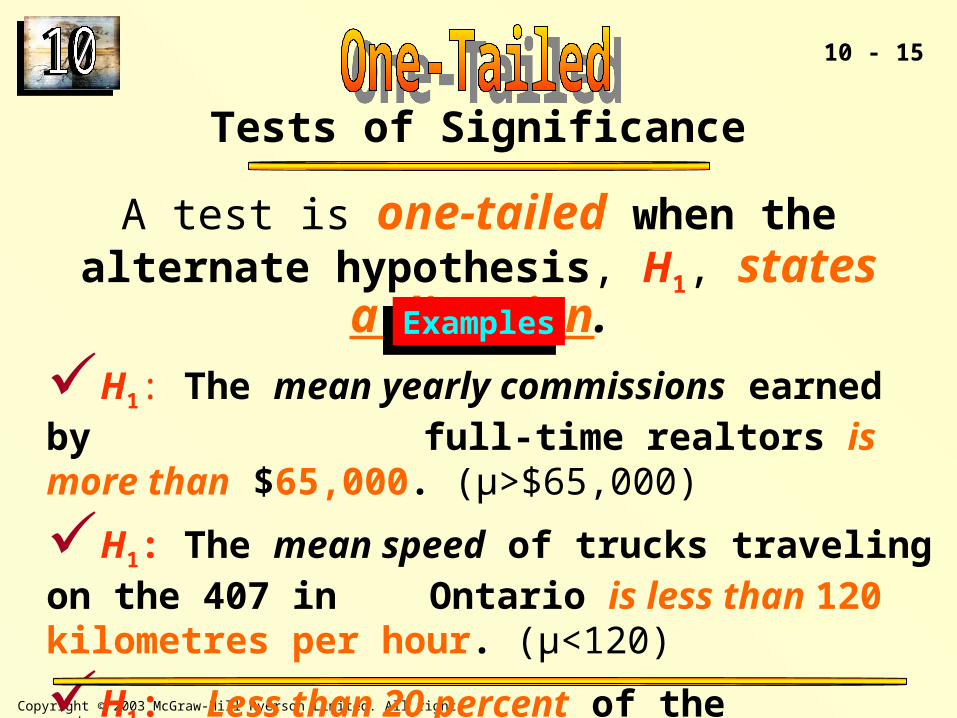
A test is one-tailed when the alternate hypothesis, H1, states a direction.
H1: The mean yearly commissions earned by full-time realtors is more than $65,000. (µ>$65,000)
H1: The mean speed of trucks traveling on the 407 in Ontario is less than 120 kilometres per hour.
(µ<120)
H1: Less than 20 percent of the customers pay cash for their gasoline purchase. (p<.20)
ExamplesExamples
Tests of Significance
10 - 16
Copyright © 2003 McGraw-Hill Ryerson Limited. All rights reserved.
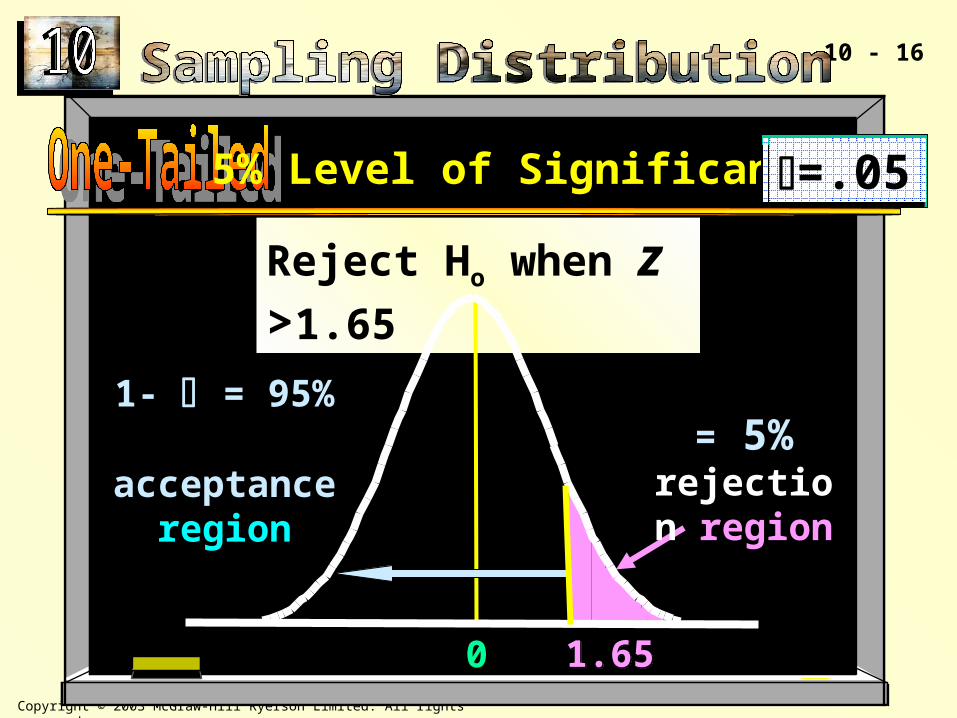
5% Level of Significance =.05=.05
Reject Ho when z >1.65Reject Ho when z >1.65
0
= 5% rejection
region
1- = 95% acceptance
region
1.651.65
10 - 17
Copyright © 2003 McGraw-Hill Ryerson Limited. All rights reserved.
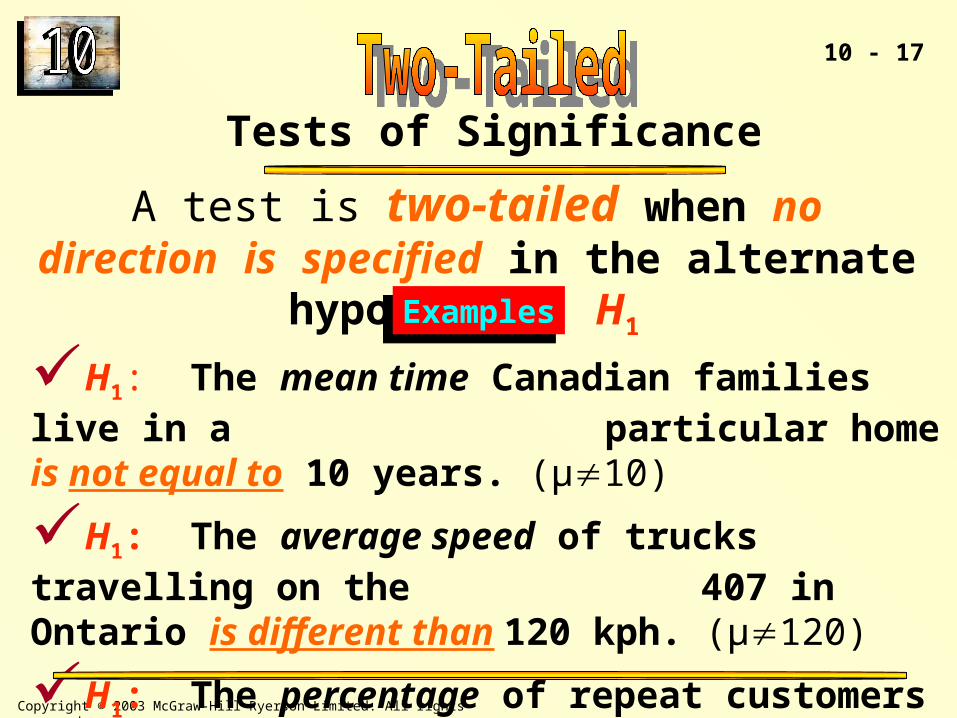
A test is two-tailed when no direction is specified in the alternate hypothesis, H1
H1: The mean time Canadian families live in a particular home is not equal to 10
years. (µ10)
H1: The average speed of trucks travelling on the 407 in Ontario is different than 120 kph.
(µ120)
H1: The percentage of repeat customers within a week at Tim Horton’s is not 50%. (p .50)
ExamplesExamples
Tests of Significance
10 - 18
Copyright © 2003 McGraw-Hill Ryerson Limited. All rights reserved.
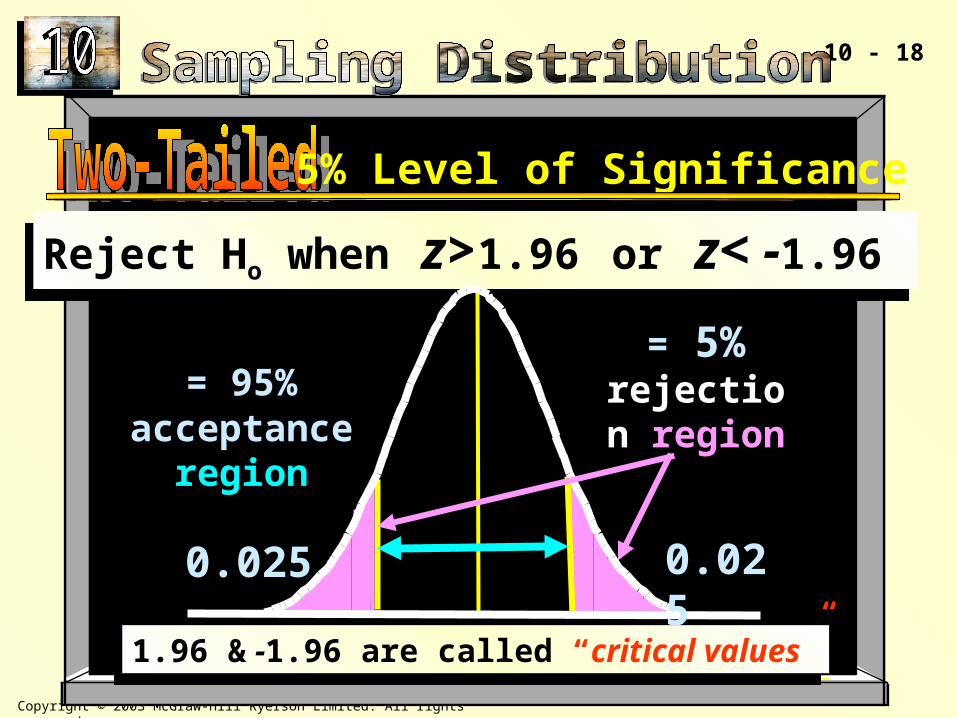
5% Level of Significance
Reject Ho when z>1.96 or z< -1.96 Reject Ho when z>1.96 or z< -1.96
= 5% rejection
region
= 95% acceptance
region
0.025 0.025
1.96 & -1.96 are called “critical values”1.96 & -1.96 are called “critical values”
10 - 19
Copyright © 2003 McGraw-Hill Ryerson Limited. All rights reserved.
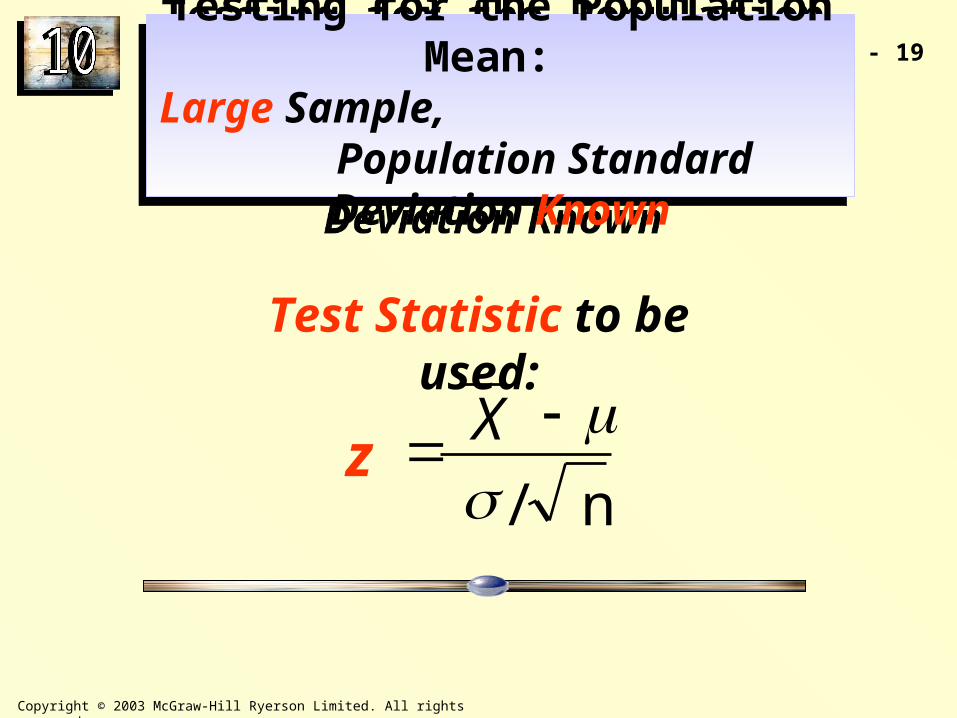
Testing for the Population Mean: Large Sample,
Population Standard Deviation Known
Testing for the Population Mean: Large Sample,
Population Standard Deviation Known
Test Statistic to be used:
n/
Xz
10 - 20
Copyright © 2003 McGraw-Hill Ryerson Limited. All rights reserved.
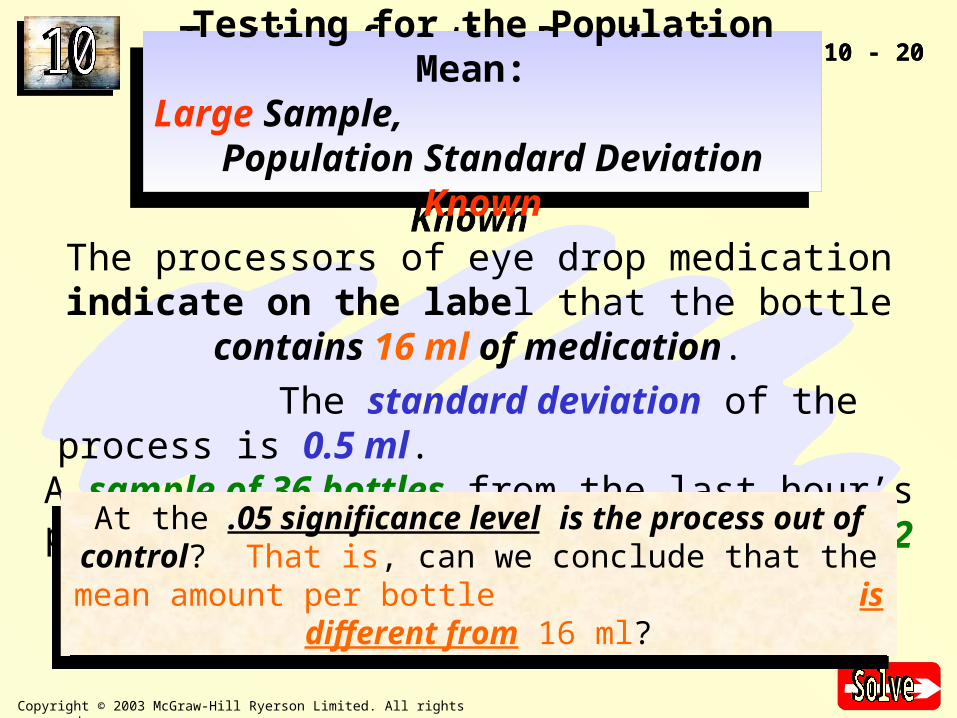
Testing for the Population Mean: Large Sample, Population Standard Deviation Known
Testing for the Population Mean: Large Sample, Population Standard Deviation Known
The processors of eye drop medication indicate on the label that the bottle contains 16 ml of medication.
The standard deviation of the process is 0.5 ml. A sample of 36 bottles from the last hour’s
production revealed a mean weight of 16.12 ml per bottle.
10 - 20
At the .05 significance level is the process out of control? That is, can we conclude that the mean amount per bottle
is different from 16 ml?
At the .05 significance level is the process out of control? That is, can we conclude that the mean amount per bottle
is different from 16 ml?
10 - 21
Copyright © 2003 McGraw-Hill Ryerson Limited. All rights reserved.
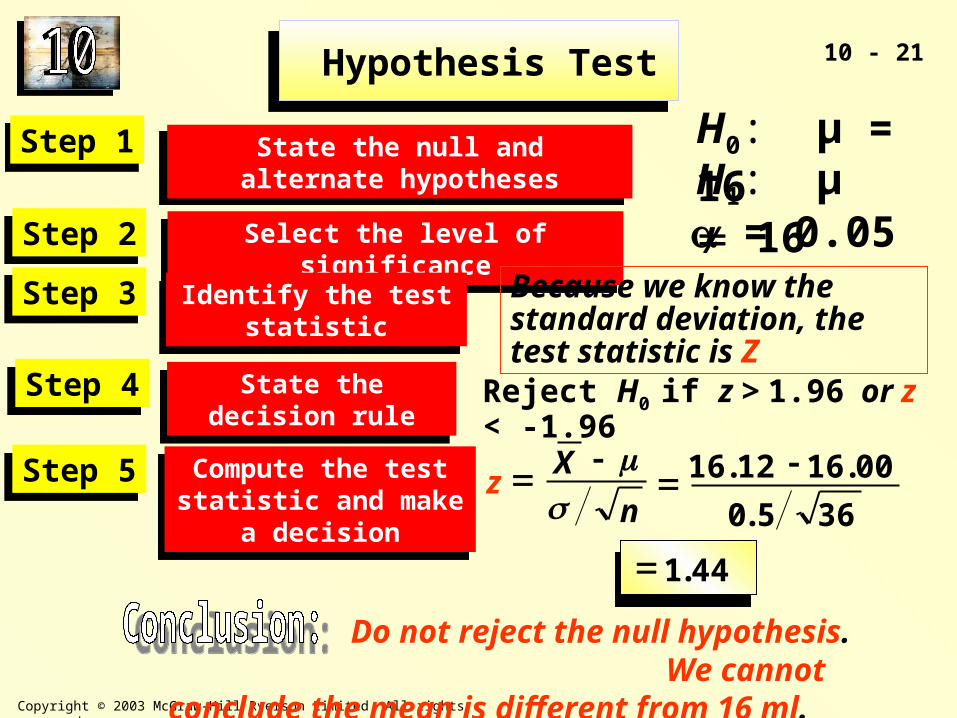
Hypothesis Test Hypothesis Test
State the null and alternate hypothesesState the null and alternate hypothesesStep 1Step 1
Select the level of significanceSelect the level of significanceStep 2Step 2
Identify the test statisticIdentify the test statisticStep 3Step 3
State the decision ruleState the decision ruleStep 4Step 4
Compute the test statistic and make a decision
Compute the test statistic and make a decision
Step 5Step 5
H0: µ = 16 H1: µ 16 = 0.05
Because we know the standard deviation, the test statistic is Z
Reject H0 if z > 1.96 or z < -1.96
44.1
365.0
00.1612.16
n
Xz
Do not reject the null hypothesis. We cannot conclude the mean is different from 16 ml.
10 - 22
Copyright © 2003 McGraw-Hill Ryerson Limited. All rights reserved.
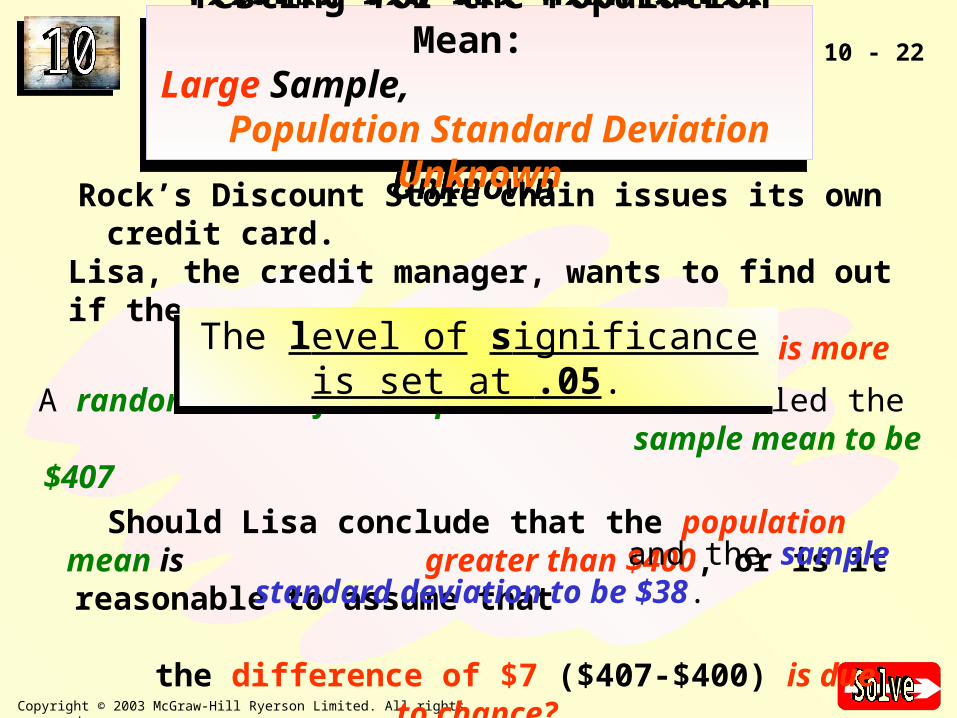
Testing for the Population Mean: Large Sample, Population Standard Deviation Unknown
Testing for the Population Mean: Large Sample, Population Standard Deviation Unknown
Rock’s Discount Store chain issues its own credit card. Lisa, the credit manager, wants to find out if the
mean monthly unpaid balance is more than $400.
Should Lisa conclude that the population mean is greater than $400, or is it reasonable to assume that the difference of $7 ($407-
$400) is due to chance?
A random check of 172 unpaid balances revealed the sample mean to be $407 and the sample standard deviation
to be $38.
The level of significance is set at .05. The level of significance is set at .05.
10 - 23
Copyright © 2003 McGraw-Hill Ryerson Limited. All rights reserved.
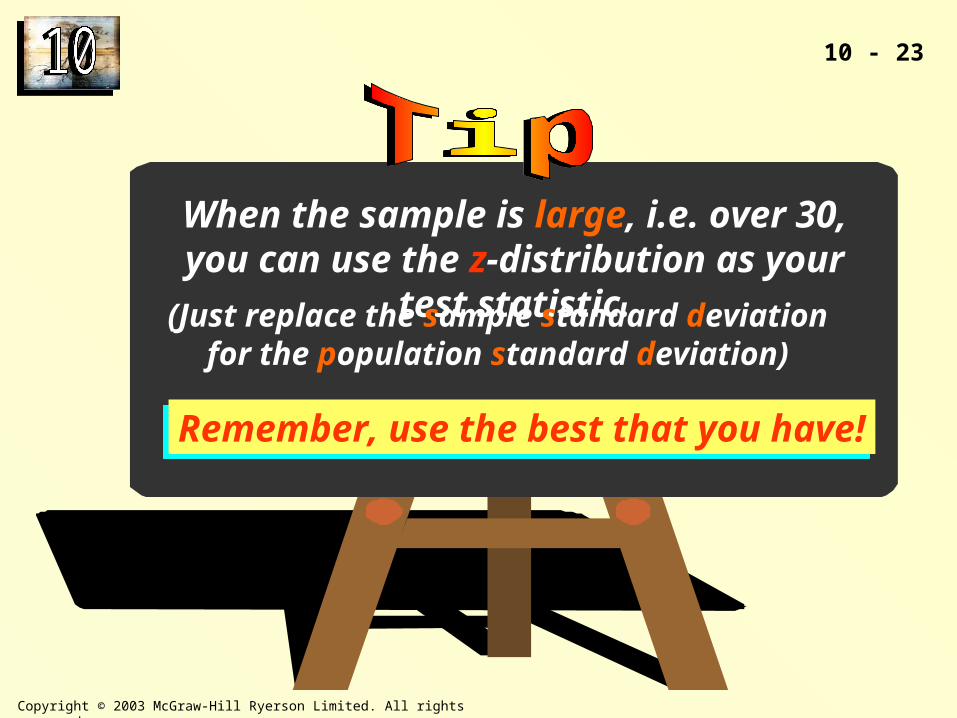
When the sample is large, i.e. over 30, you can use the z-distribution as your test statistic.
Remember, use the best that you have!Remember, use the best that you have!
(Just replace the sample standard deviation for the population standard deviation)
10 - 24
Copyright © 2003 McGraw-Hill Ryerson Limited. All rights reserved.
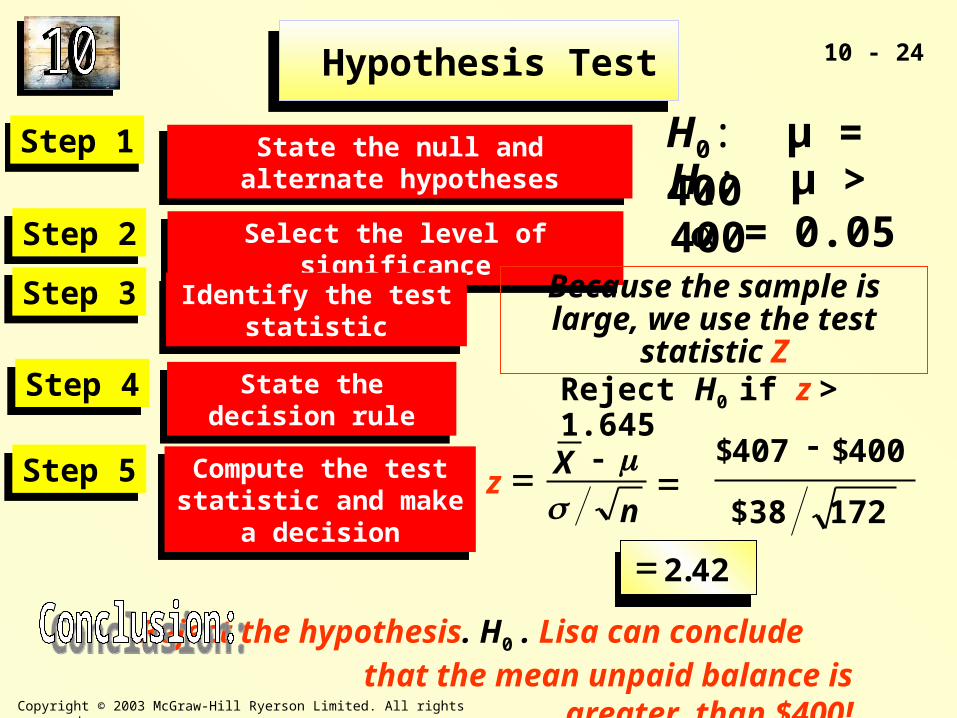
Hypothesis Test Hypothesis Test
State the null and alternate hypothesesState the null and alternate hypothesesStep 1Step 1
Select the level of significanceSelect the level of significanceStep 2Step 2
Identify the test statisticIdentify the test statisticStep 3Step 3
State the decision ruleState the decision ruleStep 4Step 4
Compute the test statistic and make a decision
Compute the test statistic and make a decision
Step 5Step 5
H0: µ = 400 H1: µ > 400 = 0.05
Because the sample is large, we use the test statistic Z
Reject H0 if z > 1.645
42.2
n
Xz
Reject the hypothesis. H0 . Lisa can conclude that the mean unpaid balance is greater than
$400!
17238$
400$407$
10 - 25
Copyright © 2003 McGraw-Hill Ryerson Limited. All rights reserved.
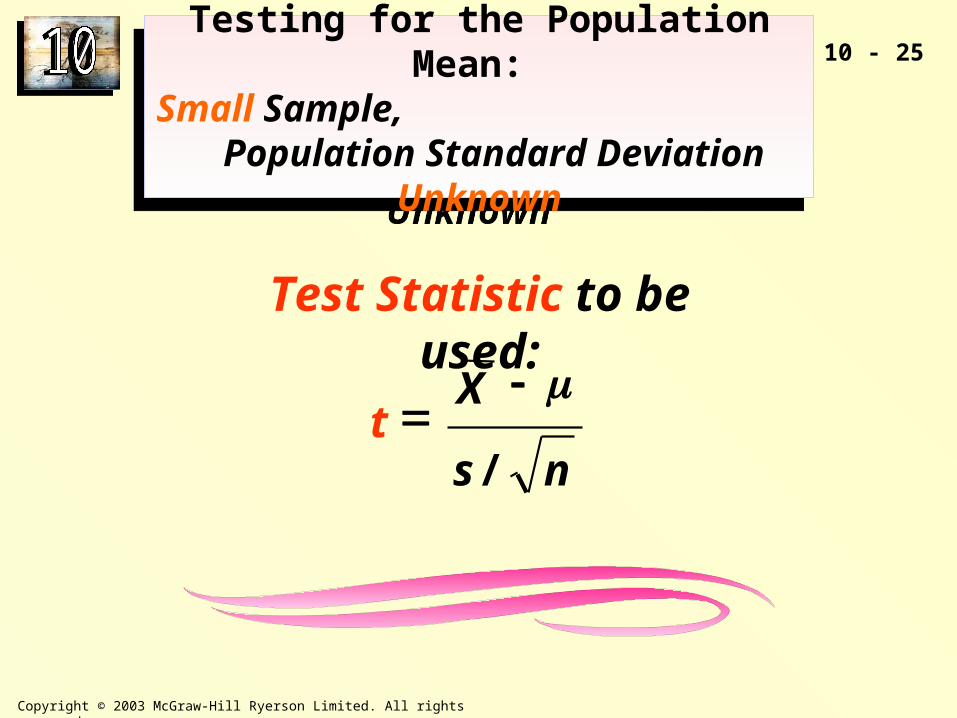
Test Statistic to be used:
Testing for the Population Mean: Small Sample, Population Standard Deviation Unknown
Testing for the Population Mean: Small Sample, Population Standard Deviation Unknown
ns
Xt
/
10 - 26
Copyright © 2003 McGraw-Hill Ryerson Limited. All rights reserved.
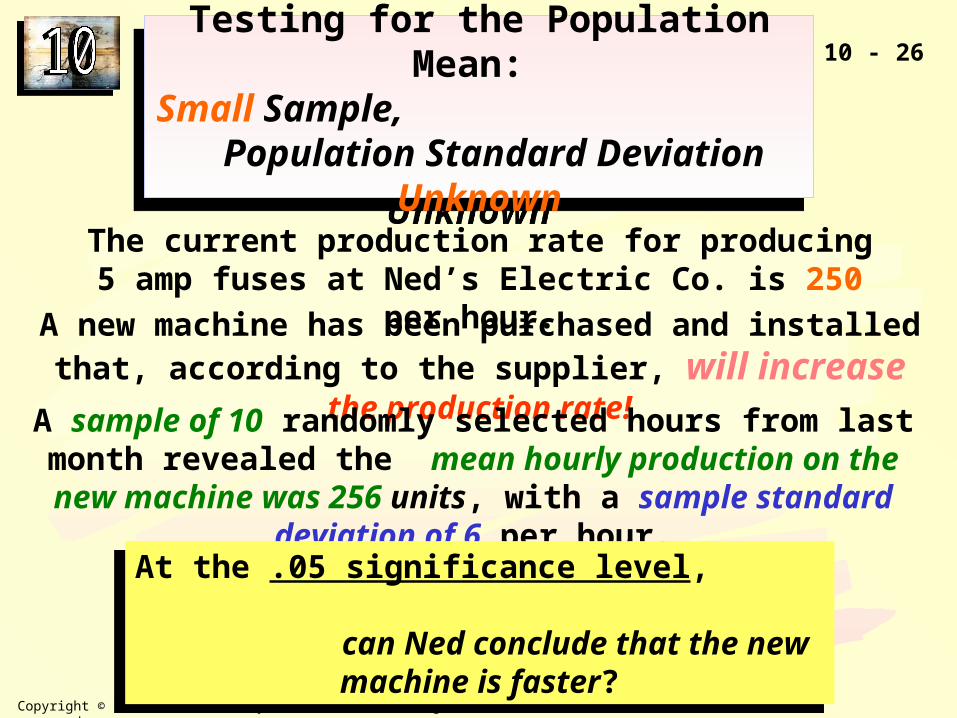
The current production rate for producing 5 amp fuses at Ned’s Electric Co. is 250 per hour.
Testing for the Population Mean: Small Sample, Population Standard Deviation Unknown
Testing for the Population Mean: Small Sample, Population Standard Deviation Unknown
A new machine has been purchased and installed that, according to the supplier, will increase the production rate!
A sample of 10 randomly selected hours from last month revealed the mean hourly production on the new machine was 256 units,
with a sample standard deviation of 6 per hour.
At the .05 significance level, can Ned conclude that the new machine is
faster?
At the .05 significance level, can Ned conclude that the new machine is
faster?
10 - 27
Copyright © 2003 McGraw-Hill Ryerson Limited. All rights reserved.
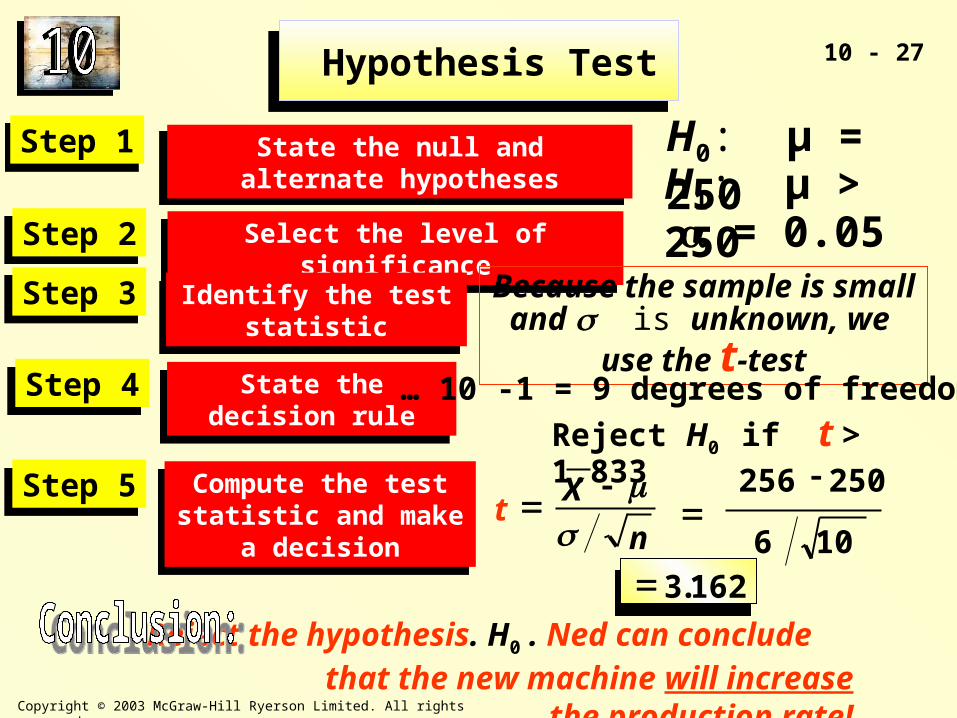
Hypothesis Test Hypothesis Test
State the null and alternate hypothesesState the null and alternate hypothesesStep 1Step 1
Select the level of significanceSelect the level of significanceStep 2Step 2
Identify the test statisticIdentify the test statisticStep 3Step 3
State the decision ruleState the decision ruleStep 4Step 4
Compute the test statistic and make a decision
Compute the test statistic and make a decision
Step 5Step 5
H0: µ = 250 H1: µ > 250 = 0.05
Because the sample is small and is unknown, we use the t-test
Reject H0 if t > 1.833
162.3
n
Xt
Reject the hypothesis. H0 . Ned can conclude that the new machine will increase the
production rate!
106
250256
… 10 -1 = 9 degrees of freedom
10 - 28
Copyright © 2003 McGraw-Hill Ryerson Limited. All rights reserved.
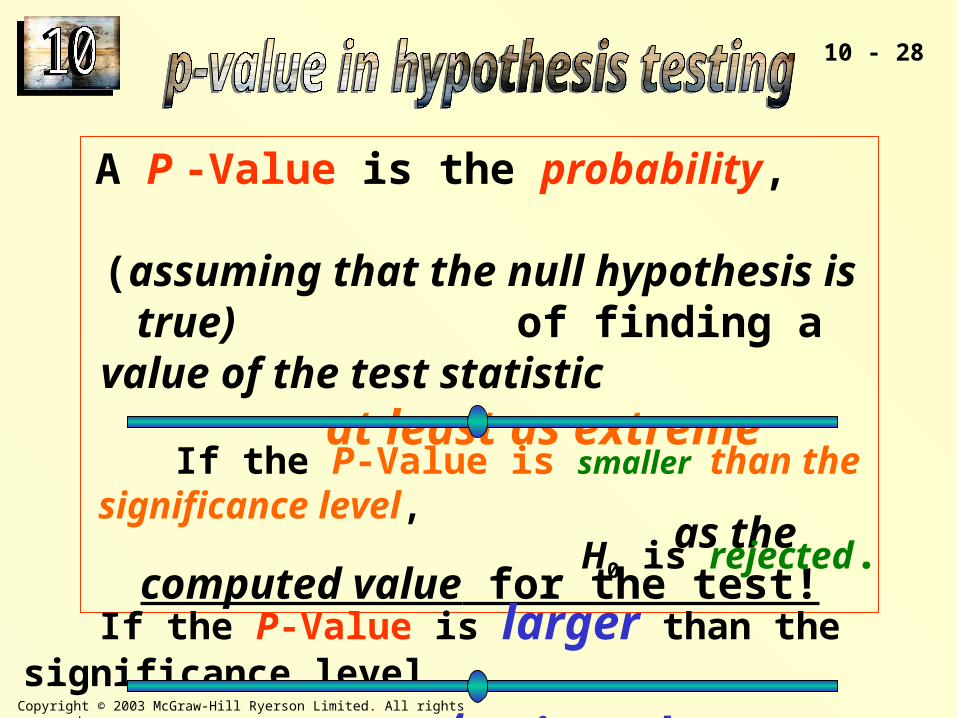
A P -Value is the probability, (assuming that the null hypothesis is true) of finding a value of the test statistic at least as extreme as the computed value
for the test!If the P-Value is smaller than the significance level,
H0 is rejected.
If the P-Value is larger than the significance level,
H0 is not rejected.
10 - 29
Copyright © 2003 McGraw-Hill Ryerson Limited. All rights reserved.
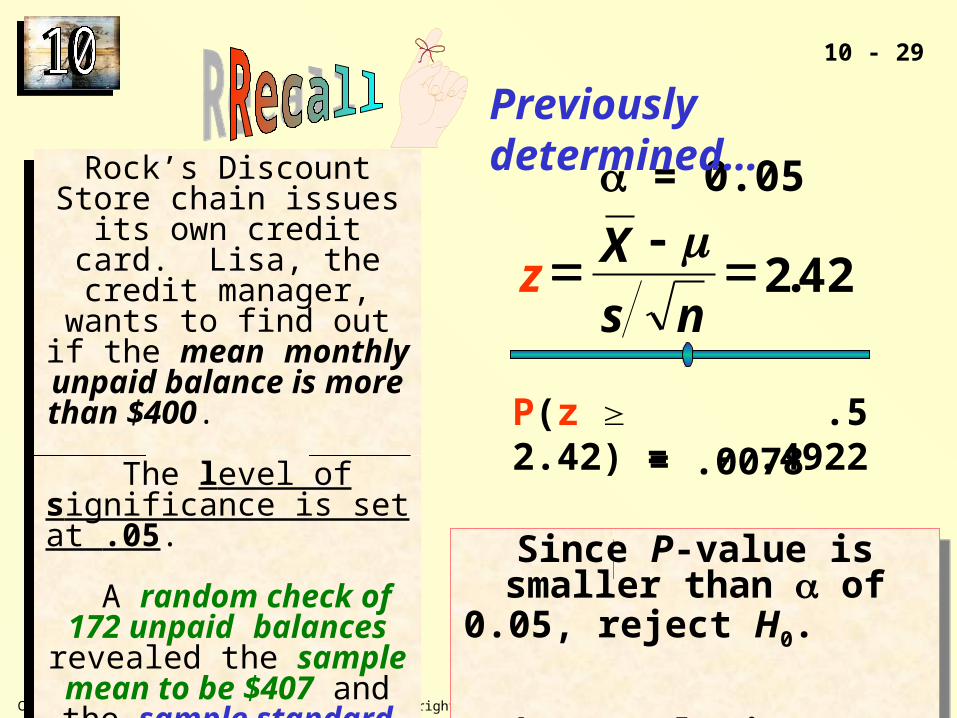
Since P-value is smaller than of 0.05, reject H0.
The population mean is greater
than $400.
Since P-value is smaller than of 0.05, reject H0.
The population mean is greater
than $400.
Rock’s Discount Store chain issues its own credit card. Lisa, the credit manager, wants to find out if the mean monthly unpaid
balance is more than $400. The level of significance is set at .05.
A random check of 172
unpaid balances revealed the sample mean to be $407
and the sample standard deviation to be $38.
Should Lisa conclude that the
population mean is greater than $400?
= 0.05
P(z 2.42) =
Previously determined…
.5 - .4922 = .0078
42.2
ns
Xz
10 - 30
Copyright © 2003 McGraw-Hill Ryerson Limited. All rights reserved.
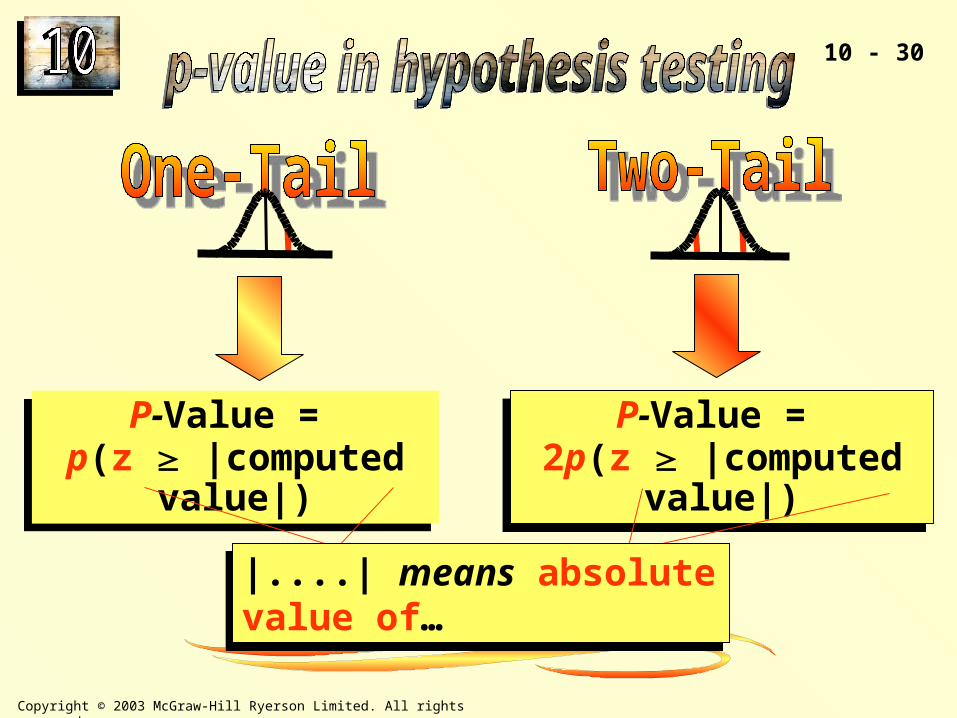
P-Value = p(z |computed value|)
P-Value = p(z |computed value|)
P-Value = 2p(z |computed value|)
P-Value = 2p(z |computed value|)
|....| means absolute value of…|....| means absolute value of…
10 - 31
Copyright © 2003 McGraw-Hill Ryerson Limited. All rights reserved.
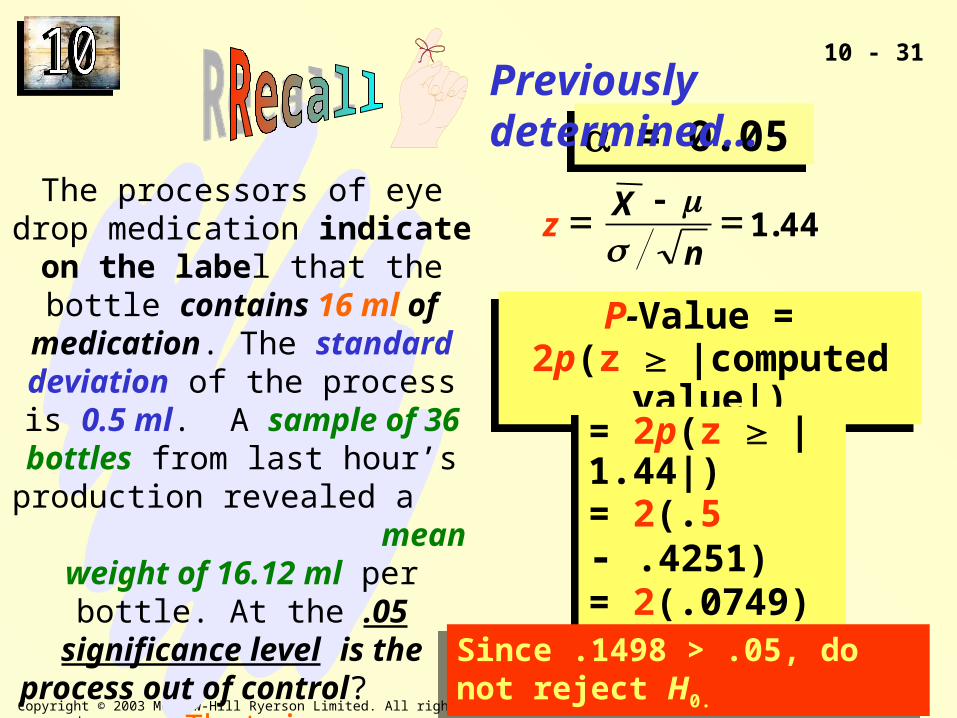
The processors of eye drop medication indicate on the label that the bottle contains 16 ml of
medication. The standard deviation of the process is 0.5 ml. A sample of 36 bottles from last
hour’s production revealed a mean weight of 16.12 ml per bottle. At the .05 significance level is the process out of control? That is, can we conclude that the mean amount per bottle is different from 16
ml?
= 0.05 = 0.05Previously determined…
P-Value = 2p(z |computed value|)
P-Value = 2p(z |computed value|)
= 2p(z |1.44|)= 2(.5 - .4251)= 2(.0749)= .1498
= 2p(z |1.44|)= 2(.5 - .4251)= 2(.0749)= .1498
Since .1498 > .05, do not reject H0.Since .1498 > .05, do not reject H0.
44.1
n
Xz
10 - 32
Copyright © 2003 McGraw-Hill Ryerson Limited. All rights reserved.
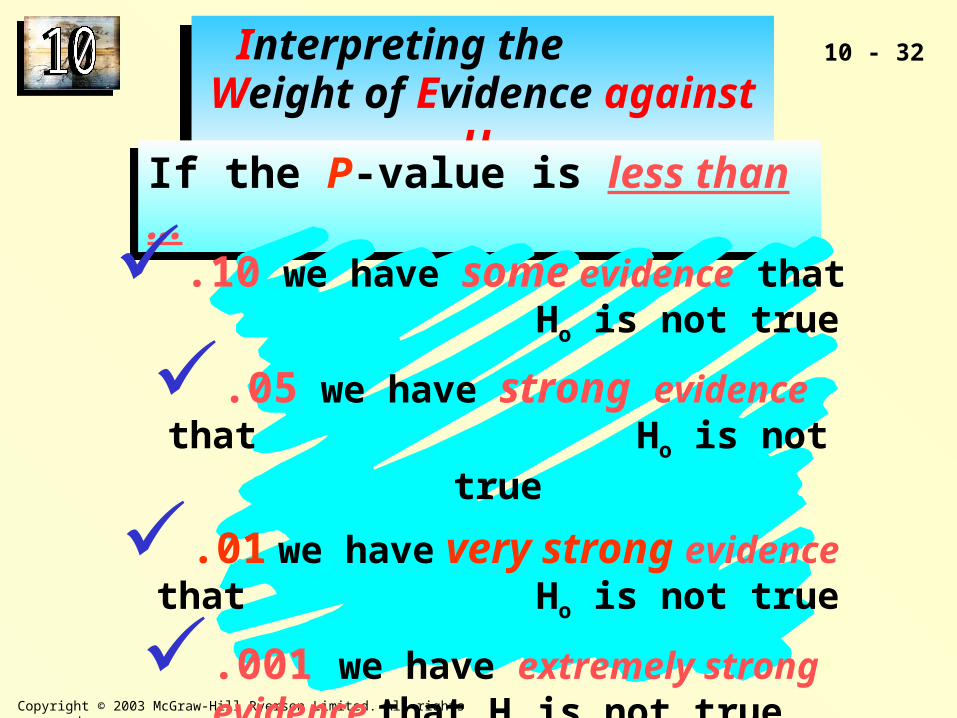
Interpreting the Weight of Evidence against Ho
Interpreting the Weight of Evidence against Ho
If the P-value is less than …If the P-value is less than …
.10 we have some evidence that Ho is not true
.05 we have strong evidence that Ho is not true
.01 we have very strong evidence that Ho is not true
.001 we have extremely strong evidence that Ho is not true
10 - 33
Copyright © 2003 McGraw-Hill Ryerson Limited. All rights reserved.
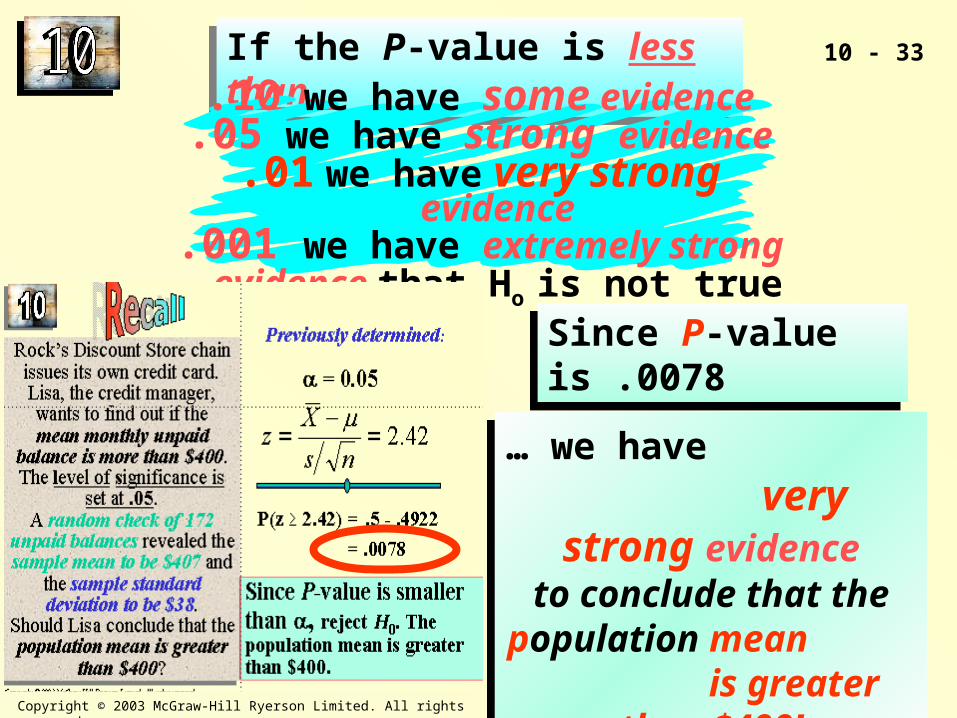
If the P-value is less than…If the P-value is less than….10 we have some evidence.05 we have strong evidence
.01 we have very strong evidence.001 we have extremely strong evidence
that Ho is not true
Since P-value is .0078Since P-value is .0078
… we have very strong
evidenceto conclude that the
population mean is greater than
$400!
… we have very strong
evidenceto conclude that the
population mean is greater than
$400!
10 - 34
Copyright © 2003 McGraw-Hill Ryerson Limited. All rights reserved.
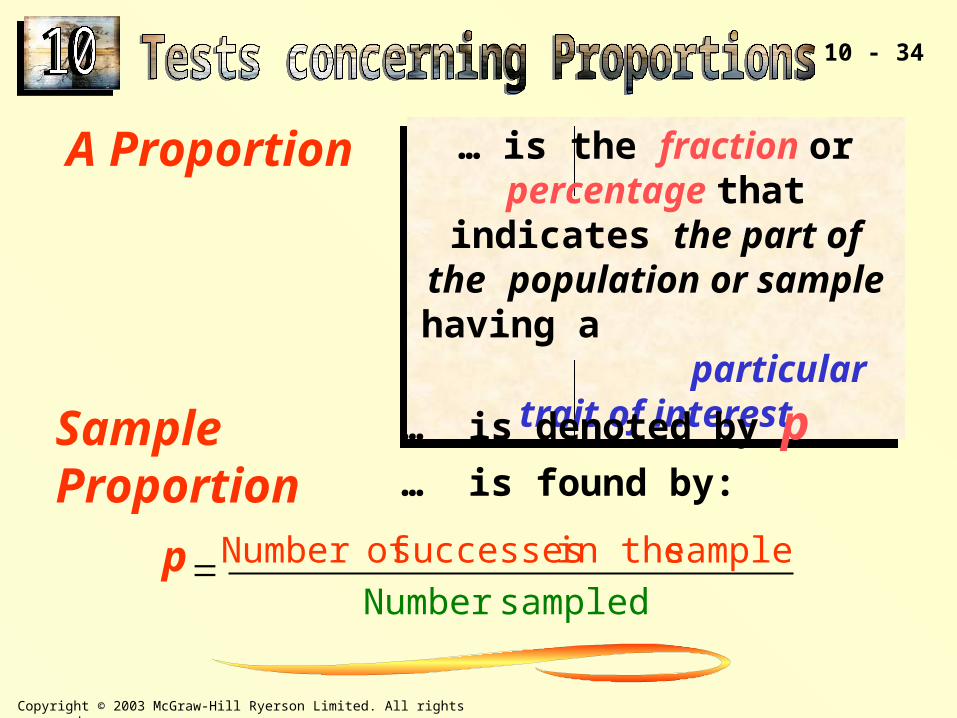
… is the fraction or percentage that indicates the
part of the population or sample having a
particular trait of interest
… is the fraction or percentage that indicates the
part of the population or sample having a
particular trait of interest
A Proportion
… is denoted by p … is found by:
Sample Proportion
sampledNumber
sample in the successes ofNumber p
10 - 35
Copyright © 2003 McGraw-Hill Ryerson Limited. All rights reserved.
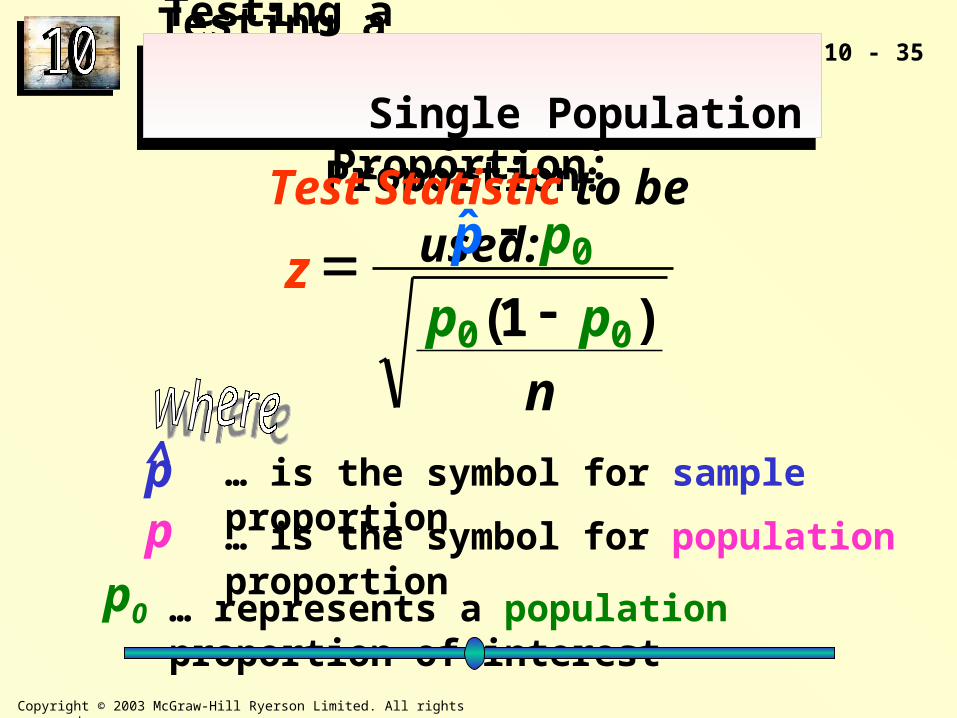
Testing a Single Population Proportion:
Testing a Single Population Proportion:
Test Statistic to be used:
… is the symbol for sample proportion
… is the symbol for population proportionpp̂
p0 … represents a population proportion of interest
n
pp
ppz
)1(
ˆ
00
0
10 - 36
Copyright © 2003 McGraw-Hill Ryerson Limited. All rights reserved.
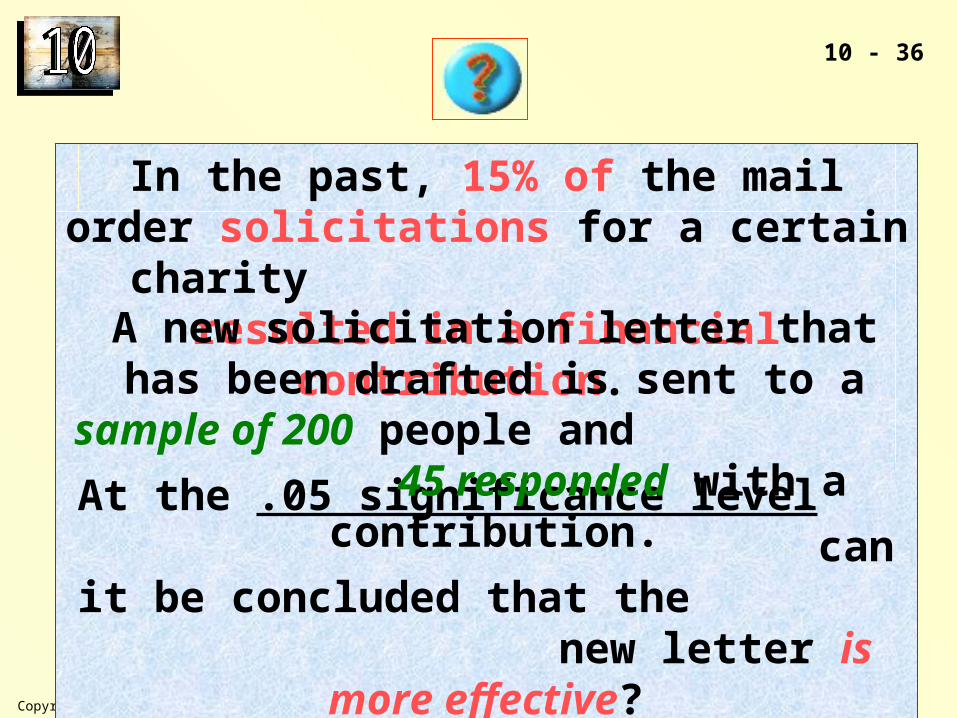
In the past, 15% of the mail order solicitations for a certain charity
resulted in a financial contribution.
At the .05 significance level can it be concluded that the
new letter is more effective?
A new solicitation letter that has been drafted is sent to a sample of 200 people and
45 responded with a contribution.
10 - 37
Copyright © 2003 McGraw-Hill Ryerson Limited. All rights reserved.
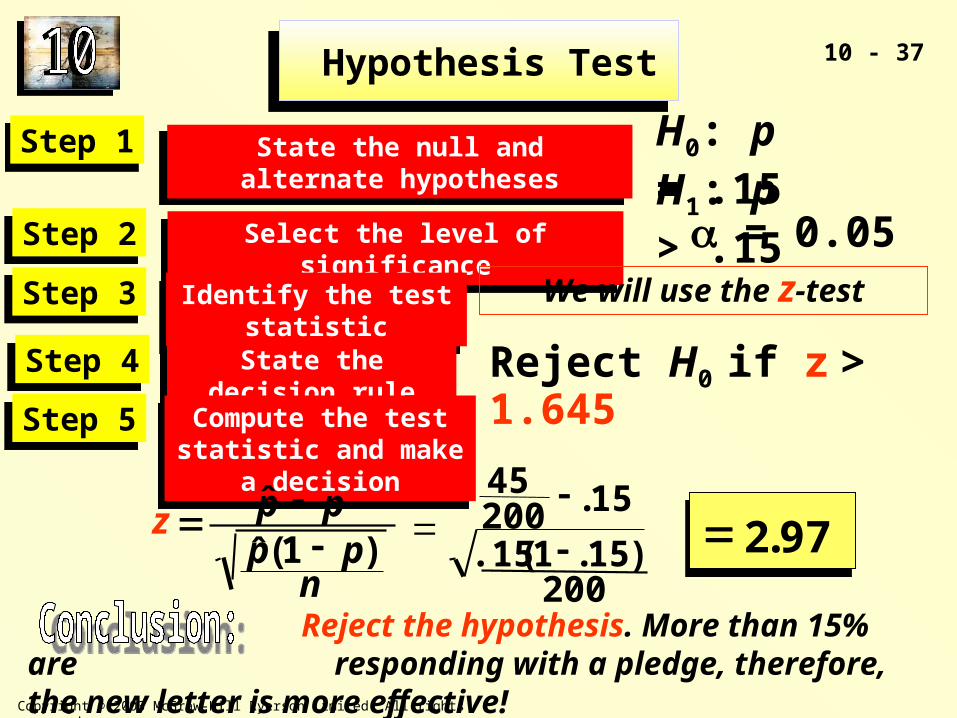
Hypothesis Test Hypothesis Test
State the null and alternate hypothesesState the null and alternate hypothesesStep 1Step 1
Select the level of significanceSelect the level of significanceStep 2Step 2
Identify the test statisticIdentify the test statisticStep 3Step 3
State the decision ruleState the decision ruleStep 4Step 4
Compute the test statistic and make a decision
Compute the test statistic and make a decision
Step 5Step 5
= 0.05We will use the z-test
Reject the hypothesis. More than 15% are responding with a pledge, therefore, the new letter is more effective!
H1: p > .15
H0: p = .15
Reject H0 if z > 1.645
ppz ˆ
npp )1(ˆ
200)15.1(.15
20045 15.
97.2
10 - 38
Copyright © 2003 McGraw-Hill Ryerson Limited. All rights reserved.
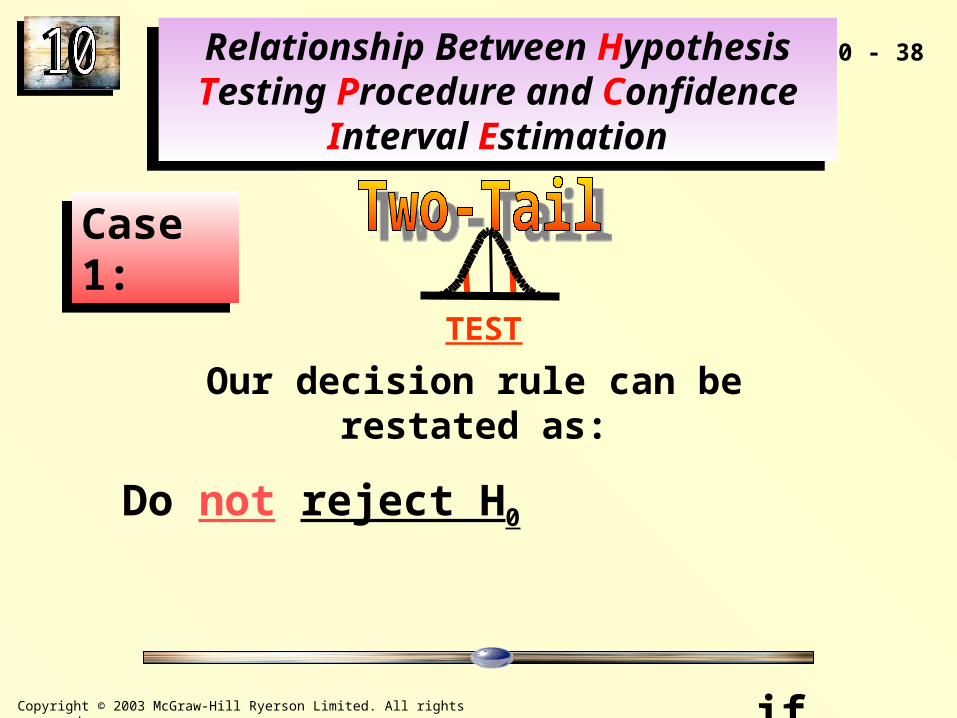
Relationship Between Hypothesis Testing Procedure and Confidence Interval
Estimation
Relationship Between Hypothesis Testing Procedure and Confidence Interval
Estimation
Case 1:Case 1:
Our decision rule can be restated as:
Do not reject H0 if 0 lies in the (1-) confidence
interval estimate of the population mean,
computed from the sample data
TEST
10 - 39
Copyright © 2003 McGraw-Hill Ryerson Limited. All rights reserved.
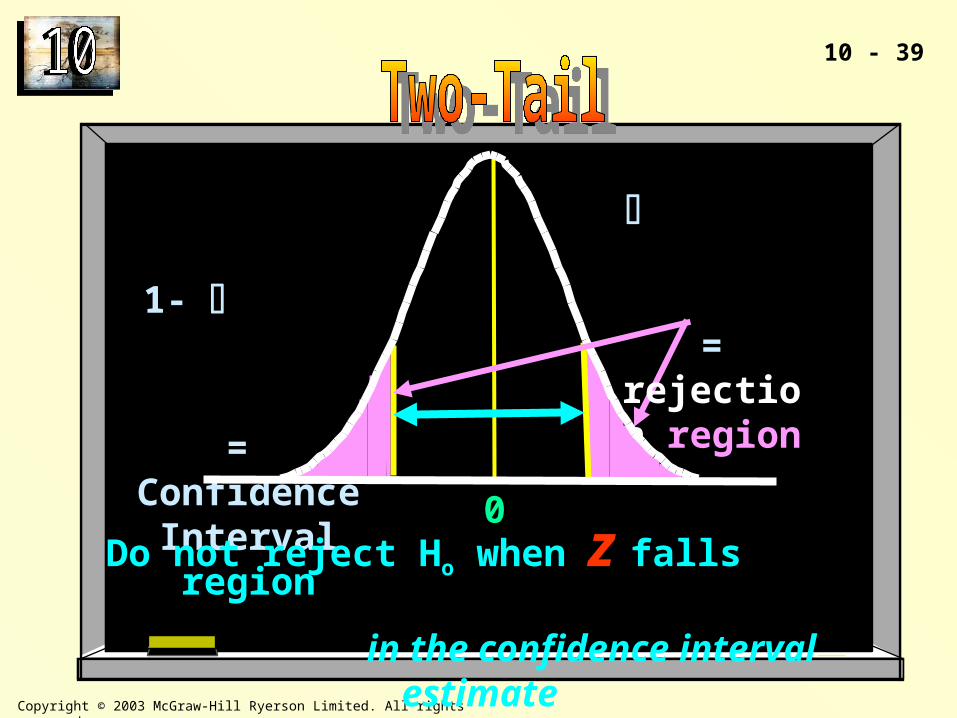
0
=
rejection region
1- =
Confidence Interval region
Do not reject Ho when z falls in the confidence interval estimate
10 - 40
Copyright © 2003 McGraw-Hill Ryerson Limited. All rights reserved.
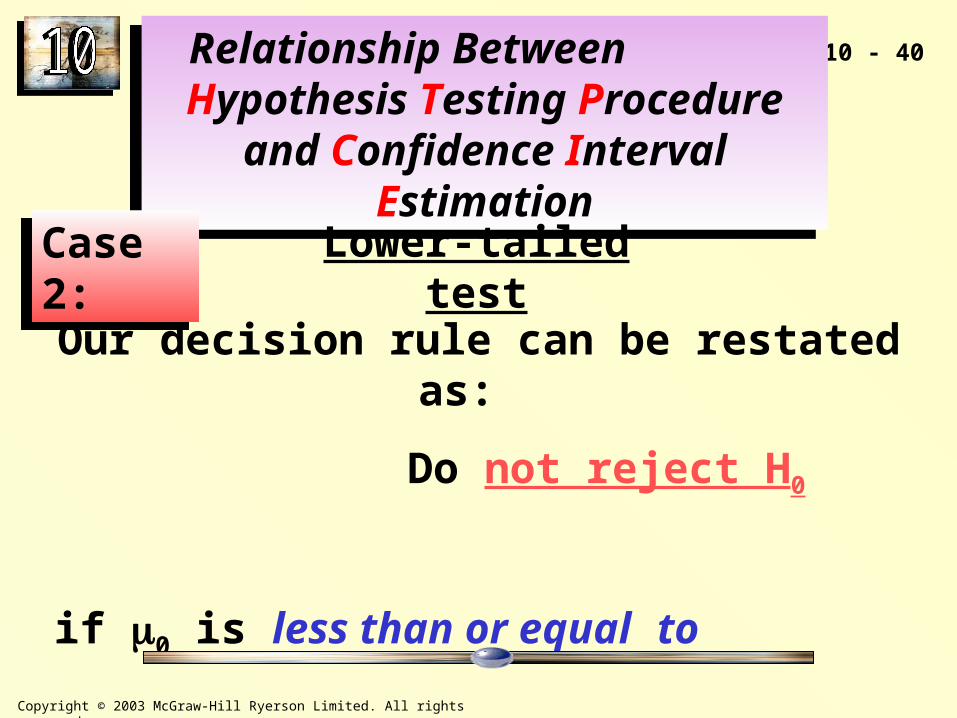
Relationship Between Hypothesis Testing Procedure and
Confidence Interval Estimation
Relationship Between Hypothesis Testing Procedure and
Confidence Interval Estimation
Case 2:Case 2: Lower-tailed test
Our decision rule can be restated as:
Do not reject H0 if 0 is less than or equal to
the (1-) upper confidence bound for , computed from
the sample data.
10 - 41
Copyright © 2003 McGraw-Hill Ryerson Limited. All rights reserved.
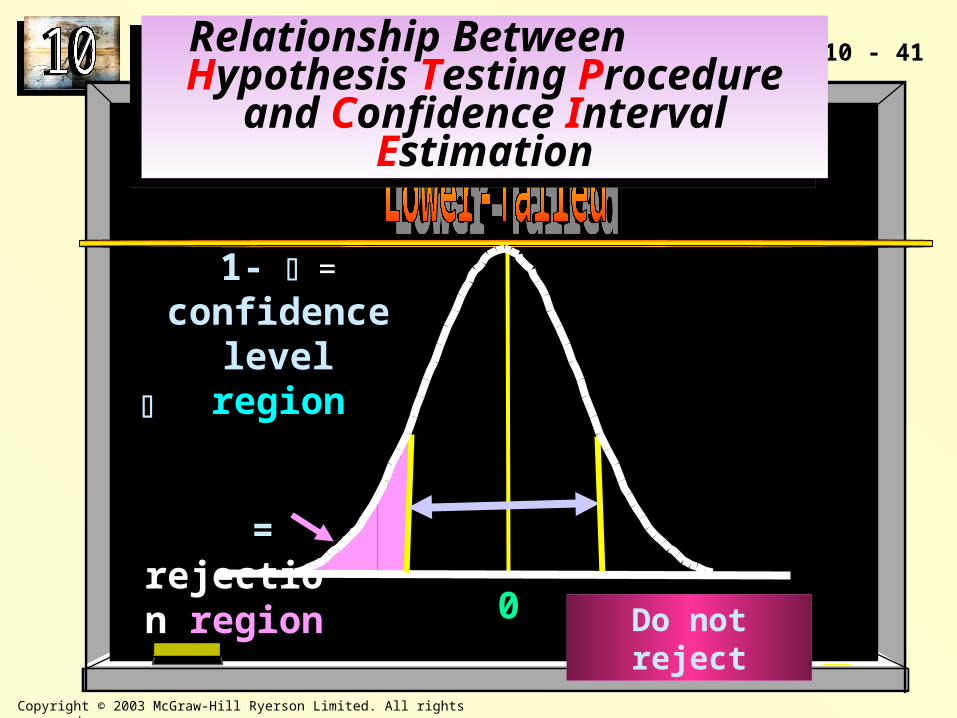
0
=
rejection region
1- =
confidence level region
Do not reject
Relationship Between Hypothesis Testing Procedure and
Confidence Interval Estimation
Relationship Between Hypothesis Testing Procedure and
Confidence Interval Estimation
10 - 42
Copyright © 2003 McGraw-Hill Ryerson Limited. All rights reserved.
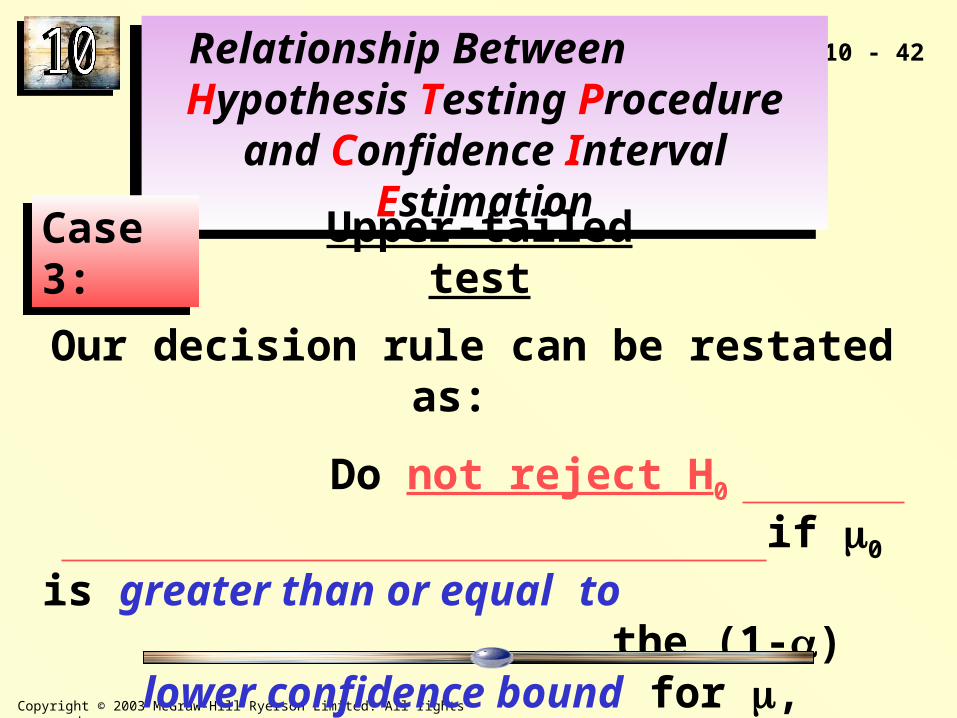
Relationship Between Hypothesis Testing Procedure and
Confidence Interval Estimation
Relationship Between Hypothesis Testing Procedure and
Confidence Interval Estimation
Case 3:Case 3: Upper-tailed test
Our decision rule can be restated as:
Do not reject H0 if 0 is greater than or equal to
the (1-) lower confidence bound for , computed from the sample data.
10 - 43
Copyright © 2003 McGraw-Hill Ryerson Limited. All rights reserved.
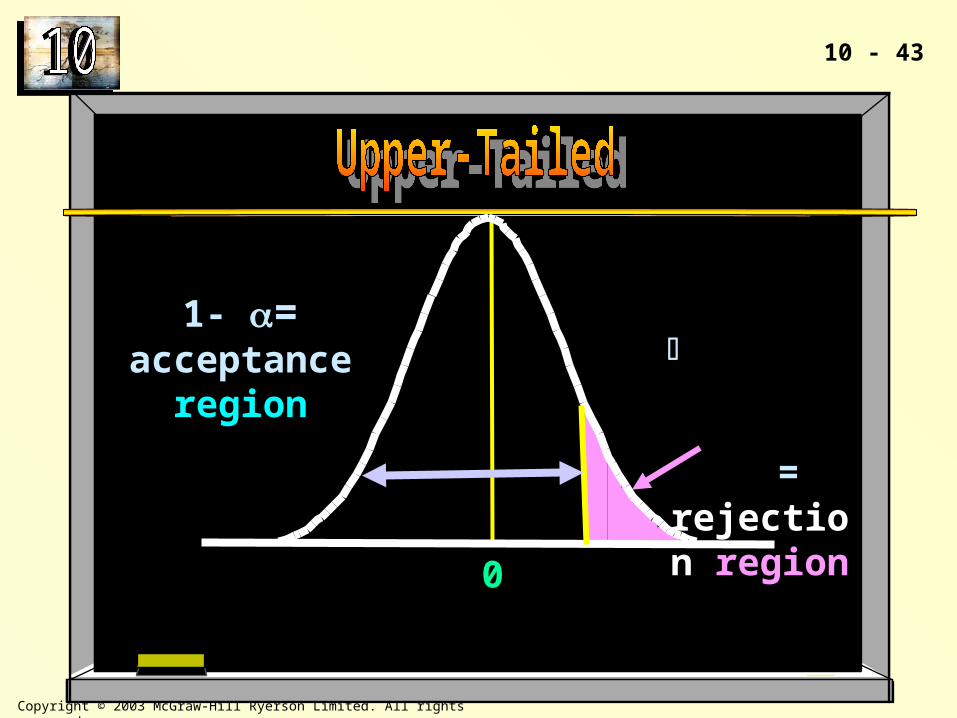
0
=
rejection region
1- = acceptance
region
10 - 44
Copyright © 2003 McGraw-Hill Ryerson Limited. All rights reserved.
10 - 44
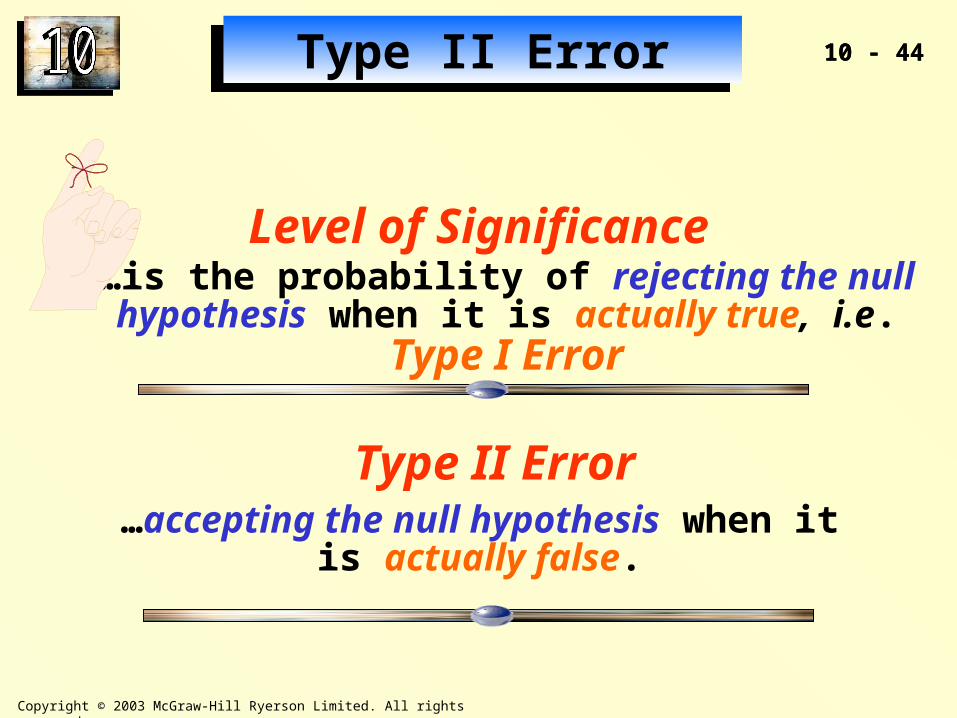
Level of Significance…is the probability of rejecting the null hypothesis
when it is actually true, i.e. Type I Error
…accepting the null hypothesis when it is actually false.
Type II Error
Type II ErrorType II Error
10 - 45
Copyright © 2003 McGraw-Hill Ryerson Limited. All rights reserved.
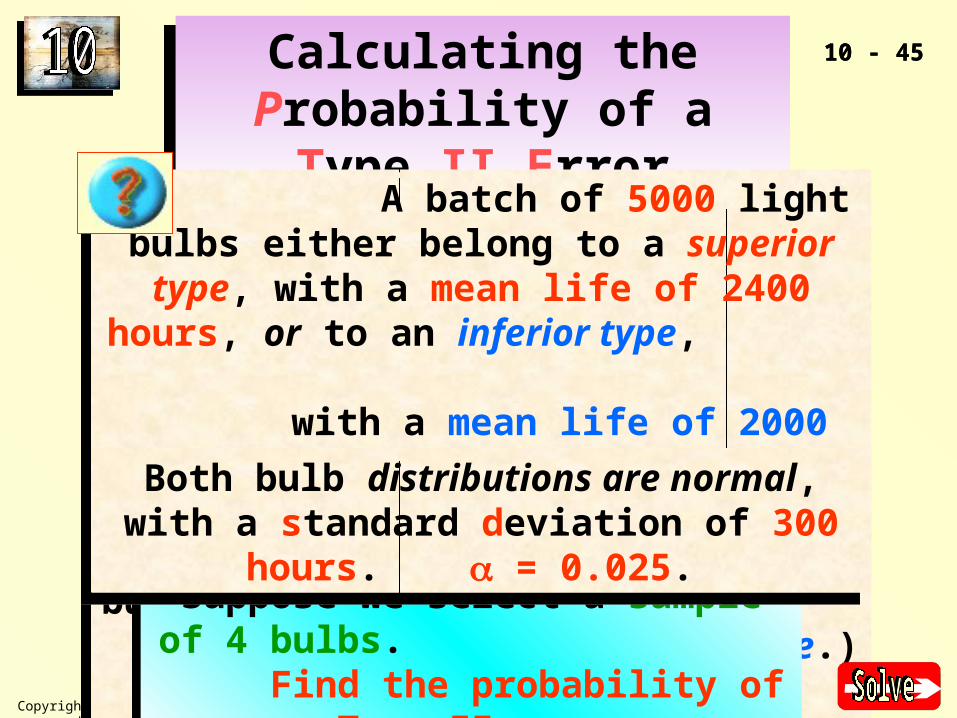
Calculating the Probability of a Type II Error
Calculating the Probability of a Type II Error
10 - 45
A batch of 5000 light bulbs either belong to a superior type, with a mean life of 2400
hours, or to an inferior type, with a mean life of 2000 hours. (By default,
the bulbs will be sold as the inferior type.)
A batch of 5000 light bulbs either belong to a superior type, with a mean life of 2400
hours, or to an inferior type, with a mean life of 2000 hours. (By default,
the bulbs will be sold as the inferior type.)
Suppose we select a sample of 4 bulbs. Find the probability of a
Type II error.
Suppose we select a sample of 4 bulbs. Find the probability of a
Type II error.
Both bulb distributions are normal, with a standard deviation of 300 hours. = 0.025.
Both bulb distributions are normal, with a standard deviation of 300 hours. = 0.025.
10 - 46
Copyright © 2003 McGraw-Hill Ryerson Limited. All rights reserved.
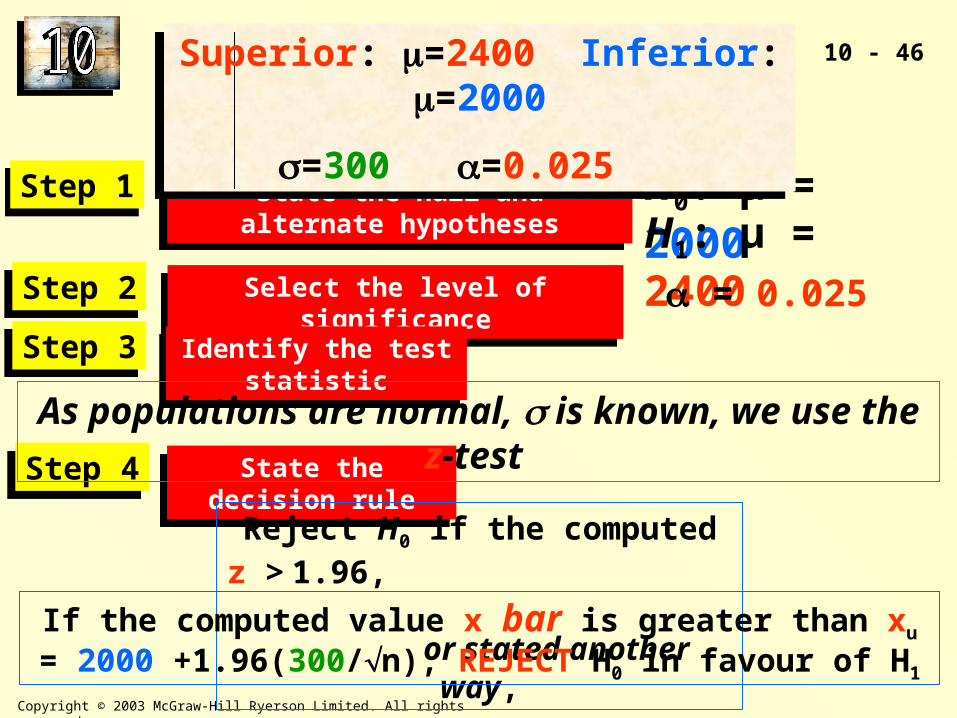
State the null and alternate hypothesesState the null and alternate hypothesesStep 1Step 1
Select the level of significanceSelect the level of significanceStep 2Step 2
Identify the test statisticIdentify the test statisticStep 3Step 3
State the decision ruleState the decision ruleStep 4Step 4
H0: µ = 2000 H1: µ = 2400 = 0.025
As populations are normal, is known, we use the z-test
Reject H0 if the computed z > 1.96, or stated
another way,If the computed value x bar is greater than xu = 2000 +1.96(300/n), REJECT H0 in favour of H1
Superior: =2400 Inferior: =2000
=300 =0.025
Superior: =2400 Inferior: =2000
=300 =0.025
10 - 47
Copyright © 2003 McGraw-Hill Ryerson Limited. All rights reserved.
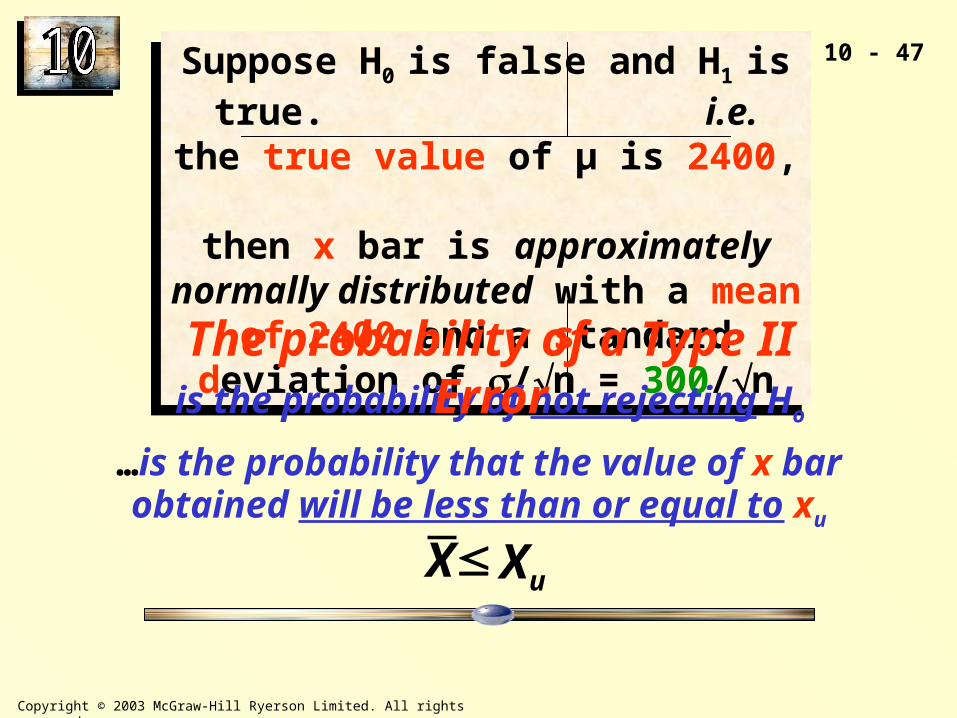
Suppose H0 is false and H1 is true. i.e. the true value of µ is 2400,
then x bar is approximately normally distributed with a mean of
2400 and a standard deviation of /n = 300/n
Suppose H0 is false and H1 is true. i.e. the true value of µ is 2400,
then x bar is approximately normally distributed with a mean of
2400 and a standard deviation of /n = 300/n
…is the probability of not rejecting Ho
…is the probability that the value of x bar obtained will be less than or equal to xu
The probability of a Type II Error
Xu
X
10 - 48
Copyright © 2003 McGraw-Hill Ryerson Limited. All rights reserved.
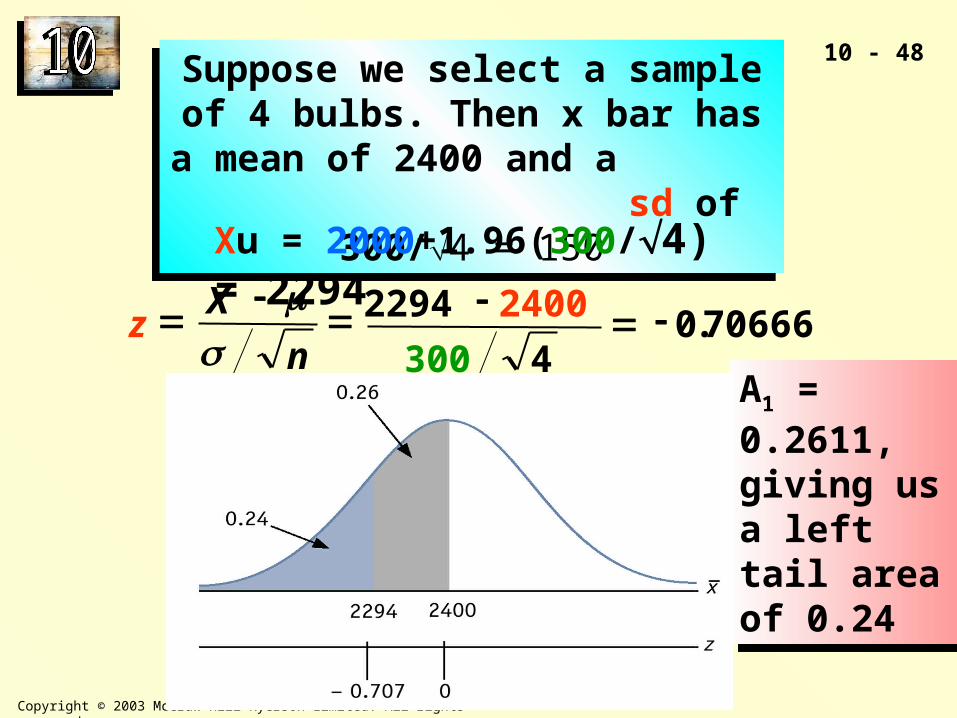
Suppose we select a sample of 4 bulbs. Then x bar has a mean of 2400 and a
sd of 300/4 = 150
Suppose we select a sample of 4 bulbs. Then x bar has a mean of 2400 and a
sd of 300/4 = 150
Xu = 2000+1.96(300/4) = 2294
A1 = 0.2611, giving us a left tail area of 0.24
A1 = 0.2611, giving us a left tail area of 0.24
70666.04300
24002294
n
Xz
10 - 49
Copyright © 2003 McGraw-Hill Ryerson Limited. All rights reserved.
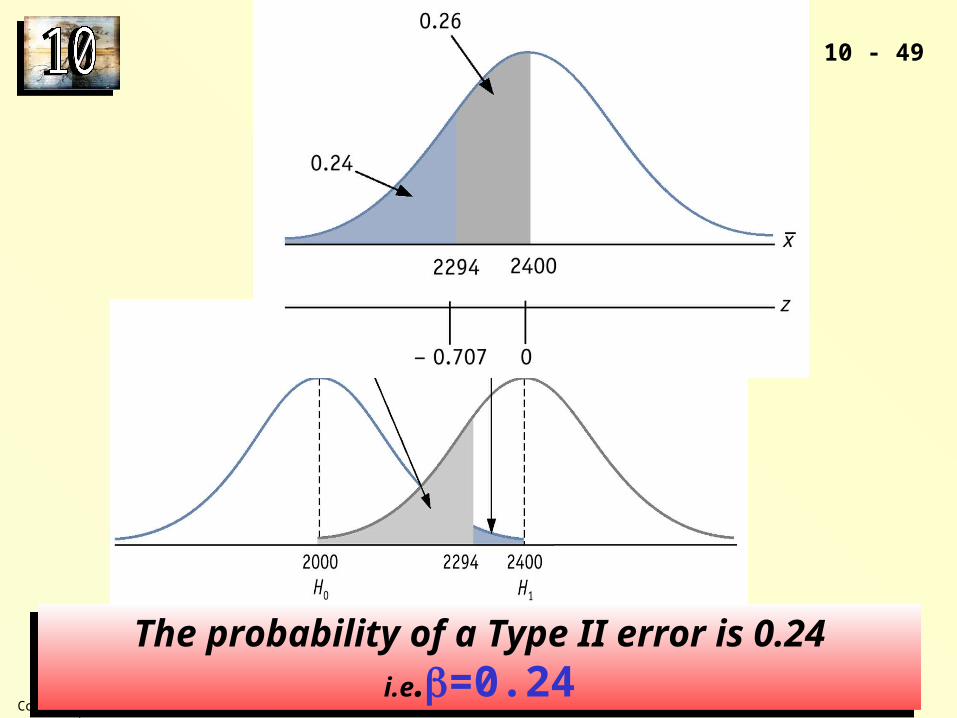
The probability of a Type II error is 0.24 i.e.=0.24The probability of a Type II error is 0.24 i.e.=0.24
10 - 50
Copyright © 2003 McGraw-Hill Ryerson Limited. All rights reserved.
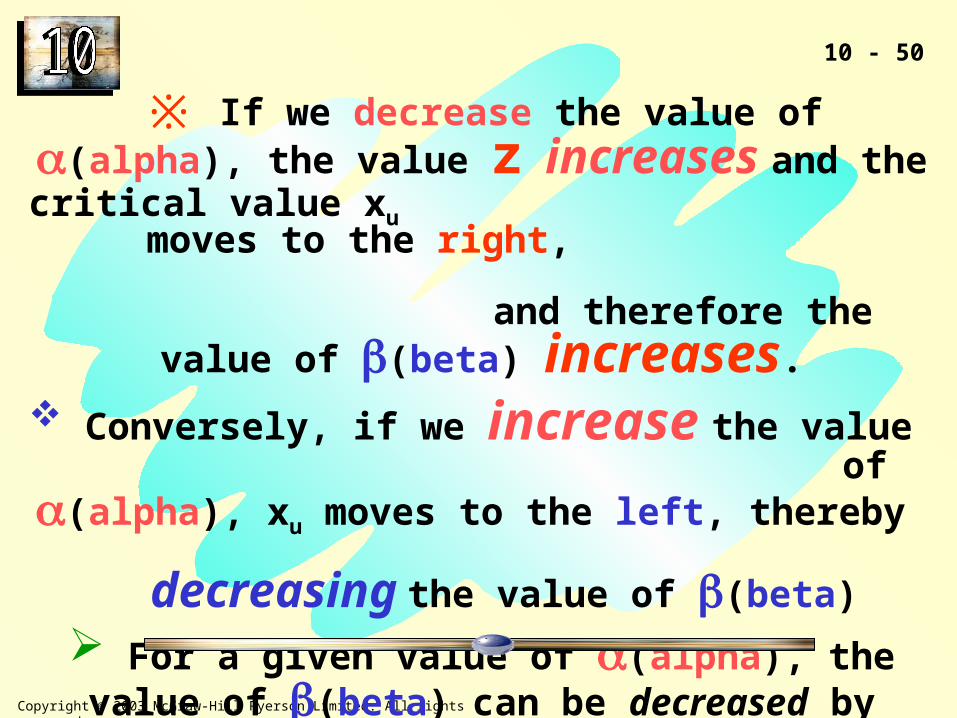
※ If we decrease the value of (alpha), the value z increases and the critical value xu
moves to the right, and therefore the value of (beta) increases.
Conversely, if we increase the value of (alpha), xu moves to the left, thereby
decreasing the value of (beta)
For a given value of (alpha), the value of (beta) can be decreased by increasing the sample size.
10 - 51
Copyright © 2003 McGraw-Hill Ryerson Limited. All rights reserved.
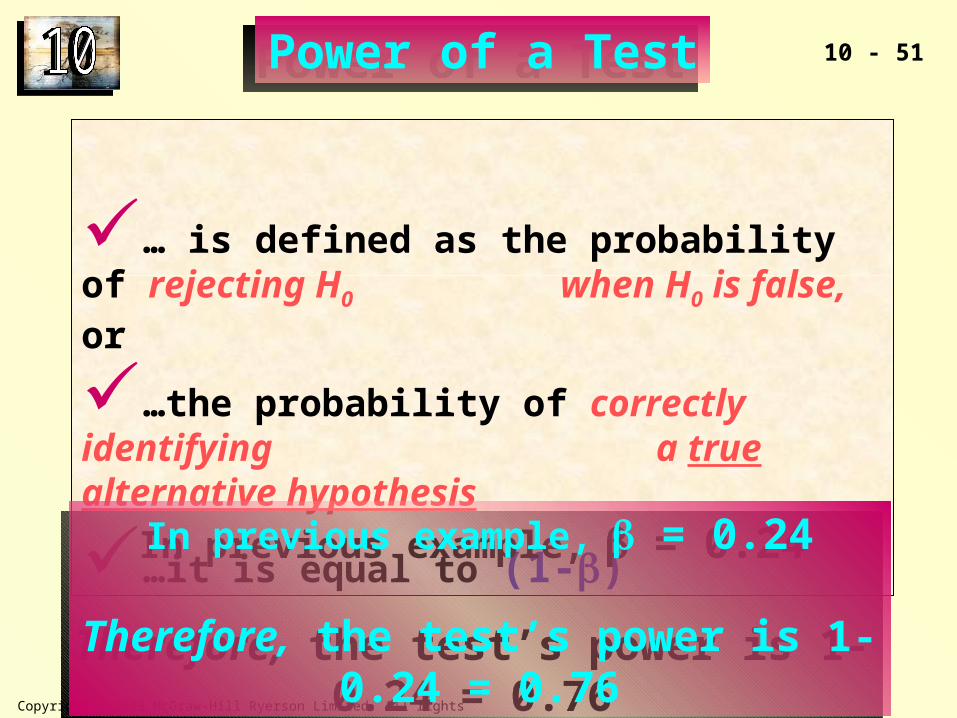
Power of a TestPower of a Test
… is defined as the probability of rejecting H0 when H0 is false, or
…the probability of correctly identifying a true alternative hypothesis
…it is equal to (1-)
In previous example, = 0.24
Therefore, the test’s power is 1-0.24 = 0.76
In previous example, = 0.24
Therefore, the test’s power is 1-0.24 = 0.76

10 - 52
Copyright © 2003 McGraw-Hill Ryerson Limited. All rights reserved.
Test your learning…Test your learning…
www.mcgrawhill.ca/college/lindClick on…Click on…
Online Learning Centrefor quizzes
extra contentdata setssearchable glossaryaccess to Statistics Canada’s E-Stat data…and much more!

10 - 53
Copyright © 2003 McGraw-Hill Ryerson Limited. All rights reserved.
This completes Chapter 10This completes Chapter 10


