33
Copyright © 2006 McGraw Hill Ryerson Limite d 3-1 prepared by: Sujata Madan McGill University Fundamentals of Corporate Finance Third Canadian Edition
| Date post: | 30-Dec-2015 |
| Category: |
Documents |
| Upload: | cecilia-parks |
| View: | 215 times |
| Download: | 0 times |

Copyright © 2006 McGraw Hill Ryerson Limited 3-1
prepared by:Sujata Madan
McGill University
Fundamentals
of Corporate
Finance
Third Canadian Edition

Copyright © 2006 McGraw Hill Ryerson Limited 3-2
Chapter 3 Accounting and Finance
The Balance Sheet
The Income Statement
The Statement of Cash Flows
Taxes

Copyright © 2006 McGraw Hill Ryerson Limited 3-3
The Balance Sheet
Financial statement which shows the value of the firm’s assets and liabilities at a particular time.

Copyright © 2006 McGraw Hill Ryerson Limited 3-4
The Balance Sheet
Current AssetsCash & SecuritiesReceivablesInventories
+
Fixed AssetsTangible AssetsIntangible Assets
Current LiabilitiesPayablesShort-term Debt
+
Long-term Liabilities
+
Shareholders’ Equity
=

Copyright © 2006 McGraw Hill Ryerson Limited 3-5
The Balance Sheet Structure of the Balance Sheet

Copyright © 2006 McGraw Hill Ryerson Limited 3-6
The Balance Sheet
Current Assets These are the most liquid assets These could be:
Cash and Marketable Securities Accounts Receivable Inventories Other Current Assets

Copyright © 2006 McGraw Hill Ryerson Limited 3-7
The Balance Sheet
Non-Current Assets Long-term assets which are unlikely to be
turned into cash soon These could be:
Net Fixed Assets Intangible Assets Other Assets

Copyright © 2006 McGraw Hill Ryerson Limited 3-8
The Balance Sheet
Net Fixed Assets Long lived assets such as buildings, plant,
equipment etc.
Also called fixed assets.
Shown on the Balance Sheet at their original cost net of accumulated depreciation.

Copyright © 2006 McGraw Hill Ryerson Limited 3-9
The Balance Sheet
Intangible Assets Long lived assets such as brand names,
patents, copyrights, manpower etc.
These assets have no physical reality, and are thus called intangible assets.

Copyright © 2006 McGraw Hill Ryerson Limited 3-10
The Balance Sheet Liabilities
Liabilities represent money owed by the firm to its creditors.
These could be: Current Liabilities Long Term Debt Other Long-Term Liabilities

Copyright © 2006 McGraw Hill Ryerson Limited 3-11
The Balance Sheet Liabilities
Current liabilities are short term obligations which are likely to be paid off rapidly.
Example: Bank debt and accounts payable.
Long term liabilities represent debts that come due after the end of the year.
Example: Long-term debt

Copyright © 2006 McGraw Hill Ryerson Limited 3-12
The Balance Sheet Shareholders’ Equity
What is left over after all of firm’s obligations (liabilities) have been paid off belongs to the shareholders, and is called shareholders’ equity.
This can be: Capital Retained earnings

Copyright © 2006 McGraw Hill Ryerson Limited 3-13
The Balance Sheet Shareholders’ Equity
Capital represents amounts raised from the sale of the company’s shares to investors.
Retained earnings represents earnings which the management has retained and reinvested in the firm.

Copyright © 2006 McGraw Hill Ryerson Limited 3-14
Book Value vs Market Value Book Value and Market Value
Book value is determined by GAAP
Market value is the price at which the firm can resell an asset
Typically, market value ≠book value

Copyright © 2006 McGraw Hill Ryerson Limited 3-15
Book Value vs Market Value Example
According to GAAP, your firm has equity worth $6 billion, debt worth $4 billion, assets worth $10 billion. The market values your firm’s 100 million shares at $75 per share and the debt at $4 billion.
What is the market value of your assets?
Copyright © 2006 McGraw Hill Ryerson Limited 3-16
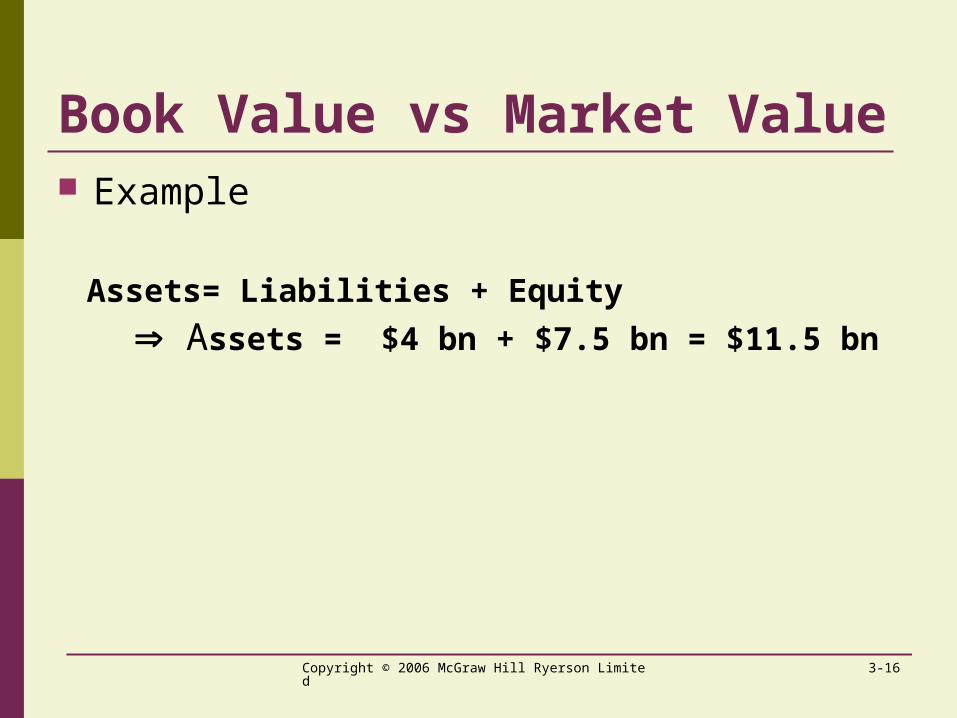
Book Value vs Market Value Example
Assets= Liabilities + Equity
Assets = $4 bn + $7.5 bn = $11.5 bn

Copyright © 2006 McGraw Hill Ryerson Limited 3-17
Market Value vs. Book Value
Book Value Balance SheetAssets = $10 bn Debt = $4 bn
Equity = $6 bn
Market Value Balance SheetAssets = $11.5 bn Debt = $4 bn
Equity = $7.5 bn

Copyright © 2006 McGraw Hill Ryerson Limited 3-18
The Income Statement Financial statement which shows the
revenues, expenses and net income of a firm.

Copyright © 2006 McGraw Hill Ryerson Limited 3-19
The Income Statement Structure of the Income Statement

Copyright © 2006 McGraw Hill Ryerson Limited 3-20
Statement of Cash Flows Financial statement which shows a firm’s
cash receipts and cash payments over a period of time.
Note that the Income Statement shows the firm’s accounting profits not its cash flows

Copyright © 2006 McGraw Hill Ryerson Limited 3-21
Statement of Cash Flows Profit vs. Cash Flows
“Profits” subtract depreciation (a non-cash expense)
“Profits” ignore cash expenditures on new capital (the expense is capitalized)
“Profits” record income and expenses at the time of sales, not when the cash exchanges actually occur
“Profits” do not consider changes in working capital

Copyright © 2006 McGraw Hill Ryerson Limited 3-22
Statement of Cash Flows The Statement of Cash Flows is divided
into three sections: Cash flow from operating activities
Cash flow from investing Activities
Cash flow from Financing Activities
Copyright © 2006 McGraw Hill Ryerson Limited 3-23
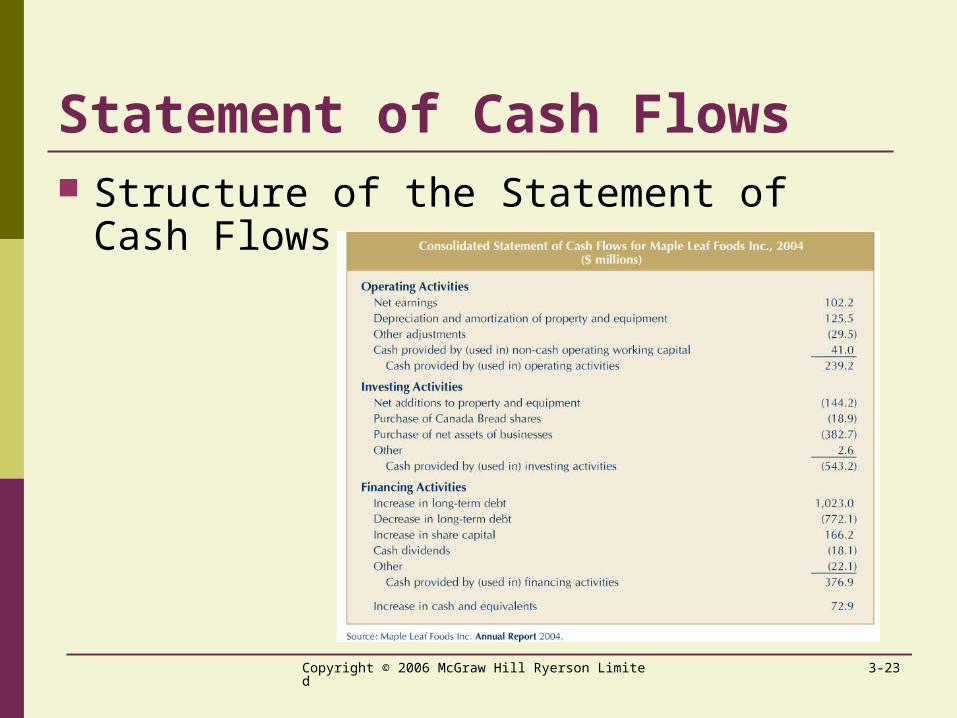
Statement of Cash Flows Structure of the Statement of Cash
Flows

Copyright © 2006 McGraw Hill Ryerson Limited 3-24
Taxes Corporate Taxes
Corporate tax = Federal tax + Provincial tax
The federal tax rate is 22.12% 13.12% for small businesses
Provincial taxes vary across the country

Copyright © 2006 McGraw Hill Ryerson Limited 3-25
Taxes Consequences of Deducting Interest
Interest paid by a corporation is a tax deductible expense.
Note that dividends are not. Thus, interest payments increase the amount
of money available to creditors and shareholders.

Copyright © 2006 McGraw Hill Ryerson Limited 3-26
Taxes Example
Firm A and Firm B both have EBIT of $100 Both pay taxes at 35% Firm A has debt and pays $40 in interest Firm B has no debt and pays no interest
Create an income statement for thesefirms and calculate their net income.

Copyright © 2006 McGraw Hill Ryerson Limited 3-27
TaxesConsequences of Deducting Interest
Firm A Firm B
EBIT $100 $100Less: Interest 40 0Pretax Income 60 100Less: Taxes (35%) 21 35Net Income $ 39 $ 65

Taxes
Government’s share (taxes) Stakeholder’s share (interest + net income)
Distribution of EBIT:
Government’s share + (Creditor’s Share + Shareholder’s Share)
Firm B = $35 + ($0 + $65) = $35 + 65= $100
$21$79
FIRM A
$35$65
FIRM B
Firm A = $21 + ($40 + $39) = $21 + $79= $100

Copyright © 2006 McGraw Hill Ryerson Limited 3-29
Taxes Definitions
Marginal Tax Rate - tax paid on each extra dollar of income.
Average Tax Rate - total tax bill divided by total income.
Copyright © 2006 McGraw Hill Ryerson Limited 3-30
Taxes Personal Taxes
For individual taxpayers, federal and provincial taxes are calculated separately.
Taxes for individuals are progressive.
Dividends are effectively taxed at a lower rate than interest income.

Copyright © 2006 McGraw Hill Ryerson Limited 3-31
Summary of Chapter 3 Investors and other stakeholders need regular
financial information to monitor a firm’s progress.
They find this information on the: Balance Sheet Income Statement Statement of Cash Flows

Copyright © 2006 McGraw Hill Ryerson Limited 3-32
Summary of Chapter 3 Assets are recorded on the Balance Sheet at
book value.
Book value does not equal market value!
Accounting income on an Income Statement is not the same as a firm’s cash flows.
Copyright © 2006 McGraw Hill Ryerson Limited 3-33
Summary of Chapter 3
Taxes have a major impact on financial decisions.
In Canada, both corporations and individuals must pay taxes on their earnings.


