Page 1
Copyright © 2008 Pearson Prentice Hall. All rights reserved. 1Copyright © 2008 Pearson Prentice Hall. All rights reserved. 111
Exploring Microsoft Office Excel 2007
Chapter 8
What-if Analysis
Robert Grauer, Keith Mulbery, Judy Scheeren
Page 2
Copyright © 2008 Pearson Prentice Hall. All rights reserved. 2
Objectives
Create a one-variable data table Create a two-variable data table Solve problems with Goal Seek Use Scenario Manager Load the Solver Add-In Solve Problems with Solver
Page 3
Copyright © 2008 Pearson Prentice Hall. All rights reserved. 3
Create a one-variable data table
What-if analysis enables you to see how changes in variables affect calculated results
A variable is a value that can be changed to see how those changes impact other values
An independent variable is one that can be controlled directly, such as the price of an item
A dependent variable is one that may vary such as the number of items sold
Page 4
Copyright © 2008 Pearson Prentice Hall. All rights reserved. 4
Create a One-Variable Data Table
A one-variable data table is a data-analysis tool that provides various results based on changing one variable
Allows you to analyze different values of one variable to compare one or more calculated results that are affected by the variable
Two important elements: Input cells contain values to be modified for
what-if analysis Result cells contain values to be modified
Page 5
Copyright © 2008 Pearson Prentice Hall. All rights reserved. 5
Create a One-Variable Data Table
Page 6
Copyright © 2008 Pearson Prentice Hall. All rights reserved. 6
Create a One-Variable Data Table
To perform the analysis: Select the entire table excluding the descriptive
labels Click the What-If Analysis down arrow in the Data
Tools group on the Data tab and select Data Table
Type the address of the cell to be changed in the Data Table dialog box
Click OK
Page 7
Copyright © 2008 Pearson Prentice Hall. All rights reserved. 7
Create a Two-Variable Data Table
Use to determine the affect of two variables on a single formula result
Summarizes important input and output cell values in multiple what-if analyses in one rectangular cell range
Specify two input variables that Excel changes to produce the data table
First variable must be in the left column of the table, and the second variable must be in the top row of the data table
Page 8
Copyright © 2008 Pearson Prentice Hall. All rights reserved. 8
Create a Two-Variable Data Table
Page 9
Copyright © 2008 Pearson Prentice Hall. All rights reserved. 9
Create a Two-Variable Data Table
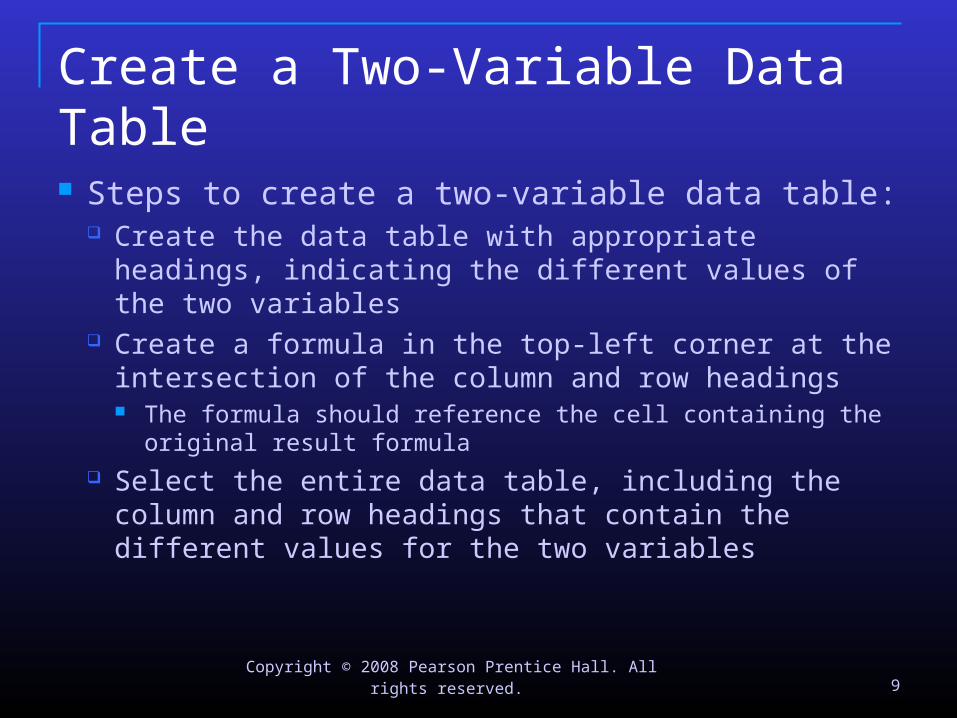
Steps to create a two-variable data table: Create the data table with appropriate headings,
indicating the different values of the two variables Create a formula in the top-left corner at the
intersection of the column and row headings The formula should reference the cell containing the
original result formula Select the entire data table, including the column
and row headings that contain the different values for the two variables
Page 10
Copyright © 2008 Pearson Prentice Hall. All rights reserved. 10
Create a Two-Variable Data Table
Click the What-If Analysis down arrow in the Data Tools group on the Data tab and select Data Table
Type the cell that contains the original value for the horizontal variable in the Row input cell box, and type the cell that contains the original value for the vertical variable in the Column input cell box
Click OK
Page 11
Copyright © 2008 Pearson Prentice Hall. All rights reserved. 11
Solve Problems with Goal Seek
Goal Seek is a method for finding one-time solutions to problems
It enables you to work backwards to solve a problem
It enables you to set the end result to determine the input to produce the result
The primary advantage is the dialog box that enables you to change your goals and parameters relatively easily
Page 12
Copyright © 2008 Pearson Prentice Hall. All rights reserved. 12
Solve Problems with Goal Seek
Page 13
Copyright © 2008 Pearson Prentice Hall. All rights reserved. 13
Use Scenario Manager
Scenario Manager enables you to specify multiple sets of assumptions, called scenarios, to quickly see the results of any given Scenario
Represents different sets of what-if conditions to be considered in assessing the outcome of spreadsheet models
Page 14
Copyright © 2008 Pearson Prentice Hall. All rights reserved. 14
Use Scenario Manager
Page 15
Copyright © 2008 Pearson Prentice Hall. All rights reserved. 15
Use Scenario Manager
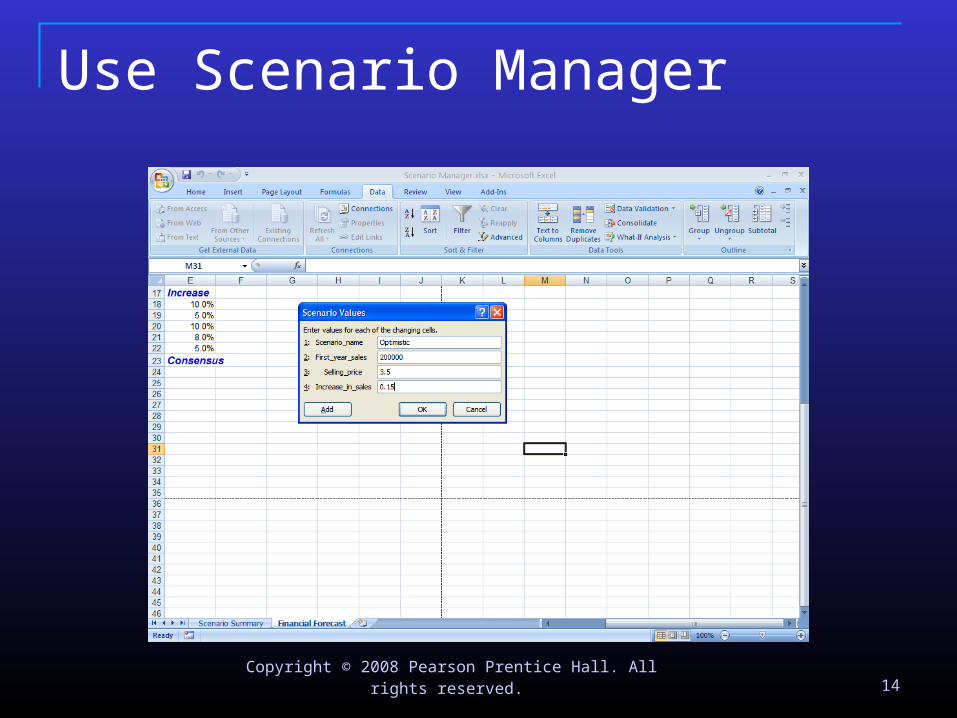
You can create multiple scenarios using the Add Scenario dialog box
To view your scenarios, click What-If analysis in the Data Tools group on the Data tab, select Scenario Manager, and highlight the name of the Scenario you want to view in the Scenarios list and click Show
A scenario summary report is a condensed version of the scenario results
Page 16
Copyright © 2008 Pearson Prentice Hall. All rights reserved. 16
Use Scenario Manager
Page 17
Copyright © 2008 Pearson Prentice Hall. All rights reserved. 17
Use Scenario Manager
If you have defined many scenarios with multiple result cells, a Scenario PivotTable report may give you more flexibility in your analysis of outcomes based on your scenarios
Page 18
Copyright © 2008 Pearson Prentice Hall. All rights reserved. 18
Use Scenario Manager
Page 19
Copyright © 2008 Pearson Prentice Hall. All rights reserved. 19
Load the Solver Add-in
Solver is a separate program that must be installed or added in to Excel
Once added, it appears in the Analysis group on the Data tab as shown in Figure
To install: Click the Office Button Click Excel Options Click Add-Ins, select Excel Add-ins from the Manage
list and click GO Click Solve Add-in in the Add-Ins available list and
click OK
Page 20
Copyright © 2008 Pearson Prentice Hall. All rights reserved. 20
Solving Problems with Solver
Solver : an add-in program that searches for the best solution to a problem with several variables
Used to find the best way to allocate resources
Requires three parameters: target cell typically contains a formula that is
directly or indirectly based on the adjustable cells and constraints
adjustable cells are the cells whose values are adjusted until the constraints are satisfied
constraints specify the restrictions
Page 21
Copyright © 2008 Pearson Prentice Hall. All rights reserved. 21
Solve Problems with Solver
Define the problem Using identified input ranges, output cells,
and constraints, Solver can minimize or maximize the input cell or set the output cell to a particular value
Define the parameters using the Solver dialog box
Page 22
Copyright © 2008 Pearson Prentice Hall. All rights reserved. 22
Solving Problems with Solver
Page 23
Copyright © 2008 Pearson Prentice Hall. All rights reserved. 23
Solve Problems with Solver
Stepping through Solver enables you to view the steps Solver performs
Saving a Solver model places the information in a small block of cells on a worksheet Keeps track of your predefined settings
If you want to use an existing Solver model with new or updated data you would return to a previous Solver Model by restoring that model
Page 24
Copyright © 2008 Pearson Prentice Hall. All rights reserved. 24