Date post: | 18-Dec-2015 |
Category: |
Documents |
Upload: | kimberly-lawson |
View: | 216 times |
Download: | 0 times |
Copyright © 2010 Lumina Decision Systems, Inc.
Common Parametric Distributions
Gentle Introduction to Modeling Uncertainty Series #6
Lonnie Chrisman, Ph.D.Lumina Decision Systems
Analytica Users Group Webinar10 June 2010
Copyright © 2010 Lumina Decision Systems, Inc.
Course Syllabus
Over the coming weeks:• What is uncertainty? Probability.• Probability Distributions• Monte Carlo Sampling• Measures of Risk and Utility• Risk analysis for portfolios• Common parametric
distributions Assessment of Uncertainty
• Hypothesis testing
Copyright © 2010 Lumina Decision Systems, Inc.
Today’s Topics
• Continuous vs. discrete.• Non-parametric distributions.• A handful of the most common
distributions.• The cases where each is useful.• How to encode each in Analytica.
Lots of model building exercises…
Copyright © 2010 Lumina Decision Systems, Inc.
Outline(Order of exercises)
• “Pre-test” questions• Discrete non-parametric: Monte Hall
game• Continuous non-parametric: Data
resampling• Event counts: • Durations between events• Uncertain percentages• Bounded • Bell shapes
Copyright © 2010 Lumina Decision Systems, Inc.
Custom (Non-parametric) Discrete
ChanceDist(P,A,I)Parameters:• P = Array of probabilities.
Sum(P,I)=1
• A = Array of possible outcomes• I = Index shared by P and A
Note: When A is the index, you can use:ChanceDist(P,A)
Copyright © 2010 Lumina Decision Systems, Inc.
ChanceDist Exercise
An event occurs on one of the 7 days of the week.
• Each weekday 8%• Each day of weekend 30%
Create a chance variable named Day_of_event with this distribution.
Copyright © 2010 Lumina Decision Systems, Inc.
ChanceDist Exercise 2: Monte Hall Game
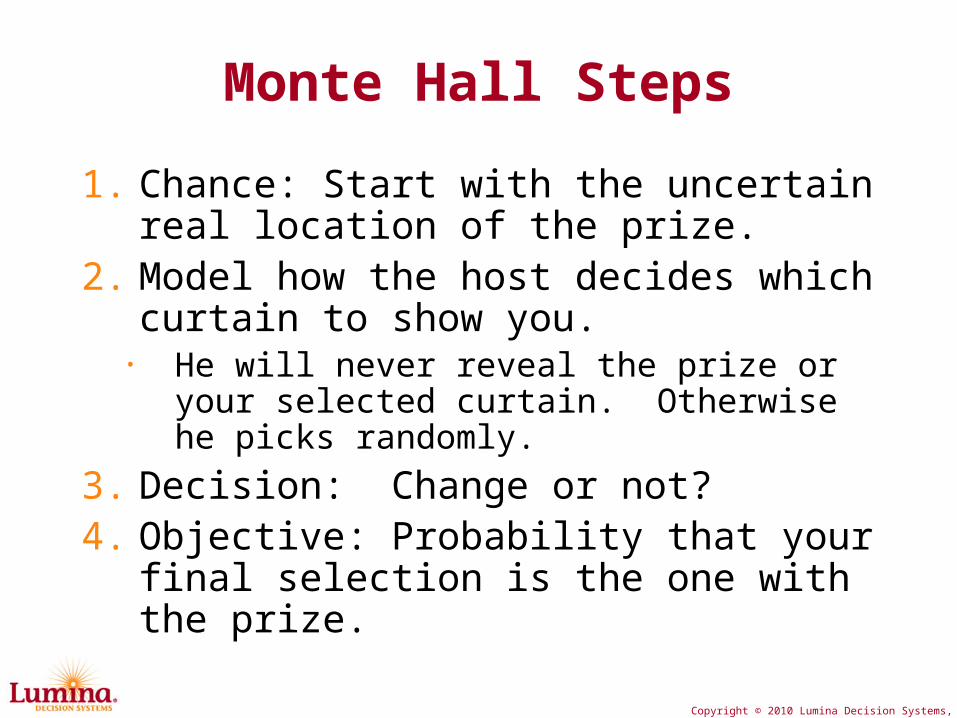
You are a contestant on a game show. A prize is hidden behind 1 of three curtains. You select curtain 1.
“Before opening your curtain,” says the host, “let me reveal one of the unselected curtains that does not contain the prize… Curtain 2 is empty! Would you now like to change curtains?”
Task: Build an Analytica model, computing the probability of winning the prize if you do or do not change curtains.
Copyright © 2010 Lumina Decision Systems, Inc.
Monte Hall Steps
1. Chance: Start with the uncertain real location of the prize.
2. Model how the host decides which curtain to show you.
• He will never reveal the prize or your selected curtain. Otherwise he picks randomly.
3. Decision: Change or not?4. Objective: Probability that your
final selection is the one with the prize.
Copyright © 2010 Lumina Decision Systems, Inc.
Custom (non-parametric)Continuous Distributions
• CumDist(p,x,i) Parameters:
p : Probabilities that value <= xx : Ascending set of valuesi : index shared
CumDist(p,x,x) or just CumDist(p,x)
Copyright © 2010 Lumina Decision Systems, Inc.
CumDist Exercise
• A geologist estimates the capacity of a recently discovered oil deposit. He expresses is assessments as follows:
100% that 100K < capacity < 1B barrels90% that 5M < capacity < 500M barrels75% that 50M < capacity < 100M barrelsMedian estimate: 75M barrels
• Use CumDist to encode these estimates as a distribution for capacity.
Copyright © 2010 Lumina Decision Systems, Inc.
Homework challenge: Using CumDist to Resample
• You have 143 measured values of a quantities. Define an uncertain variable with the same implied distribution (even though your sample size doesn’t match).
• Here is your synthetic data:Index Data_i := 1..143Variable Data := ArcCos(Random( over:data_i))
• Steps (the parameters to CumDist):Sort Data in ascending order: Sort(Data,Data_i)Compute p – equal probability steps along Data_I, starting at 0 and ending at 1.
Copyright © 2010 Lumina Decision Systems, Inc.
The Most Commonly used Parametric Distributions
• Discrete:BernoulliPoissonBinomialUniform integer
• Continuous:NormalLogNormalUniformTriangularExponentialGammaBeta
Copyright © 2010 Lumina Decision Systems, Inc.
Why chose one distribution over another?
• Discrete or continuous?• Bounded quantity or infinite tails?
Bounded both sides
One-sidedtail
Two tailed
Continuous
UniformTriangularBeta
LogNormalGammaExponential
NormalStudentTLogistic
Discrete BinomialUniform int
Poisson
Copyright © 2010 Lumina Decision Systems, Inc.
Why chose one distribution over another?
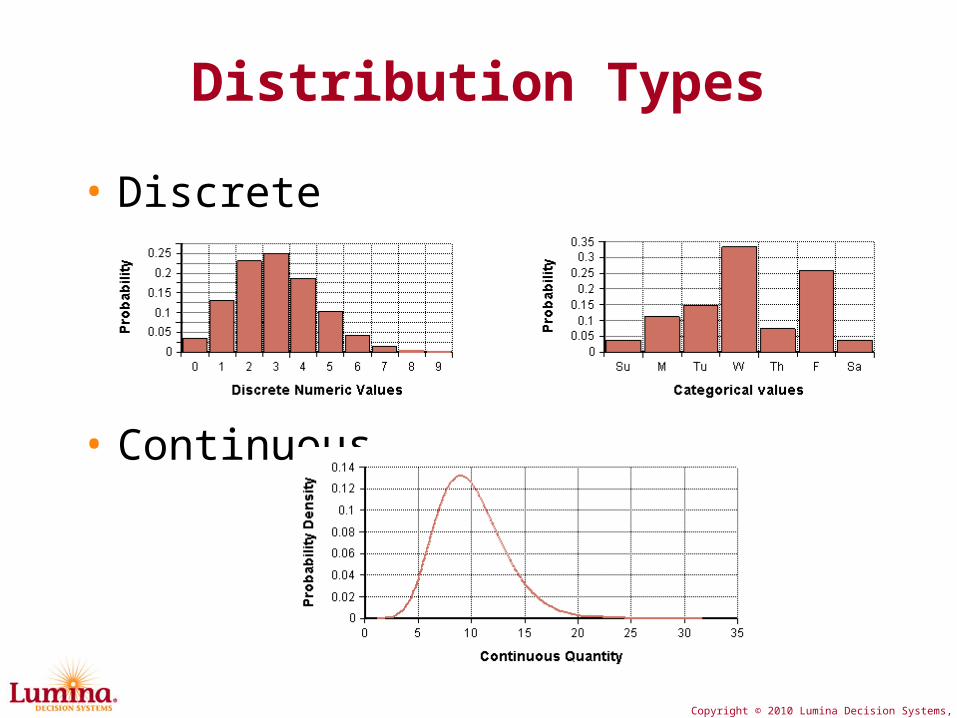
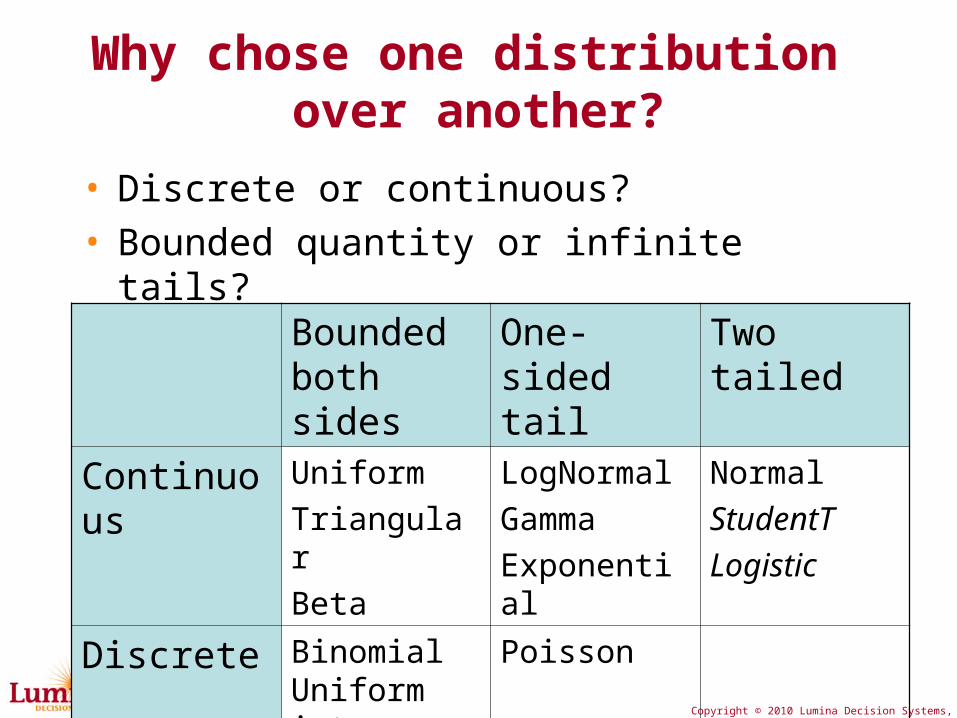
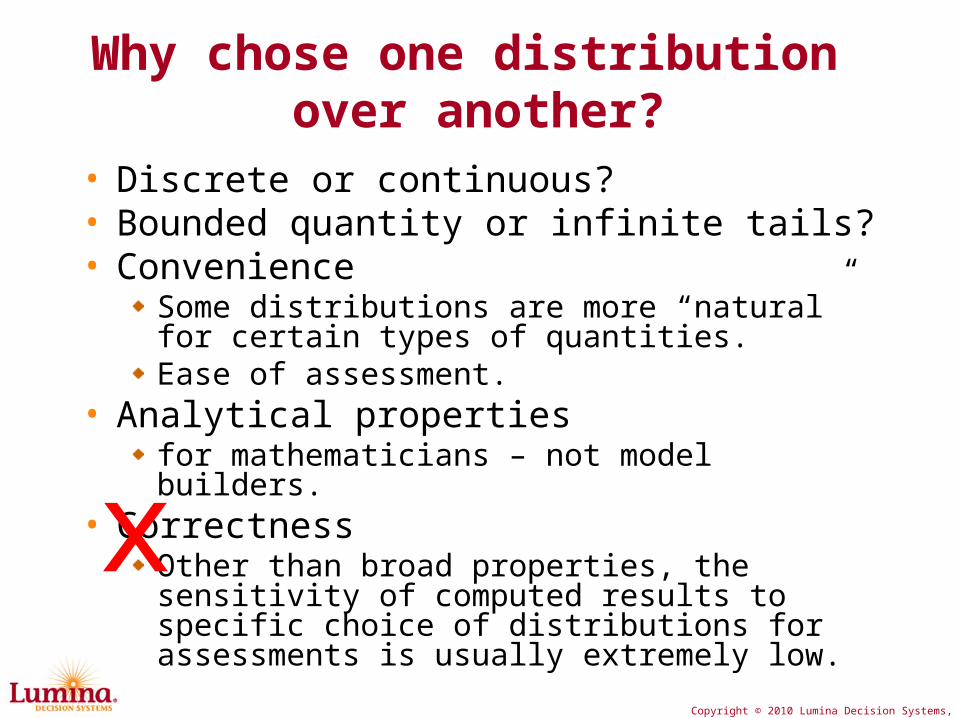
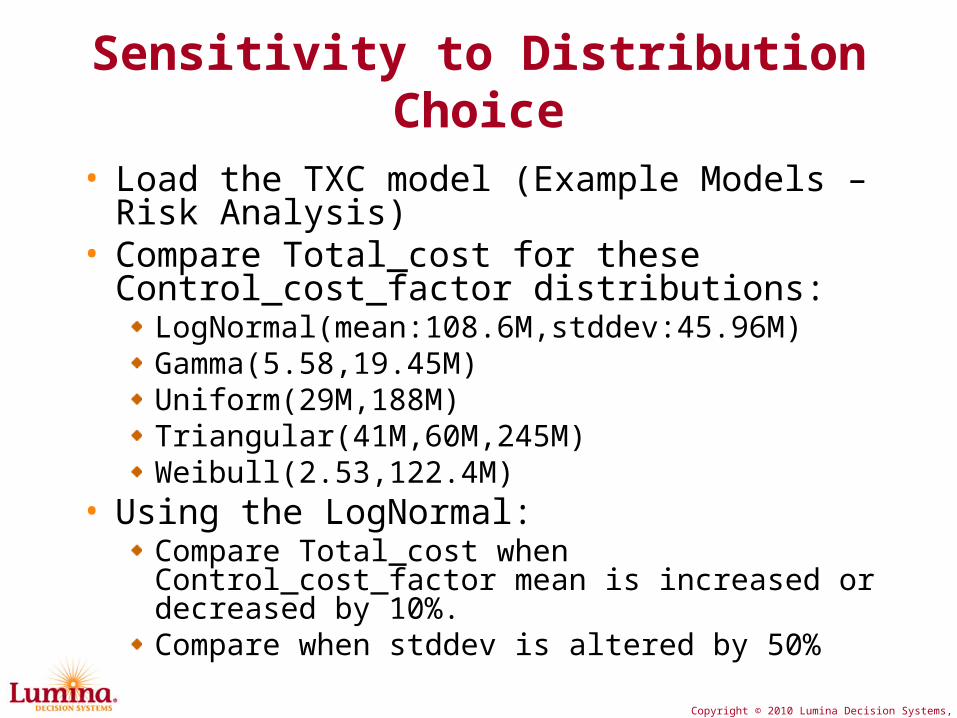
• Discrete or continuous?• Bounded quantity or infinite tails?• Convenience
Some distributions are more “natural” for certain types of quantities.Ease of assessment.
• Analytical propertiesfor mathematicians – not model builders.
• CorrectnessOther than broad properties, the sensitivity of computed results to specific choice of distributions for assessments is usually extremely low.
x
Copyright © 2010 Lumina Decision Systems, Inc.
Distributions forInteger-valued Counts #1
• Poisson(mean)Count of events per unit time.
# Earthquakes >6.0 in a given year# Vehicles that pass in a given hour# Alarms in a given month# Pelicans rescued from oil spill today
When the occurrence of each event is independent of the time of occurrence of other events, the # of occurrences in any given window is Poisson distributed.
Copyright © 2010 Lumina Decision Systems, Inc.
Distributions forInteger-valued Counts #2
• Binomial(n,p)Number of times an event occurs in n repeated independent trials, each having probability p.
# oil well blowouts in the next 100 deep-water wells drilled.# people that visit a store in its first month out of the 10,000 residents of the town.# of positive test results in 50 samples tested.
Copyright © 2010 Lumina Decision Systems, Inc.
Exercise with event counts
In a certain region, malaria infections occur at an average rate of 500 infections per year. 10% of infections are fatal.
Build an Analytica model to compute the distribution for the number of people expected to die from a malaria infection in a given year.
Copyright © 2010 Lumina Decision Systems, Inc.
Duration between events
• Exponential(rate)When events occur independently at a given rate, this gives the time between successive events.Note: rate = 1 / meanArrivalTime
• Gamma(a,1/rate)Time for a independent events to occur, each having a mean arrival time of 1/rate.
Copyright © 2010 Lumina Decision Systems, Inc.
Arrival times exercise
• Cars arrive at a stoplight at a rate of 5 per minute. There is room for 10 cars before nearby freeway traffic is blocked.
• Graph the CDF for the amount of time until cars begin to block freeway traffic when the light is red.
• If the light stays red for 90 seconds, what fraction of red light-change cycles will result in blocked traffic?
Copyright © 2010 Lumina Decision Systems, Inc.
Uncertain Percentages
• Beta(a,b)Useful for modeling uncertainty about a probability or percentage. Beta(a,b) expresses uncertainty on a [0,1] bounded quantity.Suppose you’ve seen s true instances out of n observations, with no further information. You’d estimate the true proportion as p=s/n. The uncertainty in this estimate can be modeled as:
Beta(s+1,n-s+1)
• Exercise: Of 100 sampled voters, 55 supported Candidate A. Model the uncertainty on the true proportion.
Copyright © 2010 Lumina Decision Systems, Inc.
Bounded Distributions
• Triangular(min,mode,max)Often very convenient & natural for expressing estimates when only the range and a best guess are available.
• Pert(min,mode,max)Same idea as Triangular. To use, include “Distribution Variations.ana”
• Uniform(min,max)All values between are equally likely.
• Uniform(min,max,integer:true)All integer values are equally likely.
Copyright © 2010 Lumina Decision Systems, Inc.
Bounded comparisons
• Using:Min = 10Mode = 25Max = 40
• Compare distributions (on same PDF & CDF plot):
TriangularPertUniform
• Repeat for Mode=15
Copyright © 2010 Lumina Decision Systems, Inc.
Central Limit Theorem
• Suppose y = x1·x2·x3· .. ·xN
z = x1+x2+x3+ .. +xN
Each xi ~ P(·), where P(·) is any distribution. (each xi is independent)
• Then as N→∞, y→LogNormal(..)z→Normal(..)
Copyright © 2010 Lumina Decision Systems, Inc.
Sensitivity to Distribution Choice
• Load the TXC model (Example Models – Risk Analysis)
• Compare Total_cost for these Control_cost_factor distributions:
LogNormal(mean:108.6M,stddev:45.96M)Gamma(5.58,19.45M)Uniform(29M,188M)Triangular(41M,60M,245M)Weibull(2.53,122.4M)
• Using the LogNormal:Compare Total_cost when Control_cost_factor mean is increased or decreased by 10%.Compare when stddev is altered by 50%
Copyright © 2010 Lumina Decision Systems, Inc.
Summary
• Various parametric distributions are convenient for certain type of quantities.
• Choice of parametric distribution is usually driven by:
Continuous vs. discreteTails or boundedBroad shapeType of information easily estimated
• Results are usually fairly insensitive to exact choice of distribution type.