16
Copyright © 2011 Cengage Learning 6 6 Supply, Demand, and Government Policies
| Date post: | 01-Jan-2016 |
| Category: |
Documents |
| Upload: | winfred-melton |
| View: | 220 times |
| Download: | 1 times |

Copyright © 2011 Cengage Learning
66Supply, Demand, and Government Policies
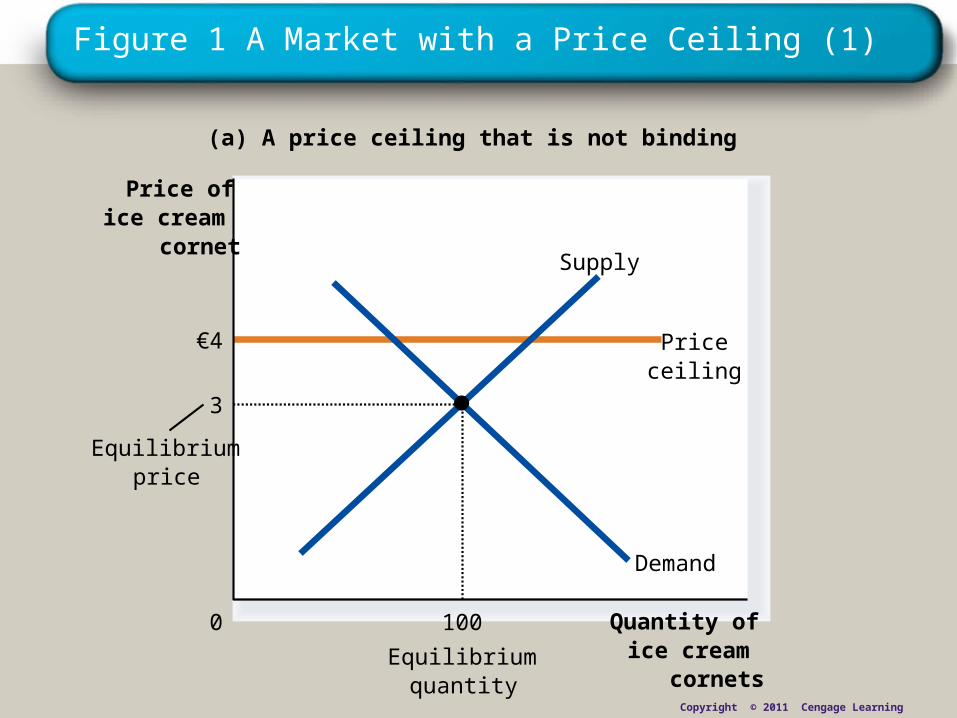
Figure 1 A Market with a Price Ceiling (1)
(a) A price ceiling that is not binding
Quantity ofice cream
cornets
0
Price ofice cream
cornet
Equilibriumquantity
€4 Priceceiling
Equilibriumprice
Demand
Supply
3
100
Copyright © 2011 Cengage Learning

Figure 1 A Market with a Price Ceiling (2)
(b) A price ceiling that is binding
Quantity ofice cream
cornets
0
Price ofice cream
cornet
Demand
Supply
2 PriceceilingShortage
75
Quantitysupplied
125
Quantitydemanded
Equilibriumprice
€3
Copyright © 2011 Cengage Learning

Figure 2 Rent Control in the Short Run and in the Long Run (1)
(a) Rent control in the short run(supply and demand are inelastic)
Quantity ofapartments
0
Supply
Controlled rent
Rentalprice of
apartment
Demand
Shortage
Copyright © 2011 Cengage Learning

Figure 2 Rent Control in the Short Run and in the Long Run (2)
(b) Rent control in the long run(supply and demand are elastic)
0
Rentalprice of
housing unit
Quantity ofhousing units
Demand
Supply
Controlled rent
Shortage
Copyright © 2011 Cengage Learning
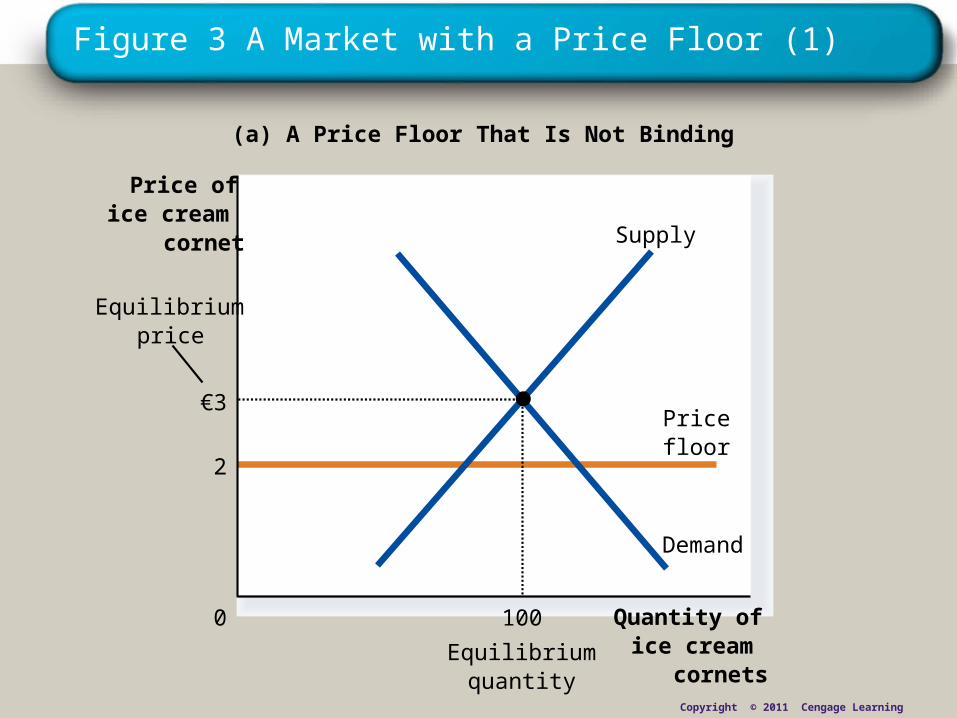
Figure 3 A Market with a Price Floor (1)
(a) A Price Floor That Is Not Binding
Quantity ofice cream
cornets
0
Price ofice cream
cornet
Equilibriumquantity
2
Pricefloor
Equilibriumprice
Demand
Supply
€3
100
Copyright © 2011 Cengage Learning

Figure 3 A Market with a Price Floor (2)
(b) A price floor that is binding
Quantity ofice cream
cornets
0
Price ofice cream
cornet
Demand
Supply
€4Pricefloor
80
Quantitydemanded
120
Quantitysupplied
Equilibriumprice
Surplus
3
Copyright © 2011 Cengage Learning

Figure 4 How the Minimum Wage Affects the Labour Market (1)
Quantity oflabour
Wage
0
labourdemand
labourSupply
Equilibriumemployment
Equilibriumwage
Copyright © 2011 Cengage Learning
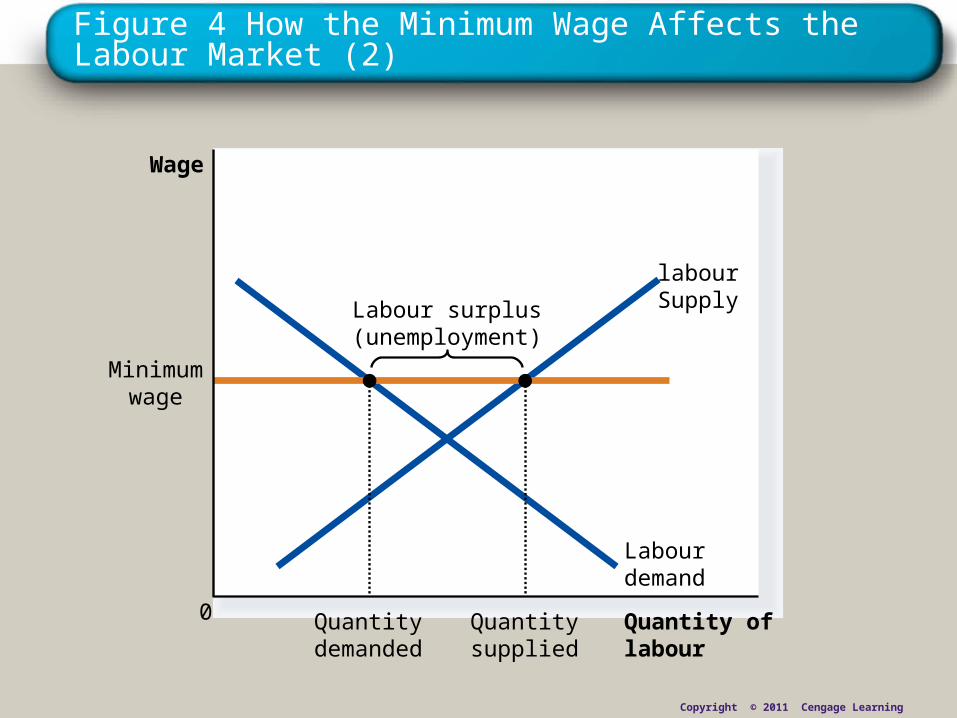
Figure 4 How the Minimum Wage Affects the Labour Market (2)
Quantity oflabour
Wage
0
labourSupplyLabour surplus
(unemployment)
Labourdemand
Minimumwage
Quantitydemanded
Quantitysupplied
Copyright © 2011 Cengage Learning

Copyright © 2010 Cengage Learning
Figure 4 How the Minimum Wage Affects the Labour Market (3)
Copyright © 2011 Cengage Learning

Copyright © 2010 Cengage Learning
Figure 4 How the Minimum Wage Affects the Labour Market (4)
Copyright © 2011 Cengage Learning

Figure 5 A Tax on Sellers
2.80
Quantity ofice cream cornets
0
Price ofice cream
cornet
Pricewithout
tax
Pricesellersreceive
Equilibriumwith tax
Equilibrium without tax
Tax (€0.50)
Pricebuyers
payS1
S2
Demand, D1
A tax on sellersshifts the supplycurve upwardby the amount ofthe tax (€0.50).
3.00
100
€3.30
90
Copyright © 2011 Cengage Learning
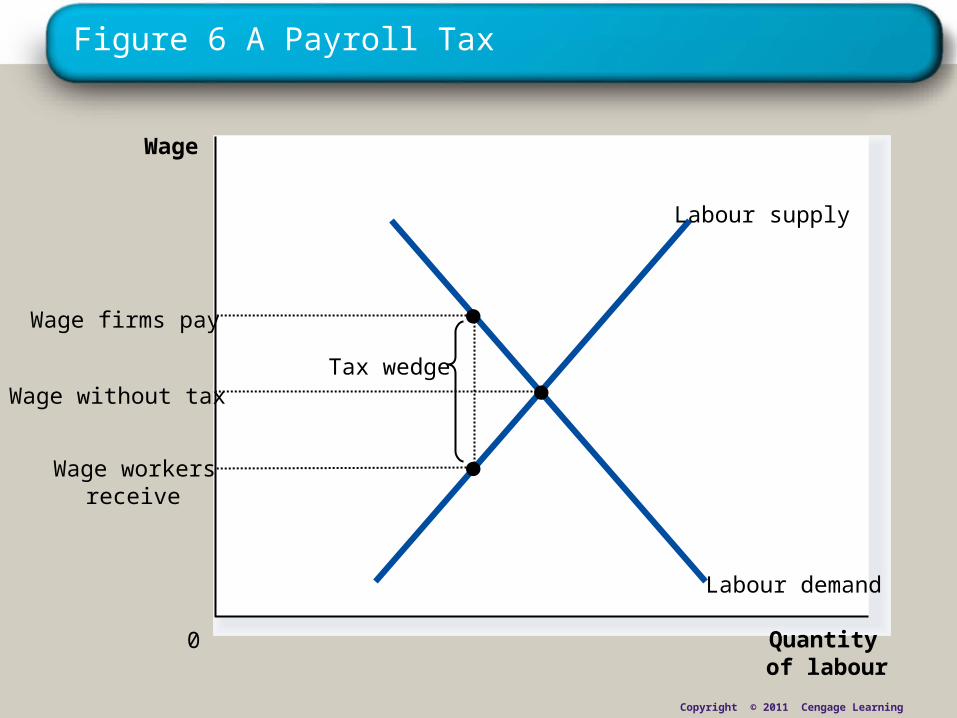
Figure 6 A Payroll Tax
Quantityof labour
0
Wage
Labour demand
Labour supply
Tax wedge
Wage workersreceive
Wage firms pay
Wage without tax
Copyright © 2011 Cengage Learning
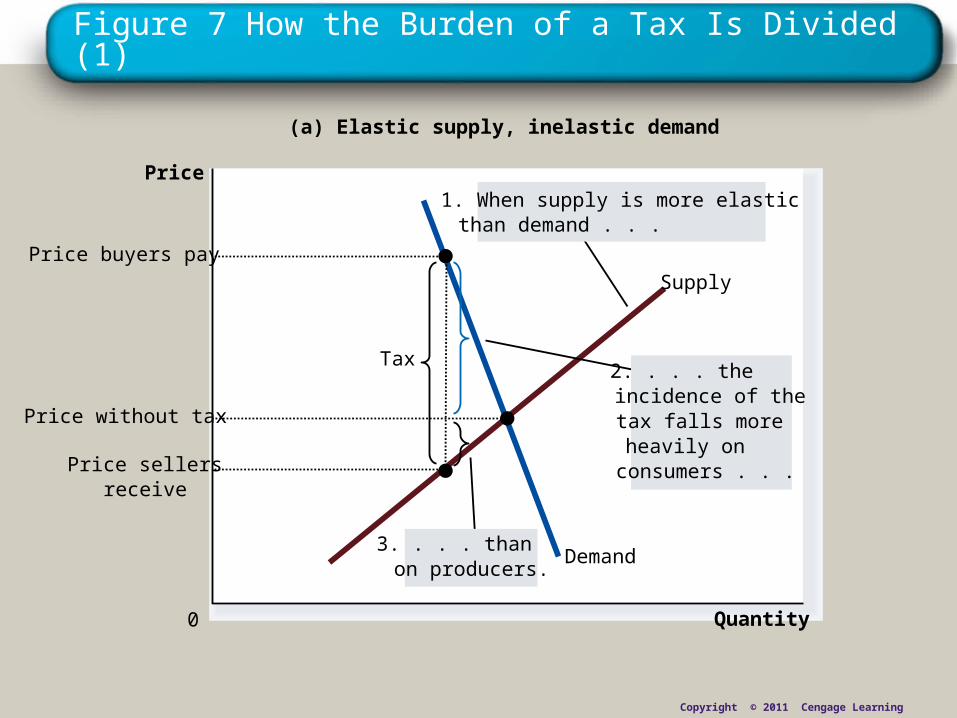
Figure 7 How the Burden of a Tax Is Divided (1)
Quantity0
Price
Demand
Supply
Tax
Price sellersreceive
Price buyers pay
(a) Elastic supply, inelastic demand
2. . . . theincidence of thetax falls moreheavily onconsumers . . .
1. When supply is more elasticthan demand . . .
Price without tax
3. . . . than on producers.
Copyright © 2011 Cengage Learning

Figure 7 How the Burden of a Tax Is Divided (2)
Quantity0
Price
Demand
Supply
Tax
Price sellersreceive
Price buyers pay
(b) Inelastic supply, elastic demand
3. . . . than onconsumers.
1. When demand is more elasticthan supply . . .
Price without tax
2. . . . theincidence of the tax falls more heavily on producers . . .
Copyright © 2011 Cengage Learning

Copyright © 2010 Cengage Learning
Figure 8 A Subsidy on Rail Transport
Copyright © 2011 Cengage Learning


