11
| Date post: | 29-Dec-2015 |
| Category: |
Documents |
| Upload: | johnathan-wilson |
| View: | 223 times |
| Download: | 4 times |


Copyright © 2011 Pearson Education, Inc.
Quadratic Functions and Inequalities
Section 3.1
Polynomial and Rational Functions
Copyright © 2011 Pearson Education, Inc. Slide 3-3
3.1
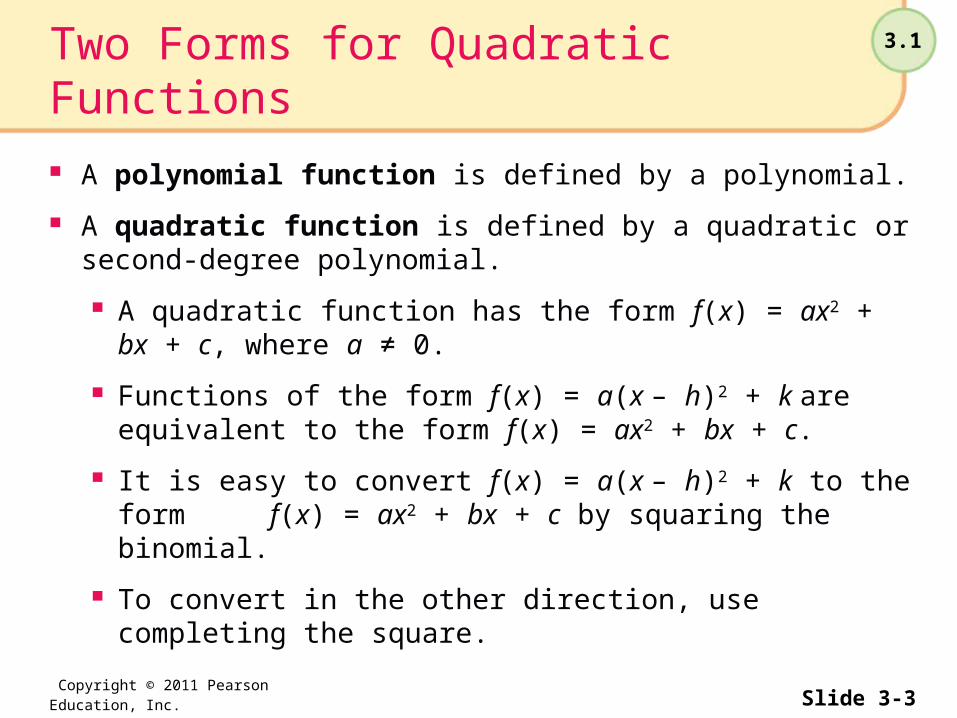
A polynomial function is defined by a polynomial.
A quadratic function is defined by a quadratic orsecond-degree polynomial.
A quadratic function has the form f(x) = ax2 + bx + c, where a ≠ 0.
Functions of the form f(x) = a(x – h)2 + k are equivalent to the form f(x) = ax2 + bx + c.
It is easy to convert f(x) = a(x – h)2 + k to the form f(x) = ax2 + bx + c by squaring the binomial.
To convert in the other direction, use completing the square.
Two Forms for Quadratic Functions
Copyright © 2011 Pearson Education, Inc. Slide 3-4
3.1
Theorem: Quadratic FunctionsThe graph of any quadratic function is a
transformation of the graph of
f(x) = x2.
Two Forms for Quadratic Functions
Copyright © 2011 Pearson Education, Inc. Slide 3-5
3.1
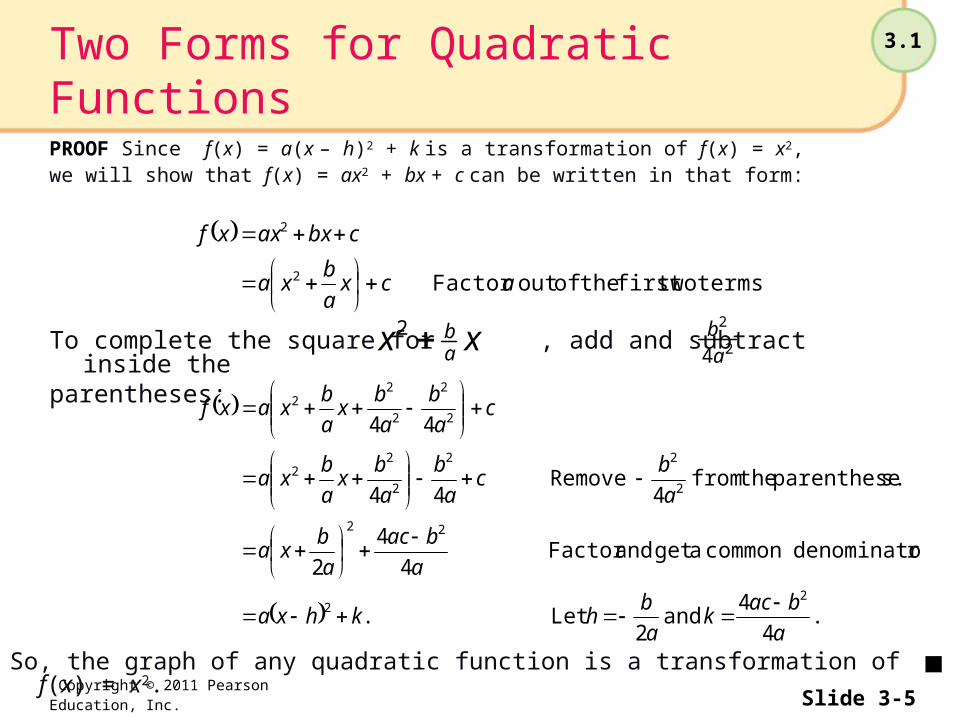
To complete the square for , add and subtract inside the parentheses:
PROOF Since f(x) = a(x – h)2 + k is a transformation of f(x) = x2, we will show that f(x) = ax2 + bx + c can be written in that form:
. and Let
r.denominato common a get and Factor
s.parenthese the from Remove
a
back
a
bhkhxa
a
bac
a
bxa
a
bc
a
b
a
bx
a
bxa
ca
b
a
bx
a
bxaxf
4
4
2.
4
4
2
444
44
22
22
2
22
2
22
2
2
2
22
terms. two first the of out Factor acxa
bxa
cbxaxxf
2
2
xx ab2 2
2
4ab
So, the graph of any quadratic function is a transformation of f(x) = x2.
Two Forms for Quadratic Functions

Copyright © 2011 Pearson Education, Inc. Slide 3-6
3.1
If a > 0, the graph of f(x) = a(x – h)2 + k opens upward; if a < 0, the graph opens downward. Notice that h determines the amount of horizontal
translation and k determines the amount of vertical translation of the graph of f(x) = x2.
Because of the translations, the point (0, 0) on the graph of f(x) = x2 moves to the point (h, k) on the graph of f(x) = a(x – h)2 + k.
Since (0, 0) is the lowest point on the graph of f(x) = x2, the lowest point on any parabola that opens upward is (h, k).
Since (0, 0) is the highest point on the graph of f(x) = – x2, the highest point on any parabola that opens downward is (h, k).
The point (h, k) is called the vertex of the parabola.
Opening, Vertex, and Axis of Symmetry
Copyright © 2011 Pearson Education, Inc. Slide 3-7
3.1
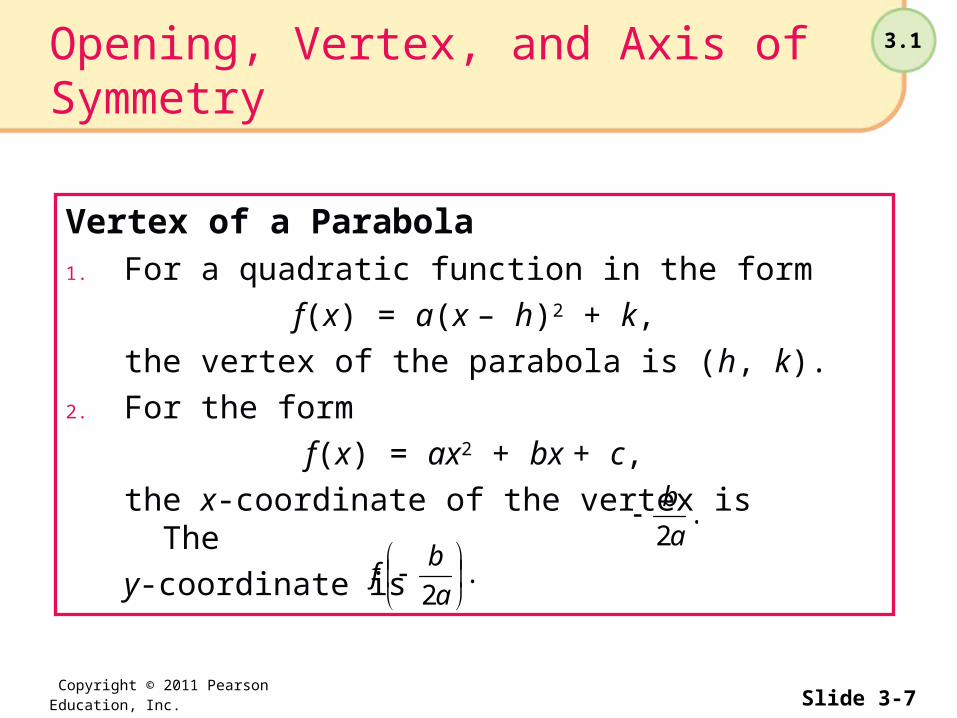
Vertex of a Parabola1. For a quadratic function in the form
f(x) = a(x – h)2 + k,
the vertex of the parabola is (h, k).
2. For the form
f(x) = ax2 + bx + c,
the x-coordinate of the vertex is The
y-coordinate is
.2a
b
.2
a
bf
Opening, Vertex, and Axis of Symmetry

Copyright © 2011 Pearson Education, Inc. Slide 3-8
3.1
The vertical line x = – b/(2a) is called the axis of symmetry for the graph of f(x) = ax2 + bx + c.
The domain of every quadratic function f(x) = a(x – h)2 + k is the set of all real numbers, (–∞, ∞).
The range of a quadratic function is determined from the second coordinate of the vertex.
If a > 0, the range is [k, ∞) and k is called the minimum value of the function. The function is decreasing on (– ∞, h] and increasing on [h, ∞).
If a < 0, the range is (– ∞, k] and k is called the maximum value of the function. The function is increasing on (– ∞, h] and decreasing on [h, ∞).
Opening, Vertex, and Axis of Symmetry
Copyright © 2011 Pearson Education, Inc. Slide 3-9
3.1
The x-intercepts and the y-intercept are important points on the graph of a parabola.
The x-intercepts are used in solving quadratic inequalities and
the y-intercept is the starting point on the graph of a function whose domain is the nonnegative real numbers.
The y-intercept is easily found by letting x = 0.
The x-intercepts are found by letting y = 0
and solving the resulting quadratic equation.
Intercepts

Copyright © 2011 Pearson Education, Inc. Slide 3-10
3.1
A quadratic inequality is an inequality that involves a quadratic polynomial.
The graphical method for solving a quadratic inequality involves the graph of the quadratic function.
Strategy: Solving a Quadratic Inequality by the Graphical Method
1. Get 0 on one side of the inequality and a quadratic polynomial on the other side.
2. Find all roots to the quadratic polynomial.
3. Graph the corresponding quadratic function. The roots found in step (2) determine the x-intercepts.
4. Read the solution set to the inequality from the graph of the parabola.
Quadratic Inequalities
Copyright © 2011 Pearson Education, Inc. Slide 3-11
3.1
The test-point method for solving a quadratic inequality does not involve the graph of the quadratic function.
Strategy: Solving a Quadratic Inequality Using Test Points1. Get 0 on one side of the inequality and a quadratic polynomial on
the other side.
2. Find all roots to the quadratic polynomial and plot them on a number line.
3. Select a test point in each interval determined by the roots.
4. Evaluate the quadratic function at each test point.
5. Determine the solution set from the signs of the function at the test points.
If there are no real solutions to the quadratic equation that corresponds to a quadratic inequality, then the solution set to the inequality is either the empty set or all real numbers.
Quadratic Inequalities


