79
Copyright © 2013, 2010 and 2007 Pearson Education, Inc. Data Collection 1
| Date post: | 22-Dec-2015 |
| Category: |
Documents |
| Upload: | jacob-warren |
| View: | 217 times |
| Download: | 4 times |

Copyright © 2013, 2010 and 2007 Pearson Education, Inc.
Data Collection
1

Copyright © 2013, 2010 and 2007 Pearson Education, Inc.
Introduction to the Practice of Statistics
1.1

Copyright © 2013, 2010 and 2007 Pearson Education, Inc. 1-3
Statistics is the science of collecting, organizing, summarizing, and analyzing information to draw conclusions or answer questions. In addition, statistics is about providing a measure of confidence in any conclusions.
The information referred to in the definition is data. Data are a “fact or proposition used to draw a conclusion or make a decision.” Data describe characteristics of an individual.
A key aspect of data is that they vary. Is everyone in your class the same height? Does everyone have the same hair color?
So, among individuals there is variability.
One goal of statistics is to describe and understand sources of variability.

Copyright © 2013, 2010 and 2007 Pearson Education, Inc. 1-4
The entire group of individuals to be studied is called the population.
A sample is a subset of the population that is being studied.
An individual is a person or object that is a member of the population being studied.

Copyright © 2013, 2010 and 2007 Pearson Education, Inc. 1-5
Descriptive statistics consist of organizing and summarizing data. Descriptive statistics describe data through numerical summaries, tables, and graphs.
A parameter is a numerical summary of a population.
A statistic is a numerical summary based on a sample.

Copyright © 2013, 2010 and 2007 Pearson Education, Inc. 1-6
Inferential statistics uses methods that take results from a sample, extends them to the population (prediction or inference) and then measures the reliability of the result.

Copyright © 2013, 2010 and 2007 Pearson Education, Inc.
EXAMPLE Parameter versus Statistic
1-7
Suppose the percentage of all students on your campus who have a job is 84.9%. This value represents a parameter because it is a numerical summary of a population.
Suppose a sample of 250 students on your campus is obtained, and from this sample we find that 86.4% have a job. This value represents a statistic because it is a numerical summary based on a sample.

Copyright © 2013, 2010 and 2007 Pearson Education, Inc. 1-8
Copyright © 2013, 2010 and 2007 Pearson Education, Inc. 1-9
Step 1: Identify the research objective.
To determine whether males accused of batterering their wives/girlfriends that were assigned into a 40-hour batter treatment program are less likely to batter again compared to those assigned to 40-hours of community service.

Copyright © 2013, 2010 and 2007 Pearson Education, Inc. 1-10
Step 2: Collect the information needed to answer the question.
The researchers randomly divided the subjects into two groups. Group 1 participants received the 40-hour batterer program, while group 2 participants received 40 hours of community service. Six months after the program ended, the percentage of males that battered their wife/girlfriend was determined.

Copyright © 2013, 2010 and 2007 Pearson Education, Inc. 1-11
Step 3: Describe the data - Organize and summarize the information.
The characteristics of the subjects in the experimental and control group were similar.
After the six month treatment, 21% of the males in the control group had further battering incidents, while 10% of the males in the treatment group had further battering incidents.

Copyright © 2013, 2010 and 2007 Pearson Education, Inc. 1-12
Step 4: Draw conclusions from the data.
We extend the results of the 376 males (sample) in the study to all males (population) who batter their wife/girlfriend. That is, males who batter their female partner and participate in a batter treatment program are less likely to batter again.

Copyright © 2013, 2010 and 2007 Pearson Education, Inc. 1-13
Variables are the characteristics of the individuals within the population.
Key Point: Variables vary. Consider height. If all individuals had the same height, then
obtaining the height of one individual would be sufficient to know the heights of all individuals. Of course, this is not the case. As researchers,
we wish to identify the factors that influence variability.

Copyright © 2013, 2010 and 2007 Pearson Education, Inc. 1-14
Qualitative or Categorical variables allow for classification of individuals based on some
attribute or characteristic.
Quantitative variables provide numerical measures of individuals. Arithmetic operations
such as addition/subtraction can be performed on the quantitative variable and provide meaningful
results.
Copyright © 2013, 2010 and 2007 Pearson Education, Inc. 1-15
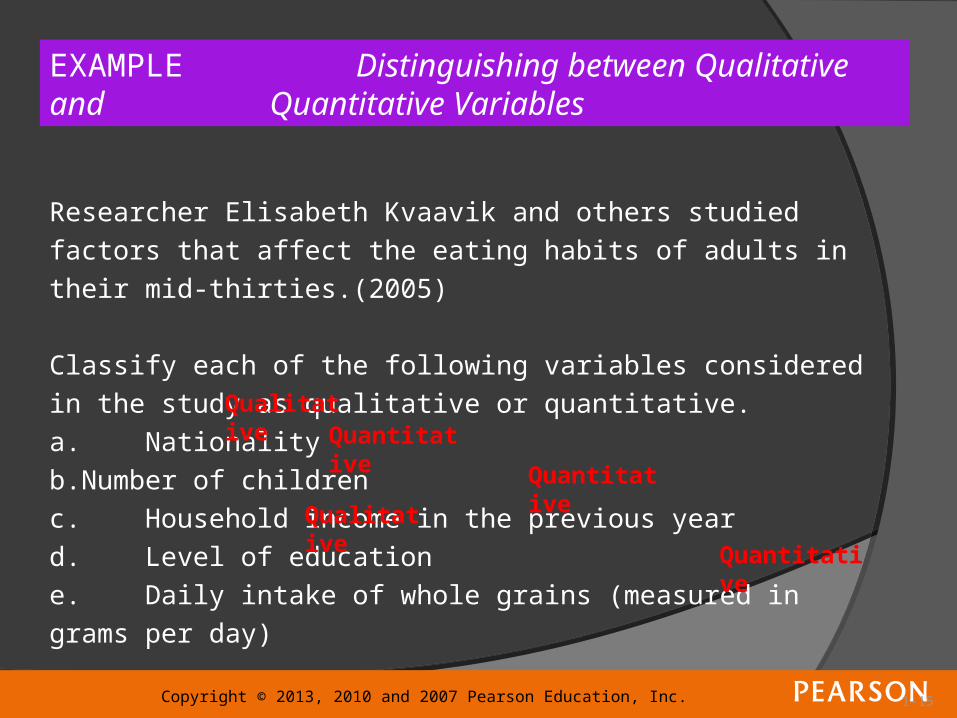
Researcher Elisabeth Kvaavik and others studied factors that affect the eating
habits of adults in their mid-thirties.(2005)
Classify each of the following variables considered in the study as qualitative
or quantitative.
a. Nationality
b.Number of children
c. Household income in the previous year
d. Level of education
e. Daily intake of whole grains (measured in grams per day)
EXAMPLE Distinguishing between Qualitative and Quantitative Variables
QualitativeQuantitative
Quantitative
Qualitative
Quantitative
Copyright © 2013, 2010 and 2007 Pearson Education, Inc. 1-16
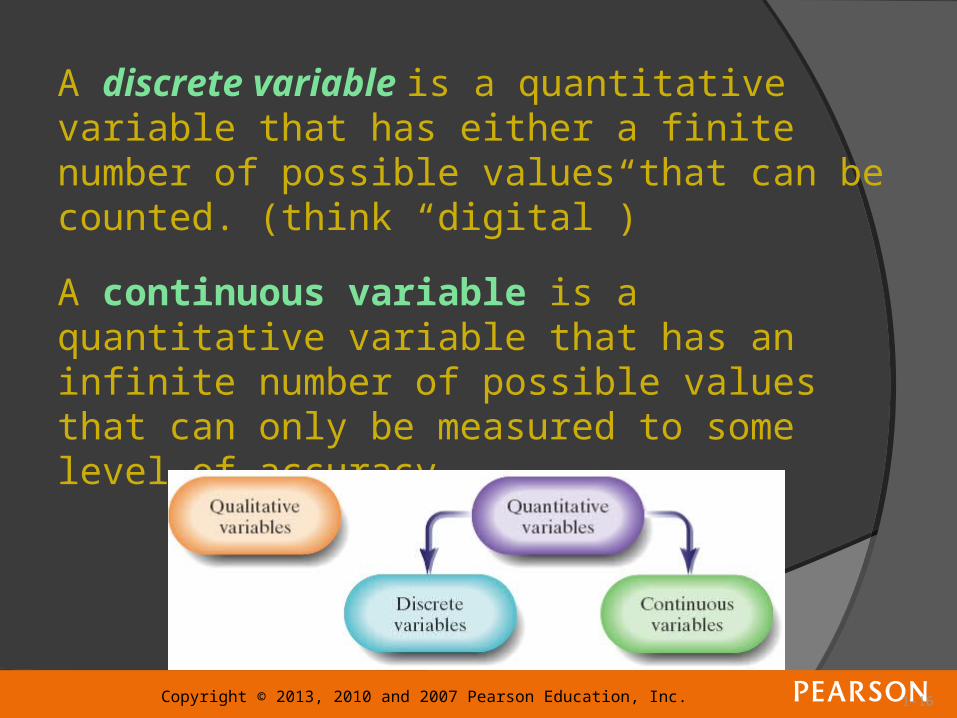
A discrete variable is a quantitative variable that has either a finite number of possible values that can be counted. (think “digital”)
A continuous variable is a quantitative variable that has an infinite number of possible values that can only be measured to some level of accuracy.

Copyright © 2013, 2010 and 2007 Pearson Education, Inc. 1-17
Researcher Elisabeth Kvaavik and others studied factors that affect the eating
habits of adults in their mid-thirties.
Classify each of the following quantitative variables considered in the study
as discrete or continuous.
a.Number of children
b.Daily intake of whole grains (measured in grams per day)
EXAMPLE Distinguishing between Discrete and Continuous Variables
Discrete
Continuous

Copyright © 2013, 2010 and 2007 Pearson Education, Inc. 1-18
The list of observations a variable assumes is called data.
While gender is a variable, the observations, male or female, are data.
Qualitative data are observations corresponding to a qualitative variable. Quantitative data are observations corresponding to a quantitative variable.
• Discrete data are observations corresponding to a discrete variable.
• Continuous data are observations corresponding to a continuous variable.

Copyright © 2013, 2010 and 2007 Pearson Education, Inc. 1-19
A variable is at the nominal level of measurement if the values of the variable name, label, or categorize. This level does not allow for the values of the variable to be arranged in a ranked order.
A variable is at the ordinal level of measurement if it has the properties of the nominal level of measurement and the values of the variable can be arranged in a ranked, or specific, order.
A variable is at the interval level of measurement if the differences in the values of the variable have meaning. A value of zero in the interval level of
measurement does not mean the absence of the quantity. Arithmetic operations such as addition/subtraction can be performed on values of the variable.
A variable is at the ratio level of measurement if the ratios of the values of the variable have meaning. A value of zero means the absence of the quantity (inherent zero). Arithmetic operations such as multiplication/division can be performed on the values of the variable.

Interval vs. Ratio Interval vs. Ratio MeasurementsMeasurements
Your car costs $15,000 more Your car costs $15,000 more than mine. (Interval)than mine. (Interval)
Your car costs $20,000 and Your car costs $20,000 and mine costs $5000. (Ratio=4.0)mine costs $5000. (Ratio=4.0)
Your car costs $285,000 and Your car costs $285,000 and mine costs $270,000. mine costs $270,000. (Ratio=1.05)(Ratio=1.05)

Copyright © 2013, 2010 and 2007 Pearson Education, Inc.
EXAMPLE Determining the Level of Measurement of a Variable
1-21
A study was conducted to assess school eating (lunch/snack) patterns in high schools in the United States. The study analyzed the impact of vending machines and school policies on student food consumption. A total of 1088 students in 20 schools were surveyed.
Determine the level of measurement of the following variables considered in the study.
a. Number of snack and soft drink vending machines in the school b.Whether or not the school has a closed campus policy during lunch c.Class rank (Freshman, Sophomore, Junior, Senior) d. Number of days per week a student eats school lunch
Ratio
Nominal
OrdinalRatio

Copyright © 2013, 2010 and 2007 Pearson Education, Inc.
Observational Studies Versus Designed Experiments
1.2

Copyright © 2013, 2010 and 2007 Pearson Education, Inc.
EXAMPLE Cellular Phones and Brain Tumors
1-23
Researchers Joachim Schüz wanted “to investigate cancer risk among Danish cellular phone users who were followed for up to 21 years.”
To do so, they kept track of 420,095 people whose first cellular telephone subscription was between 1982 and 1995. In 2002, they recorded the number of people out of the 420,095 people who had a brain tumor and compared the rate of brain tumors in this group to the rate of brain tumors in the general population.
Copyright © 2013, 2010 and 2007 Pearson Education, Inc.
EXAMPLE Cellular Phones and Brain Tumors
1-24
They found no significant difference in the rate of brain tumors between the two groups.
The researchers concluded “cellular telephone was not associated with increased risk for brain tumors.”

Copyright © 2013, 2010 and 2007 Pearson Education, Inc. 1-25
In this study, the goal of the research was to determine if radio frequencies from cell phones increase the risk of contracting brain tumors. Whether or not brain cancer was contracted is the response variable. ( “Dependent” variable)
The level of cell phone usage is the explanatory variable. (“Independent” variable, aka “Predictor” variable)
In research, we wish to determine how varying the amount of an explanatory variable affects the value of a response variable.

Copyright © 2013, 2010 and 2007 Pearson Education, Inc. 1-26
An observational study measures the value of the response variable without attempting to influence the value of either the response or explanatory variables. The researcher observes the behavior of the individuals in the study without trying to influence the outcome of the study.
If a researcher assigns the individuals in a study to a certain group (control/experimental), intentionally changes the value of the explanatory variable, and then records the value of the response variable for each group, the researcher is conducting a designed experiment.

Copyright © 2013, 2010 and 2007 Pearson Education, Inc.
EXAMPLE Observational Study or Designed Experiment? Do Flu shots Benefit Seniors?
1-27
Researchers wanted to determine the long-term benefits of the influenza vaccine on seniors aged 65 years and older. The researchers looked at records of over 36,000 seniors for 10 years. The seniors were divided into two groups. Group 1 were seniors who chose (experimental) to get a flu vaccination shot, and group 2 were seniors who chose not (control) to get a flu vaccination shot.
After observing the seniors for 10 years, it was determined that seniors who get flu shots are 27% less likely to be hospitalized for pneumonia or influenza and 48% less likely to die from pneumonia or influenza.
Based on the results of this study, would you recommend that all seniors go out and get a flu shot?

Copyright © 2013, 2010 and 2007 Pearson Education, Inc. 1-28
A study may have flaws! Namely, confounding.
Confounding in a study occurs when the effects of two or more explanatory variables are not separated. Therefore, any relation that may exist between an explanatory variable and the response variable may be due to some other variable or variables not accounted for in the study.
A lurking variable is an explanatory variable that was not considered in a study, but that affect the value of the response variable in the study

Copyright © 2013, 2010 and 2007 Pearson Education, Inc. 1-29
Some lurking variables in the influenza study:
age, health status, or mobility of the senior
Even after accounting for potential lurking variables, the authors of the study concluded that getting an influenza shot is associated with a lower risk of being hospitalized or dying from influenza.
Observational studies do not allow a researcher to claim causation, only association.

Copyright © 2013, 2010 and 2007 Pearson Education, Inc. 1-30
Cross-sectional Studies Observational studies that collect information about individuals at a specific point in time, or over a very short period of time.
Case-control Studies These studies are retrospective, meaning that they require individuals to look back in time or require the researcher to look at existing records. In case-control studies, individuals who have certain characteristics are matched with those that do not.
Cohort Studies A cohort study first identifies a group of individuals to participate in the study (the cohort). The cohort is then observed over a long period of time. Over this time period, characteristics about the individuals are recorded. Because the data is collected over time, cohort studies are prospective.

Copyright © 2013, 2010 and 2007 Pearson Education, Inc.
EXAMPLE Observational Study or Designed Experiment?
1-31
Determine whether each of the following studies depict an observational study or an experiment. If the researchers conducted an observational study, determine the type of the observational study.
Researchers wanted to assess the long-term psychological effects on children evacuated during World War II. They obtained a sample of 169 former evacuees and a control group of 43 people who were children during the war but were not evacuated. The subjects’ mental states were evaluated using questionnaires. It was determined that the psychological well being of the individuals was adversely affected by evacuation.
Observational study; Case-control
Copyright © 2013, 2010 and 2007 Pearson Education, Inc.
EXAMPLE Observational Study or Designed Experiment?
1-32
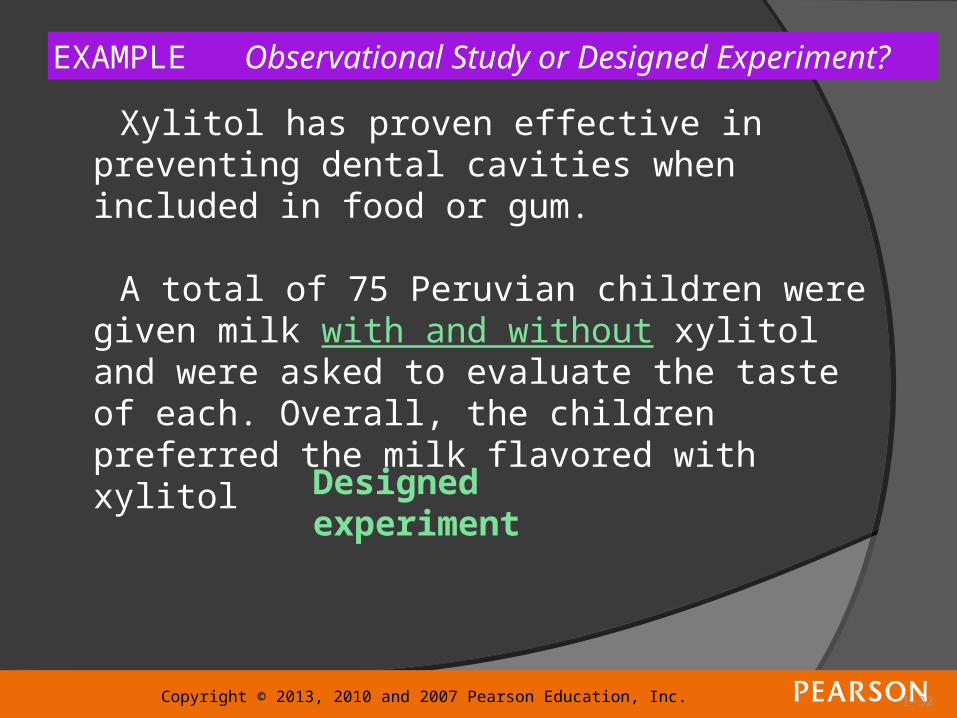
Xylitol has proven effective in preventing dental cavities when included in food or gum.
A total of 75 Peruvian children were given milk with and without xylitol and were asked to evaluate the taste of each. Overall, the children preferred the milk flavored with xylitol
Designed experiment
Copyright © 2013, 2010 and 2007 Pearson Education, Inc. 1-33
A census is a list of all individuals in a population along with certain characteristics of
each individual.

Copyright © 2013, 2010 and 2007 Pearson Education, Inc.
Simple Random Sampling
1.3

Copyright © 2013, 2010 and 2007 Pearson Education, Inc. 1-35
Random sampling is the process of using chance to select individuals from a population
to be included in the sample.
If convenience is used to obtain a sample, the results of the survey are meaningless.
Copyright © 2013, 2010 and 2007 Pearson Education, Inc. 1-36
A sample of size n from a population of size N is obtained through simple random sampling if every possible sample of size n has an equally likely chance of occurring.
The sample is then called a simple random sample.

Copyright © 2013, 2010 and 2007 Pearson Education, Inc. 1-37
EXAMPLE Illustrating Simple Random Sampling
Suppose a study group of consists of 5 students:
Bob, Patricia, Mike, Jan, and Maria
2 of the students must go to the board to demonstrate a homework problem. List all possible samples of size 2
(without replacement).• Bob, Patricia
• Bob, Mike
• Bob, Jan
• Bob, Maria
• Patricia, Mike
• Patricia, Jan
• Patricia, Maria
• Mike, Jan
• Mike, Maria
• Jan, Maria

Copyright © 2013, 2010 and 2007 Pearson Education, Inc. 1-38
EXAMPLE Obtaining a Simple Random Sample
The 112th Congress of the United States had 435 members in the House of Representatives.
Explain how to conduct a simple random sample of 5 members to attend a Presidential luncheon. Then
obtain the sample.

Copyright © 2013, 2010 and 2007 Pearson Education, Inc. 1-39
EXAMPLE Obtaining a Simple Random Sample
Step 1: Put the members in alphabetical order. Number the members from 1 - 435.
Step 2: Randomly select 5 numbers using a random number generator, such as your TI-84 graphing
calculator.


Copyright © 2013, 2010 and 2007 Pearson Education, Inc.
Data Collection
1

Copyright © 2013, 2010 and 2007 Pearson Education, Inc.
Other Effective Sampling Methods
1.4

Types of Samples:Types of Samples:
1.1. StratifiedStratified
2.2. SystematicSystematic
3.3. ClusterCluster
4.4. Convenience (boo, hiss)Convenience (boo, hiss)

Copyright © 2013, 2010 and 2007 Pearson Education, Inc. 1-44
A stratified sample is one obtained by separating the population into homogeneous groups called strata, and then obtaining a simple random sample from each stratum.

Copyright © 2013, 2010 and 2007 Pearson Education, Inc. 1-45
EXAMPLE Obtaining a Stratified Sample
In 2008, the United States Senate had 47 Republicans, 51 Democrats, and 2 Independents. The president wants to have a luncheon with 4 Republicans, 4 Democrats and 1 Misc.
Conduct a simple random sample within each group.
That is, obtain a simple random sample of 4 Republicans (from the 47), a simple random sample of 4 Democrats (from the 51), and a simple random sample of 1 other from the 100.
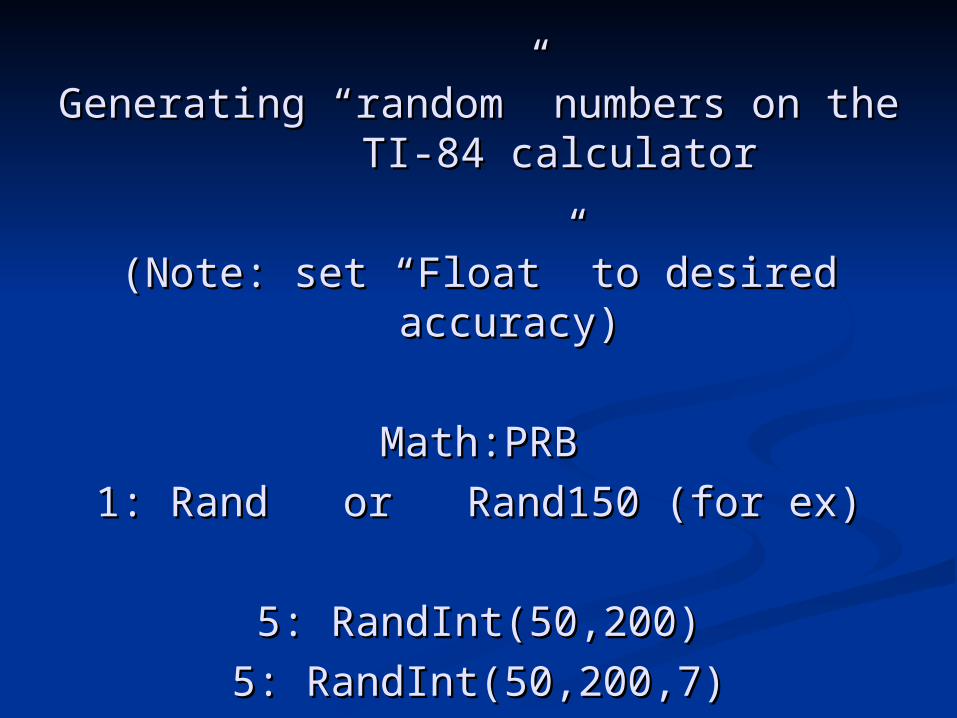
Generating “random” numbers on the Generating “random” numbers on the TI-84 calculator TI-84 calculator
(Note: set “Float” to desired accuracy)(Note: set “Float” to desired accuracy)
Math:PRBMath:PRB
1: Rand or Rand150 (for ex)1: Rand or Rand150 (for ex)
5: RandInt(50,200)5: RandInt(50,200)
5: RandInt(50,200,7)5: RandInt(50,200,7)
Copyright © 2013, 2010 and 2007 Pearson Education, Inc. 1-47
A systematic sample is obtained by selecting every kth individual from the population.
The first individual selected (seed) is a random number between 1 and k.
In other words, start with the 17th item and then select every 34 (k) items afterwards.

Copyright © 2013, 2010 and 2007 Pearson Education, Inc. 1-48
EXAMPLE Obtaining a Systematic Sample
A quality control engineer wants to obtain a systematic sample of 25 bottles of Olive oil coming off an assembly line to verify the oil filling machine is working properly.
To get a “systematic” sample of 25 bottles, start with the 17th bottle (pull it off the line) and then sample every 8 bottles until you have 25 total bottles of oil to examine.
(Note: both 17 and 8 must be random numbers).

Copyright © 2013, 2010 and 2007 Pearson Education, Inc. 1-49
A cluster sample is obtained by selecting all individuals within a randomly selected collection or group of individuals.

Copyright © 2013, 2010 and 2007 Pearson Education, Inc. 1-50
EXAMPLE Obtaining a Cluster Sample
A school administrator wants to obtain a sample of students in order to conduct a survey.
She randomly selects 10 classes and administers the survey to all the students in the class.

Copyright © 2013, 2010 and 2007 Pearson Education, Inc. 1-51

Copyright © 2013, 2010 and 2007 Pearson Education, Inc. 1-52
A convenience sample is one in which the individuals in the sample are easily obtained.
(boo, hiss….)
Any studies that use this type of sampling generally have results that are suspect and should be looked upon with extreme skepticism.

Copyright © 2013, 2010 and 2007 Pearson Education, Inc. 1-53
EXAMPLE Multistage Sampling
In practice, most large-scale surveys obtain samples using a combination of the techniques just presented.
As an example of multistage sampling, Nielsen Media Research randomly selects households and monitors the television programs these households are watching through a “People Meter”.
The meter is an electronic box placed on each home TV and the People Meter measures what program is being watched and who is watching it.
Nielsen selects the households with the use of a two-stage sampling process.
Copyright © 2013, 2010 and 2007 Pearson Education, Inc. 1-54
EXAMPLE Multistage Sampling
Stage 1: Using U.S. Census data, Nielsen divides the country into geographic areas (strata). The strata are typically city blocks in urban areas and geographic regions in rural areas. About 6000 strata are randomly selected.
Stage 2: Nielsen sends representatives to the selected strata and some households are randomly selected to be used by a simple random sample.
Nielsen sells the resulting information to TV stations and companies. These results are used to help determine prices for commercials.

Copyright © 2013, 2010 and 2007 Pearson Education, Inc.
Bias in Sampling
1.5
Copyright © 2013, 2010 and 2007 Pearson Education, Inc. 1-56
If the results of the sample are not representative of the population (sampling error), then the sample has
“bias” (boo, hiss).
Three Sources of Bias
1. Sampling Bias
2. Nonresponse Bias
3. Response Bias
Copyright © 2013, 2010 and 2007 Pearson Education, Inc. 1-57
Sampling bias means that the technique used to obtain the individuals to be in the sample tends to favor one part of the population over another.
Undercoverage is a type of sampling bias which occurs when the proportion of one segment of the population is lower in a sample than it is in the population.
(e.g., the sample contains 80% men, but only 20% women)

Copyright © 2013, 2010 and 2007 Pearson Education, Inc. 1-58
Nonresponse bias exists when individuals selected to be in the sample who do not respond to the survey have different opinions from those who do.
(ex: most individuals who are for Gun-control do not bother to respond/return the survey)
(Nonresponse can be improved through the use of callbacks or rewards/incentives.)

Copyright © 2013, 2010 and 2007 Pearson Education, Inc. 1-59
Response bias exists when the answers on a survey do not reflect the true feelings of the respondent.
Types of Response Bias
1. Interviewer error (emphasis, emotion)
2. Poorly written survey questions, either by accident or design
Copyright © 2013, 2010 and 2007 Pearson Education, Inc. 1-60
Non-sampling errors are errors that result from sampling bias, nonresponse bias, response bias, or data-
entry error. Such errors could also be present in a complete census of the population.
Sampling error is error that results from using a sample to estimate information about a population. This type of
error occurs because a sample gives incomplete information about a population.

Copyright © 2013, 2010 and 2007 Pearson Education, Inc.
The Design of Experiments
1.6

Copyright © 2013, 2010 and 2007 Pearson Education, Inc. 1-62
An experiment is a controlled study conducted to determine what effect varying one or more explanatory (predictor) variables
called factors has on a response variable.
Any combination of the values of the factors is called a treatment.
The experimental unit (or subject) is a person or other item upon which the treatment is applied.
A control group serves as a baseline treatment that can be used to compare to other treatments (usually they do not get the
drug). A placebo is an innocuous medication, such as a sugar tablet,
that looks, tastes, and smells like the experimental medication.

Copyright © 2013, 2010 and 2007 Pearson Education, Inc. 1-63
Blinding refers to nondisclosure of which treatment a subject is receiving.
(is the person getting the test drug or the placebo?)
A single-blind experiment is one in which the subject does not know which treatment he/she is receiving.
A double-blind experiment is one in which neither the subject nor the researcher (nurse) knows which treatment the subject is receiving.

Types of Experiment Designs:Types of Experiment Designs:
1. Completely Randomized1. Completely Randomized
2. Matched-Pairs2. Matched-Pairs
3. Randomized Block3. Randomized Block

Copyright © 2013, 2010 and 2007 Pearson Education, Inc. 1-65
The English Department is considering adopting an online version of a college English course. To compare the effectiveness of the new
online course to the traditional classroom course, a Professor randomly splits a section of students. Half of the students receive the traditional course and the other half the online version. At the
end of the semester, both groups will be given an exam to determine which performed better.
EXAMPLE Characteristics of an Experiment
(a) Who are the experimental units?
(b) What is the population for which this study applies?
(c) What are the treatments?
(d) What is the response variable?
(e) Why can’t this experiment be conducted with blinding?
The students in the class
All students who enroll in the class
Traditional vs. online instruction
Exam score
Both the students and instructor know which treatment they are receiving

Copyright © 2013, 2010 and 2007 Pearson Education, Inc. 1-66
1. A completely randomized experiment is one in which each subject (experimental unit) is randomly
assigned to a treatment (set of factors).

Copyright © 2013, 2010 and 2007 Pearson Education, Inc. 1-67
Step 1: The predictor variable is octane rating & the response variable is miles per gallon (mpg).
Step 2: Other factors (variables) that affect miles per gallon:
Engine size, outside temperature, driving style, driving conditions, characteristics of car
An automotive engineer wants to know whether the level of octane in gasoline affects the gas mileage of an
automobile. Design an experiment.
EXAMPLE Designing an Experiment

Copyright © 2013, 2010 and 2007 Pearson Education, Inc. 1-68
Step 3: We will use 12 cars; all of the same model and year.
Step 4: List the factors and their level.
• Octane level - manipulated at 3 levels. Treatment A: 87 octane, Treatment B: 89 octane, Treatment C: 92 octane (“High Test”)
• Engine size - fixed
• Temperature (OAT) - uncontrolled, but the same for all 12 cars.
• Driving style/conditions - all 12 cars will be driven under the same conditions on a closed track - fixed.
• Other characteristics of car - all 12 cars will be the same model year, but there is probably small variation from car to car. To account for this, randomly assign the cars to the octane level.

Copyright © 2013, 2010 and 2007 Pearson Education, Inc. 1-69
Step 5: Randomly assign 4 cars to drive 87 octane, 4 cars to 89 octane, and 4 cars to 92 octane. Fill each car with 3 gals of gas. Drive the cars until they run out of gas. Compute the mpg driven.
Step 6: Determine whether any differences exist in miles per gallon based on octane of their fuel.
In other words, is there any correlation between octane rating (indep var) and mpg (dep
variable)

Copyright © 2013, 2010 and 2007 Pearson Education, Inc. 1-70
Completely Randomized Experimental Design
Copyright © 2013, 2010 and 2007 Pearson Education, Inc. 1-71
2. A matched-pairs design is an experimental design in which the experimental subjects are paired up.
The pairs are matched up so that they are somehow related (that is, the same person before and after a treatment, twins, husband and wife, same geographical location, and so on).
There are only two levels of treatment in a matched-pairs design.

Copyright © 2013, 2010 and 2007 Pearson Education, Inc. 1-72
Xylitol has proven effective in preventing dental cavities when included in food or gum. A total of 75 children were given both the milk with and without Xylitol and were asked to evaluate (rate) the taste of each.
The researchers measured the children’s ratings (qualitative) of the two types of milk
EXAMPLE A Matched-Pairs Design
(a) What is the response variable in this experiment? (b) Which factors are controlled? Which factor is manipulated?
(c) What are the treatments? How many treatments are there?
Rating
Age/gender of the children is controlled; Milk with/without Xylitol is manipulated
1. milk with Xylitol; 2. milk without xylitol

Copyright © 2013, 2010 and 2007 Pearson Education, Inc. 1-73
(d) What type of experimental design is this?
(e) Identify the subjects/experimental units.
(f) Why would it be a good idea to randomly assign whether the
child drinks the milk with Xylitol first or second?
(g) Do you think it would be a good idea to double-blind this
experiment?
Matched-pairs design
75 children
Remove any effect due to order in which milk is drunk.
Yes!

Copyright © 2013, 2010 and 2007 Pearson Education, Inc. 1-74
3. A randomized block design is used when all the subjects are divided into homogeneous groups called blocks. (e.g., Russians, French, Greeks, etc)
Then, within each block, the subjects are randomly assigned to different treatments. (e.g.,x: one gets the drug, one gets the sugar)

Copyright © 2013, 2010 and 2007 Pearson Education, Inc. 1-75
Grouping similar (homogeneous) subjects together and then randomizing the subjects within each group to a treatment is called blocking. Each group of homogeneous individuals is called a block.
(e.g., separating men and women subjects into blocks and then randomly selecting members from each block to receive treatment)
Confounding occurs when the effect of two different factors (predictor/explanatory variables) on the response variable cannot be distinguished.
Copyright © 2013, 2010 and 2007 Pearson Education, Inc. 1-76
Recall, the English Department is considering adopting an online version of the freshman English course. After some
deliberation, the English Department thinks that there may be a difference in the performance of the men and women
in both the traditional and online courses. To accommodate any potential differences, they randomly
assign half the 60 men to each of the two courses and they do the same for the 70 women.
EXAMPLE A Randomized Block Design
This is a randomized block design where gender forms the block. This way, gender will not play a role in the value of the response
variable which is the final test score.
We do not compare test results across gender.

Copyright © 2013, 2010 and 2007 Pearson Education, Inc. 1-77

ENDEND
CHAPTER 1CHAPTER 1
““DATA COLLECTION”DATA COLLECTION”


