Page 1
EVALUATING THE IMPACT OF FIBER PROCESSING ON COTTON FIBER
TENSILE PROPERTIES
by
Ruvini Mathangadeera, B. Sc.
A Thesis
In
PLANT AND SOIL SCIENCE
Submitted to the Graduate Faculty
of Texas Tech University in
Partial Fulfillment of
the Requirements for
the Degree of
MASTER OF SCIENCE
Approved
Dr. Eric Hequet
Chair of Committee
Dr. Noureddine Abidi
Dr. John Wanjura
Mark Sheridan
Dean of the Graduate School
December, 2014
Page 2
Copyright 2014, Ruvini Mathangadeera
Page 3
Texas Tech University, Ruvini Mathangadeera, December 2014
ii
ACKNOWLEDGEMENTS
First and foremost I wish to express my most sincere gratitude to my advisor, Dr. Eric
Hequet, for his inspiring supervision and untiring guidance throughout the research study
and the graduate program. I am also greatly indebted to the members of my advisory
committee, Dr. Noureddine Abidi and Dr. John Wanjura for their support and guidance.
I would also like to thank the entire staff at the Fiber and Biopolymer Research Institute
for their kind assistance throughout my research study. Special thanks go to Brendan
Kelly, who is always willing to share his valuable ideas and knowledge with his
colleagues. I gratefully acknowledge all my friends at the Fiber and Biopolymer Research
Institute, Addissu Ayele, Kolby Mccormick, Suman Lamichhane, Roji Manandhar,
Deepika Mishra and all the friends at the Biopolymer lab for their help and friendship.
I am grateful to Cotton Incorporated for providing financial support for this research.
My sincere thanks also go to Sankalya Ambagaspitiya and all the Sri Lankan friends at
Lubbock for their invaluable assistance during my stay here. Finally, a warm and special
word of thanks goes to my parents and my brother for their unconditional encouragement
and emotional support.
Page 4
Texas Tech University, Ruvini Mathangadeera, December 2014
iii
TABLE OF CONTENTS
ACKNOWLEDGEMENTS ................................................................................................ ii
ABSTRACT……………………………………………………………………………….v
LIST OF TABLES……………………………………………………………………….vii
LIST OF FIGURES……………………………………………………………………..viii
1. LITERATURE REVIEW ............................................................................................... 1
1.1 Tensile Properties of Cotton Fibers ........................................................................... 1
1.2 Relationship between Single Fiber and Fiber Bundle Tensile Properties
of Cotton ................................................................................................................... 7
1.3 Impact of Fiber Processing on Cotton Fiber Tensile Properties ............................. 10
1.4 Cotton Fiber Elongation and its Importance ........................................................... 13
2. EVALUATING THE RELATIONSHIPS BETWEEN TENSILE PROPERTIES
OF SINGLE FIBERS AND FIBER BUNDLES OF COTTON .................................. 24
2.1 Introduction ............................................................................................................. 24
2.2 Objectives ................................................................................................................ 31
2.3 Materials and Methods ............................................................................................ 31
2.4 Results and Discussion ............................................................................................ 33
2.5 Conclusion ............................................................................................................... 46
3. EVALUATING THE IMPACT OF FIBER PROCESSING ON TENSILE
PROPERTIES OF COTTON FIBERS......................................................................... 49
3.1 Introduction ............................................................................................................. 49
Page 5
Texas Tech University, Ruvini Mathangadeera, December 2014
iv
3.2 Objectives ................................................................................................................ 53
3.3 Materials and Methods ............................................................................................ 53
3.4 Results and Discussion ............................................................................................ 57
3.5 Conclusion ............................................................................................................... 72
4. EVALUATING THE IMPORTANCE OF COTTON FIBER ELONGATION IN
TERMS OF FIBER PROCESSING ............................................................................. 74
4.1 Introduction ............................................................................................................. 74
4.2 Hypotheses .............................................................................................................. 77
4.3 Objectives ................................................................................................................ 79
4.4 Materials and Methods ............................................................................................ 79
4.5 Results and Discussion ............................................................................................ 82
4.6 Conclusion ............................................................................................................. 106
5. SUMMARY AND CONCLUSION………………………………………………....109
REFERENCES ............................................................................................................... 112
Page 6
Texas Tech University, Ruvini Mathangadeera, December 2014
v
ABSTRACT
Cotton fiber tensile properties impact the processing performance of the fibers and the
quality of the final product. Among the main tensile properties, fiber strength is
considered as the dominant tensile property while fiber elongation has generally been
neglected. The presence of a negative correlation between bundle tenacity and elongation
is a main reason for the lack of interest in elongation. In this study, a positive correlation
was detected between individual fiber strength and elongation measured by FAVIMAT,
whereas negative correlations were observed between bundle tenacity and elongation
measured by both Stelometer and HVI. The negative relationship between bundle
tenacity and elongation can be explained by the variation in individual fiber elongation of
the constituent fibers of a bundle.
Impact of fiber processing on the tensile properties was assessed employing two levels of
processing, namely light processing and aggressive processing. Light processing does not
cause enough fiber breakage to reveal an impact of processing. Yet, during aggressive
processing higher elongation fibers tend to show better performance. Therefore, with the
increasing processing speeds in the textile industry, the importance of elongation will be
more prominent.
The importance of elongation suggested at the earlier stages of the study, was further
assessed employing samples which represented a wide range in elongation. All other
fiber properties except elongation were constant within a family. The results indicated the
better performance of higher elongation fibers. Thus, in order to achieve better processing
Page 7
Texas Tech University, Ruvini Mathangadeera, December 2014
vi
performance of fibers, elongation should be given more consideration in the breeding
programs.
Page 8
Texas Tech University, Ruvini Mathangadeera, December 2014
vii
LIST OF TABLES
2.1 Descriptive statistics of the FAVIMAT and HVI tensile measurements of
the 30 samples selected for the experiment……………………………………….32
2.2 Average tensile property measurements of the three calibration cottons
used in the Stelometer……………………………………………………………..33
2.3 Descriptive statistics of the Stelometer tensile measurements of the
30 samples…………………………………………………………………………34
3.1 Mean tensile property measurements of the selected samples for stage I
(measured by FAVIMAT)……………………………………...………………….54
3.2 Mean AFIS fiber properties of the selected samples for stage I…………………..54
4.1 Mean tensile property measurements of each group for the raw stage…………....81
4.2 Student’s t-test ranking of difference between raw and processed cotton in
mean elongation-at-break of the 32 samples………………………………………86
4.3 Mean separation of difference between raw and processed cotton in
mean elongation-at-break of the two families……………………………………..87
4.4 Student’s t-test ranking of difference between raw and processed cotton in
mean force-to-break of the 32 samples…………………………………………….89
4.5 Student’s t-test ranking of difference between raw and processed cotton in
mean work-to-break of the 32 samples…………………………………………….91
Page 9
Texas Tech University, Ruvini Mathangadeera, December 2014
viii
LIST OF FIGURES
1.1 Cotton fiber force-elongation curve………………………………………………...2
1.2 Relationships between crystallinity and tensile properties of native
Egyptian cotton (Hindeleh, 1980)………………………………………………….21
2.1 Stelometer………………………………………………………………………….26
2.2 Components of the Stelometer……………………………………………………..27
2.3 High Volume Instrument (HVI)…………………………………………………...29
2.4 FAVIMAT…………………………………………………………………………30
2.5 Relationship between tenacity and elongation determined by Stelometer………...35
2.6 Relationship between strength and elongation determined by HVI……………….36
2.7 Relationship between force-to-break and elongation-at-break determined
by FAVIMAT……………………………………………………………………...37
2.8 Relationship between FAVIMAT elongation and the standard deviation of
FAVIMAT elongation……………………………………………………………..40
2.9 Relationship between Stelometer elongation and FAVIMAT elongation………….41
2.10 Relationship between HVI elongation and FAVIMAT elongation………………...42
2.11 Relationship between Stelometer elongation and HVI elongation…………………43
2.12 Relationship between Stelometer tenacity and FAVIMAT force-to-break………...44
2.13 Relationship between HVI strength and FAVIMAT force-to-break……………….45
2.14 Relationship between Stelometer tenacity and HVI strength………………………46
3.1 Advanced Fiber Information System (AFIS)……………………………………….51
Page 10
Texas Tech University, Ruvini Mathangadeera, December 2014
ix
3.2 AFIS fiber individualizer………………………………………………………….52
3.3 Microdust and Trash Monitor (MTM)…………………………………………….53
3.4 Procedure for evaluating the impact of less aggressive (AFIS) processing……….56
3.5 Procedure for evaluating the impact of very aggressive (MTM) processing……...57
3.6 AFIS length distribution of sample 3643 in the 3 stages………………………….58
3.7 Mean elongation-at-break values of the 5 samples across the 3 stages…………...59
3.8 Mean force-to-break values of the 5 samples across the 3 stages………………....60
3.9 Mean work-to-break values of the 5 samples across the 3 stages…………………61
3.10 AFIS length distribution of sample 25 in the 3 stages……………………………..64
3.11 AFIS length distribution of sample 3552 in the 3 stages…………………………..64
3.12 AFIS length distribution of sample 3653 in the 3 stages…………………………..65
3.13 AFIS length distribution of sample 8 in the 3 stages………………………………66
3.14 AFIS length distribution of sample 25 at light and aggressive
processing stages…………………………………………......................................67
3.15 Mean force-to-break values of the 5 samples at the 2 processing stages…………..68
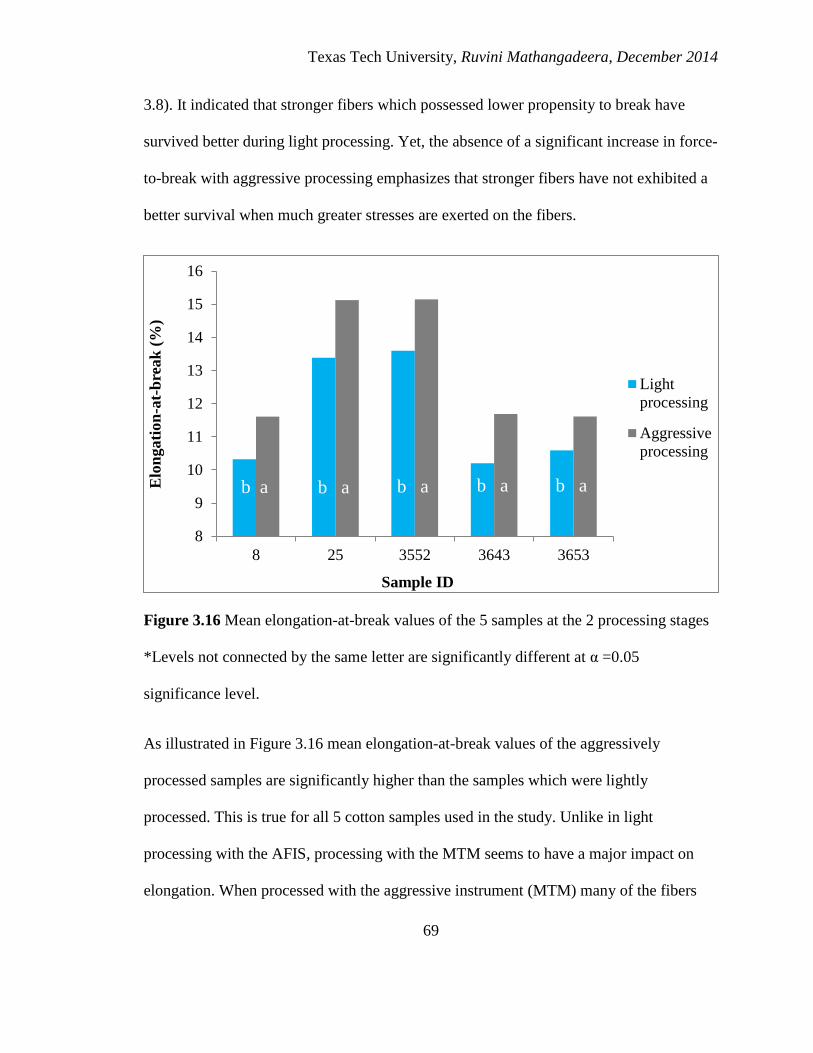
3.16 Mean elongation-at-break values of the 5 samples at the 2 processing stages…….69
3.17 Mean work-to-break values of the 5 samples at the 2 processing stages………….71
4.1 Micro Dust and Trash Analyzer 3 (MDTA 3)……………………………………..76
4.2 Cottonscope………………………………………………………………………..77
4.3 Hypothesized elongation-at-break distributions of the raw and
processed stages……………………………………………………………………78
Page 11
Texas Tech University, Ruvini Mathangadeera, December 2014
x
4.4 The cotton samples selected for the experiment………………………………....80
4.5 AFIS length distributions of lower elongation group of family 1 in raw
and processed stages…………………………………………………………….83
4.6 Mean elongation-at-break values of the 8 groups for the two stages……………84
4.7 Mean force-to-break values of the 8 groups for the two stages………………….88
4.8 Mean work-to-break values of the 8 groups for the two stages………………….90
4.9 Elongation-at-break distributions of the 4 field replications of location A
of higher elongation group of family 1 at the raw stage…………………………..93
4.10 Elongation-at-break distributions of the two elongation groups of family 1
for both raw and processed stages………………………………………………..94
4.11 Elongation-at-break distributions of the two elongation groups of family 2
for both raw and processed stages………………………………………………..96
4.12 Force-to-break distributions of the two elongation groups of family 1
for both raw and processed stages………………………………………………..97
4.13 Force-to-break distributions of the two elongation groups of family 2
for both raw and processed stages………………………………………………..98
4.14 Work-to-break distributions of the two elongation groups of family 1
for both raw and processed stages………………………………………………..99
4.15 Work-to-break distributions of the two elongation groups of family 2
for both raw and processed stages……………………………………………….100
4.16 AFIS length distributions of the two elongation groups of family 1
at the raw stage…………………………………………………………………..101
4.17 AFIS length distributions of the two elongation groups of family 1
at the processed stage……………………………………………………………102
Page 12
Texas Tech University, Ruvini Mathangadeera, December 2014
xi
4.18 Individual fiber force-elongation scatter plot of location A of higher
elongation group of family 1……………………………………………………104
4.19 Individual fiber force-elongation scatter plot of location A of lower
elongation group of family 1…………………………………………………….105
4.20 Individual fiber force-elongation scatter plot of location A of higher
elongation group of family 2…………………………………………………….105
Page 13
Texas Tech University, Ruvini Mathangadeera, December 2014
1
CHAPTER I
LITERATURE REVIEW
1.1 Tensile Properties of Cotton Fibers
The mechanical properties of textile fibers describe the behavior of the fibers under
applied forces and deformations (Collier & Tortora, 2001). Tensile properties of textile
fibers are the most widely studied mechanical properties which define the responses of
the fibers to forces and deformations applied along the fiber axis. In addition, the tensile
properties of textile fibers are probably the most important properties, which contribute to
the performance of fibers during processing and the quality of the final product (Morton
& Hearle, 1993). Therefore, cotton fiber tensile properties are considered to be the
indicators of the tensile properties of the yarn and fabric.
Tensile strength is a measure of the tensile force required to break a fiber, which is
known as tenacity when it is expressed with respect to linear density. Tenacity is usually
measured in grams per tex (g/tex). Tenacity can be used for appropriately comparing
different types of fiber since linear density is used in its calculation. For instance, when
nylon and polyester fibers of the same diameter break under identical tensile forces, the
nylon fiber will have a higher tenacity because of its lower density (Collier & Tortora,
2001).
The primary constituent of cotton fibers is the natural polymer cellulose. It is known that
the rigidity of the cellulosic chains, the highly fibrillar and crystalline structure of
cellulose, and the extensive intermolecular and intramolecular hydrogen bonding are the
factors which contribute to the strength of cotton fibers. In addition, the molecular weight
Page 14
Texas Tech University, Ruvini Mathangadeera, December 2014
2
of cellulose, the molecular weight distributions, and the reversal and convolution
structure of fibers also act as indicators of cotton fiber tensile properties. An increase in
average molecular weight usually results in an increase in tensile strength of cotton fibers
(Timpa & Ramey, 1994).
Elongation is the degree of stretching or lengthening of a fiber under a tensile force. Fiber
elongation is commonly measured as “elongation-at-break”, which is the amount of
stretch that can be endured by the fiber before it breaks. A fiber that will stretch or
elongate more prior to breakage will show greater “toughness”, or durability, than a
stiffer fiber which breaks at the same breaking load but at a lower elongation (Collier &
Tortora, 2001). Work of rupture or toughness is the energy needed to break the fiber. It is
equal to the area under the load-elongation curve, which displays the behavior of an
individual fiber under a gradually increasing applied force (Morton & Hearle, 1993).
Figure 1.1 Cotton fiber force-elongation curve
Page 15
Texas Tech University, Ruvini Mathangadeera, December 2014
3
Both load-elongation and stress-strain curves possess the same shape while load-
elongation curves can be converted into stress-strain curves by changing units of the
tensile properties. Fiber modulus which is the ratio of stress to strain is defined by the
slope of the initial linear portion of the stress-strain or the load elongation curve. This
initial modulus represents the stiffness of a fiber. A stiffer fiber is characterized by a
higher initial modulus whereas a more flexible fiber is characterized by a lower initial
modulus.
As stated by Morton and Hearle (1993), the results of tensile experiments will be
impacted by the condition of the fibers, the arrangement and dimensions of the specimen,
and the nature and duration of the experiment. The history of the fiber, such as the
processes the fiber has undergone previously, its moisture content and temperature, are
factors which contribute to the condition of the fiber. All the above conditions must be
specified for the results of the tests to be of worth. When considering the dimensions of
the specimen, length and area of cross-section are important. In a variable material like
cotton fiber, there is a greater chance of presence of a very weak place in a long length
compared to a short length. As a fiber breaks at the weakest place, mean breaking load of
long lengths will be less than that of short ones. Therefore, it is necessary to state the
length of the tested specimen.
The elongation of a textile fiber is not just a function of the applied load. It also depends
on the length of time for which the present load and any previous loads have been
applied. The load required for fiber breakage will be different depending on the speed of
the tensile test. A higher breaking load will be required for a rapid test compared to a
Page 16
Texas Tech University, Ruvini Mathangadeera, December 2014
4
slow one. Since the load is applied for a short period of time in a rapid test, it needs to be
higher to be great enough to cause fiber breakage. The nature of the experiment means
the manner in which the load is applied. The load can be applied by means of constant
rate of elongation, constant rate of loading, reduction from a higher load, or any other
sequence of events (Morton & Hearle, 1993).
Properties of a fiber, including strength and elongation, are affected by the arrangement
of its constituent polymer chains within the fiber. A random, disordered arrangement of
polymer chains gives rise to an amorphous region while ordered, parallel arrangement of
polymer chains results in a crystalline region within the fiber. The amorphous regions are
weaker than the crystalline regions (Collier & Tortora, 2001). Thus, crystalline regions
are known to be important for fiber strength whereas amorphous regions are known to be
important for fiber elongation.
Several different methods are used for measuring tensile properties of textile fibers
depending upon the end-use of the textile fabric to be evaluated (Grant et al., 1952).
Tensile properties of cotton fibers can be determined from single fiber tests or fiber
bundle tests. Single fiber tensile tests are time consuming and tedious. Thus, these are
considered to be unrealistic for large scale and industrial applications related to cotton,
and are widely being used for research purposes. Bundle tests are usually faster, and are
known to better predict yarn tensile properties since fiber bundle simulates the yarn.
Therefore, bundle tests are usually preferred over single fiber tensile tests. Yet, as stated
by Hsieh (1999) bundle strength measurement is not sensitive to strength variability.
Hence the measurement of single fiber strength is also necessary.
Page 17
Texas Tech University, Ruvini Mathangadeera, December 2014
5
Another drawback associated with bundle tensile tests is that bundle tensile properties do
not always correlate well with individual fiber tensile properties. A fiber bundle
consisting of fine immature fibers could have higher bundle strength merely due to the
fact that it contains more fibers for a given weight. Accordingly a fiber bundle consisting
of coarse and mature fibers could have lower bundle strength as it contains fewer fibers
in a given weight. Therefore, fibers that may have been regarded as weak by individual
fiber tests have a probability of being considered as strong when subjected to bundle
tensile tests, except in extreme scenarios where fibers are extremely immature or mature.
Mantis and FAVIMAT are the main instruments used for individual fiber tensile property
testing. FAVIMAT has been primarily developed for man-made fiber testing. Unlike
man-made fibers cotton fibers possess higher within sample variability. Therefore, when
cotton fiber properties are determined with FAVIMAT a higher amount of fibers need to
be tested.
Both FAVIMAT and Mantis operate according to the principle of constant rate of
elongation. In general both instruments employ similar techniques to obtain
measurements. A single fiber is clamped at both ends between two sets of jaws. Then a
computer system controls fiber breakage and provides tensile property measurements and
force elongation curves. In Mantis, fibers are manually placed between clamps while this
process is automated in FAVIMAT. However, it can also be performed manually if
necessary. FAVIMAT also differs from Mantis by providing a linear density
measurement which is determined using vibroscopic technique. Even though FAVIMAT
fiber testing can be done at any gauge length from 2mm to 100mm, linear density can be
Page 18
Texas Tech University, Ruvini Mathangadeera, December 2014
6
determined only at the 10mm gauge or higher gauge lengths. Furthermore, FAVIMAT
also measures fiber crimp which is not measured by Mantis.
Pressley and Stelometer are the conventional fiber strength testers used for the bundle
measurements. Stelometer is much preferred over Pressley since it provides an elongation
measurement in addition to strength. Gauge lengths of zero and 3.2 mm can be used with
Pressley while 3.2 mm gauge length is used with Stelometer. In both instruments linear
density is measured by weighing fiber bundles of known length. Nevertheless, use of
Pressley and Stelometer has become limited due to two main reasons; both testing
procedures are very slow owing to the time consuming sample preparation process and
the results could be influenced by the technique of the operator (Taylor, 1982).
Development of HVI has made it possible to perform bundle tensile tests more rapidly.
HVI provides both bundle strength and elongation measurements though it is not
currently calibrated for elongation. HVI as well as the Stelometer follows the same
principle of constant rate of elongation. The gauge length used in HVI is also 3.2mm. In
order to be tested with HVI, cotton samples need to be in their raw or unprocessed form.
In HVI, mass of the testing fiber specimen is not directly determined. It is indirectly
estimated with optical density and micronaire which is a time saving approach compared
to weighing the specimen. In contrast, when using the Stelometer and Pressley
instruments mass of the tested fiber bundle is also measured.
Page 19
Texas Tech University, Ruvini Mathangadeera, December 2014
7
1.2 Relationship between Single Fiber and Fiber Bundle Tensile
Properties of Cotton
The relationships between tensile properties of single fibers and fiber bundles have been
widely studied which is clearly evident from the availability of numerous research
articles on that subject.
As stated by Orr et al. (1955) good correlations between single fiber and fiber bundle
measurements for tenacity and elongation might exist when the measurements are made
at the same gauge length. In fact, results obtained by the authors demonstrated that single
fiber tenacities were more than double the corresponding measured flat bundle tenacities.
Sasser et al. (1991) convey the idea that the average single fiber breaking strength sets an
upper limit for the fiber bundle breaking strength. The results also indicate the possibility
of obtaining improved correlations between fiber strength and yarn strength by using
average single fiber strength instead of HVI or Stelometer bundle strength. Cui et al.
(2003) report that in many cases results of single fiber tensile property tests are
considered to be more desirable than results of bundle tests.
Rebenfeld (1958) has experimented on the degree of transmission of single cotton fiber
properties to the properties of cotton fiber bundles, yarns and fabrics. As observed by
Rebenfeld, single fiber strength is not fully transferred to bundle strength and the degree
of strength transmission is not constant for all cottons. Furthermore, the degree of
transmission seems to be a function of fiber breaking tenacity where the weaker cottons
exhibit a higher transmission of fiber strength. In addition, degree of transmission of
Page 20
Texas Tech University, Ruvini Mathangadeera, December 2014
8
single fiber breaking elongation to fiber bundles appears to be inversely proportional to
the single fiber breaking elongation. Therefore, cottons with a low breaking elongation
would more efficiently transfer the property to fiber bundles than cottons with a high
breaking elongation.
Warrier and Munshi (1982) report that irrespective of the employed fiber testing
instrument, on an average nearly 50% of the strength of single fibers is realized when
fiber bundles are tested. As mentioned by Cui et al. (2003) these differences between the
results of single fiber and fiber bundle tensile tests might be due to variations in fiber
breaking elongation, breaking strength and fiber crimp. Very good correlations between
elongations of single fibers and fiber bundles have also been reported several times
(Hertel & Craven (1956); Warrier & Munshi (1982)).
Dhavan et al. (1984) state that in a practical sense there are various confounding factors
which affect the bundle strength tests. Namely the uncertainty in test specimen length and
the fibers within the testing bundle not being parallel which might be due to fiber crimp
might complicate the bundle measurements. Inter fiber interactions can disrupt stress
transmission from individual fiber to fiber bundles. In addition, the non-linear nature of
the individual fiber load-elongation curves might also cause confusion.
Over the years researchers have come up with a considerable number of mathematical
models which relate single fiber and fiber bundle tensile properties of cotton. These
models constitute of methods used for predicting bundle tensile properties from single
fiber tensile properties as well as the reverse approach of predicting single fiber
Page 21
Texas Tech University, Ruvini Mathangadeera, December 2014
9
properties when bundle properties are available. Nachane and Iyer (1980) developed a
model to predict bundle tenacity with the use of mean single fiber strength and breaking
elongation distribution.
Dhavan et al. (1984) have introduced a mathematical model to predict single cotton fiber
tensile properties from bundle load-elongation curves assuming that the fiber bundles are
parallel. Nevertheless, cotton fibers are crimped and the crimps can be reduced by
combing and brushing performed during specimen preparation of fiber bundle. Yet, it is
not possible to completely get rid of these crimps without causing excessive fiber damage
(Cui et al., 2003). Since the presence of fiber crimps in a bundle could significantly
influence results of bundle tests, the model proposed by Dhavan et al. (1984) cannot be
used for accurate estimation of bundles which are not parallel.
A bundle which consists of fibers with unequal lengths between the jaws of a tensile
tester is referred to as a slack bundle by Cui et al. (2003). They have tried to develop a
method to estimate single cotton fiber tensile properties from load-elongation curves of
HVI bundles which are referred to as slack bundles. However, the estimates were less
reliable and their use has not been recommended for applications which require accurate
single fiber tensile properties.
Page 22
Texas Tech University, Ruvini Mathangadeera, December 2014
10
1.3 Impact of Fiber Processing on Cotton Fiber Tensile Properties
Cotton fibers need to go through a series of mechanical processes from being harvested in
field to reaching the textile mill, following which they undergo a number of different
textile processing steps. The textile processing steps such as carding, spinning, weaving
and mercerizing are expected to affect the cotton fibers. Whether they are mechanical or
chemical, during these processes stresses are applied on the fibers correspondingly
altering their properties. While many of those changes that occur in fiber properties
enhance fiber performance, some of them could adversely influence fiber quality
(Rebenfeld, 1957).
Effects caused by chemical processing like mercerizing and resin-finishing on fiber
properties are most likely favorable, whereas mechanical processing, in general, causes
fiber property alterations which are not usually beneficial (Rebenfeld, 1957). Mechanical
processing, especially cleaning cotton and maintaining good fiber quality is known to be
a compromise at the gin and textile mill. There is evidence of the nature of gin treatment
affecting fiber length and strength. Short fiber content and neps are increased with
additional lint cleaners used at the gin which in turn would be detrimental to yarn quality
(Bel et al., 1991). The extent of fiber damage caused in the ginning process is also variety
dependent. Fiber damage occurred at the gin would be greater as the longer and finer a
cotton is (Sui et al., 2010).
The process of fiber to yarn conversion consists of two basic stages, namely spinning
preparation and yarn formation. Spinning preparation consists of opening and cleaning,
carding, drawing and combing. An additional step, roving, is required if ring spinning is
Page 23
Texas Tech University, Ruvini Mathangadeera, December 2014
11
to be performed. During opening, the compressed fiber bales are separated into smaller
masses. It also results in removal of trash, dust, foreign material and other impurities.
Usually during carding and spinning fibers are extended and the fiber crimp is removed
to some extent. Basically carding is known to individualize, parallelize and blend the
fibers. It might also remove short fibers and cause some fiber breakage. Drawing
straightens the fibers and provides additional fiber blending. During combing short fibers,
fiber neps, seed coat fragments and trash are removed. Spinning might also cause fiber
breakage of some of the weaker fibers.
Rebenfeld (1957) has conducted a study aimed at determining how cotton fiber properties
are altered during different mechanical and chemical processing operations. Opening,
picking, carding, drawing, roving, spinning, weaving, singeing, desizing, scouring,
bleaching, mercerizing and resin treatment were the processes which were monitored. As
stated by the author, magnitude of fiber property alterations due to processing is not
constant for all cottons and mostly the changes in fiber properties are functions of the
original fiber properties. The results indicate that the change in fiber breaking stress due
to processing is a function of the original breaking stress. In the study conducted using six
cottons, weaker cottons have increased in breaking stress whereas stronger cottons have
decreased in breaking stress after being subjected to processing. Similarly, the decrease in
breaking elongation due to processing is also a function of the original fiber breaking
elongation. Cottons with a high breaking elongation exhibited a greater decrease in
elongation than cottons with a low breaking elongation. These facts were observed for all
processing steps up to and including mercerization. The resin treatment, unlike the other
Page 24
Texas Tech University, Ruvini Mathangadeera, December 2014
12
stages, has caused a decrease in both breaking stress and breaking elongation. In addition,
the magnitude of fiber property changes resulted by this treatment was nearly constant for
the six cottons suggesting that it is not a function of the fiber property prior to the
treatment. However, it is important to note that these findings were based on mechanical
properties determined on minute samples which seem to be inadequate, i.e. only 50 fibers
from each cotton representing each stage.
In the same study (Rebenfeld, 1957), property changes due to processing exhibited
similar trends between fiber and fabric breaking strength as well as fiber and fabric
breaking elongation. Thus, the author concludes that the fiber property changes caused by
a particular treatment are reflected as changes in the fabric characteristics. This indicates
the impact of cotton fiber properties on the fabric performance. Grant et al. (1952) has
also mentioned that any damage that befalls cotton fibers during mechanical processing
will be transferred to the textile products and might affect their overall quality.
Since the changes in fiber properties which occur due to processing are not constant
across different cottons, it is less reliable to predict fabric characteristics from properties
of the unprocessed fiber. Thus, processed fibers should more closely represent the
characteristics of fibers in the fabric than unprocessed fibers (Grant et al., 1952).
Grant et al. (1952) have conducted a study assessing the effects of mechanical processing
on physical properties of cotton fibers. Ginned cotton was considered as unprocessed
cotton while fibers obtained from untwisted yarns were used for the measurements of
processed cotton. Bundle tenacity and single fiber breaking load and tenacity were not
Page 25
Texas Tech University, Ruvini Mathangadeera, December 2014
13
significantly different between the unprocessed and processed fiber samples, whereas
single fiber breaking elongation was significantly lower in the processed cottons.
Farag and Elmogahzy (2009) have commented on the effect of mechanical ginning on
cotton fibers. From the widely used two types of mechanical ginning, saw ginning which
is used for medium and short staple cottons apply more stress on fibers than roller
ginning which is used for long and extra-long staple cottons.
Salhotra and Chattopadhyay (1984) indicate a significant loss in cotton fiber bundle
tenacity and elongation due to the opening process. Opening is a spinning preparation
process. The opening roller system which is used for fiber separation in rotor spinning
causes substantial amount of fiber breakage. The authors have attributed the reduction in
fiber tenacity upon opening to the action caused by teeth or pins on the fibers which
causes surface damage by forming minuscule cuts. Consequently, weak spots are created
along the length of the fiber resulting in loss of fiber tenacity.
Rebenfeld (1958) has brought up a different idea that textile processing operations have a
tendency to reduce differences among cottons. Even though the differences among
cottons are not entirely eliminated, the main differences present in the single fiber state
tend to be balanced out by textile processing.
1.4 Cotton Fiber Elongation and its Importance
Cotton fiber elongation is an important tensile property which plays a significant role in
textile manufacturing. Yet, it has been largely neglected while strength, length and
micronaire were considered to be the only properties which determine the spinning
Page 26
Texas Tech University, Ruvini Mathangadeera, December 2014
14
performance and yarn quality. It is strange that cotton fiber elongation has never really
turned up as one of the properties that should be considered when purchasing cotton raw
stock or putting together mix laydowns (Backe, 1996).
Elongation becomes a key property in cotton preparation procedures like ginning. During
ginning, excessive lint cleaning can result in fiber breakage and increased short fiber
content if the fibers lack sufficient tenacity and elongation to withstand the stresses
(Benzina et al., 2007).
Elongation plays an important role in almost all of the textile manufacturing procedures.
Cotton fibers with high elongation will perform better in spinning. The spinning
efficiency of cotton is usually decided by end breakage rate during the process which can
significantly impact the production cost and product quality. As cotton fibers are
subjected to a variety of external stresses in the spinning mill during the processes such
as opening, cleaning, carding and drafting, having more flexibility or being less stiff is
important to endure these stresses (Mogahzy & Chewning, 2001).
As mentioned by Benzina et al. (2007), the fibers which do not possess adequate
elongation as well as tenacity fail to withstand these stresses and result in fiber breakage.
Therefore, the short fiber content generated by opening, carding and other mechanical
processes is negatively correlated with fiber tenacity and elongation. Fiori et al. (1956)
have stated that fibers with higher elongation and lower modulus would be expected to
spin more efficiently as it might tend to deform more easily during spinning and
subsequent processes. It is essential to note that the significance of elongation is
Page 27
Texas Tech University, Ruvini Mathangadeera, December 2014
15
gradually becoming prominent with the increasing spinning speeds and dynamic forces
connected to recent advancements in processing.
Waters et al. (1966) have investigated on the effect of fiber elongation on end breakage of
yarns spun at varying twists, spindle speeds and spinning drafts. Eighteen cotton bales of
medium staple lengths which were used in the experiment varied widely in bundle
elongation while all other fiber properties were nearly equal. Each group of low, medium
and high bundle elongation cottons was represented by six bales. The results indicated
that the high elongation cotton demonstrated better spinning performance than the low
elongation cotton irrespective of spindle speed, twist, draft, or yarn number. James S.
Parker (1963) has also reported that high elongation cotton has produced a better yarn
with fewer ends down than low elongation cotton.
Yarn with good elongation will perform better in weaving than a yarn with poor
elongation. Since yarn is subjected to abrupt forces during weaving preparation steps
such as winding and warping, and the weaving process itself, good elongations are
necessary in order to have better weaving efficiency. Toughness, or the ability of a fiber,
yarn, or fabric to withstand large deformations, is the product of the breaking strength
times the elongation value at break. Therefore, a yarn that has a low breaking strength
and a high elongation value might probably be tougher than a yarn with a high breaking
strength and a low elongation value. Thus the lower strength yarn could possibly weave
better than the higher strength yarn, as it is tougher and can stand the rigors of weaving
better (Backe, 1996).
Page 28
Texas Tech University, Ruvini Mathangadeera, December 2014
16
Sizing process, which is also a weaving preparation step, causes reduction in yarn
elongation due to the application of size material on yarn. This gives rise to stiffness in
the yarn rendering it undesirable for weaving. Thus, in order to compensate for this loss
of elasticity it is better to use cotton fibers with high elongation in weaving. In knitting
yarn elongation is not as important as that is in weaving. Yet, it is a vital characteristic
which is important in providing the required flexibility and easy bending of yarn around
the different knitting components (Farag & Elmogahzy, 2009).
To determine the effect of cotton fiber elongation on yarn quality and weaving
performance, Backe (1996) has conducted a study using three cotton mixes representing
three different levels of fiber elongation, namely high, medium and low elongation. HVI,
AFIS, Stelometer and Uster Evenness Tester 3 data of the card and drawing slivers
showed that except for elongation all other fiber properties were relatively constant
between the three elongation levels. The results indicated that cotton fiber elongation
significantly contributed to yarn qualities of the open-end spun yarn, such as evenness
and defect levels, strength and elongation, work to rupture, hairiness and weaving
performance. For instance, the higher the elongation of the raw cotton, the higher the
skein strength and the single-end strength were. Unsurprisingly, higher fiber elongation
also resulted in higher yarn elongation. Especially there was deterioration in yarn
evenness and an increase in imperfection count as fiber elongation became less. In
addition, higher fiber elongation also yielded fewer hairs per meter in yarn.
In a study aimed to determine the effect of fiber bundle elongation on processing
performance and yarn properties, Waters et al. (1966) have also concluded that the
Page 29
Texas Tech University, Ruvini Mathangadeera, December 2014
17
single-strand yarn strength, skein strength and yarn elongation were linearly related to
fiber bundle elongation. Accordingly, increased fiber bundle elongation has resulted in
increased yarn strength and elongation in this experiment. Results obtained by Louis et
al. (1961a) also indicate that the tenacity and elongation of single yarns are directly
related to the fiber elongation of the cottons from which the yarns are spun.
Fiber elongation is also a significant decisive factor of the fiber bundle strength value.
The maximum fiber bundle strength of a given set of fibers can be obtained when all the
fibers in the bundle break at the same elongation. Consequently, the bundle strength
increases with decreasing standard deviation of single fiber elongation (Fryer et al.,
1996). A study done by Coleman (1958) has concluded that the tensile strength of a fiber
bundle is always less than the average tensile strength of its individual components.
Nachane and Iyer (1980) also state a concept similar to Fryer et al. (1996) by mentioning
that poor bundle strength can arise from the unequal extensibility of individual fibers in
the bundle.
Standard deviation of single fiber elongation is likely to be higher for a fiber bundle
formed from a cotton blend than for a fiber bundle formed form one of the constituent
cottons. And the high standard deviation can result in lower bundle strength of the blend
despite the mean single fiber elongation values of the bundles being equal for the blends
and the constituent cottons. In contrast to elongation, merely an increase in single fiber
strength variability in a blend cannot impact bundle strength. If all other factors remain
constant, bundle strength should not be affected by blending cottons having different
Page 30
Texas Tech University, Ruvini Mathangadeera, December 2014
18
strengths unless the mean single fiber strength is changed due to blending (Fryer et al.,
1996).
Fiori et al. (1956) have demonstrated that small differences in yarn breaking elongation
correlate with relatively large changes in yarn strength. Since the direct relationship
between yarn elongation and fiber elongation is obvious, this suggests the importance of
fiber elongation as a secondary contributor to yarn strength.
Koo and Suh (1999) have investigated on maximizing the yarn and fabric strength with
the use of variance of HVI elongation. They have highlighted the necessity of controlling
the variance of breaking elongation of constituent fibers of a yarn in order to maximize
the yarn and fabric strengths. Correspondingly, when two cottons differing in fiber
elongation are blended, yarn strengths of the blends appear to be lower than that of the
original samples (Louis et al., 1961a). Blending cotton fibers with different properties is a
requirement in textile industry. As cotton fibers differ considerably in breaking
elongation these observations are noteworthy to obtain good blends without any
deterioration in fiber quality.
Louis et al. (1961b) have concluded that, in general, cotton fiber with high elongation
produces fabric which is superior to fabric made with low elongation cotton fiber, in
qualities such as elongation, breaking and tearing strengths, and flex resistance.
Since cotton is a natural product with very high variability, its tensile properties differ
considerably from sample to sample and fiber to fiber. Thus, it would be wiser to look at
the distributions of the cotton fiber tensile properties rather than their average values.
Page 31
Texas Tech University, Ruvini Mathangadeera, December 2014
19
Compared to the distributions of other single fiber tensile properties, fewer studies have
been conducted on the distribution of single fiber breaking elongation (Hu & Hsieh,
1997). Frydrych (1995), and Nachane and Iyer (1980) have emphasized the skewed
nature of the distributions of cotton fiber breaking elongation. Hu & Hsieh (1997) have
further investigated the breaking elongation distributions of cotton fibers, and have
concluded that the distributions are positively skewed. This denotes the presence of a
larger amount of cotton fibers with lower elongations than the mean value and a small
amount of cotton fibers with higher elongations than the mean value. The fibers which
possess the lowest elongation are the ones that are broken first during stretching. And the
broken fibers no longer contribute to the bundle strength. Hence, it critically impacts the
strength of the fiber bundle (Hu & Hsieh, 1997). With a detailed statistical analysis the
authors have determined that ‘Gamma’ function is the appropriate curve fitting function
for the positively skewed elongation distributions.
In contrast to the positive contribution of fiber bundle elongation value to yarn strength
mentioned by Backe (1996), May and Taylor (1998) have reported that selecting for high
fiber bundle elongation among other fiber properties, has provided the least improvement
in yarn tenacity. The study (May & Taylor, 1998) reveals a low genetic correlation
between bundle elongation and yarn tenacity along with a negative correlation (r = -0.35)
between fiber bundle tenacity and bundle elongation determined by the Stelometer.
Scholl and Miller (1976) have also observed a negative genotypic correlation (r = -0.16)
between Stelometer fiber bundle strength and fiber bundle elongation.
Page 32
Texas Tech University, Ruvini Mathangadeera, December 2014
20
In a study evaluating genetic association of fiber characteristics with yarn tenacity of
open-end and ring spun yarns, Meredith et al. (1991) reported moderate negative
correlations (r = -0.33 to -0.54) between fiber bundle elongation determined by
Stelometer and yarn tenacity of both open-end and ring spun yarns. These relationships
observed in the study were considered to be mainly due to genetic factors since non-
genetic influences were small. A low negative correlation (r = -0.2) between Stelometer
fiber bundle elongation and yarn strength has also been reported by Green and Culp
(1990).
The correlation between bundle tenacity and elongation could be described by attributing
it to their associations with fiber crystallinity. Several studies have attempted to link
crystallinity with the tensile properties of cotton fibers. Hindeleh (1980) has conducted a
study on the relationships between crystallinity and the physical properties of mature
cotton fiber. Eight varieties of native Egyptian cotton, which had been selected based on
variations in their staple lengths, fineness, tenacity and elongation-at-break, were
employed in the study. The results indicate higher bundle tenacity and lower bundle
elongation values for the long-staple cottons, and lower bundle tenacity and higher
bundle elongation values for the short staple cottons. The cotton types which possess
higher degree of crystallinity depicted higher bundle breaking tenacity and lower bundle
breaking elongation, and vice versa. Figure 1.2 illustrates the contrasting relationships
between crystallinity and the two tensile properties of the native Egyptian cotton types
used in the study.
Page 33
Texas Tech University, Ruvini Mathangadeera, December 2014
21
Figure 1.2 Relationships between crystallinity and tensile properties of native Egyptian
cotton (Hindeleh, 1980)
From the above results obtained on a limited set of samples, it appears that the two
properties tenacity and elongation of cotton fibers are inversely proportional to each
other. Yet, it is important to note that in the above study the particular relationship was
observed on fiber bundles and not on single fibers.
In a recent study (Liu et al., 2014) done using 70 lint cottons consisting of Pima fibers
grown in the United States and Upland fibers grown both in and outside of the United
States, the relationship of fiber crystallinity to fiber tenacity and elongation was assessed.
Bundle tenacity of the Pima varieties exhibited an increasing trend with crystallinity
whereas the bundle tenacities of Upland fibers were nearly independent of crystallinity.
There was a decrease in bundle elongation with increasing crystallinity for Upland fibers.
A particular trend could not be detected between crystallinity and bundle elongation of
Page 34
Texas Tech University, Ruvini Mathangadeera, December 2014
22
the Pima fibers, which the authors have attributed to the limited number of Pima samples
used in the study. For the Upland fibers Stelometer tenacity and elongation revealed an
insignificant correlation whereas a positive relationship between the two properties was
observed for the Pima varieties. Yet, the authors further state that the precise correlations
between fiber tenacity, elongation and crystallinity are inconclusive based on the limited
fiber samples employed in the study. A possible explanation given for this scenario is that
besides crystallinity, fiber tenacity and elongation could also be affected by crystallite
size, fibril orientation and residual stress (Hsieh et al., 1997).
Nevertheless, it is difficult to compare the relationships observed between strength and
crystallinity in different studies as the extent of crystallinity of mature cottons could
range from 50% to nearly 100% depending upon the measurement techniques (Hsieh,
1999).
Contrary to the widely accepted negative relationship between bundle elongation and
tenacity, Waters et al. (1966) have reported the absence of any relationship between fiber
bundle elongation and strength measured by the Stelometer. However, since the findings
were based on the medium staple cottons used in the study, it may not be applicable to
either shorter or longer cottons.
In a recent genetic study (Ng et al., 2014) with an emphasis on fiber elongation in Upland
cotton, relationships between fiber bundle strength and elongation determined by both
Stelometer and HVI were taken into account. A significant negative correlation (r= -0.20)
was observed between bundle strength and bundle elongation measured by the Stelometer
Page 35
Texas Tech University, Ruvini Mathangadeera, December 2014
23
while HVI bundle strength was not correlated with HVI bundle elongation. Stelometer
elongation also showed no correlation with HVI bundle strength.
Another research study (Benzina et al., 2007) has emphasized that the fiber bundle
elongation plays an important role in the work of rupture of fiber bundles. Work of
rupture correlates with the product of tenacity and elongation, and is a very important
factor which determines the processing performance of cotton fibers. The authors have
also demonstrated the negative correlation between fiber bundle elongation and fiber
bundle tenacity. According to the authors, the existence of a weak negative correlation
between fiber tenacity and fiber elongation among samples does not imply that the
simultaneous improvement of the two properties is impossible. In fact, increasing the
tenacity when the elongation is decreased could result in a reduced work of rupture while
the mere improvement of elongation with tenacity remaining the same could create a
higher work of rupture. Ng et al. (2014) have also conveyed that some of the genotypes
used in their study have suggested that breeding for simultaneous improvement of fiber
elongation and strength is possible.
Irrespective of the lack of interest in cotton fiber elongation in breeding programs, it is a
property which possesses high heritability. Heritability is the ratio between genetic and
phenotypic variations. High heritability value for a particular trait suggests the possibility
of improvement of that trait in breeding programs. May & Taylor (1998) have reported
on the high heritability of elongation.
Page 36
Texas Tech University, Ruvini Mathangadeera, December 2014
24
CHAPTER II
EVALUATING THE RELATIONSHIPS BETWEEN TENSILE PROPERTIES OF
SINGLE FIBERS AND FIBER BUNDLES OF COTTON
2.1 Introduction
Tensile properties of cotton fibers are of utmost importance in the textile industry as they
are known to greatly affect the processing performance and the quality of the textile
product. Therefore, tensile property measurements are of equal importance to both the
cotton industry and the breeding programs. Tensile tests of cotton fibers can be
performed on single fibers or fiber bundles. It is necessary to gain a better understanding
of the relationships between these two types of tensile testing.
Several studies have examined the relationships between individual fiber and fiber bundle
tensile properties of cotton. Orr et al. (1955) have conducted such a study employing
seven commercial cotton samples belonging to different varieties. The samples possessed
diverse physical properties. They have reported that, bundle strength and elongation
measured with the Stelometer, correlated well with individual fiber strength and
elongation respectively. Rebenfeld (1958) has observed good correlations of single fiber
breaking tenacity and elongation with the corresponding values measured on Pressley
bundles at 5mm gauge length. The study has been conducted using six cotton samples
which represented a wide range in physical properties.
Despite the good correlations between the tensile properties of individual fibers and fiber
bundles, the two types of testing methods are also known to provide noticeably different
results. Especially, fiber bundle strength and individual fiber strength measurements
Page 37
Texas Tech University, Ruvini Mathangadeera, December 2014
25
differ substantially from each other. It has been reported that the individual fiber strength
is not completely transmitted to fiber bundle strength and the extent of strength
transmission varies with the cotton (Rebenfeld, 1958). Coleman (1958) has brought up
the idea that bundle tensile strength of a cotton is always less than the average tensile
strength of its individual constituents. Over the years researchers have come up with few
explanations for the differences between the tensile property measurements obtained on
single fibers and fiber bundles.
Variations in fiber breaking elongation, breaking strength and fiber crimp might cause the
differences between the results of single fiber and fiber bundle tensile tests (Cui et al.,
2003). According to Fryer et al. (1996), in order to obtain the maximum bundle strength
from a particular set of fibers, all the fibers in the fiber bundle need to break at the same
elongation. Increased bundle strengths can be acquired by decreasing the standard
deviation of single fiber elongation. As stated by Nachane and Iyer (1980), poor bundle
strength can originate from the unequal extensibility of individual fibers in the bundle.
Not only the tensile property measurements themselves, but also the relationships
between the tensile properties of individual cotton fibers seem to differ from the
relationships between fiber bundle tensile properties. Several studies have reported on the
negative correlation between fiber bundle tenacity and bundle elongation of cotton
(Scholl & Miller (1976); May & Taylor (1998); Ng et al. (2014)). In contrast, positive
correlations between strength and elongation have been observed for individual fibers.
Page 38
Texas Tech University, Ruvini Mathangadeera, December 2014
26
Most studies on cotton fiber strength were reported based on fiber bundle measurements.
Therefore, the relationships between single fiber tensile properties have not been well
documented. Thus, our study focuses on examining the relationships between the tensile
properties of both the individual fibers and the fiber bundles. Tensile property
measurements obtained from Stelometer, High Volume Instrument (HVI) and FAVIMAT
will be taken into account.
Figure 2.1 Stelometer
The Stelometer instrument (Figure 2.1), which measures fiber bundle force and
elongation properties, is a conventional reference method for measurement of fiber
strength. The instrument operates according to the principle of constant rate of
Page 39
Texas Tech University, Ruvini Mathangadeera, December 2014
27
elongation. Prior to obtaining measurements each time, the instrument needs to be
calibrated first using a metal plate, and then using the standard calibration cottons. After
acquiring data, the data needs to be adjusted based on the standards. In addition to that, a
well-trained operator is also required to perform fiber testing with the Stelometer. The
Stelometer consists of the following main components (Figure 2.2).
Figure 2.2 Components of the Stelometer
1) Fiber clamp
2) Clamp carrier
3) Force scale
Page 40
Texas Tech University, Ruvini Mathangadeera, December 2014
28
4) Force indicator
5) Elongation scale
6) Elongation indicator
7) Pendulum
8) Trigger
9) Fiber clamp apparatus
The Stelometer operation procedure could be described as follows. A well combed fiber
sample, attached to a small clamp, is placed in a fiber clamp with the help of a fiber
clamp apparatus. The fiber clamp is then inserted at the top of the pendulum. When the
trigger at the bottom right hand side is released, a load is applied on the fiber bundle and
the pendulum starts moving. As it moves stretching the fibers, the fiber clamp comes
apart. The pendulum will continue moving to the right hand side until the occurrence of
fiber breakage. When the pendulum stops, the values indicated by the force and
elongation scales are recorded. Afterwards, fiber clamp is taken out from the instrument
and the excess fibers are removed with a knife from both ends of the clamp. The broken
fiber sample is then weighed using a precision balance. The breaking force and weight
are used in the following equation to determine the tenacity (ASTM D1445).
T = f / m × 15.00*
f = breaking force in Kgf (Kp)
m = mass of the tested fiber bundle in milligrams
T = tenacity in gf/tex
*15.00 stands for the length of the specimen in millimeters
Page 41
Texas Tech University, Ruvini Mathangadeera, December 2014
29
HVI (Figure 2.3) provides fiber property measurements such as micronaire, upper half
mean length, length uniformity, strength, elongation, reflectance and yellowness, using
fiber bundles. Bundle tensile tests in HVI are performed on the same specimen that is
used for the length measurement. The specimen is subjected to the tensile test at 3.2 mm
gauge length according to the principle of constant rate of elongation.
HVI allows performing more rapid bundle tensile tests than the Stelometer. The
requirement for measuring the mass of the tested specimen associated with the Stelometer
has been eliminated in HVI. The operator effect related to the Stelometer has also been
greatly reduced in HVI. Yet, owing to the lack of calibration standards it is not capable of
providing consistently accurate data for elongation, whereas, the Stelometer can be
calibrated for elongation.
Figure 2.3 High Volume Instrument (HVI)
Page 42
Texas Tech University, Ruvini Mathangadeera, December 2014
30
FAVIMAT (Figure 2.4) provides three main individual fiber tensile property
measurements; elongation-at-break, force-to-break and work-to-break. In addition, other
physical parameters such as tenacity, linear density and crimp could also be measured.
The minimum gauge length to obtain a linear density measurement with FAVIMAT is
the 10 mm gauge length. FAVIMAT has been originally designed for man-made fibers
which possess very little within sample variability. As cotton fibers have a higher within
sample variability, a large number of fibers need to be tested with the FAVIMAT.
Figure 2.4 FAVIMAT
Page 43
Texas Tech University, Ruvini Mathangadeera, December 2014
31
2.2 Objectives
To compare the relationships between single fiber and bundle tensile properties of
cotton
To study the relationships between tensile property measurements obtained from
different instruments
2.3 Materials and Methods
From one hundred and four reference cotton samples (Hequet et al., 2006), thirty samples
were selected based on the available FAVIMAT and HVI data, ensuring the presence of a
wide range of strength and elongation values. The samples possessed average FAVIMAT
force-to-break values ranging from 4.24cN to 6.25cN; average FAVIMAT elongation
values ranging from 6.01% to 12.67%; average HVI strength values ranging from
24.33gf/tex to 41.3gf/tex; and average HVI elongation values ranging from 3.59% to
8.28% (Table 2.1).
Page 44
Texas Tech University, Ruvini Mathangadeera, December 2014
32
Table 2.1 Descriptive statistics of the FAVIMAT and HVI tensile measurements of the
30 samples selected for the experiment
Tensile Measurement Average Minimum Maximum Range
HVI strength
(gf/tex)
29.95 24.33 41.30 16.97
HVI elongation (%)
5.34 3.59 8.28 4.69
FAVIMAT force-to-
break (cN)
4.95 4.24 6.25 2.01
FAVIMAT elongation-
at-break (%)
8.79 6.01 12.67 6.66
Prior to fiber testing, all the samples were conditioned at the environmental conditions of
70±1◦F and 65±2% relative humidity for at least 48 hours. Spinlab Stelometer 654 was
used in the experiment to obtain bundle tensile property measurements. The three cotton
standards C-39, M-1 and L-2 were used to calibrate the Stelometer. The average tensile
properties of the standards are given in Table 2.2. Selected samples were tested with the
Stelometer at 3.17 mm gauge length to obtain measurements of breaking force and
elongation of fiber bundles. Six replications were performed per sample. A precision
balance (±0.0001 g) was used to weigh the tested specimens. Tenacity of each sample
was calculated as the ratio of breaking load to mass of the tested fiber bundle multiplied
by the sample length (ASTM D1445). Then, the data obtained were corrected using the
three calibration cottons.
Page 45
Texas Tech University, Ruvini Mathangadeera, December 2014
33
Table 2.2 Average tensile property measurements of the three calibration cottons used in
the Stelometer
Calibration Cotton Tenacity (gf/tex) Elongation (%)
C-39 25.1 7.1
M-1 30.8 6.4
L-2 18.0 5.6
The available FAVIMAT data of the 30 samples has been obtained at 10mm gauge length
with a test speed of 20mm/min and a pre-tension of 0.2cN/tex. Three replications of 150
individual fibers have been tested per sample. The HVI data consisted of 10 length and
strength readings, 4 micronaire readings, and 4 color and trash readings per sample. The
relationships between tenacity and elongation measurements obtained from each
instrument were analyzed and the results were compared between the three instruments.
2.4 Results and Discussion
Obtaining accurate and precise measurements for cotton fiber tensile properties is
essential for the cotton industry. Thus, it is important to evaluate the two main types of
tensile tests, namely individual fiber and fiber bundle tensile tests. For that reason, a
comprehensive evaluation of the measurements obtained from the two types of methods
is required. In the present study, results obtained from two different bundle tensile tests
(Stelometer and HVI) and one individual fiber tensile test (FAVIMAT), are taken into
account.
Page 46
Texas Tech University, Ruvini Mathangadeera, December 2014
34
Descriptive statistics of the Stelometer tensile measurements of the tested samples are
presented in Table 2.3. Both Stelometer tenacity and elongation measurements are spread
over a wide range. FAVIMAT elongation-at-break measurements (Table 2.1) of the
samples, were also spread in a range (6.66%) similar to the Stelometer elongation. Since
we are also interested in assessing the correlations between the tensile properties,
presence of a wide range in the parameters will be important to obtain good correlations
between them.
Table 2.3 Descriptive statistics of the Stelometer tensile measurements of the 30 samples
Tensile Measurement Average Minimum Maximum Range
Stelometer tenacity
(gf/tex)
14.26
12.69 18.89 6.20
Stelometer elongation
(%)
10.57 7.54 14.47 6.93
The relationships between strength and elongation measurements are assessed separately
for each instrument.
Page 47
Texas Tech University, Ruvini Mathangadeera, December 2014
35
Figure 2.5 Relationship between tenacity and elongation determined by Stelometer
As demonstrated in Figure 2.5 Stelometer tenacity and elongation measurements display
a very small negative correlation which is not significant. This indicates that bundles with
higher tenacities tend to have lower elongations and those with lower tenacities tend to
have higher elongations. The negative correlation between Stelometer tenacity and
elongation has been previously reported (May & Taylor (1998); Scholl & Miller (1976)).
11.0
12.0
13.0
14.0
15.0
16.0
17.0
18.0
19.0
20.0
6.0 8.0 10.0 12.0 14.0 16.0
Stelometer
Tenacity
(gf/tex)
Stelometer Elongation (%)
Stelometer Tenacity vs. Stelometer Elongation
R² = 0.0748
Page 48
Texas Tech University, Ruvini Mathangadeera, December 2014
36
Figure 2.6 Relationship between strength and elongation determined by HVI
Similar to the relationship observed with the Stelometer, HVI strength and elongation are
also negatively correlated (Figure 2.6). This implies that weaker bundles possess higher
elongation whereas stronger bundles possess lower elongation. Nevertheless, the small
negative correlation between HVI strength and elongation is also non-significant which
might be due to the limited number of samples employed in the study.
In general, the negative correlation between tenacity and elongation of cotton fiber
bundles is a widely accepted concept. Fiber strength is evidently considered as a vital
tensile property at all stages of fiber processing. Weaker fibers have a higher propensity
to break. Thus, it could give rise to increased short fiber contents which in turn might
lead to more yarn defects. Fiber strength is also a main criterion in cotton bale selection
and laydown formation. Thus, improving fiber strength is a major concern of the cotton
15.0
20.0
25.0
30.0
35.0
40.0
45.0
2.0 4.0 6.0 8.0 10.0
HVI Strength
(gf/tex)
HVI Elongation (%)
HVI Strength vs. HVI Elongation
R² = 0.1263
Page 49
Texas Tech University, Ruvini Mathangadeera, December 2014
37
breeding programs. Because of the negative relationship between tenacity and elongation,
elongation is usually disregarded as it is envisioned that improving fiber elongation
would result in decreased fiber strength. Therefore, cotton breeders hesitate to work on
improving cotton fiber elongation. Yet, elongation is also a crucial tensile property which
plays a significant role in fiber processing and impacts the quality of the textile product.
Figure 2.7 Relationship between force-to-break and elongation-at-break determined by
FAVIMAT
Significant correlations at α =0.05 significance level are denoted by **.
A significant positive correlation exists between the individual fiber force-to-break and
elongation-at-break measured by FAVIMAT (Figure 2.7). According to that stronger
fibers tend to possess higher elongation whereas weaker fibers tend to possess lower
4.0
4.5
5.0
5.5
6.0
6.5
4.0 6.0 8.0 10.0 12.0 14.0
FAVIMAT
Force-to-
Break (cN)
FAVIMAT Elongation-at-break (%)
FAVIMAT Force-to-break vs. FAVIMAT Elongation-
at-break
R² = 0.1344**
Page 50
Texas Tech University, Ruvini Mathangadeera, December 2014
38
elongation. This implies the possibility of the fibers to simultaneously possess both
higher strengths and higher elongations. It also suggests that the improvement of fiber
elongation might not always result in inferior fiber strengths. Therefore, comparison of
the results obtained from the three instruments reveals that the relationship between
individual fiber strength and elongation is contradictory to the relationship which exists
between bundle strength and elongation.
The above results indicate that stronger fibers tend to possess higher elongation. In
general, the stronger fibers are more mature than the weaker fibers. Therefore, the
positive correlation between strength and elongation suggests that mature fibers tend to
have higher elongation. This is contrary to the present claim that mature fibers have
lower elongation.
It is a well-known fact that cotton is a highly variable product. As a whole, cotton plants
grown in the same field differ from each other. Within a plant, variability occurs among
different branches and among different positions of the same branch, within the cotton
boll, and even within the seed as each of them is exposed to different growth conditions.
Hence, cotton fibers are not homogeneous and their physical properties vary from fiber to
fiber. Therefore, cotton fibers possess higher within sample variability.
In a fiber bundle, there is a population of cotton fibers which differ from each other. Even
though the fibers belong to the same sample, like all other physical properties, the tensile
properties could also vary among the fibers. Therefore, fibers within a bundle could differ
in their elongations. Accordingly, the elongation distribution of the fibers in a particular
Page 51
Texas Tech University, Ruvini Mathangadeera, December 2014
39
bundle can be spread over a wide range. When a force is applied on the fiber bundle the
lower elongation fibers of the bundle break first. Then the entire load is applied on the
remaining fibers in the bundle. Even when the average elongation of a sample is high, in
the elongation distribution there are fibers which have less elongation. These fibers with
less elongation seem to dominate the distribution and influence the strength of fiber
bundles.
Since fiber elongation also has an impact on fiber bundle strength, the strength of a fiber
bundle cannot be equal to the average strength of the constituent fibers. Thus, it is
possible for the bundle strength of cotton to be lower than the corresponding individual
fiber strengths.
As previously mentioned, it has been reported that the fiber bundle strength increases
with the decreasing standard deviation of single fiber elongation (Fryer et al., 1996).
Hence, in order to understand the negative relationship between bundle strength and
elongation, it is necessary to find out the association between individual fiber elongation
and its standard deviation. For this purpose, FAVIMAT data of the thirty samples are
evaluated to assess the correlation between the above two parameters (Figure 2.8). It is
also important to note that elongation varies within a wide range in the selected samples.
Page 52
Texas Tech University, Ruvini Mathangadeera, December 2014
40
Figure 2.8 Relationship between FAVIMAT elongation and the standard deviation of
FAVIMAT elongation
Significant correlations at α =0.05 significance level are denoted by **.
Figure 2.8 represents a significant positive correlation between individual fiber
elongation and standard deviation of individual fiber elongation. Thus, the standard
deviation of individual fiber elongation increases with increasing individual fiber
elongation. Since fiber bundle strength is inversely proportional to standard deviation of
single fiber elongation, it can explain the negative correlation between bundle strength
and elongation. Therefore, the negative relationship between cotton fiber tenacity and
elongation implied by fiber bundles should be considered with more caution. It should
not be inferred that the simultaneous improvement of the two tensile properties is
impossible.
1.0
1.5
2.0
2.5
3.0
3.5
4.0
5.0 7.0 9.0 11.0 13.0 15.0
Within Sample
Standard
Deviation of
FAVIMAT
Elongation
FAVIMAT Elongation(%)
Standard Deviation of FAVIMAT Elongation vs.
FAVIMAT Elongation
R² = 0.577**
Page 53
Texas Tech University, Ruvini Mathangadeera, December 2014
41
Nevertheless, in addition to elongation, other factors can also impact the fiber bundle
strength. In a fiber bundle, the twists and interactions between the constituent fibers also
contribute to the bundle strength. When more fibers are included in a given diameter,
there is more contact between the fibers. Higher contact results in higher friction which
will lead to increased strengths. Due to the occurrence of friction in fiber bundles,
correlation between single fiber strength and bundle strength cannot be one.
In the second stage of the analysis, corresponding tensile properties obtained from the
three instruments are compared.
Figure 2.9 Relationship between Stelometer elongation and FAVIMAT elongation
Significant correlations at α =0.05 significance level are denoted by **.
4.0
6.0
8.0
10.0
12.0
14.0
16.0
4.0 6.0 8.0 10.0 12.0 14.0
Stelometer
Elongation (%)
FAVIMAT Elongation (%)
Stelometer Elongation vs. FAVIMAT Elongation
R² = 0.7164**
Page 54
Texas Tech University, Ruvini Mathangadeera, December 2014
42
Figure 2.10 Relationship between HVI elongation and FAVIMAT elongation
Significant correlations at α =0.05 significance level are denoted by **.
For the thirty samples used in the study, bundle elongation measurements obtained from
Stelometer and HVI show significant positive correlations with the individual fiber
elongation measured by FAVIMAT (Figures 2.9 and 2.10).
2.0
3.0
4.0
5.0
6.0
7.0
8.0
9.0
4.0 6.0 8.0 10.0 12.0 14.0
HVI
Elongation (%)
FAVIMAT Elongation (%)
HVI Elongation vs. FAVIMAT Elongation
R² = 0.668**
Page 55
Texas Tech University, Ruvini Mathangadeera, December 2014
43
Figure 2.11 Relationship between Stelometer elongation and HVI elongation
Significant correlations at α =0.05 significance level are denoted by **.
A significant positive correlation also exists between the Stelometer and HVI bundle
elongation measurements (Figure 2.11).
4.0
6.0
8.0
10.0
12.0
14.0
16.0
2.0 4.0 6.0 8.0 10.0
Stelometer
Elongation (%)
HVI Elongation (%)
Stelometer Elongation vs. HVI Elongation
R² = 0.8049**
Page 56
Texas Tech University, Ruvini Mathangadeera, December 2014
44
Figure 2.12 Relationship between Stelometer tenacity and FAVIMAT force-to-break
Significant correlations at α =0.05 significance level are denoted by **.
Bundle tenacity measured with the Stelometer positively correlates with the FAVIMAT
force-to-break (Figure 2.12). The correlation between the two measurements is also
significant. However, unlike Stelometer tenacity, FAVIMAT force-to-break measurement
is not normalized by weight. Force-to-break depends on the amount of the material
whereas tenacity gives a measurement which is independent of the amount.
8.0
10.0
12.0
14.0
16.0
18.0
20.0
4.0 4.5 5.0 5.5 6.0 6.5
Stelometer
Tenacity
(gf/tex)
FAVIMAT Force-to-break (cN)
Stelometer Tenacity vs. FAVIMAT Force-to-break
R² = 0.4658**
Page 57
Texas Tech University, Ruvini Mathangadeera, December 2014
45
Figure 2.13 Relationship between HVI strength and FAVIMAT force-to-break
Significant correlations at α =0.05 significance level are denoted by **.
HVI bundle strength shows a significant positive correlation with FAVIMAT force-to-
break (Figure 2.13).
20.0
25.0
30.0
35.0
40.0
45.0
4.0 4.5 5.0 5.5 6.0 6.5
HVI
Strength
(gf/tex)
FAVIMAT Force-to-break (cN)
HVI Strength vs. FAVIMAT Force-to-break
R² = 0.6434**
Page 58
Texas Tech University, Ruvini Mathangadeera, December 2014
46
Figure 2.14 Relationship between Stelometer tenacity and HVI strength
Significant correlations at α =0.05 significance level are denoted by **.
Bundle tenacity values obtained from the Stelometer, shows a significant positive
correlation with the HVI bundle strength values (Figure 2.14).
2.5 Conclusion
Thirty cotton samples representing a wide a range of strength and elongation were used to
examine the relationships between individual fiber and fiber bundle tensile properties.
Bundle tensile properties measured with the Stelometer and HVI, and single fiber tensile
properties measured with the FAVIMAT were taken into consideration. With both bundle
testing instruments negative correlations between bundle strength and elongation were
observed. This indicates higher elongation in weaker bundles and lower elongation in
10.0
12.0
14.0
16.0
18.0
20.0
20.0 25.0 30.0 35.0 40.0 45.0
Stelometer
Tenacity
(gf/tex)
HVI Strength (gf/tex)
Stelometer Tenacity vs. HVI Strength
R² = 0.6932**
Page 59
Texas Tech University, Ruvini Mathangadeera, December 2014
47
stronger bundles. The negative correlation between bundle tenacity and elongation has
been a main reason for the lack of interest in elongation in both the cotton industry and
the breeding programs. In contrast to bundle tensile properties, individual fiber strength
and elongation measured with the FAVIMAT were positively correlated. The positive
correlation indicates that stronger fibers tend to have higher elongation. Since stronger
fibers are generally more mature, it can be interpreted that mature fibers tend to have
higher elongation. The suggested positive relationship between elongation and maturity
contradicts with the current conception that mature fibers have less elongation.
The negative relationship observed with fiber bundles can be attributed to the variation in
single fiber elongation of the assembly of fibers in the bundle. Constituent fibers of a
fiber bundle can vary widely in their elongations. Upon exertion of a force on a fiber
bundle, it is the fibers with less elongation that break first. As the entire load is then
applied on the remaining fibers in the bundle, the lower elongation fibers appear to
dominate the elongation distribution. Thus, in order to achieve the maximum bundle
strength, all the fibers in the bundle need to break at the same elongation.
Fiber bundle strength tends to decrease with increasing standard deviation of individual
fiber elongation. FAVIMAT data of the thirty cotton samples suggests that the standard
deviation of individual fiber elongation positively correlates with the individual fiber
elongation. Since higher elongation results in higher standard deviation, it will adversely
impact the bundle strength. Therefore, a negative relationship could be detected between
cotton fiber bundle tenacity and elongation. Thus, to prevent misconceptions on fiber
Page 60
Texas Tech University, Ruvini Mathangadeera, December 2014
48
tenacity and elongation, it is essential to correctly understand the negative relationship
between bundle tenacity and elongation.
Bundle tensile property measurements obtained from the Stelometer exhibited good
correlations with those measurements obtained from the HVI. Furthermore, the bundle
strength and elongation measured with the Stelometer and HVI correlated well with the
corresponding values measured on single fibers.
Page 61
Texas Tech University, Ruvini Mathangadeera, December 2014
49
CHAPTER III
EVALUATING THE IMPACT OF FIBER PROCESSING ON TENSILE PROPERTIES
OF COTTON FIBERS
3.1 Introduction
Cotton fibers undergo a number of mechanical and chemical procedures during the textile
manufacturing processes. Mechanical processing steps such as ginning, carding, spinning
and weaving affect the cotton fibers. The stresses exerted on fibers during these processes
alter the fiber properties.
As stated by Cantu et al. (2007) most of the neps, trashes and unwanted material are
removed during textile processing. However, processing also adds neps and causes fiber
breakage. More efficient removal of small particles and the increasing processing speeds
are the major advancements in lint cleaning research. Both of these increase fiber damage
and fiber loss (Shofner & Williams, 1986). The required cleaning level depends on the
amount of foreign matter present in the cotton. Since picker and stripper harvesting result
in different amounts of trash in cotton, different machinery sequences are used for
cleaning cotton harvested using these two methods.
The present trend towards improved production speeds has made mechanical processing
more aggressive. The existing fiber testing methods allow the constant evaluation of fiber
properties which facilitates a certain level of fiber quality to be maintained. To determine
the effect of machinery on fiber quality, it is necessary to monitor fiber properties after
each processing step. Bale opening, cleaning, carding, drawing, combing, roving,
spinning, weaving and knitting are the main steps of the textile manufacturing process.
Page 62
Texas Tech University, Ruvini Mathangadeera, December 2014
50
Fiber length and length distribution, fiber fineness, and strength are considered as the
most important fiber quality parameters for textile processing. The ranked importance of
these fiber properties differs with the nature of yarn spinning method (Hsieh, 1999).
Length is considered as the most important fiber property in ring spinning whereas fiber
strength comes first in open end rotor spinning. Many studies have focused on relating
cotton fiber length distribution to mechanical processing. Krifa (2006) has highlighted a
relationship between modality of the length distribution and the mechanical damage the
fiber has undergone. He has concluded that cottons with a lower tendency to break
initially possess bimodal length distributions which gradually develop toward unimodal
length distributions after the fiber has been subjected to mechanical stresses. Hosseinali
(2012) has reported that, within-sample, short cotton fibers are on average weaker, less
mature and finer, and throughout mechanical processing the least mature longer cotton
fibers may be broken into shorter fibers.
Over the years, most research in the field of cotton has been oriented towards evaluating
the impact of fiber tensile properties on processing efficiency and end-product quality in
the textile industry. Yet, the impact of processing on tensile properties of cotton fibers
has not been studied well. Especially single fiber tensile properties have been rarely
studied since it is extensively time consuming. Most approaches were confined to
monitoring the changes in bundle tensile properties. Thus, our study mainly focuses on
the impact of mechanical processing on single fiber tensile properties.
In order to examine the impact of processing on cotton fiber properties Advanced Fiber
Information System (AFIS) was used as the fiber processing instrument at the initial
Page 63
Texas Tech University, Ruvini Mathangadeera, December 2014
51
phase of this experiment. AFIS (Figure 3.1) provides several different fiber property
measurements as well as distributions. The main measurements include mean length by
number and by weight, upper quartile length, short fiber content by number and by
weight, length CV(%) by number and by weight, maturity, fineness, neps and trash.
Length (by number and by weight), fineness, maturity, neps and trash size are the
distributions that can be obtained from AFIS.
Figure 3.1 Advanced Fiber Information System (AFIS)
For the AFIS measurements, fibers need to be individualized first. During fiber
individualization, AFIS exerts an opening action on the fibers. Therefore, with AFIS,
fiber breakage can occur during the testing procedure itself (Krifa, 2006).
Page 64
Texas Tech University, Ruvini Mathangadeera, December 2014
52
Figure 3.2 AFIS fiber individualizer
For the second phase of the experiment, in addition to AFIS, Microdust and Trash
Monitor (MTM) was also employed as a fiber processing instrument. MTM (Figure 3.3)
is an instrument which is capable of measuring foreign matter in bale or processed fiber.
MTM aero-mechanically separates trash from the lint and provides accurate, standard
measurements for microdust, dust and trash (Shofner et al., 1983).
MTM is more aggressive than AFIS which is the other processing equipment used in this
experiment. This facilitates a comparison of the impacts caused by light processing
(AFIS) and aggressive processing (MTM). This will also be helpful to identify the tensile
properties which play a significant role in fiber breakage.
Page 65
Texas Tech University, Ruvini Mathangadeera, December 2014
53
Figure 3.3 Microdust and Trash Monitor (MTM)
3.2 Objectives
To investigate the impact of fiber processing on cotton fiber tensile properties
To study the relationships between cotton fiber properties and fiber breakage
3.3 Materials and Methods
Five commercial cotton samples, namely 8, 25, 3552, 3643 and 3653, were selected for
this experiment. These samples possessed a wide range of strength, maturity and length
while the elongation values varied within a small range. At stage I, average fiber
properties of the samples varied as follows. Average force-to-break measured with
FAVIMAT ranged from 3.92 cN to 5.26 cN; AFIS maturity ratio ranged from 0.78 to
0.91; AFIS length by number ranged from 0.68 inch to 0.85 inch and FAVIMAT
elongation-at-break ranged from 10.19% to 13.59% (Tables 3.1 and 3.2). Among the
selected samples ‘25’ had the highest force-to-break while ‘3552’ had the lowest. ‘3552’
Page 66
Texas Tech University, Ruvini Mathangadeera, December 2014
54
was also the least mature cotton whereas ‘3643’ was the most mature. Sample ‘8’
possessed the shortest lengths while ‘3653’ was the longest cotton.
Table 3.1 Mean tensile property measurements of the selected samples for stage I
(measured by FAVIMAT)
Sample ID Elongation-at-
break (%)
Force-to-break
(cN)
Work-to-break
(cNcm)
8 10.32 4.42 0.070
25 13.38 5.26 0.104
3552 13.59 3.92 0.086
3643 10.19 4.75 0.071
3653 10.59 4.65 0.072
Table 3.2 Mean AFIS fiber properties of the selected samples for stage I
Sample ID Length by
Number (inch)
Maturity
Ratio
SFC by
Number (%)
8 0.68 0.86 33.0
25 0.83 0.88 18.1
3552 0.73 0.78 31.8
3643 0.79 0.91 26.8
3653 0.85 0.88 20.9
SFC - Short Fiber Content
Page 67
Texas Tech University, Ruvini Mathangadeera, December 2014
55
Prior to the experiment the samples were preconditioned at 70±1◦F and 65±2% relative
humidity for 48 hours. From each sample, 5g of cotton was sub-sampled and blended
using a specially designed table top blender which does not cause any fiber breakage. The
blended fiber samples were passed once through USTER AFIS PRO and were considered
as the first stage of the experiment. An additional set of blended cotton samples was
passed through the AFIS twice. The resultant samples were considered as the second
stage of the experiment. As the third stage of the experiment another set of blended
cotton samples were passed thrice through the AFIS (Figure 3.4).
Tensile properties of all the cotton samples belonging to the three stages were tested with
the FAVIMAT. Per sample, 3 replicates of 150 individual fibers were tested with the
FAVIMAT using a 3mm gauge length, with a test speed of 20mm/min and a pre-tension
of 0.2cN/dtex. Single fiber tensile testing was carried out at the smallest gauge length so
that short fibers could also be measured.
The AFIS measurements consisted of 20 replicates (slivers) of 10,000 fibers. Fiber
processing and testing were carried out in a conditioned environment at 70±1◦F and
65±2% relative humidity.
Page 68
Texas Tech University, Ruvini Mathangadeera, December 2014
56
Figure 3.4 Procedure for evaluating the impact of less aggressive (AFIS) processing
The second phase of the experiment was mainly focused on investigating the impact of
fiber processing by a very aggressive instrument such as the MTM. The experiment was
conducted using the same 5 samples which were used to study the impact of light
processing by AFIS. Sub samples of 30g cotton were obtained from each sample and
were blended using the table top blender. From the blended cotton, 20g was used for
processing in MTM while the remaining cotton was kept aside for initial AFIS
measurements. The 5 cotton samples were subjected to two consecutive runs through the
MTM (Figure 3.5). Fiber property measurements of the resultant fibers were obtained
from FAVIMAT and AFIS. FAVIMAT measurements consisted of three replicates of
150 fibers tested at 3mm gauge length. AFIS measurements of both blended and MTM
processed samples consisted of five replicates of 3,000 fibers.
Page 69
Texas Tech University, Ruvini Mathangadeera, December 2014
57
Figure 3.5 Procedure for evaluating the impact of very aggressive (MTM) processing
3.4 Results and Discussion
Comparison of the length distributions prior to and after processing provides an insight
into the extent of fiber breakage caused by the equipment. As visible from the length
distribution in Figure 3.6, when processed with AFIS, at the later stages higher amounts
of short fibers are present in the cotton samples than at the earlier stage. Short fiber
content of cotton is a major concern in the textile industry as the presence of excessive
amounts of short fibers can give rise to low production efficiencies and poor quality of
the textile product.
When cotton is passed through the AFIS, the forces exerted on the fibers eventually result
in fiber breakage. Especially, the opening roller contains metal teeth that can damage the
fibers during fiber individualization. Therefore, the subsequent increase in short fiber
content due to AFIS processing demonstrates that AFIS effectively causes fiber breakage.
Page 70
Texas Tech University, Ruvini Mathangadeera, December 2014
58
Figure 3.6 AFIS length distribution of sample 3643 in the 3 stages
The difference between the length distributions of the stages 1 and 2 is greater than the
difference between the stages 2 and 3. Most of the fibers with higher propensity to break
are broken at stage 2. Therefore, less of the fibers that have higher propensity to break are
left in the remaining population. Thus, comparatively less fiber breakage occurs at stage
3, which is the reason for the less difference between those two stages.
One of the main considerations of the present study is to evaluate the impact of fiber
processing on cotton fiber tensile properties. Thus, alterations in the three main tensile
properties elongation-at-break, force-to-break and work-to-break are assessed at each
processing stage. To determine the presence or absence of a significant difference
between the stages, for each tensile property, Analysis of variance (ANOVA) is
conducted using version 10 of the JMP Pro software.
0
1
2
3
4
5
6
7
8
9
0 0.25 0.5 0.75 1 1.25 1.5 1.75 2 2.25 2.5
Fre
qu
ency
Length by number (inch)
3643
3643 - Stage 1
3643 - Stage 2
3643 - Stage 3
Page 71
Texas Tech University, Ruvini Mathangadeera, December 2014
59
Figure 3.7 Mean elongation-at-break values of the 5 samples across the 3 stages
As demonstrated in Figure 3.7, elongation-at-break is not significantly different across
the three processing stages. Due to the extremely narrow range of elongation of the 5
samples, and the less aggressive nature of processing, it is not possible to see a significant
impact on elongation-at-break.
8
9
10
11
12
13
14
15
8 25 3552 3643 3653
Elo
ng
ati
on
-at-
bre
ak
(%
)
Sample ID
Stage 1
Stage 2
Stage 3
---NS-- ---NS-- ---NS-- ---NS-- ---NS--
Page 72
Texas Tech University, Ruvini Mathangadeera, December 2014
60
Figure 3.8 Mean force-to-break values of the 5 samples across the 3 stages
*Levels not connected by the same letter are significantly different at α =0.05
significance level.
A significant difference in force-to-break between the stages can be observed for three
samples (Figure 3.8). For 8, 3643 and 3653, force-to-break values of the second and third
stages are significantly higher than that of the first stage. The significant increase in
force-to-break at the later stages indicates that the proportion of strong fibers is also
higher at those stages. This can be attributed to the lower propensity to break of the high
force-to-break fibers. Accordingly fibers with high force-to-break have survived better
during processing resulting in higher proportions in the subsequent processed samples.
Since most of the fibers with higher propensity to break might have been broken at stage
2, less of those fibers are present in the subsequent population. Therefore, the difference
3
3.5
4
4.5
5
5.5
6
8 25 3552 3643 3653
Fo
rce-
to-b
rea
k (
cN)
Sample ID
Stage 1
Stage 2
Stage 3
--NS-- --NS-- b a a b a a
a
b a a
Page 73
Texas Tech University, Ruvini Mathangadeera, December 2014
61
in force-to-break between the second and third stages is not significant for the above 3
samples. However, as a whole force-to-break is not significantly different between the
stages. The higher maturity of the above three samples might have caused the significant
difference in force-to-break that can be observed with those samples.
Figure 3.9 Mean work-to-break values of the 5 samples across the 3 stages
*Levels not connected by the same letter are significantly different at α =0.05
significance level.
Except for sample 8, work-to-break of the other samples does not significantly differ
between the three stages (Figure 3.9). The significant difference observed in sample 8
might be due to its low work-to-break. Sample 8 had the lowest work-to-break at the first
stage. Thus, compared to the other samples a slighter magnitude of change in work-to-
break between the stages could turn out to be significant. Force-to-break of sample 8 also
0.04
0.05
0.06
0.07
0.08
0.09
0.1
0.11
8 25 3552 3643 3653
Work
-to-b
reak
(cN
cm)
Sample ID
Stage 1
Stage 2
Stage 3
---NS--- ---NS--- ---NS--- ---NS---
b a ab
Page 74
Texas Tech University, Ruvini Mathangadeera, December 2014
62
significantly differs across the stages. As work-to-break is a combination of force-to-
break and elongation-at-break, the significant difference in force-to-break of sample 8
might have also caused the significant difference in work-to-break of that sample. Even
though work-to-break of sample 8 significantly differs between the first two stages, the
third stage does not significantly differ from any of the other two stages.
Considering all the samples in general, work-to-break does not significantly differ
between the 3 stages. Since both elongation and force do not display significant
differences between the processing stages work-to-break also has to be non-significant.
Overall, none of the tensile properties are significantly different between the fiber
samples belonging to the 3 different stages. All the samples have behaved the same when
processed with AFIS. Processing did not have any significant impact on cotton fiber
tensile properties when these selected samples were processed with less aggressive
equipment like AFIS. Therefore, AFIS is not aggressive enough to reveal the impact of
processing. Hence, it can be stated that light processing does not cause enough fiber
breakage to see a significant impact of processing. As mentioned earlier elongation-at-
break of the 5 samples varies within a small range. Thus, it also appears that light
processing does not have any impact on cotton fiber tensile properties when the samples
possess a narrow range of elongation.
Rebenfeld (1957) stated that the extent of fiber property changes due to processing is not
the same for all the cottons and mostly these changes are functions of the native fiber
Page 75
Texas Tech University, Ruvini Mathangadeera, December 2014
63
properties. Correspondingly, according to our results, characteristic fiber properties of
cotton as well as their ranges seem to influence the impacts caused by fiber processing.
In order to understand the relationships between cotton fiber properties and fiber
breakage, length distributions of the 5 cotton samples are compared. Out of the 5
samples, sample 25 possesses the highest force-to-break whereas sample 3552 possesses
the lowest force-to-break. Considering the length distributions of these two samples
(Figures 3.10 and 3.11) through the 3 stages, sample 25 (Figure 3.10) displays less
difference between the stages compared to sample 3552 (Figure 3.11). This can be
attributed to the unequal extents of fiber breakage that has occurred in the two cottons
due to processing. The stronger cotton which can better withstand the processing stresses
demonstrates less fiber breakage compared to the weaker cotton. Thus, in the length
distribution of sample 25 slight differences can be observed between the 3 stages whereas
comparatively larger differences can be observed for sample 3552.
Page 76
Texas Tech University, Ruvini Mathangadeera, December 2014
64
Figure 3.10 AFIS length distribution of sample 25 in the 3 stages
Figure 3.11 AFIS length distribution of sample 3552 in the 3 stages
0
1
2
3
4
5
6
7
8
9
0 0.25 0.5 0.75 1 1.25 1.5 1.75 2 2.25
Fre
qu
ency
Length by number (inch)
25
25 - Stage 1
25 - Stage 2
25 - Stage 3
0
1
2
3
4
5
6
7
8
9
0 0.25 0.5 0.75 1 1.25 1.5 1.75 2 2.25 2.5
Fre
qu
ency
Length by number (inch)
3552
3552 - Stage 1
3552 - Stage 2
3552 - Stage 3
Page 77
Texas Tech University, Ruvini Mathangadeera, December 2014
65
AFIS is considered as an instrument which quite well simulates the behavior of cotton
during further textile manufacturing processes. Cotton which shows high fiber breakage
when passing through the AFIS also has a high tendency for fiber breakage during textile
processing steps such as carding. Hence, the AFIS length distributions indicate that a
strong cotton like 25 will result in less fiber breakage at textile processing than a weak
cotton like 3552.
To study the relationships between fiber length and fiber breakage caused by the AFIS,
length distributions of the longest and the shortest cottons are taken into account. From
the 5 samples, sample 3653 has the highest mean length (0.85 inch) while sample 8 has
the shortest mean length (0.68 inch).
Figure 3.12 AFIS length distribution of sample 3653 in the 3 stages
0
1
2
3
4
5
6
7
8
9
0 0.25 0.5 0.75 1 1.25 1.5 1.75 2 2.25 2.5
Fre
qu
ency
Length by number (inch)
3653
3653 - Stage 1
3653 - Stage 2
3653 - Stage 3
Page 78
Texas Tech University, Ruvini Mathangadeera, December 2014
66
Figure 3.13 AFIS length distribution of sample 8 in the 3 stages
Comparison of the length distributions shows that the difference between the stages is
comparatively higher for sample 3653 (Figure 3.12) than for sample 8 (Figure 3.13). In
order for the AFIS individualizer to apply force on fibers, fibers must extend from the
feed roller to the individualizer. Therefore, to be broken by the AFIS, fibers need to be
more than 0.63 inch (16mm) long. When the mean lengths of the two samples are
considered, it is apparent that 3653 possesses a higher amount of fibers that are longer
than 0.63 inch compared to sample 8. Consequently 3653 may have more fiber breakage
with AFIS than sample 8. Since more fibers are broken, difference between the stages is
greater for the longer cotton. Thus, the longer the cotton is, the greater the fiber breakage
that occurs when passing through the AFIS.
0
1
2
3
4
5
6
7
8
9
0 0.25 0.5 0.75 1 1.25 1.5 1.75 2 2.25 2.5
Fre
qu
ency
Length by number (inch)
8
8 - Stage 1
8 - Stage 2
8 - Stage 3
Page 79
Texas Tech University, Ruvini Mathangadeera, December 2014
67
Maturity and fineness are the other main fiber properties measured by AFIS. Both
maturity and fineness of the cotton samples remained the same along processing with
AFIS.
As the second phase of the experiment the impacts caused by light and aggressive
processing are compared. The aggressive processing instrument used in the experiment
was MTM. AFIS which is less aggressive than MTM was considered as the light
processing equipment. In this context, light processing represents the samples that had
been passed once through the AFIS. The samples which were subjected to two runs
through the MTM are represented by aggressive processing.
Figure 3.14 AFIS length distribution of sample 25 at light and aggressive processing
stages
0
1
2
3
4
5
6
7
8
9
0 0.25 0.5 0.75 1 1.25 1.5 1.75 2 2.25
Fre
qu
ency
Length by number (inch)
25
25 - Light
processing
25 - Aggressive
processing
Page 80
Texas Tech University, Ruvini Mathangadeera, December 2014
68
As visible from the length distribution of sample 25 in Figure 3.14, aggressive processing
results in a higher short fiber content than light processing. This implies the occurrence of
more fiber breakage with MTM than with AFIS. In other words, aggressive processing
tends to cause more fiber breakage than light processing.
To explore the variations between the two extents of processing main tensile properties
are analyzed at each processing step.
Figure 3.15 Mean force-to-break values of the 5 samples at the 2 processing stages
Mean force-to-break (Figure 3.15) is not significantly different between the light and
aggressive processing stages for any of the samples.
At the early stage of this experiment, when light processing was considered, few samples
displayed a significant increase in force-to-break at the later processing stages (Figure
3.0
3.5
4.0
4.5
5.0
5.5
8 25 3552 3643 3653
Forc
e-to
-bre
ak
(cN
)
Sample ID
Light
processing
Aggressive
processing--NS-- --NS-- --NS-- --NS-- --NS--
Page 81
Texas Tech University, Ruvini Mathangadeera, December 2014
69
3.8). It indicated that stronger fibers which possessed lower propensity to break have
survived better during light processing. Yet, the absence of a significant increase in force-
to-break with aggressive processing emphasizes that stronger fibers have not exhibited a
better survival when much greater stresses are exerted on the fibers.
Figure 3.16 Mean elongation-at-break values of the 5 samples at the 2 processing stages
*Levels not connected by the same letter are significantly different at α =0.05
significance level.
As illustrated in Figure 3.16 mean elongation-at-break values of the aggressively
processed samples are significantly higher than the samples which were lightly
processed. This is true for all 5 cotton samples used in the study. Unlike in light
processing with the AFIS, processing with the MTM seems to have a major impact on
elongation. When processed with the aggressive instrument (MTM) many of the fibers
8
9
10
11
12
13
14
15
16
8 25 3552 3643 3653
Elo
ngati
on
-at-
bre
ak
(%
)
Sample ID
Light
processing
Aggressive
processing
b a b a b a b a b a
Page 82
Texas Tech University, Ruvini Mathangadeera, December 2014
70
that have low elongation have been broken, whereas the fibers with high elongation have
survived better. Thus, compared to light processing a significantly higher amount of high
elongation fibers could be seen after aggressive processing. Therefore, completely
different observations are obtained when the samples are processed with the AFIS and
the MTM. With light processing the fibers that are broken are the weaker fibers whereas
with harsh processing the fibers that are broken are those which possess low elongation.
Improvements in the efficiency and productivity of textile processes are essential for the
development of textile industry. Even though modern automated systems bring about
increased processing speeds, and save cost and man power, the stresses applied on fibers
have also dramatically increased compared to the conventional machinery. These
intensified forces exerted on fibers result in aggravated fiber damage which can adversely
affect the quality of the textile product. For instance, development of high speed carding
machines and faster spinning technologies has increased the degree of fiber damage
which occurs at processing. Open-end rotor spinning, which is now a major spinning
technology, is completely automated. Rotors turn at a speed of 140,000 rpm applying a
huge stress on fibers. Thus, in order to compensate for the increasing mechanical stresses
it is necessary to produce cotton which can endure harsh processing.
According to our results fibers with high elongation show better survival than low
elongation fibers when subjected to harsh processing. In addition, strong fibers have not
displayed better performance when it comes to harsh processing. Therefore, in terms of
aggressive processing elongation seems to be more important than force-to-break.
Accordingly fibers with improved elongation would be a very good alternative to the
Page 83
Texas Tech University, Ruvini Mathangadeera, December 2014
71
arising problem of extensive forces related to high processing speeds in the textile
industry.
Figure 3.17 Mean work-to-break values of the 5 samples at the 2 processing stages
*Levels not connected by the same letter are significantly different at α =0.05
significance level.
Mean values of work-to-break significantly differ between the two processing types
(Figure 3.17). Work-to-break is a combined measurement of elongation-at-break and
force-to-break. Thus, the significant impact observed in work-to-break is consistent with
the significant impact which exists in elongation. The significantly higher work-to-break
in aggressive processing represents a higher proportion of high work-to-break fibers in
the aggressively processed samples. Therefore, fibers with high work of rupture have
survived during processing while those with low work of rupture have been broken.
0.04
0.05
0.06
0.07
0.08
0.09
0.10
0.11
0.12
0.13
8 25 3552 3643 3653
Work
-to-b
rea
k (
cNcm
)
Sample ID
Light
processing
Aggressive
processing
b a b a b a b a b a
Page 84
Texas Tech University, Ruvini Mathangadeera, December 2014
72
Maturity and fineness distributions of the raw and MTM processed samples are also
compared. Noticeable differences cannot be detected between the raw and processed
samples with regard to maturity or fineness. Similar to processing with AFIS both
parameters have remained the same when processed with MTM.
3.5 Conclusion
Five cotton samples representing a wide range of strength and maturity and a small range
of elongation were employed in the study. To evaluate the impact of fiber processing on
cotton fiber tensile properties two different levels of processing were used. AFIS was
considered as the light processing instrument while MTM was the aggressive processing
instrument. The selected samples were processed separately with the two instruments and
their impacts on tensile properties were compared.
As the initial phase of the study the samples were blended and then processed with AFIS
in three different processing stages. The samples which were passed though the AFIS
once, twice and thrice were respectively named as first, second and third stages.
According to the results obtained, when fibers are passed through the AFIS some amount
of fiber breakage occurs. Degree of fiber breakage is influenced by the characteristic fiber
properties of the cotton samples such as strength and length. None of the tensile
properties differed significantly between the three processing stages. Hence, it can be
concluded that AFIS is not aggressive enough to reveal the impact of processing. In
addition, when elongation of the samples varies within a small range, light processing
does not seem to have any impact on cotton fiber tensile properties. Although the overall
effect on force-to-break was not significantly different, few samples resulted in a
Page 85
Texas Tech University, Ruvini Mathangadeera, December 2014
73
significant increase in force-to-break at the later stages indicating the breakage of weak
fibers and the survival of strong fibers.
Results obtained in the second phase of the study indicate that aggressive processing with
MTM causes more fiber breakage than light processing. Significant differences between
the two types of processing were detected for both elongation-at-break and work-to-
break. Compared to light processing, aggressive processing has resulted in significantly
higher elongation and work-to-break values. Fibers which possessed high elongation
were able to withstand the stresses of harsh processing, whereas those with low
elongation have undergone fiber breakage. Thus, elongation seems to be the dominant
tensile property in aggressive processing.
Hence, different effects were observed with the two levels of fiber processing. Light
processing is not aggressive enough and does not cause enough fiber breakage to reveal a
significant impact of processing. But during harsh processing low elongation fibers tend
to have a higher propensity to break. With the gradually increasing processing speeds of
the textile industry the necessity of improving stress endurance of fibers is highly felt. As
implied by the results of the present study, fibers with high elongation are capable of
surviving aggressive processing better than those with low elongation. Therefore, cotton
fibers with improved elongation would serve this purpose. Thus, it can be interpreted that
fiber elongation might be the most important tensile property in textile processing.
Page 86
Texas Tech University, Ruvini Mathangadeera, December 2014
74
CHAPTER IV
EVALUATING THE IMPORTANCE OF COTTON FIBER ELONGATION IN TERMS
OF FIBER PROCESSING
4.1 Introduction
Developing cottons with improved fiber quality is a major concern of the breeding
programs around the world. Priority of these programs is most often given to the
improvement of fiber strength and length while fiber elongation has generally been
neglected in the selection process.
Fiber elongation or extensibility is one of the main contributing factors of yarn quality.
Improved fiber elongation results in improved work of rupture of the fiber. Thus, less
fiber breakage occurs at the gin and other processing stages, which leads to a reduced
short fiber content. Subsequently, a better yarn evenness can be achieved.
High Volume Instrument (HVI) is the cotton classification instrument that is considered
as the standard method for the measurement of fiber properties. Nevertheless, the HVI
lacks calibration procedures for elongation measurement that prevents the instrument
from providing a precise measurement for the property, which is one of the reasons for
the lack of interest in elongation in the breeding programs. Even though the Stelometer
can be properly calibrated for elongation, it is not feasible for extensive use since it is
extremely slow. In addition, the weak negative correlation between elongation and
tenacity is preventing the breeders from working on elongation assuming that it would
give rise to lower tenacity. Thus, there is a lack of interest among cotton breeders to
improve fiber elongation. However, the presence of a weak negative correlation should
Page 87
Texas Tech University, Ruvini Mathangadeera, December 2014
75
not hinder the improvement of both tenacity and elongation simultaneously. In fact, being
restricted to fiber tenacity in terms of improving the work-to-break is inaccurate (Benzina
et al., 2007). The use of strength alone as the basis for selection or rejection of
experimental cotton varieties might be inadequate (Fiori et al., 1956).
In a previous experiment of the present study, a positive correlation was observed
between individual fiber tenacity and elongation (measured by FAVIMAT) which
reinforced the importance of improving elongation. In addition, the impact of fiber
processing on tensile properties was evaluated in Chapter 3. According to the results
obtained, it appears that fiber elongation is the critical tensile property in aggressive
processing. Therefore, the results of the above two experiments suggested the necessity
of further evaluating the importance of elongation. Hence, the current experiment focuses
on investigating the importance of elongation in fiber processing. This will be helpful to
determine whether selection of cotton cultivars based on their elongations would be
beneficial during processing of cotton fibers in the textile industry. In addition, the
relationships between elongation and other major fiber properties are also assessed in this
chapter.
To fulfill the main intention of determining the importance of elongation, it is necessary
to isolate elongation from other fiber properties. Therefore, cotton samples that are
similar in all other fiber properties except elongation are selected to serve this purpose.
The selected samples also represent a wide range of elongation, which will be more
favorable in assessing the impact of elongation.
Page 88
Texas Tech University, Ruvini Mathangadeera, December 2014
76
In order to evaluate the impact of processing, Micro Dust and Trash Analyzer 3 (MDTA
3) is used as the processing equipment in this experiment. MDTA 3 (Figure 4.1) is
basically used to determine the trash content of a sample and to separate the lint, trash,
fiber fragments and dust. It opens up the fiber tufts to single fibers which are then
cleaned, blended and finally formed into a sliver. MDTA 3 also has the potential to cause
fiber breakage and may remove some short fibers as well. It is considered as an
aggressive fiber processing instrument.
Figure 4.1 Micro Dust and Trash Analyzer 3 (MDTA 3)
In this chapter, fiber properties measured using FAVIMAT, Advanced Fiber Information
System (AFIS) and Cottonscope are taken into consideration. Tensile property
measurements of the fibers are acquired from the FAVIMAT. AFIS is used to obtain
length, fineness and maturity distributions. Cottonscope (Figure 4.2) provides accurate
Page 89
Texas Tech University, Ruvini Mathangadeera, December 2014
77
measurements of fiber fineness, maturity ratio, ribbon width and micronaire with the use
of fiber snippets. Polarized light microscopy and image analysis are the techniques used
in the Cottonscope.
Figure 4.2 Cottonscope
4.2 Hypotheses
When the impact of fiber processing on tensile properties was assessed (Chapter 3),
elongation appeared to be the most important tensile property in aggressive fiber
processing. In accordance with that, it can be hypothesized that fibers with higher
elongations may perform better when subjected to processing than those with lower
elongations.
The MDTA3, which is the fiber processing equipment used in this experiment is also
aggressive. Thus, we expect to see a difference between the tensile property distributions
Page 90
Texas Tech University, Ruvini Mathangadeera, December 2014
78
of the raw and processed stages. As the higher elongation fibers may withstand
processing better and may result in less fiber breakage, it is hypothesized that the
proportion of higher elongation fibers in the processed samples will be higher than that of
the raw samples (Figure 4.3).
Figure 4.3 Hypothesized elongation-at-break distributions of the raw and processed
stages
Since cotton samples with a wide range of elongation are employed in the experiment, it
is assumed that the better performance of higher elongation fibers will be portrayed in the
elongation-at-break distributions of the raw and processed samples belonging to the
different elongation groups. As observed in Chapter 2 (Figure 2.8) of the present study,
standard deviation of individual fiber elongation increases with higher elongations.
Because high elongation cotton has higher variation, it can be hypothesized that higher
the elongation, higher will be the difference between the raw and processed stages.
Page 91
Texas Tech University, Ruvini Mathangadeera, December 2014
79
Therefore, for the high elongation cottons, we expect to see a greater difference between
the elongation-at-break distributions of the two stages.
4.3 Objectives
To investigate the importance of cotton fiber elongation in terms of fiber
processing
To assess the relationships between elongation and other important fiber
properties such as strength and length
4.4 Materials and Methods
Thirty two cotton samples were selected for the experiment based on their High Volume
Instrument (HVI) elongation values. The selected samples possess a wide variation in
their elongations ranging from 10.04% to 16.17% (Table 4.1), while all other fiber
properties are nearly the same within each family. These samples resulted from a
breeding program aimed at improving cotton fiber elongation. The statistical design of
the relevant field experiment had been randomized complete block design with four field
replications per breeding line. The thirty two samples belong to two families; ‘1’ and ‘2’.
Each family consists of two groups; the HVI higher elongation group and the lower
elongation group. Each elongation group is comprised of samples which were grown in
two different locations; A and B (Figure 4.4). Altogether there are four different breeding
lines in two locations (A and B), designated respectively with the corresponding family
name, HVI elongation group and the location as follows; 1 Low A, 1 Low B, 1 High A, 1
High B, 2 Low A, 2 Low B, 2 High A and 2 High B.
Page 92
Texas Tech University, Ruvini Mathangadeera, December 2014
80
Figure 4.4 The cotton samples selected for the experiment
Page 93
Texas Tech University, Ruvini Mathangadeera, December 2014
81
Table 4.1 Mean tensile property measurements of each group for the raw stage
Group Elongation-at-
break (%)
Force-to-break
(cN)
Work-to-break
(cNcm)
1 Low A 12.13 5.31 0.096
1 Low B 10.93 4.90 0.080
1 High A 16.17 5.29 0.130
1 High B 15.44 5.30 0.126
2 Low A 10.14 4.88 0.073
2 Low B 10.04 4.72 0.070
2 High A 14.74 4.95 0.114
2 High B 13.65 5.03 0.107
Prior to the experiment the samples were preconditioned at 70±1◦F and 65±2% relative
humidity for at least 48 hours. For fiber testing two sub samples of 5g lint were obtained
from each original sample. The raw (unprocessed) lint samples were tested with USTER
AFIS PRO, FAVIMAT (Textechno Herbert Stein GmbH. & Co.KG) and Cottonscope.
AFIS data for each sample consisted of five replicates of 3,000 individual fibers.
FAVIMAT measurements included two replicates of one hundred and fifty individual
fibers per sample. Individual fiber tensile testing with the FAVIMAT was carried out at
3mm gauge length, with a test speed of 20mm/min and a pre-tension of 0.2cN/dtex. The
minimum gauge length was used so that the short fibers could be analyzed as well. Six
replications of 50±1 mg were analyzed for each sample using the Cottonscope, primarily
to measure fineness, maturity ratio, micronaire, and ribbon width.
Page 94
Texas Tech University, Ruvini Mathangadeera, December 2014
82
As the second phase of the experiment, the thirty two samples were subjected to
processing in the Micro Dust and Trash Analyzer 3 (MDTA 3). This was performed to
investigate the impact of processing and to evaluate the significance of elongation in
terms of processing. For fiber processing two sub samples of 5g lint were drawn from
each initial sample. After being run through the MDTA 3 twice, the processed samples
were tested with the AFIS, FAVIMAT and Cottonscope employing the same testing
procedure as for the first set of samples. All the fiber testing and processing were carried
out in a conditioned environment at 70±1◦F and 65±2% relative humidity.
4.5 Results and Discussion
AFIS length distributions of the raw and processed samples are compared within each
elongation group of each family to examine the impact of processing using the MDTA3.
The processed samples contain a higher short fiber content compared to the
corresponding raw samples (Figure 4.5). This observation holds true for both elongation
groups of both families. The resultant increase in short fiber content after processing with
the MDTA3, implies that the instrument causes fiber breakage.
Page 95
Texas Tech University, Ruvini Mathangadeera, December 2014
83
Figure 4.5 AFIS length distributions of lower elongation group of family 1 in raw and
processed stages
The three tensile property measurements obtained from FAVIMAT, namely elongation-
at-break, force-to-break and work-to-break, are taken into account during the analysis of
the FAVIMAT data. Several sources of variability can be found in the experiment;
family, elongation group, location, field replications and test replications. Therefore, to
determine which of these influencing parameters are statistically significant, analysis of
variance (ANOVA) is performed. For each tensile property, ANOVA is conducted using
version 10 of the JMP Pro software to determine the differences between the two
families, two elongation groups and the two locations. The null hypotheses tested in all
the above instances are that the mean values for a particular parameter are equal for the
two families, two elongation groups and the two locations. Significance of the interaction
0
1
2
3
4
5
6
7
8
0 0.25 0.5 0.75 1 1.25 1.5 1.75 2 2.25
Fre
qu
ency
Length by number (inch)
Family 1 - Low
1 - Low - Raw
1 - Low - Processed
Page 96
Texas Tech University, Ruvini Mathangadeera, December 2014
84
between the two factors, elongation group and location, is also assessed. The differences
between the mean tensile property measurements of the processed and raw stages are
used to perform the ANOVA test at the 0.05 significance level.
Figure 4.6 Mean elongation-at-break values of the 8 groups for the two stages
*Levels not connected by the same letter are significantly different at α =0.05
significance level.
Except for location A of the lower elongation group of family 2, mean elongation-at-
break values show a significant increase in the processed samples for all the other groups
(Figure 4.6). This indicates that fibers with high elongations tend to have a lower
propensity to break. In a population of fibers both higher and lower elongation fibers are
present. When subjected to processing, the higher elongation fibers tend to survive better
6
8
10
12
14
16
18
20
1 Low
A
1 Low
B
1 High
A
1 High
B
2 Low
A
2 Low
B
2 High
A
2 High
B
Elo
ngati
on
-at-
bre
ak
(%
)
Group
Raw
Processed
b a a a b a b a b a b a
Family **
Elongation group **
Location NS
Elongation group*Location **
b a b a
Page 97
Texas Tech University, Ruvini Mathangadeera, December 2014
85
than the lower elongation fibers. Since lower elongation fibers have been broken during
processing, a higher amount of higher elongation fibers is present in the subsequent
samples, which results in an increase in elongation.
Significant differences in elongation-at-break values are detected between the two
families and the two HVI elongation groups while there is no significant difference
between the two locations. HVI higher elongation groups of both families possess
significantly higher elongations than the corresponding lower elongation groups. From
the two families, elongation-at-break values of family 1 are significantly higher than that
of family 2. The two locations within each elongation group of each family are very
similar in terms of elongation. As the interaction between elongation group and location
is also significant, mean separation is performed using student’s t-test in JMP Pro 10
(Table 4.2).
Page 98
Texas Tech University, Ruvini Mathangadeera, December 2014
86
Table 4.2 Student’s t-test ranking of difference between raw and processed cotton in
mean elongation-at-break of the 32 samples
Elongation group **
Location NS
Elongation group x Location **
Level
Difference between raw and processed
cotton in mean elongation-at-break
Ranking
High, A
2.64 A
High, B
2.00 A B
Low, B
1.34 B C
Low, A
0.84 C
*Significant differences between the levels (α =0.05) are denoted by different letters.
Due to the significant interaction between elongation group and location, differences in
mean elongation-at-break between the raw and processed stages, are greater for the
higher elongation groups than for the lower elongation groups. Table 4.2 provides
supporting evidence for the hypothesis that the high elongation cotton shows higher
difference between the raw and processed stages.
The difference between the mean elongation-at-break values of the raw and processed
stages is analyzed family-wise using the student’s t-test (Table 4.3).
Page 99
Texas Tech University, Ruvini Mathangadeera, December 2014
87
Table 4.3 Mean separation of difference between raw and processed cotton in mean
elongation-at-break of the two families
Level
Difference between raw and processed
cotton in mean elongation-at-break
Ranking
Family 1 1.97 A
Family 2 1.43 B
Among the two families, difference between the raw and processed stages is more
prominent in family 1 than in family 2 (Table 4.3). At the raw stage, family 1 shows more
variation in elongation, ranging from 10.93% to 16.17%, than family 2, in which
elongation varies from 10.04% to 14.74% (Table 4.1). Thus, the family which possesses a
wider variation in elongation shows a greater difference between the elongation
measurements of the raw and processed stages.
Page 100
Texas Tech University, Ruvini Mathangadeera, December 2014
88
Figure 4.7 Mean force-to-break values of the 8 groups for the two stages
Mean force-to-break values of the processed stage are not significantly different from
those of the raw stage, for any of the groups (Figure 4.7). As it is not possible to detect a
significant increase in the amount of stronger fibers after processing, it can be interpreted
that the fibers with higher force-to-break might not have displayed better survival when
subjected to processing with the MDTA3. No significant effect of the three factors
family, elongation group and location could be identified with regard to the force-to-
break values. Nevertheless, the interaction between the two factors elongation group and
location demonstrates a significant impact on force-to-break. The significant interaction
between elongation group and location is analyzed using student’s t-test (Table 4.4).
4.0
4.2
4.4
4.6
4.8
5.0
5.2
5.4
5.6
1 Low
A
1 Low
B
1 High
A
1 High
B
2 Low
A
2 Low
B
2 High
A
2 High
B
Fo
rce-
to-b
rea
k (
cN)
Group
Raw
Processed
-NS-
Family NS
Elongation group NS
Location NS
Elongation group*Location **
-NS- -NS- -NS- -NS- -NS- -NS- -NS-
Page 101
Texas Tech University, Ruvini Mathangadeera, December 2014
89
Table 4.4 Student’s t-test ranking of difference between raw and processed cotton in
mean force-to-break of the 32 samples
Elongation group NS
Location NS
Elongation group x Location **
Level
Difference between raw and processed
cotton in mean force-to-break
Ranking
High, A
0.2214 A
Low, B
0.0300 A B
High, B
-0.0114 A B
Low, A
-0.1194 B
*Significant differences between the levels (α =0.05) are denoted by different letters.
As visible from Table 4.4, two of the levels display a slight increase in force-to-break due
to processing, while the other two levels display a very slight decrease in force-to-break.
Page 102
Texas Tech University, Ruvini Mathangadeera, December 2014
90
Figure 4.8 Mean work-to-break values of the 8 groups for the two stages
*Levels not connected by the same letter are significantly different at α =0.05
significance level.
Work-to-break is a combination of elongation-at-break and force-to-break. Thus,
consistent with elongation-at-break, mean work-to-break values also demonstrate a
significant increase in the processed samples (Figure 4.8). This holds true for all the
groups except for location A of the lower elongation group of family 1. The consequent
significant increase in work-to-break indicates the lower propensity to break of the fibers
which possess higher work-to-break. Therefore, the fibers with higher work-to-break
seem to have survived better during processing. As a result, a high amount of fibers
0.04
0.06
0.08
0.1
0.12
0.14
0.16
0.18
1 Low
A
1 Low
B
1 High
A
1 High
B
2 Low
A
2 Low
B
2 High
A
2 High
B
Wo
rk-t
o-b
rea
k (
cNcm
)
Group
Raw
Processed
b a b a b a b a b a b a b a
Family NS
Elongation group **
Location NS
Elongation group*Location **
a a
Page 103
Texas Tech University, Ruvini Mathangadeera, December 2014
91
having higher work-to-break is left in the subsequent population, giving rise to an
increase in work-to-break.
Similar to elongation-at-break, work-to-break also significantly differs between the HVI
elongation groups. Higher elongation groups of both families possess significantly higher
work-to-break values than the corresponding lower elongation groups. But, unlike
elongation-at-break, work-to-break does not significantly differ between the two families.
Similar to both elongation-at-break and force-to-break, location does not have a
significant impact on work-to-break, whereas the interaction between elongation group
and location is significant. Thus, mean separation is performed using student’s t-test
(Table 4.5).
Table 4.5 Student’s t-test ranking of difference between raw and processed cotton in
mean work-to-break of the 32 samples
Elongation group **
Location NS
Elongation group x Location **
Level
Difference between raw and processed
cotton in mean work-to-break
Ranking
High, A 0.0248 A
High, B 0.0166 A B
Low, B 0.0132 B C
Low, A 0.0056 C
*Significant differences between the levels (α =0.05) are denoted by different letters.
Page 104
Texas Tech University, Ruvini Mathangadeera, December 2014
92
Owing to the significant interaction between elongation group and location, differences in
mean work-to-break between the raw and processed stages, are greater for the higher
elongation groups than for the lower elongation groups (Table 4.5).
Considering the observations of the tensile properties, it appears that processing did not
have a significant impact on force-to-break. Hence, it can be stated that the impact of
elongation has been isolated in the selected 32 samples. Thus, the selected materials are
suitable and adequate to test our objective of evaluating the importance of elongation in
fiber processing.
Due to the high variability of cotton fibers, their mean tensile properties do not represent
the characteristics of the entire distribution. Therefore, it is essential to examine the
tensile property distributions of the raw and processed stages.
As mentioned previously, field replications are a source of variability among the selected
32 samples. Thus, the tensile property distributions of each group are inspected to study
the variability among the four field replications within a group. Figure 4.9 illustrates the
elongation-at-break distributions of the four field replications which belong to location A
of higher elongation group of family 1 at the raw stage.
Page 105
Texas Tech University, Ruvini Mathangadeera, December 2014
93
Figure 4.9 Elongation-at-break distributions of the 4 field replications of location A of
higher elongation group of family 1 at the raw stage
As visible from Figure 4.9, the field replications within a group are nearly the same.
Hence, the difference between the field replications will not be considered during further
analysis of the distributions. According to the ANOVA results, location effect was not
significant for any of the tensile properties. Therefore, to facilitate clear interpretation of
the distributions, difference between the two locations will also be disregarded
henceforth. Consequently the distributions of the HVI higher and lower elongation
groups of both families at the raw and processed stages will be taken into account.
0.00
0.05
0.10
0.15
0.20
5 7.5 10 12.5 15 17.5 20 22.5 25 27.5 30 32.5
Relative
Frequency
Elongation-at-break (%)
Family 1 - High - A - Raw
1 - High - A - 1
1 - High - A - 2
1 - High - A - 3
1 - High - A - 4
Page 106
Texas Tech University, Ruvini Mathangadeera, December 2014
94
Figure 4.10 Elongation-at-break distributions of the two elongation groups of family 1
for both raw and processed stages
The above elongation-at-break distribution elucidates a clear clustering based on the HVI
elongation group which is analogous to the significant impact of elongation group that
was detected with the statistical analysis. Figure 4.10 also demonstrate a shift in the
distributions of the processed samples. The distributions of the processed samples are
shifted towards the higher elongations, compared to the distributions of the corresponding
raw samples. Since lower elongation fibers tend to be broken during processing, a high
amount of higher elongation fibers is left in the successive population. The resultant
increase in elongation is displayed by the shift in the distributions. These distributions
comply well with the hypothesized elongation-at-break distributions.
0.00
0.05
0.10
0.15
0.20
0.25
5 7.5 10 12.5 15 17.5 20 22.5 25 27.5 30 32.5 35 37.5
Relative
Frequency
Elongation-at-break (%)
Family 1
1 - High - Processed
1 - High - Raw
1 - Low - Processed
1 - Low - Raw
Page 107
Texas Tech University, Ruvini Mathangadeera, December 2014
95
In addition, the shift in the distributions of the processed samples is prominently visible
in the higher elongation groups (Figure 4.10). As visible from the elongation-at-break
distributions, in the higher elongation groups elongation varies over a wider range,
whereas it varies over a narrower range in the lower elongation groups. Therefore, high
elongation cotton has a wider distribution. The difference between the raw and processed
stages is high for the higher elongation groups. Accordingly, a bigger shift in the
distributions can be observed for the higher elongation groups. This supports the
hypothesis that the difference between the stages increases with increasing elongation.
The elongation-at-break distributions of family 2 (Figure 4.11) also illustrate the same
trends which are observed with family 1. Comparison of the distributions of the two
families reveals that family 1 (Figure 4.10) shows higher differences between the raw and
processed stages than family 2 (Figure 4.11).
Page 108
Texas Tech University, Ruvini Mathangadeera, December 2014
96
Figure 4.11 Elongation-at-break distributions of the two elongation groups of family 2
for both raw and processed stages
In order to be tested with the FAVIMAT, fibers need to be clamped on both ends. Thus,
from a fiber sample only the fibers which are long enough to be caught on both ends
could be tested with the FAVIMAT. For instance, approximately the fibers need to be at
least 11mm long to be tested with FAVIMAT employing the 3mm gauge length. Fiber
processing always results in some amount of fiber breakage. As a consequence, short
fibers are generated during fiber processing. These short fibers cannot be tested with
FAVIMAT. Thus, among the fibers with a higher tendency to break, breakage of short
fibers would be less visible in the distributions while breakage of longer fibers would be
more visible.
0.00
0.05
0.10
0.15
0.20
0.25
0.30
0.35
5 7.5 10 12.5 15 17.5 20 22.5 25 27.5 30 32.5 35
Relative
Frequency
Elongation-at-break (%)
Family 2
2 - High - Processed
2 - High - Raw
2 - Low - Processed
2 - Low - Raw
Page 109
Texas Tech University, Ruvini Mathangadeera, December 2014
97
The force-to-break distributions of the two families are illustrated below (Figures 4.12
and 4.13).
Figure 4.12 Force-to-break distributions of the two elongation groups of family 1 for
both raw and processed stages
0.00
0.05
0.10
0.15
0.20
1 2 3 4 5 6 7 8 9 10 11 12 13
Relative
Frequency
Force-to-break (cN)
Family 1
1 - High - Processed
1 - High - Raw
1 - Low - Processed
1 - Low - Raw
Page 110
Texas Tech University, Ruvini Mathangadeera, December 2014
98
Figure 4.13 Force-to-break distributions of the two elongation groups of family 2 for
both raw and processed stages
As visible from Figures 4.12 and 4.13, the force-to-break distributions are not noticeably
different between the two elongation groups as well as the raw and processed stages. The
32 samples have been selected for the experiment ensuring that all the fiber properties
except elongation are nearly constant within each family. Since the above distributions
indicate that the two elongation groups within a family do not differ in terms of force-to-
break, it provides evidence that the sample selection was ideal. In addition, the
distributions clearly depict the absence of a processing impact on force-to-break. This
implies that the fibers with higher force-to-break have not displayed a considerably better
survival when subjected to processing in MDTA3.
0.00
0.05
0.10
0.15
0.20
1 2 3 4 5 6 7 8 9 10 11 12 13 14
Relative
Frequency
Force-to-break (cN)
Family 2
2 - High - Processed
2 - High - Raw
2 - Low - Processed
2 - Low - Raw
Page 111
Texas Tech University, Ruvini Mathangadeera, December 2014
99
Figure 4.14 Work-to-break distributions of the two elongation groups of family 1 for
both raw and processed stages
0.00
0.05
0.10
0.15
0.20
0.02 0.06 0.1 0.14 0.18 0.22 0.26 0.3 0.34 0.38
Relative
Frequency
Work-to-break (cNcm)
Family 1
1 - High - Processed
1 - High - Raw
1 - Low - Processed
1 - Low - Raw
Page 112
Texas Tech University, Ruvini Mathangadeera, December 2014
100
Figure 4.15 Work-to-break distributions of the two elongation groups of family 2 for
both raw and processed stages
As work-to-break is a combination of force-to-break and elongation-at-break, the trends
and relationships revealed by the work-to-break distributions (Figures 4.14 and 4.15) are
consistent with the elongation-at-break distributions. The distributions of the processed
samples are shifted towards the higher work-to-break values. This indicates that the fibers
with higher work-to-break have survived better during processing than those with lower
work-to-break. Thus, a high amount of fibers which possess higher work-to-break, is left
in the subsequent population which causes the shift in the distributions towards the higher
work-to-break.
Within a family, the work-to-break distributions of the two elongation groups could be
clearly distinguished from each other. The higher elongation groups possess a wider
0.00
0.05
0.10
0.15
0.20
0.25
0.02 0.06 0.1 0.14 0.18 0.22 0.26 0.3 0.34 0.38
Relative
Frequency
Work-to-break (cNcm)
Family 2
2 - High - Processed
2 - High - Raw
2 - Low - Processed
2 - Low - Raw
Page 113
Texas Tech University, Ruvini Mathangadeera, December 2014
101
variation in work-to-break than the lower elongation groups. The difference between the
raw and processed stages is also high for the higher elongation groups.
The statistical analyses of the FAVIMAT data and the tensile property distributions
confirm all the hypotheses formulated prior to the experiment. Therefore, the FAVIMAT
results clearly demonstrate the better performance of higher elongation fibers in terms of
fiber processing. Furthermore, AFIS length distributions of the raw and processed stages
(Figures 4.16 and 4.17) also provide supporting evidence to the better performance of
higher elongation fibers.
Figure 4.16 AFIS length distributions of the two elongation groups of family 1 at the raw
stage
0
1
2
3
4
5
6
7
8
0 0.25 0.5 0.75 1 1.25 1.5 1.75 2
Fre
qu
ency
Length by number (inch)
Family 1 - Raw
1 - High - Raw
1 - Low - Raw
Page 114
Texas Tech University, Ruvini Mathangadeera, December 2014
102
At the raw stage, short fiber content of the samples belonging to the higher elongation
group of family 1, appears to be lower than the corresponding lower elongation group
(Figure 4.16). Even though the above samples belong to the raw stage, as the AFIS fiber
testing procedure causes some fiber breakage, the length distributions display the
breakage of fibers. Therefore, the lower short fiber content in the higher elongation group
suggests less fiber breakage in that group.
Figure 4.17 AFIS length distributions of the two elongation groups of family 1 at the
processed stage
Figure 4.17 illustrates the AFIS length distributions of the same elongation groups at their
processed stage. It also indicates less short fiber content in the higher elongation group,
which implies less fiber breakage in the higher elongation group. Thus, the better
0
1
2
3
4
5
6
7
8
0 0.25 0.5 0.75 1 1.25 1.5 1.75 2
Fre
qu
ency
Length by number (inch)
Family 1 - Processed
1 - High - Processed
1 - Low - Processed
Page 115
Texas Tech University, Ruvini Mathangadeera, December 2014
103
performance of higher elongation fibers is portrayed not only in the tensile property
distributions, but also in the length distributions.
If elongation was considered in the cotton breeding programs, it could result in better
fiber length distributions. Better fiber length distributions lead to better yarn evenness
which ultimately results in better fabric quality. Thus, having improved elongations tends
to positively influence the overall fiber quality.
Fineness and maturity distributions provided by the AFIS are also evaluated in the
experiment. The fineness distributions indicate a slight shift towards the higher end in the
processed samples. In other words, the processed samples possess a higher amount of
fibers with higher fineness compared to the corresponding raw samples. The removal of
very fine fibers during processing might have resulted in the above observation. For all
the elongation groups, the maturity distributions remain nearly the same prior and after
processing.
With regard to Cottonscope data, according to the ANOVA results, maturity ratio,
fineness, micronaire and ribbon width do not significantly differ between the raw and
processed stages. In addition, family, elongation group, location and the interaction
between elongation group and location do not have a significant impact for any of the
above parameters measured with the Cottonscope.
A positive correlation between elongation and tenacity of individual fibers was observed
in Chapter 2 (Figure 2.7) of the present study. The above relationship is also assessed for
Page 116
Texas Tech University, Ruvini Mathangadeera, December 2014
104
the thirty two samples using their force-elongation scatter plots. The scatter plots of three
selected groups are illustrated below.
Figure 4.18 Individual fiber force-elongation scatter plot of location A of higher
elongation group of family 1
0
2
4
6
8
10
12
14
0 10 20 30 40
Forc
e-to
-bre
ak
(cN
)
Elongation-at-break (%)
Family 1 High - A
1 High A - Raw
1 High A - Processed
Page 117
Texas Tech University, Ruvini Mathangadeera, December 2014
105
Figure 4.19 Individual fiber force-elongation scatter plot of location A of lower
elongation group of family 1
Figure 4.20 Individual fiber force-elongation scatter plot of location A of higher
elongation group of family 2
0
2
4
6
8
10
12
14
0 10 20 30 40
Fo
rce-
to-b
rea
k (
cN)
Elongation-at-break (%)
Family 1 Low - A
1 Low A - Raw
1 Low A - Processed
0
2
4
6
8
10
12
14
0 10 20 30 40
Fo
rce-
to-b
reak
(cN
)
Elongation-at-break (%)
Family 2 High - A
2 High A - Raw
2 High A - Processed
Page 118
Texas Tech University, Ruvini Mathangadeera, December 2014
106
The force-elongation scatter plots of the 32 samples demonstrate a positive correlation
between the two tensile properties at both raw and processed stages (Figures 4.18, 4.19
and 4.20). Similar to the elongation-at-break distributions, the force elongation scatter
plots also reveal that the difference between the raw and processed stages is more
noticeable in the higher elongation groups (Figure 4.18) than in the lower elongation
groups (Figure 4.19). When the two families are considered, family 1 (Figure 4.18),
which has higher elongations compared to family 2, shows more pronounced differences
between the raw and processed stages than family 2 (Figure 4.20). Moreover, the higher
variation in the HVI higher elongation group shown by the distributions is also detectable
in the scatter plots (Figure 4.18).
As seen by the scatter plots, among the data points of the processed samples (red dots),
there are some fibers which have higher elongation-at-break and lower force-to-break
values. Since those fibers have been able to endure processing, it indicates that the higher
elongation fibers tend to resist better to breakage even when they are not strong. This also
emphasizes the importance of elongation.
4.6 Conclusion
The importance of elongation suggested by the previous experiments was further
evaluated in the current experiment. The thirty two cotton samples selected had diverse
elongations. Yet, all the other fiber properties of the samples were constant within a
family. Each family consisted of two different elongation groups, namely the HVI higher
elongation group and the HVI lower elongation group. The above sample selection
procedure was intended to isolate the impact of elongation from the other fiber properties.
Page 119
Texas Tech University, Ruvini Mathangadeera, December 2014
107
Since the objective was to evaluate the importance of elongation in terms of fiber
processing, MDTA3 was used as the processing instrument. FAVIMAT, AFIS and
Cottonscope data of the raw and processed stages were taken into consideration during
the analysis. The statistical analysis of the FAVIMAT data revealed a significant impact
of processing on the elongation-at-break and work-to-break measurements while force-
to-break was not impacted. According to the results, the higher elongation fibers tend to
have lower propensity to break. Thus, they tend to survive better during processing
resulting in a significant increase in elongation-at-break in the processed samples. A
similar increase in work-to-break was observed for the processed samples, as it is a
combination of elongation-at-break and force-to-break. The higher elongation groups
demonstrated a greater difference between the raw and processed stages than the lower
elongation groups. Thus, the impact of processing was more prominently expressed in the
higher elongation groups. The higher elongation groups also displayed wider
distributions than the lower elongation groups.
The AFIS length distributions also revealed less fiber breakage in the higher elongation
groups. This suggests that breeding for improved elongations would give rise to better
length distributions. Since higher elongation fibers tend to have lower propensity to
break, these fibers would perform better in spinning and other textile processing steps.
For instance, as the higher elongation fibers result in less fiber breakage during spinning,
it would give rise to fewer yarn defects. Thus, higher elongations would eventually
improve the quality of the textile product. With the gradually increasing textile
processing speeds, the importance of elongation will be more significant.
Page 120
Texas Tech University, Ruvini Mathangadeera, December 2014
108
Therefore, it appears that fiber elongation is a vital tensile property in terms of fiber
processing. Moreover, the results suggest that the weaker fibers which possess higher
elongations also tend to perform better in processing. Thus, in terms of processing, fiber
elongation seems to be even more important than fiber strength.
The FAVIMAT results of the 32 samples also indicated a positive correlation between
individual fiber elongation and tenacity. This emphasizes the possibility of the
simultaneous improvement of both tensile properties. Thus, the mere presence of a
negative correlation between bundle elongation and tenacity should not hinder the
improvement of elongation. As a whole, the results convey that cotton fiber elongation
should no longer be neglected in the breeding programs.
Page 121
Texas Tech University, Ruvini Mathangadeera, December 2014
109
CHAPTER V
SUMMARY AND CONCLUSION
In order to meet the rapidly increasing demands of the textile industry, the improvement
of production rates is essential. The necessity of increased productivity has resulted in the
associated development of novel, high speed manufacturing technologies. These rapid
processing speeds greatly intensify the stresses applied on fibers, compromising the fiber
quality, which will consequently deteriorate the yarn and fabric quality. Thus, the
increasing trend of vigorous fiber processing, places an emphasis on breeding for fibers
that can endure harsh processing. In order to produce cotton which can better withstand
the processing stresses, it is necessary to identify the tensile properties which play a
significant role in cotton fiber processing.
Currently strength is considered as the predominant tensile property in terms of fiber
processing. Even though the importance of cotton fiber elongation has also been reported
over the years, breeding for improved elongations has generally been neglected. The
negative correlation between bundle tenacity and elongation has been a main reason for
the lack of interest in elongation, as it is assumed that breeding for improved elongations
might bring reduced strengths. Thus, to investigate this concept, the relationship between
tenacity and elongation of single fibers and fiber bundles was evaluated in the present
study. A positive correlation was observed between individual fiber strength and
elongation, while the two tensile properties were negatively correlated when measured on
fiber bundles. The positive correlation suggests that the stronger fibers tend to have
higher elongation. This implies the possibility of having both improved strengths and
Page 122
Texas Tech University, Ruvini Mathangadeera, December 2014
110
elongations simultaneously. Since stronger fibers are usually more mature, the results
also suggest that mature fibers tend to have higher elongation, which is contrary to the
present concept that mature fibers possess lower elongation.
The results also indicated a positive correlation between individual fiber elongation and
its standard deviation. As the standard deviation of individual fiber elongation increases
with elongation, this might be the reason behind the negative correlation between bundle
elongation and tenacity. Thus, the negative correlation observed with fiber bundles can be
attributed to the variation in individual fiber elongation of the constituent fibers.
Therefore, it is inaccurate to conclude that higher elongations will always result in lower
strengths.
To investigate the impact of processing on tensile properties, two different levels of
processing were studied; light processing and aggressive processing. Light processing
does not break enough fibers to see a significant impact of processing. But with harsh
processing higher elongation fibers tend to have a lower propensity to break. Therefore,
to ensure better survival of fibers during processing, emphasis should be placed on
improving both strength and elongation. Especially with the rapidly increasing processing
speeds, fiber elongation will increase in importance in the near future.
The better performance of higher elongation fibers suggested at the earlier stages of the
study was mechanically assessed, employing cotton samples which had a wide variation
in elongation while all other fiber properties were constant within a family. The results
clearly demonstrated that the higher elongation fibers can better withstand the processing
Page 123
Texas Tech University, Ruvini Mathangadeera, December 2014
111
stresses. The superior performance of higher elongation fibers was detected with the
tensile property measurements as well as with the length distributions. Therefore, if more
consideration is given to elongation in the breeding programs, it will give rise to less fiber
breakage and better length distributions. As a result, a better yarn evenness will be
achieved which will ultimately lead to a better fabric quality. Enhanced fabric quality will
bring about better revenue. Thus, for the advancement of the cotton industry, fiber
elongation should certainly be included in the breeding programs.
Page 124
Texas Tech University, Ruvini Mathangadeera, December 2014
112
REFERENCES
ASTM. (2012). D1445/ D1445M - 12 Standard Test Method for Breaking Strength and
Elongation of Cotton Fibers (Flat Bundle Method). Annual Book of ASTM
Standards. ASTM International, United States.
Backe, E. E. (1996). The Importance of Cotton Fiber Elongation on Yarn Quality and
Weaving Performance. In Proceedings of the 9th
Annual Engineered Fiber Selection
System Conference, Ed. C. Chewning. Raleigh, NC: Cotton Incorporated, pp. 1-13.
Bel, P. D., Columbus, E. P., Bragg, C. K., & Robert, K. Q. (1991). Effects of Mechanical
Cleaning on Cotton Fibers: Part I: Ginning. Textile Research Journal, 61 (2), 83-88.
Benzina, H., Hequet, E., Abidi, N., Gannaway, J., Drean, J.-Y., & Harzallah, O. (2007).
Using Fiber Elongation to Improve Genetic Screening in Cotton Breeding
Programs. Textile Research Journal, 77 (10), 770-778.
Cantu, J., Krifa, M., & Beruvides, M. (2007). Fiber neps generation in cotton processing.
Retrieved from http://www.icac.org/meetings/wcrc/wcrc4/presentations/
data/papers/Paper1864.pdf
Hosseinali, F. (2012). Investigation on the Tensile Properties of Individual Cotton
(Gossypium hirsutum L.) Fibers, Master’s thesis, Texas Tech University.
Coleman, B. D. (1958). On the Strength of Classical Fibres and Fibre Bundles. Journal of
the Mechanics and Physics of Solids, 7 (1), 60-70.
Collier, B. J., & Tortora, P. G. (2001). Understanding Textiles (p. 47-54). Prentice Hall,
Upper Saddle River, New Jersey.
Cui, X., Suh, M. W., & Sasser, P. E. (2003). Estimating Single Cotton Fiber Tensile
Properties from the Load-Elongation Curves of Slack Bundles. Textile Research
Journal, 73 (12), 1066-1070.
Dhavan, K., Bhatt, H. H., & Radhakrishnan, T. (1984). Estimation of Tensile Properties
of Single Cotton Fibers from Load-Elongation Curves of Bundles. Textile Research
Journal, 54 (8), 549-551.
Farag, R. & Elmogahzy, Y. (2009). Tensile Properties of Cotton Fibers. In Handbook of
tensile properties of textile and technical fibres, Ed. A. R. Bunsell. Cambridge, UK:
Woodhead Publishing, pp. 51-72.
Page 125
Texas Tech University, Ruvini Mathangadeera, December 2014
113
Fiori, L. A., Sands, J. E., Little, H. W., & Grant, J. N. (1956). Effect of Cotton Fiber
Bundle Break Elongation and Other Fiber Properties on the Properties of a Coarse
and a Medium Singles Yarn. Textile Research Journal, 26 (7), 553-564.
Frydrych, I. (1995). Relation of Single Fiber and Bundle Strengths of Cotton. Textile
Research Journal, 65 (9), 513-521.
Fryer, L. F., Rust, J. P., & Lord, P. R. (1996). Effects of Cotton Fiber Blending and
Processing on HVI Measurements- Part I. Textile Research Journal, 66 (6), 349-
357.
Grant, J. N., Morlier, O. W., & Scott, J. M. (1952). Effects of Mechanical Processing of
Cotton on the Physical Properties of Fibers. Textile Research Journal, 22 (10), 682-
687.
Green, C. C. & Culp, T. W. (1990). Simultaneous Improvement of Yield, Fiber Quality,
and Yarn Strength in Upland Cotton. Crop Science, 30, 66-69.
Hertel, K. L. & Craven, C. J. (1956). Cotton Fiber Bundle Elongation and Tenacity as
Related to Some Fiber and Yarn Properties. Textile Research Journal, 26 (6), 479-
484.
Hequet, E. F., Wyatt, B., Abidi, N., & Thibodeaux, D. P. (2006). Creation of a Set of
Reference Material for Cotton Fiber Maturity Measurements. Textile Research
Journal, 76 (7), 576-586.
Hindeleh, A. M. (1980). Crystallinity, Crystallite Size, and Physical Properties of Native
Egyptian Cotton. Textile Research Journal, 50 (11), 667-673.
Hsieh,Y. -L. (1999). Structural Development of Cotton Fibers and Linkages to Fiber
Quality. In Cotton Fibers: Developmental Biology, Quality Improvement, and
Textile Processing, Ed. Amarjit S. Basra. The Haworth Press, Inc., Binghamton,
NY, pp. 137-162.
Hsieh, Y. -L., Hu, X. -P., & Nguyen, A. (1997). Strength and Crystalline Structure of
Developing Acala Cotton. Textile Research Journal, 67 (7), 529-536.
Hu, X. -P., & Hsieh, Y. -L. (1997). Breaking Elongation Distributions of Single Fibers.
Journal of Materials Science, 32, 3905-3912.
Koo, H. -J., & Suh, M. W. (1999). Maximizing Yarn and Fabric Strength through
Variance of HVI Elongation. Textile Research Journal, 69 (6), 447-456.
Page 126
Texas Tech University, Ruvini Mathangadeera, December 2014
114
Krifa, M. (2006). Fiber Length Distribution in Cotton Processing: Dominant Features and
Interaction Effects. Textile Research Journal, 76 (5), 426-435.
Liu, Y., Thibodeaux, D., Gamble, G., & Rodgers, J. (2014). Preliminary Study of relating
cotton fiber tenacity and elongation with crystallinity. Textile Research Journal,
DOI: 10.1177/0040517513509871.
Louis, G. L., Fiori, L. A., & Sands, J. E. (1961). Blending Cottons Differing in Fiber
Bundle Break Elongation: Part I: Effect on the Properties of Combed Single Yarns.
Textile Research Journal, 31 (1), 43-50.
Louis, G. L., Fiori, L. A., & Sands, J. E. (1961). Blending Cottons Differing in Fiber
Bundle Break Elongation: Part II: Effect on Properties of a Combed Broadcloth.
Textile Research Journal, 31 (5), 478-483.
May, O. L., & Taylor, R. A. (1998). Breeding Cottons with Higher Yarn Tenacity. Textile
Research Journal, 68 (4), 302-307.
Meredith, W. R. Jr., Culp, T. W., Robert K. Q., Ruppenicker, G. F., Anthony, W. S. &
Williford, J. R. (1991). Determining Future Cotton Variety Fiber Quality
Objectives. Textile Research Journal, 61 (12), 715-720.
Mogahzy, Y. E. & Chewning, C. H. (2001). Cotton Fiber To Yarn Manufacturing
Technology. Cotton Incorporated, Cary, NC.
Morton, W. E., & Hearle, J. W. S. (1993). Physical Properties of Textile Fibres (p.265).
The Textile Institute, Manchester.
Nachane, R. P., & Krishna Iyer, K. R. (1980). Prediction of Bundle Strength from Single
Fiber Test Data. Textile Research Journal, 50 (10), 639-641.
Ng, E. -H., Smith, C. W., Hequet, E., Hague, S., & Dever, J. (2014). Diallel Analysis of
Fiber Quality Traits with an Emphasis on Elongation in Upland Cotton. Crop
Science, 54, 514-519.
Orr, R. S., Weiss, L. C., & Grant, J. N. (1955). The Relation of Single-Fiber to Flat-
Bundle Strength and Elongation of Cotton. Textile Research Journal, 25 (11), 939-
946.
Parker, J. S. (1963). Cotton Fiber Elongation- Its Effects on Spinning Performance and
Yarn Quality: Part 1. Plains Cotton Growers, Inc., Lubbock, Texas.
Page 127
Texas Tech University, Ruvini Mathangadeera, December 2014
115
Rebenfeld, L. (1957). The Effect of Processing on Cotton Fiber Properties. Textile
Research Journal, 27 (6), 473-479.
Rebenfeld, L. (1958). Transmission of Cotton Fiber Strength and Extensibility 1.2.
Textile Research Journal, 28 (7), 585-592.
Salhotra, K. R., & Chattopadhyay, R. (1984). Loss in Fiber Tenacity during Separation in
Rotor Spinning. Textile Research Journal, 54 (3), 194-197.
Sasser, P. E., Shofner, F. M., Chu, Y. T., Shofner, C. K., & Townes, M. G. (1991).
Interpretations of Single Fiber, Bundle, and Yarn Tenacity Data. Textile Research
Journal, 61 (11), 681-690.
Scholl, R. A., & Miller, P.A. (1976). Genetic Association between Yield and Fiber
Strength in Upland Cotton. Crop Science, 16, 780-783.
Shofner, F. M., Lalor, W. F., & Hanley, J. H. (1983). A New Method for Microdust and
Trash Measurement in Bale or Processed Fiber. Textile Research Journal, 53 (2),
78-89.
Shofner, F. M., & Williams, G. F. (1986). Evolution of the Microdust and Trash Monitor
for Cotton Classification. Textile Research Journal, 56 (2), 150-156.
Sui, R., Thomasson, J. A., Byler, R. K., Boykin, J. C., & Barnes, E. M. (2010). Effect of
Mechanical Actions on Cotton Fiber Quality and Foreign-Matter Particle
Attachment to Cotton Fibers. In Proc. Beltwide Cotton Conferences. pp. 586-595.
New Orleans, Louisiana.
Taylor, R. A. (1982). Measurement of Cotton Fiber Tenacity on 1/8 Gauge HVI Tapered
Bundles. Journal of Engineering for Industry, 104, 169-174.
Timpa, J. D., & Ramey, H. H., JR (1994). Relationship Between Cotton Fiber Strength
and Cellulose Molecular Weight Distribution: HVI Calibration Standards. Textile
Research Journal, 64 (10), 557-562.
Warrier, J. K. S. & Munshi, V. G. (1982). Relationship between Strength-Elongation
Characteristics of Single Fibres and Fibre Bundles of Cotton. Indian Journal of
Textile Research, 7, 42-44.
Waters, W.T., Phillips, J., & Fiori, L.A. (1966). The Effect of Fiber-Bundle Elongation of
Medium Staple Cottons on Processing Performance and Yarn Properties. Textile
Research Journal, 36 (11), 1004-1012.