131
Copyright by Bo Wang 2011

Copyright
by
Bo Wang
2011

The Dissertation Committee for Bo Wang Certifies that this is the approved version
of the following dissertation:
Characterization of atherosclerotic plaques using ultrasound guided
intravascular photoacoustic imaging
Committee:
Stanislav Emelianov, Supervisor
Konstantin Sokolov
Richard Smalling
Silvio Litovsky
Andrew Dunn
Salavat Aglyamov

Characterization of atherosclerotic plaques using ultrasound guided
intravascular photoacoustic imaging
by
Bo Wang, B.S.; M.S.
Dissertation
Presented to the Faculty of the Graduate School of
The University of Texas at Austin
in Partial Fulfillment
of the Requirements
for the Degree of
Doctor of Philosophy
The University of Texas at Austin
May 2011

Dedication
To my parents and dear Chen-Guan.
For their love and support.

v
Acknowledgements
Looking back my Ph.D. study at UT-Austin, I am always amazed by how lucky I
was to have such great opportunity to have a research project that I love, an environment
that always gave me full support, and the greatest mentors I could ever imagine of. I
would like to thank my advisor Professor Stanislav Emelianov, for letting me joining his
lab and introducing me to intravascular photoacoustic imaging. It is his understanding,
unconditional support, and tolerance of my mistakes and disagreement that helped me
survived the Ph.D. journey. I would like to thank my committee members Dr. Konstantin
Sokolov, Dr. Richard Smalling, Dr. Silvio Litovsky, Dr. Andrew Dunn, and Dr. Salavat
Aglyamov for their guidance and acknowledgement of the value of my work. Dr.
Wolfgang Frey and Dr. Salavat Aglyamov gave me many valuable suggestions and
comments about this dissertation.
I would not be able to come this far without knowledge and experiences passed on
to me from senior lab members: Dr. Shriram Sethuraman – solid foundation for IVPA,
Dr. Srivalleesha Mallidi – PA and spectroscopic analysis, Dr. Andrei Karpiouk – lasers
and tricks for building stuffs, Dr. Suhyun Park – intravascular beam forming, Evgeniya
Yantsen – cell culture and biology. I was deeply touched by the devotion and passion for
research from James Amerian, my wonderful collaborator in Dr. Smalling’s research
team at Houston Health Science Center. I also received great help from fellow graduate
students from collaborating labs: Justina Tam helped me figure out the best way to
process tissue samples for ICP-MS; Evgeniya Yantsen was always cheerful and willing to
explore new territory with me; Pratixa Joshi helped me making nanoparticles; Dr. Haley
Finley-Jones and Isaac Arnquist from Dr. Holcomb’s lab in the Department of Chemistry
and Biochemistry helped me run ICP-MS. I would like to thank my lab members Dr.

vi
Carolyn Bayer, Dr. Iulia Graf, Dr. Kimberly Homan, Seungsoo Kim, Mohammad
Mehrmohammadi, Yun-Sheng Chen, Jason Cook, Jimmy Su, Seung-Yun Nam, Min Qu,
Soon Joon Yoon, Sangpil Yoon, Katie Wilson, Geoff Luke, Alex Hannah who are always
there whenever I needed help. I also would like to acknowledge the help from
undergraduate research assistants Rick Sweat and Tom Isaac, who prepared nanoparticles
for animal studies. Administrative assistant Tera Sherrard, and lab managers Christopher
Green and Katherine Bontrager were of great help for me with purchasing, scheduling,
and grammar check of documents. It was my honor to have been worked with these
excellent lab members as well as collaborators.
I would like to thank my parents who raised me and gave me the best of
everything that they can provide; and dear Chen-Guan, for the understanding and support
in the past four years.

vii
Characterization of atherosclerotic plaques using ultrasound guided
intravascular photoacoustic imaging
Publication No._____________
Bo Wang, Ph.D.
The University of Texas at Austin, 2011
Supervisor: Stanislav Emelianov
Rupture of atherosclerotic plaque is closely related to plaque composition.
Currently, plaque composition cannot be clinically characterized by any imaging
modality. The objective of this dissertation is to use a recently developed imaging
modality – ultrasound-guided intravascular photoacoustic (IVPA) imaging – to detect the
distribution of two critical components in atherosclerotic plaques: lipid and
phagocytically active macrophages. Under the guidance of intravascular ultrasound
imaging, spectroscopic IVPA imaging is capable of detecting the spatially resolving
optical absorption property inside a vessel wall. In this study, contrast in spectroscopic
IVPA imaging was provided by either the endogenous optical property of lipid or
optically absorbing contrast agent such as gold nanoparticles (Au NPs). Using a rabbit
model of atherosclerosis, this dissertation demonstrated that ultrasound guided
spectroscopic IVPA imaging could simultaneously image lipid deposits as well as
macrophages labeled in vivo with Au NPs. Information of macrophage activity around
lipid rich plaques may help to identify rupture-prone or vulnerable plaques. The results

viii
show that ultrasound guided IVPA imaging is promising for detecting plaque
composition in vivo. Clinical use of ultrasound guided IVPA imaging may significantly
improve the accuracy of diagnosis and lead to more effective treatments of
atherosclerosis.

ix
Table of Contents
List of Tables ........................................................................................................ xii
List of Figures ...................................................................................................... xiii
Chapter 1: Introduction .........................................................................................1
1.1 Motivation .................................................................................................1
1.2 Atherosclerosis and vulnerable plaques ....................................................3
1.3 Imaging of atherosclerosis ........................................................................6
1.3.1 Noninvasive imaging modalities...................................................6
1.3.2 Invasive imaging modalities .........................................................7
1.4 Ultrasound guided intravascular photoacoustic imaging ........................11
1.5 Animal models of atherosclerosis ...........................................................17
1.6 Organization of the dissertation ..............................................................19
1.6 References ...............................................................................................20
Chapter 2: Spectroscopic IVPA imaging of lipid deposits ....................................26
2.1 Introduction .............................................................................................26
2.2 Methods...................................................................................................27
2.2.1 Animal model..............................................................................27
2.2.1 Imaging system ...........................................................................27
2.2.2 Spectroscopic IVPA signal processing ................................................28
2.2.2.1 Spectroscopic analysis methods for photoacoustic imaging ....28
2.2.2.2 Slope based algorithm for spectroscopic analysis ...................30
2.2.2.3 Effect of wavelength dependent tissue property on spectroscopic
analysis ........................................................................................32
2.3 Spectroscopic IVPA imaging of lipid in a rabbit model of atherosclerosis35
2.4 Discussion and conclusion ......................................................................39
2.5 References ...............................................................................................42
Chapter 3: Plasmonic gold nanoparticles (Au NPs) as contrast agent for IVPA
imaging of phagocytically active macrophages ............................................45
3.1 Introduction .............................................................................................45

x
3.2 Au NPs as a contrast agent for photoacoustic imaging ...........................45
3.3 Imaging phagocytically active macrophages using Au NPs ...................47
3.3.1 Imaging system ...........................................................................47
3.3.2 In vitro cell experiment ...............................................................48
3.3.2.1 Plasmon resonance coupling of Au NPs in macrophages48
3.3.2.2 IVUS/IVPA imaging of cell phantom.............................50
3.3.3 Experiment using ex vivo tissue injected with Au NP-labeled
macrophages ...............................................................................55
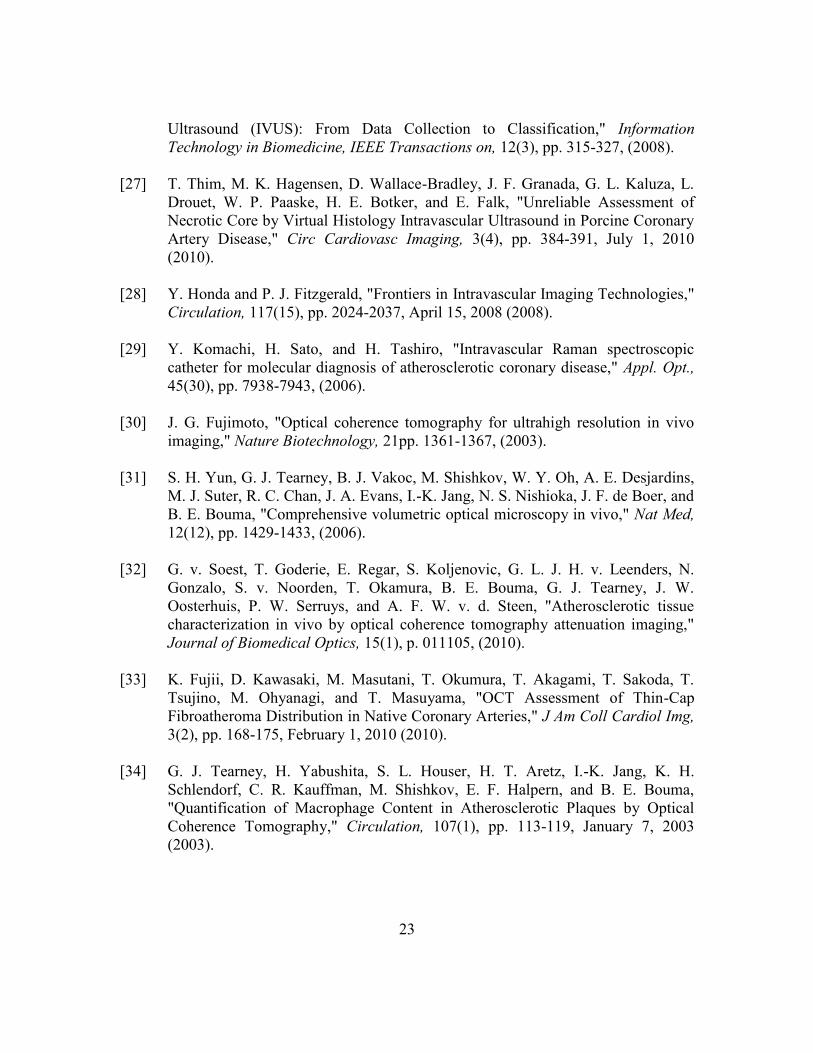
3.4 Sensitivity of IVPA imaging to detect Au NP-labeled macrophages .....57
3.5 Viability of Au NP-labeled cells exposed to pulsed laser radiation .......59
3.6 Conclusion ..............................................................................................61
3.6 References ...............................................................................................61
Chapter 4: Detection of phagocytically active macrophages in a rabbit model of
atherosclerosis ...............................................................................................64
4.1 Methods...................................................................................................64
4.1.1 Imaging system ...........................................................................64
4.1.2 Synthesis and characterization of Au NPs ..................................68
4.1.3 Animal protocol ..........................................................................69
4.1.4 Isolation of mononuclear cells from whole blood ......................70
4.1.5 Analysis of gold concentration in tissue samples .......................70
4.2 Image processing ....................................................................................70
4.3 Results .....................................................................................................72
4.3.1 Imaging the distribution of phagocytically active macrophages in
atherosclerotic rabbit aortas ........................................................72
4.3.2 Imaging deposits of lipid in atherosclerotic rabbit aorta ............75
4.3.3 Simultaneous imaging of lipid deposits and phagocytically active
macrophages ...............................................................................77
4.4 Discussion ...............................................................................................79
4.4.1 Delivery pathways of Au NPs to phagocytically active macrophages
.....................................................................................................79
4.4.2 Size and shape dependent delivery of Au NPs ...........................80

xi
4.5 Conclusion ..............................................................................................83
4.6 References ...............................................................................................83
Chapter 5: Conclusion and future work .................................................................85
5.1 Summary of research ..............................................................................85
5.2 Limitations ..............................................................................................87
5.2.1 Animal model of atherosclerosis ................................................87
5.2.2 Ex vivo imaging of atherosclerotic plaques ................................87
5.2.3 Imaging speed .............................................................................88
5.3 Future directions .....................................................................................89
5.3.1 Detecting lipids using thermal IVPA imaging ............................89
5.3.2 Imaging lipid in vivo at 1720 nm wavelength .............................93
5.3.3 Designing integrated catheter for combined IVPA/IVUS imaging in
vivo ..............................................................................................95
5.3.4 Accurately detecting of vessel lumen borders ............................96
5.3.5 Imaging thrombus and vasa vasorum .........................................98
5.3.6 Engineering contrast agents for high sensitivity and specificity IVPA
imaging .......................................................................................98
5.3.7 Delivering contrast agents ...........................................................99
5.4 Conclusion ............................................................................................100
5.5 References .............................................................................................101
Bibliography ........................................................................................................104

xii
List of Tables
Table 3.1: Concentration of macrophages and Au NPs in arterial phantoms. ...57
Table 4.1: Au NPs injected in two balloon injured rabbits. ...............................80

xiii
List of Figures
Figure 1.1: (a) Vulnerable plaques in an artery. (b) Insufficient coverage of plaque
by a stent may lead to plaque rupture. (c) Accurate detection of
vulnerable plaques may provide better lesion coverage. ....................2
Figure 1.2: Different types of vulnerable plaques. (Adapted from Naghavi et. al.
(2003) [5]) ...........................................................................................4
Figure 1.3: Development of atherosclerotic lesion. Various biomarkers present at
different stages of the lesion. (Adapted from Sanz and Fayad (2008)
[12]).....................................................................................................5
Figure 1.4: A typical IVUS image processing procedure. Panel (a) is the flowchart
for processing IVUS images. Digitized radio frequency signal (b) is first
band-pass filtered (c). Then, filtered signal goes through envelope
detection (d), and is scan converted (e) to form an IVUS image
demonstrating a cross-section of a vessel. ..........................................8
Figure 1.5: IVUS images of healthy (a,b), and diseased (c-e) vessels. Panel (b) is
the zoomed-in image of panel (a). Panels (c-e) show images of vessels
containing soft (lipid-laden) plaques, mixed (fibrous and calcified)
plaques, and calcified plaques, respectively. (Adapted from Nissen and
Yock (2002) [21] ) ............................................................................10
Figure 1. 6: Theoretical acoustic pressure generated using a long laser pulse (a) and
an ultra-short laser pulse (b) from a spherical inclusion embedded in an
acoustically matched background. Pressure was received at a distance r,
equal to two times the inclusion radius a. (Adapted from Sun and
Gerstman (1999) [40]). .....................................................................13

xiv
Figure 1.7: Realization of combined IVPA and IVUS imaging using an integrated
IVPA/IVUS imaging catheter. (a) Longitudinal view of integrated
catheter inside the vessel lumen. Combined IVPA and IVUS imaging
can be performed in the overlapped region of the optical (red) and
acoustic beam (gray). (b) Cross-sectional view of the catheter and
vessel. ................................................................................................16
Figure 1.8: Optical absorption property of tissues in the vessel [48-49].............16
Figure 1.9: (a) IVPA, (b) IVUS, and (c) combined IVUS/IVPA 3D images of a
tissue mimicking phantom with an optically absorbing inclusion. ...17
Figure 2.1: Laboratory prototype of IVUS-guided multi-wavelength IVPA imaging
system. ..............................................................................................28
Figure 2.2: Image processing algorithm for analyzing multi-wavelength IVPA and
IVUS data..........................................................................................31
Figure 2.3: Wavelength dependent optical absorption and scattering parameters used
in the Monte Carlo simulation. .........................................................33
Figure 2.4: (a) Tissue structure used in Monte Carlo simulation to simulate the ex
vivo imaging experiment. (b) Absorbed laser energy at various depths of
the lipid layer. (c) Normalized laser energy absorption at various depths
of the lipid layer. ...............................................................................34
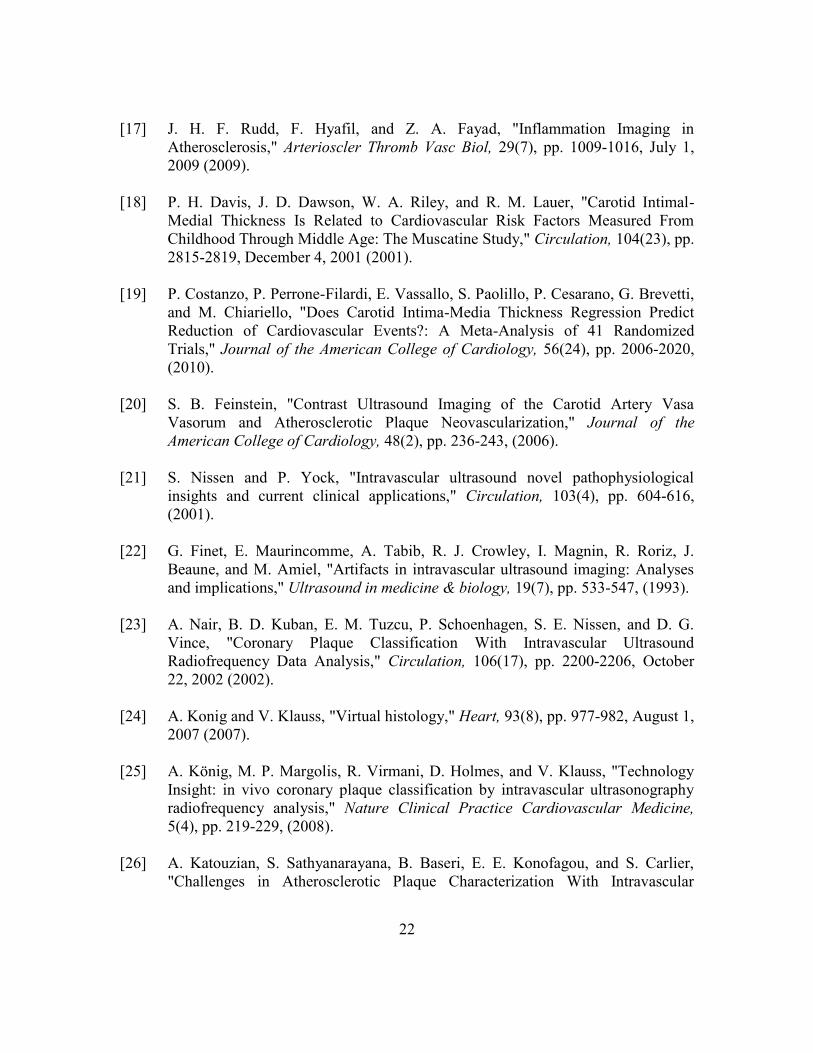
Figure 2.5: (a) Tissue structure used in Monte Carlo simulation to simulate in vivo
IVPA imaging. (b) Absorbed laser energy at various depths of the lipid
layer. (c) Normalized laser energy absorption at various depths of the
lipid layer. .........................................................................................35

xv
Figure 2.6: Cross-sectional (a,d) IVUS, (b,e) 1200-nm IVPA, and (c,f) combined
IVUS/IVPA images of the diseased and normal aorta. The IVUS and
IVPA images are displayed using a 40 dB dynamic range. ..............36
Figure 2.7: Cross-sectional IVPA images of (a) diseased and (b) normal aortas
obtained using 1200 nm wavelength. (c) Comparison of the wavelength-
dependent photoacoustic responses from the lipid-rich area of the
atherosclerotic plaque (region 1) and media-adventitial layer of diseased
(region 2) and normal (region 3) aortas. ...........................................37
Figure 2.8: Combined IVUS and spectroscopic IVPA images and corresponding
histological slices of the diseased atherosclerotic aorta (a-c) and normal
(i.e., control) aorta (d-e). Lipid-rich regions (orange color) were
identified from multi-wavelength photoacoustic imaging and displayed
over the IVUS images. Lipid-rich regions were detected in the thickened
intima layer of the diseased aorta (a) confirmed by Oil red O stain for
lipid (b) and H&E stain (c). In contrast, spectroscopic IVPA imaging (d)
and tissue histology (e and f) show insignificant lipid-rich regions in
normal rabbit aorta. Both normal and diseased aortas show some
insignificant deposits of lipid in the periadventitia. ..........................38
Figure 3.1: Intravascular photoacoustic (IVPA) and intravascular ultrasound (IVUS)
imaging system setup. .......................................................................48
Figure 3.2: (a) STEM image of Au NPs. (b) Darkfield reflectance images of murine
macrophages. (c) Murine macrophages loaded with Au NPs. The
darkfield optical images (b,c) were obtained using Xe illumination and a
20x darkfield objective (0.5 NA). .....................................................49

xvi
Figure 3.3: Normalized extinction spectra of Au NPs (dashed line) and macrophages
loaded with Au NPs (solid line). Both absorption spectra were
normalized with their corresponding maxima. .................................50
Figure 3.4: (a) Vessel mimicking phantom with four compartments. Different
compartment were injected with cells suspended in gelatin or gelatin
alone. (b) Cross-sectional view of the phantom................................51
Figure 3.5: The structure (a) and the IVUS image (d) of the tissue mimicking
phantom. The IVPA images of the same cross-section of the phantom
were taken at 532 nm wavelength (b) and 680 nm wavelength (e). The
combined IVUS and IVPA images of the phantom (c: 532 nm
wavelength and f: 680 nm wavelength) indicated the origin of the
photoacoustic responses in IVPA images. ........................................53
Figure 3.6: Strength of the photoacoustic signal at different wavelength measured
from the small regions containing macrophages loaded with Au NPs,
gelatin gel and PVA. Each spectrum is normalized to the maximum
signal strength from Au NPs loaded macrophages at 680 nm wavelength.
...........................................................................................................54

xvii
Figure 3.7: IVUS, IVPA and combined IVUS/IVPA images of a diseased rabbit
aorta injected with macrophages loaded with Au NPs. The IVUS image
(panel (a)) is displayed using a 50 dB dynamic range. The injected
macrophages in the outer and inner regions of the aorta are denoted in
the images (a, b, e) with green arrows. The normalized IVPA images
(panels (b)-(d)) and combined IVUS/IVPA images (panels (e)-(g))
obtained using 700 nm, 750 nm and 800 nm wavelengths are displayed
using 20 dB display dynamic range. The IVPA and combined
IVUS/IVPA images taken at 700 nm wavelength (panels (b) and (e))
showed high photoacoustic signals at the injected regions denoted by
arrows. ...............................................................................................56
Figure 3.8: IVUS images (a,d), IVPA images (b,e) and combined IVPA/IVUS
images (c,f) of the vessel phantoms with plaque mimicking
compartments. IVUS images are displayed using a 40 dB dynamic
range. IVPA images, obtained using 680 nm wavelength, are displayed
using a 20 dB dynamic range. ...........................................................59
Figure 3.9: Viability of macrophages loaded with NPs and irradiated with 50 pulses
at 680 nm wavelength: a) cells remain viable after irradiation at laser
fluencies reaching 114 mJ/cm2, b) cell death was observed for 344
mJ/cm2 laser fluence. To cover the extent of the laser beam, the image
in Figure 3.9(b) was assembled from several optical images due to the
limited field of view of the optical microscope. ...............................60
Figure 4.1: Setup for the bench-top combined IVUS/IVPA imaging system. ....65
Figure 4.2: User interface of the combined IVUS/IVPA imaging system. .........66
Figure 4.3: Flow chart for spectroscopic IVUS/IVPA data acquisition. .............67

xviii
Figure 4.4: User interface of a custom developed program to control laser systems.
...........................................................................................................68
Figure 4.5: STEM image of Au NPs. ..................................................................69
Figure 4.6: Imaging processing algorithm for spectroscopic IVPA and IVUS
images. ..............................................................................................70
Figure 4.7: (a) Gold concentration in the blood after 20 nm diameter spherical
PEGylated Au NPs were intravenously injected into the rabbit. The
dashed line is an exponential fit. (b) The spectroscopic photoacoustic
response was different for regions containing Au NP-labeled
macrophages and the region containing blood. (c,f), Combined
spectroscopic IVPA and IVUS images (scale bar 0.5 mm) demonstrated
the location of Au NP-labeled macrophages in the atherosclerotic
plaques. Spectroscopic IVPA images of Au NP-labeled macrophages
were color coded in green, while IVUS images were shown in gray
scale. Corresponding histochemistry stains were shown to the right of
each image. (d,g), Silver stain for nanoparticles. (e,h), RAM11 stain for
macrophages. ....................................................................................74
Figure 4.8: Distribution of Au NPs within the vessel wall. Au NPs are present in or
around the vasa vasorum embedded in the adventitia. .....................75

xix
Figure 4.9: IVPA imaging of lipid. (a) Normalized spectroscopic photoacoustic
signal amplitude from different regions of the vessel wall. For the lipid-
rich region, the signal decreased with increased wavelength, while the
normal vessel had a relatively flat spectroscopic response. (b,d)
Combined spectroscopic IVPA and IVUS images of one cross-section of
the vessel wall. Spectroscopic IVPA images of lipid deposits were color
coded in red, while IVUS images were displayed in gray scale. Scale
bars are 0.5 mm. (c,e) Corresponding Oil red O stain for lipid. .......76
Figure 4.10: An artifact in spectroscopic IVPA imaging of lipid deposits. (a)
Combined spectroscopic IVPA image of lipid. Because of the
misalignment between the laser beam and the IVUS transducer, no lipid
shows up to the right of the aorta sample. (b) Oil Red O stain of the
adjacent cross-section showed a circumferential lipid-rich intimal layer.
...........................................................................................................77
Figure 4.11: 3D IVPA simultaneous imaging of macrophages and lipid. (a,b) Cross-
sectional view of IVUS/spectroscopic IVPA images revealing both Au
NP-labeled macrophages (green) and lipid (red) in atherosclerotic
plaques. (c-h), Reconstructed 3D images showing the distribution of Au
NP loaded macrophages (b,f), lipid (c,g) and macrophages and lipid
together (d,h). The yellow regions in figures (d,h) resulted from the
overlay of green (macrophages) and red (lipid). ...............................78
Figure 4.12: Dark-field image of mononuclear cells separated from a rabbit blood
sample 6 hours after contrast agent administration. Some of the cells
were labeled by Au NPs (arrows). ....................................................79

xx
Figure 4.13: Gold concentration in rabbits injected with 20 nm (Rabbit 1) and 50 nm
(Rabbit 2) spherical PEGylated Au NPs. ..........................................81
Figure 4.14: Bio-distribution of gold in rabbits injected with 20 nm (a) and 50 nm (b)
spherical PEGylated Au NPs. ...........................................................82
Figure 5.1: (a) Oil red O stain for lipid, and (b) H&E stain were performed in tissue
slices adjacent to the imaged cross-section. (c) IVUS image of the aorta.
(d) Combined IVUS and IVPA image acquired at 25 oC. (e)
Temperature dependent photoacoustic responses from plaques and
vessel wall. ........................................................................................91
Figure 5.2: Image processing algorithm to generate combined IVUS and lipid image
of the aorta. .......................................................................................92
Figure 5.3: (a) Lipid image generated by temperature dependent IVPA imaging
overlaid onto IVUS image to demonstrate the distribution of lipid in an
atherosclerotic rabbit aorta. (b) Spectroscopic IVPA image of lipid at the
same cross-section of the aorta. ........................................................93
Figure 5.4: (a-c) IVUS, IVPA, and combined IVPA/IVUS images taken at 1210 nm
wavelength. (d-f) IVUS, IVPA, and combined IVPA/IVUS images taken
at 1720 nm wavelength. The IVUS and IVPA images are shown at a
35 dB dynamic range. .......................................................................94
Figure 5.5: (a) Photo of the distal end of the integrated catheter. (b) Tissue
mimicking phantom with three optical absorbing inclusions. (c) IVUS
image of the phantom. (d) IVPA image of the phantom. (e) Combined
IVPA/IVUS image of the phantom. ..................................................96

xxi
Figure 5.6: IVUS (a), IVPA (b), and combined IVUS/IVPA (c) images of an
atherosclerotic rabbit aorta acquired at 900 nm wavelength using an
integrated IVUS/IVPA imaging catheter. The aorta was embedded inside
30% whole blood. .............................................................................97

1
Chapter 1: Introduction
1.1 MOTIVATION
Coronary atherosclerosis is the cause of the majority of ischemic heart disease.
Disruption of vulnerable plaques in the coronary arterial wall leads to acute coronary
syndromes such as myocardial infarction [1-3]. Clinically available intravascular imaging
modalities are capable of imaging the degree of stenosis. However, because the
vulnerability of plaques is strongly related to plaque composition, information on the
distribution of plaques and the degree of stenosis is not sufficient for effective treatment
of the disease. For example, angiography and IVUS guided stent placement based on the
degree of stenosis may lead to insufficient coverage of the lesion, and vulnerable plaques
without proper stent coverage may rupture (Figure 1.1). Carotid atherosclerosis treatment
also requires plaque vulnerability assessment to choose proper treatment strategy: carotid
angioplasty and stenting or carotid endarterectomy [4]. Therefore, clinical practice
requires real time high resolution imaging of plaque composition.
Atherosclerosis is driven by complex systemic interactions at the molecular and
cellular level. Information such as how the monocytes migrate into the plaques or when
and how the neovasculatures progress in the plaques are critical for understanding the
pathology as well as disease management. Though histopathological analysis can point
out the distribution of molecular or cellular components inside plaques, it does not allow
longitudinal tracking the biomarkers.
The use of nanotechnology in cardiovascular imaging can be a breakthrough in
the molecular imaging of atherosclerosis. Because atherosclerotic vessels have a leaky
endothelium, the nanometer size of particles presented a unique opportunity to analyze
the permeability of endothelium in vivo. Nanoparticles can also be engineered to target

2
disease related molecules or cells to enable molecular/cellular imaging. In order to
observe the distribution of nanoparticles, high sensitivity and resolution imaging
modalities are required.
Figure 1.1: (a) Vulnerable plaques in an artery. (b) Insufficient coverage of plaque by a
stent may lead to plaque rupture. (c) Accurate detection of vulnerable
plaques may provide better lesion coverage.
In this work, ultrasound guided intravascular photoacoustic (IVPA) imaging was
developed to meet the clinical and fundamental research needs for diagnosis and
treatment of atherosclerosis. Ultrasound guided IVPA imaging can image tissue
composition inside the atherosclerotic plaques as well as detect cells enhanced by
IVPA /IVUS guided
Large necrotic core
Angiography or IVUS-guided stent deployment
IVPA/IVUS-guided stent deployment
(a)
(b)
(c)

3
contrast agents. The real-time, high resolution combined IVPA/IVUS images would
improve the management of atherosclerosis.
1.2 ATHEROSCLEROSIS AND VULNERABLE PLAQUES
Atherosclerosis, literally meaning hardening of the artery, is characterized by the
build-up of plaques in the vessel wall. It is the cause of the majority of cardiovascular
events [2]. Atherosclerotic plaques take decades to build up in human vessels, and
generally have a systemic distribution in a number of different types of arteries [2].
Plaques located in specific locations such as the aortic arch, carotid bulb and coronary
arteries are more critical, because these arteries transport blood to the brain or
myocardium. Plaques may cause stenosis, the narrowing of the vessel lumen, thus
obstructing the blood flow. Although vessels may adapt to stenosis through positive
vessel remodeling by increasing the overall vessel diameter, sometimes such local
adjustment is not enough to relieve the stenosis. Severe stenosis formed in the coronary
arteries may cause life-threatening myocardial infarction.
Unstable plaques will eventually rupture due to high shear stress and release their
internal contents into the blood stream. Rupture sites in the coronary arteries may form
thrombus, and have a high likelihood to cause acute coronary syndromes [1]. Meanwhile,
plaque fragments from ruptured plaque may block small diameter arteries downstream
(e.g. cerebrovascular system) causing stroke.
Vulnerable plaques are thrombosis-prone plaques and plaques with a high
probability of undergoing rapid progression [5]. Through histochemistry staining of the
autopsy samples, we learned that atherosclerotic plaques may consist of many
components including lipids, fibrous tissue, calcifications, erythrocytes, macrophages,

4
platelets, etc. [3, 5-6]. It has been acknowledged that vulnerability of plaques was less
related to the degree of stenosis, but more determined by the composition of the plaques
[1] (Figure 1.2). For example, a soft lipid-rich plaque covered with a thin fibrous cap is
more prone to rupture and more vulnerable than a fibrous plaque with a relatively high
degree of stenosis [1, 7].
Figure 1.2: Different types of vulnerable plaques. (Adapted from Naghavi et. al. (2003)
[5])
Microscopically, complex interactions at the molecular and cellular level drive the
development of atherosclerosis (Figure 1.3). The atherosclerotic lesion in the arterial wall
may be triggered by the high cholesterol level in the blood stream, or the chemical or
mechanical damage of the endothelium [8]. In the very early stage of the lesion, low
density lipoprotein (LDL) particles enter the vessel wall from circulating blood through
dysfunctional or leaky endothelium. Meanwhile, the endothelium is over expressing
adhesion molecules. As a result, monocytes are recruited into the vessel wall and evolve
into macrophages. Phagocytically active macrophages internalize modified LDL particles
and become foam cells. The apoptosis or necrosis of foam cells forms soft lipid cores in
plaques [9]. As a self stabilizing process, the number of smooth muscle cells increases

5
inside the plaque, and a fibrous cap is formed covering lipid cores. Lipid fed
macrophages degrade the extra-cellular matrix by secreting matrix metalloproteinase
(MMPs), causing the plaques to be unstable. Advanced plaques also show high density of
neo-vasculature (vasa vasorum) [10-11] expressing αvβ3-integrin [12]. Imaging specific
biomarkers that are critical for the development of the disease can help the understanding
of the pathogenesis of the disease, locate the vulnerable plaques, and reveal the stage of
the disease. In order to enhance the contrast for the biomarkers, in most cases, a contrast
agent must be introduced.
Figure 1.3: Development of atherosclerotic lesion. Various biomarkers present at
different stages of the lesion. (Adapted from Sanz and Fayad (2008) [12]).

6
1.3 IMAGING OF ATHEROSCLEROSIS
Non-invasive imaging modalities such as magnetic resonance imaging (MRI),
computed tomography (CT), and ultrasound are generally used for screening purpose:
identify the population that is at high risk for cardiovascular or cerebrovascular events.
Catheter based intravascular imaging modalities are used in catheterization labs to guide
the interventional procedures.
1.3.1 Noninvasive imaging modalities
MRI and CT have the advantage of whole body imaging. Based on the intrinsic
differences in the relaxation property of tissues, multicontrast MRI imaging can
differentiate among lipid core, fibrous matrix, hemorrhage/thrombus, and calcification
[13]. The major challenge for MRI imaging of plaques is its limited spatial resolution
especially when imaging arteries located deep inside the body (e.g. coronary arteries)
[14]. MRI also suffers from motion artifacts caused by body movement. CT is sensitive
to calcifications in the plaque. The calcium score that is calculated from CT images may
be used to predict the risk factor in coronary heart disease [15]; however, patients are
subject to radiation during CT scan.
MRI, CT and single positron emission tomography (SPECT) are widely used for
imaging contrast agents that are targeted to biomarkers of atherosclerosis [12, 16-17].
These imaging modalities have the advantage of imaging the systemic distribution of
contrast agents in the blood vessel. However, the images generally have a low resolution.
The small vessel diameter, tortuosity and especially the continuous movement of the
coronary arteries challenge the design of these whole-body imaging systems.

7
Ultrasound imaging can provide real time images of the superficial vessel, for
example carotid arteries. Intima-media thickness of the carotid artery measured by
ultrasound was considered to be correlated with cardiovascular risk [18]. However, recent
clinical trials demonstrated that this might not be true [19]. Atherosclerosis in carotid
arteries is closely related to cerebrovascular risk. Ultrasound can image the plaque
distribution near the carotid bulb. Analysis of functional parameters such as shear stress
can identify the rupture-prone regions. Using microbubbles as contrast agents, ultrasound
can detect the neovascularization in carotid plaques [20].
1.3.2 Invasive imaging modalities
X-ray angiography is the most widely used imaging modality in catheterization
labs. In coronary angiography, a radio-opaque contrast agent is injected locally into an
artery with a catheter. The arterial network is imaged in real-time with X-ray imaging.
Using angiography, stenotic sites can be clearly visualized. However, because
angiography projects the 3D arterial network into 2D silhouette, errors are introduced
when estimating the vessel lumen narrowing [21].
Compared to non-invasive and whole body imaging modalities, catheter based
invasive imaging modalities generally provide images with the high resolution that is
necessary for imaging coronary plaques.
IVUS has become an important catheter based, real-time invasive imaging
modality facilitating the diagnosis of atherosclerosis. IVUS provides a relatively high
resolution morphologic image of the vessel’s cross-section. Coronary IVUS transducers
are generally operating in the frequency range from 20 MHz to 60 MHz, which provides
an axial resolution from 30 µm to several hundred micrometers. The ultrasound
transducer located at the tip of the IVUS imaging catheter radiates an acoustic beam

8
towards the vessel wall, and thereafter receives the backscattered acoustic wave. After
rotating the acoustic beam 360o, reflected acoustic waves from one cross-section of the
vessel are acquired. Clinically, two types of imaging catheters are used: single element or
array based. The difference is that the former catheter mechanically rotates the acoustic
beam while the latter rotates the beam electrically.
In a typical IVUS imaging system, the acquired radiofrequency (RF) signals are
first digitized and filtered according to the central frequency of the transducer. Signal
envelopes are then scan converted to form an IVUS image (Figure 1.4). From IVUS
images, the degree of stenosis and the area of large plaques can be measured. IVUS can
also image vessel remodeling and monitor restenosis in stent deployed vessels, which are
critical information for interventions and hard to be accomplished solely by angiography
[21].
Figure 1.4: A typical IVUS image processing procedure. Panel (a) is the flowchart for
processing IVUS images. Digitized radio frequency signal (b) is first band-
pass filtered (c). Then, filtered signal goes through envelope detection (d),
and is scan converted (e) to form an IVUS image demonstrating a cross-
section of a vessel.
Band-pass filter
Digitized IVUS RF signals
Envelope detection
Scan conversion
IVUS image
100 200 300 400 500 600 700 800
-1.5
-1
-0.5
0
0.5
1
x 104
Am
plit
ud
e o
f ultra
sou
nd
sig
nal (a
.u.)
Data points0 200 400 600 800 1000
-2
-1.5
-1
-0.5
0
0.5
1
1.5x 10
4
Data points
Am
plit
ud
e o
f ultra
sou
nd
sig
nal (a
.u.)
0 200 400 600 800 10000
0.5
1
1.5
2x 10
4
Data points
Am
plit
ud
e o
f u
ltra
so
und
sig
na
l (a
.u.)
(a)
(b) (c) (d) (e)

9
Certain tissue types in atherosclerotic plaques can be identified from IVUS
images based on contrast in acoustic impedance (Figure 1.5). Lipid-laden plaques are
hypo-echoic in IVUS images (Figure 1.5(c)). Calcified and fibrous plaques produce
hyper-echoic signals, and may cause shadowing effects behind the plaque (Figure
1.5(d,e)) [21-22]. However, comparison of the acoustic signal strengths cannot reliably
differentiate calcified plaques from dense fibrous plaques, or lipid-rich plaques from
plaques mixed with lipid and fibrous tissue [23]. Researchers tried to extract the tissue
dependent spectral information hidden from the traditional grayscale IVUS images.
Based on 8 spectral signatures extracted from the IVUS signal acquired from 30 MHz
single element transducer, Nair et al. [23] classified the coronary plaques into four
categories (fibrous, fibrolipidic, calcified and calcified-necrotic). Later, Valcano Inc.
incorporated a similar classification method into its 20 MHz array catheter based IVUS
imaging system, and named it Virtual HistologyTM
[24]. In several clinical trials, Virtual
histology IVUS (VH-IVUS) showed improved accuracy of plaque characterization than
IVUS alone [25]. However, due to the variations in spectral responses of each individual
IVUS catheter, extracted spectral features may not be consistent. Moreover, due to the
limited spectral bandwidth of IVUS transducers, there may not be significant spectral
differences between various tissue types [26]. Recently, Thim et al. found that the
necrotic core size determined by VH-IVUS in vivo in atherosclerotic pigs did not
correlate with the histology results [27]. Therefore, in vivo plaque characterization using
spectral IVUS information needs further validation.

10
Figure 1.5: IVUS images of healthy (a,b), and diseased (c-e) vessels. Panel (b) is the
zoomed-in image of panel (a). Panels (c-e) show images of vessels
containing soft (lipid-laden) plaques, mixed (fibrous and calcified) plaques,
and calcified plaques, respectively. (Adapted from Nissen and Yock (2002)
[21] )
Catheter based optical imaging can provide morphological or compositional
information of plaques. Because of the exponential attenuation of optical fluence inside
tissue, luminal blood needs to be removed during imaging by flushing saline or another
optically transparent fluid through the artery. Intravascular angioscopy allows direct
optical visualization of the color and morphology of plaque [28]. Intravascular Raman
spectroscopy can identify the chemical composition by the shift of the optical spectrum
[29]. NIR spectroscopy can image the absorption property of tissue at the presence of
luminal blood [28]. The disadvantages of these optical methods are that the images are
not spatially resolved, and imaging depth is often not sufficient for a reliable assessment
of the plaque.
Intravascular optical coherence tomography (OCT) is an optical imaging modality
capable of spatially resolved imaging of the vessel wall with very high resolution of
several micrometers [30]. Because OCT imaging is based on the coherence of light,
luminal blood needs to be removed during imaging. Frequency domain intravascular
OCT significantly increased the frame rate up to 108 frames/sec [31]. The lipid core can
be imaged based on the higher light attenuation of the lipid [32]. Due to the high spatial
(a) (b) (c) (d) (e)

11
resolution of OCT images, the thickness of fibrous caps in plaques can be accurately
measured. Thin-cap fibroatheroma (TCFA) is defined as a thin fibrous cap (<65 µm in
thickness) covering a large lipid core in a plaque. Intravascular OCT is capable of
identifying TCFA in human coronaries in vivo [33]. A high concentration of
macrophages can also be imaged based on their high intensity in the OCT images [34].
However, because light loses its coherence in deeper tissues, OCT imaging of
atherosclerosis is limited by its 1-2 mm penetration depth. Therefore, the imaging range
of intravascular OCT is not sufficient to cover the region of plaques, and cannot evaluate
the morphology or tissue composition deep inside the plaque.
Because of lacking imaging contrast, contrast agents need to be introduced in
order to image disease related biomarkers (Figure 1.3). Intravascular modalities promise
a high resolution, close up view of the contrast agents. Multiple optically absorbing
contrast agents such as quantum dots, gold or silver nanoparticles, carbon nanotubes, and
fluorescent dyes are designed for intravascular optical based imaging modalities. These
particles can be tuned to specific absorbing wavelengths to minimize the background
signal. Imaging platforms such as photoacoustic imaging or fluorescent lifetime imaging
are capable of detecting these contrast agents [35].
1.4 ULTRASOUND GUIDED INTRAVASCULAR PHOTOACOUSTIC IMAGING
Photoacoustic (optoacoustic) signals are acoustic signals generated as a result of
light irradiation. Photoacoustic signals may be generated through various mechanisms,
including electrostriction, optical breakdown, radiation pressure, thermal expansion or
photochemical processes [36-38]. The mechanism for photoacoustic signal generation is
determined by the power density of light and the optical property of the object. In the

12
scope of biomedical imaging, photoacoustic signals are generated through thermal
expansion after laser irradiation.
Photoacoustic signal generation through thermal expansion can be demonstrated
from [39]:
2 22
2 2 2 2
1 ( , )( , ) ,
s s
T r tp r t
v t v t
(1.1)
where ( , )p r t denotes the acoustic pressure at location r and time t ; T denotes the
temperature; sv denotes the speed of sound; is the thermal expansion of volume
expansion; is the isothermal compressibility. The efficiency of photoacoustic signal
generation through thermal expansion depends on the laser pulse duration in the
relationship with the thermal and stress relaxation time. If the laser pulse duration 0 is
significantly shorter than the thermal and stress relaxation time, the heat generated by
optical absorption does not have time to diffuse out of the heated region during the laser
pulse. Then the maximum initial photoacoustic pressure has the following form:
2
0 ,eff effz zsa a
p
vp Fe Fe
C
(1.2)
where a is the optical absorption coefficient of the inclusion, F is the laser fluence,
eff is the effective attenuation coefficient of light inside the object, is the
Grüeneisen coefficient characterizing the efficiency of photoacoustic generation for a
type of tissue, and z is the depth.
Assuming a homogeneous spherical optical absorber was embedded inside a
homogeneous back ground, the acoustic impedance and speed of sound are matched
between the inclusion and the background. Without satisfying the stress confinement,

13
photoacoustic signal received outside of the absorber has two separated parabolic
shaped signals that are in opposite phases (Figure 1.6(a)) [40]. When the laser pulse
duration satisfies the stress confinement, the photoacoustic signal received outside of the
inclusion has an “N” shape (Figure 1.6(b)) [40].
Figure 1.6: Theoretical acoustic pressure generated using a long laser pulse (a) and an
ultra-short laser pulse (b) from a spherical inclusion embedded in an
acoustically matched background. Pressure was received at a distance r,
equal to two times the inclusion radius a. (Adapted from Sun and Gerstman
(1999) [40])
In photoacoustic imaging, usually a nanosecond duration pulsed laser system is
used. This means that the laser pulse duration satisfies both the thermal and stress
confinements for biological tissue. The photoacoustic signal amplitude can be calculated
using Equation (1.2). The time interval between the positive peak and negative peak of
the “N” shaped photoacoustic signal equals the diameter of the optical absorbing sphere
[41]. The photoacoustic signal amplitude under stress and thermal confinement is
proportional to a tissue dependent dimensionless parameter Γ, the optical absorption
coefficient of tissue, and laser fluence. Because speed of sound ( c ), the thermal
(a) (b)

14
coefficient of tissue expansion ( ), and specific heat ( pC ) are temperature dependent,
Γ varies with temperature. At a constant temperature, if the laser fluence is known, the
optical absorption coefficient of tissue can be calculated. Therefore, photoacoustic
imaging detects contrast based on the optical absorption property of tissue.
A photoacoustic signal generated with ultra-short laser pulses is a broad-band
radiofrequency signal. To preserve the shape and amplitude of the original
photoacoustic signal, transducers with large bandwidth and high sensitivity would be
ideal. Polyvinylidene fluoride (PVDF) membrane hydrophones or transducers designed
with broad receiving bandwidth are used for receiving the photoacoustic signals [42].
An optical delivery system is critical for the design of photoacoustic imaging
systems. Because of the exponential decay of laser energy inside biological tissue, laser
fluence should be strong in order to achieve a large imaging depth and high sensitivity.
The design of the optical system has to balance between the requirement of maximum
exposure of laser energy over the tissue and achieving maximum fluence at the imaging
region deep inside the tissue. One solution is to focus light inside the tissue, which has
been utilized both for single element and array based photoacoustic imaging systems [43-
44].
Synergy of a photoacoustic and a conventional ultrasound system is beneficial.
Photoacoustic images are based on the optical absorption contrast, while ultrasound
images visualize the anatomy of the tissue which is often lacking in photoacoustic images
[45]. Moreover, because photoacoustic signals are fundamentally acoustic signals, the
combination of the two imaging modalities requires little hardware modification of a
traditional ultrasound imaging system. Photoacoustic and ultrasound imaging can share
the same data acquisition and digital signal processing hardware, which happen to be the
most expensive parts in a conventional ultrasound imaging system. Photoacoustic

15
imaging probe can be manufactured by integrating the light delivery system with the
ultrasound transducer. Therefore, combined photoacoustic and ultrasound imaging can
provide both the functional and anatomical information of the tissue, and can be achieved
relatively economically.
Most of the conventional ultrasound imaging systems use piezoelectric material
for ultrasound transducers. Piezoelectric transducers (PZT) have narrower bandwidths
than PVDF transducers, and low receiving sensitivity. Therefore, PZT may not be very
efficient for receiving photoacoustic signals. However, PZT has high acoustic generation
efficiency, which is beneficial to traditional ultrasound imaging. The tradeoff of
sensitivity between photoacoustic and ultrasound imaging need to be considered in the
design for the combined photoacoustic and ultrasound imaging system.
IVPA is an extension of photoacoustic imaging used in intravascular imaging
application. In IVPA imaging, an integrated catheter is introduced into the vessel lumen
(Figure 1.7). The integrated catheter is capable of delivering a laser beam towards the
vessel wall and at the same time performing conventional IVUS imaging. The laser
system is synchronized with the conventional IVUS data acquisition so that
photoacoustic signals can be acquired together with the ultrasound signal at each imaging
angle [46]. Image processing procedures for IVPA imaging is similar to conventional
IVUS imaging (Figure 1.4). The IVPA and IVUS images generated from the imaging
system are co-registered. From IVPA images, information about tissue composition can
be extracted based on characteristic optical absorption spectra of tissue (Figure 1.8) [47].
The co-registered IVUS image demonstrates the location of the photoacoustic signal
source.

16
Figure 1.7: Realization of combined IVPA and IVUS imaging using an integrated
IVPA/IVUS imaging catheter. (a) Longitudinal view of integrated catheter
inside the vessel lumen. Combined IVPA and IVUS imaging can be
performed in the overlapped region of the optical (red) and acoustic beam
(gray). (b) Cross-sectional view of the catheter and vessel.
Figure 1.8: Optical absorption property of tissues in the vessel [48-49].
Lipid
MacrophageAu NPs
(a) (b)
200 400 600 800 1000 1200
10-2
100
102
Wavelength (nm)
Abso
rptio
n c
oeffic
ient (c
m-1
)
Hb
HbO2
Fat
Fatty Acid
Water
Intima
Media
Adventitia

17
IVUS guiding is important in IVPA imaging. IVPA images only show optical
absorbing components in the plaques, while IVUS reveals the structure of the vessel. By
combining co-registered IVUS and IVPA images, morphology and composition
information can be determined in a single image. In Figure 1.9, a vessel mimicking
phantom with an optically absorbing inclusion embedded inside the phantom wall was
imaged by a bench top combined IVUS/IVPA imaging system. IVPA image (Figure
1.9(a)) only shows the inclusion, while IVUS image (Figure 1.9(b)) only shows the
structure of the phantom. Combined IVUS/IVPA image (Figure 1.9(c)) demonstrates the
relative position of the inclusion inside the phantom.
Figure 1.9: (a) IVPA, (b) IVUS, and (c) combined IVUS/IVPA 3D images of a tissue
mimicking phantom with an optically absorbing inclusion.
1.5 ANIMAL MODELS OF ATHEROSCLEROSIS
Animal models are important for studying the progression and treatment of
atherosclerosis. The ideal animal model should grow diffuse plaques, with the same
morphology, composition and molecular responses as human plaques. Unfortunately, no
animal model can completely simulate human atherosclerotic plaques. Rabbit models of
(b)(a) (c)

18
atherosclerosis have been extensively used for invasive imaging studies because of their
cost effectiveness and their aorta artery is of similar size to human coronary arteries.
Two types of NZW rabbit models were created: rabbits which had undergone
balloon injury on the aorta and were subjected to high a cholesterol diet, and rabbits on a
long term low cholesterol diet. Cholesterol chow dramatically increases blood LDL levels
in NZW rabbits, which will induce plaque formation in the arterial wall. Mechanical
injury over the artery can accelerate the disease progress. Plaques created by balloon
injury are rich in macrophages [51], and have a high density of vasa vasorum [52]. This
type of plaque can build up in several months. On the other hand, plaques created by a
long term low cholesterol diet are rich in lipids, and usually of a higher degree of stenosis
compared to balloon injured ones. This type of plaque takes over 10 months to build up.
Both types of NZW rabbit models have been extensively used in the study of molecular
imaging with MRI, CT, and PET [51, 53-54]. The disadvantages of NZW rabbit models
are 1) the distribution of the plaques mainly locates in the aorta or iliac arteries; 2) plaque
composition is simpler in comparison to human atherosclerotic plaques; 3) biomarkers
are fewer than in human plaques.
The WHHL rabbit is another widely used rabbit model in atherosclerosis studies.
WHHL rabbits have high LDL levels in blood due to the deficiency of LDL receptors,
and will spontaneously develop atherosclerosis in the aorta and coronary arteries [55].
Within 12 to 18 months of age, severe plaques are developed in the WHHL rabbits. The
atherosclerotic plaques developed by WHHL rabbits are morphologically similar to
human plaques and therefore are considered a better model of human atherosclerosis than
the NZW rabbit model.

19
1.6 ORGANIZATION OF THE DISSERTATION
The dissertation is focused on detecting lipid deposits and macrophages in
atherosclerotic plaques. Lipids and macrophages are not only involved in the
development of atherosclerosis, but more importantly, the distribution of these two
components may indicate the rupture prone regions in the plaques.
Based on the endogenous optical absorption contrast, Chapter 2 demonstrates that
lipid deposits can be detected by spectroscopic IVPA imaging. Fatty acids are present in
all kinds of lipid particles, and have a unique optical absorption peak around 1210 nm
wavelength. After acquiring multi-wavelength IVPA images around the 1210 nm
absorption peak, a slope based spectroscopic analysis was used to identify lipids in an
atherosclerotic rabbit aorta. This work has been published in Optics Express (Detection
of lipid in atherosclerotic vessels using ultrasound-guided spectroscopic intravascular
photoacoustic imaging, vol. 18, pp. 4889-4897, 2010).
Chapter 3 and Chapter 4 are focused on molecular imaging of macrophages in
atherosclerosis using gold nanoparticles (Au NPs) as a contrast agent. Chapter 3
describes that Au NPs can be used as contrast agents for IVPA imaging to image
phagocytically active macrophages. Both in vitro cell phantom and ex vivo tissue
experiments demonstrated that IVPA imaging in the near infrared wavelength range can
selectively image macrophages labeled by Au NPs. This part of the work was published
in Nano Letters (Plasmonic Intravascular Photoacoustic Imaging for Detection of
Macrophages in Atherosclerotic Plaques, vol. 9, pp. 2212-2217, 2009). The sensitivity of
imaging macrophages labeled by Au NPs, and the viability of cells under laser irradiation
were also investigated in Chapter 3.
In Chapter 4, plasmonic IVPA imaging of macrophages was applied to the rabbit
model of atherosclerosis, where Au NPs were injected in vivo into a rabbit, and the aorta

20
was imaged ex vivo using an upgraded IVPA/IVUS imaging system. Phagocytically
active macrophages were imaged and compared to histological stains. Particle delivery,
blood circulation half-time, and bio-distribution of Au NPs were investigated. Lastly,
because the absorption spectra of Au NPs and lipid do not overlap, simultaneous imaging
of Au NPs and lipid deposits was performed.
Finally, Chapter 5 summarizes the results of the dissertation, addresses limitations
of the study, draws conclusions, and proposes areas of future work.
1.6 REFERENCES
[1] E. Falk, P. K. Shah, and V. Fuster, "Coronary plaque disruption," Circulation,
92(3), pp. 657-671, (1995).
[2] D. Lloyd-Jones, R. Adams, M. Carnethon, G. De Simone, T. B. Ferguson, K.
Flegal, E. Ford, K. Furie, A. Go, and K. Greenlund, "Heart Disease and Stroke
Statistics--2009 Update. A Report From the American Heart Association Statistics
Committee and Stroke Statistics Subcommittee," Circulation, (2008).
[3] E. Falk, "Pathogenesis of Atherosclerosis," J Am Coll Cardiol, 47(8_Suppl_C),
pp. C7-12, (2006).
[4] E. B. Diethrich, M. P. Margolis, D. B. Reid, A. Burke, V. Ramaiah, J. A.
Rodriguez-Lopez, G. Wheatley, D. Olsen, and R. Virmani, "Virtual Histology
Intravascular Ultrasound Assessment of Carotid Artery Disease: The Carotid
Artery Plaque Virtual Histology Evaluation (CAPITAL) Study," Journal of
Endovascular Therapy, 14(5), pp. 676-686, (2007).
[5] M. Naghavi, P. Libby, E. Falk, S. W. Casscells, S. Litovsky, J. Rumberger, J. J.
Badimon, C. Stefanadis, P. Moreno, and G. Pasterkamp, "From vulnerable plaque
to vulnerable patient a call for new definitions and risk assessment strategies: Part
I," Circulation, 108(14), pp. 1664-1672, (2003).
[6] F. D. Kolodgie, H. K. Gold, A. P. Burke, D. R. Fowler, H. S. Kruth, D. K. Weber,
A. Farb, L. J. Guerrero, M. Hayase, R. Kutys, J. Narula, A. V. Finn, and R.
Virmani, "Intraplaque Hemorrhage and Progression of Coronary Atheroma," New
England Journal of Medicine, 349(24), pp. 2316-2325, (2003).

21
[7] R. Virmani, A. P. Burke, A. Farb, and F. D. Kolodgie, "Pathology of the unstable
plaque," Progress in Cardiovascular Diseases, 44(5), pp. 349-356, (2002).
[8] D. Steinberg, "Thematic review series: The Pathogenesis of Atherosclerosis. An
interpretive history of the cholesterol controversy, part III: mechanistically
defining the role of hyperlipidemia," Journal of Lipid Research, 46(10), pp. 2037-
2051, October 1, 2005 (2005).
[9] P. Libby, "Inflammation in atherosclerosis," Nature, 420(6917), pp. 868-874,
(2002).
[10] P. R. Moreno, K. R. Purushothaman, V. Fuster, D. Echeverri, H. Truszczynska, S.
K. Sharma, J. J. Badimon, and W. N. O'Connor, "Plaque Neovascularization Is
Increased in Ruptured Atherosclerotic Lesions of Human Aorta: Implications for
Plaque Vulnerability," Circulation, 110(14), pp. 2032-2038, October 5, 2004
(2004).
[11] M. Gössl, D. Versari, H. A. Hildebrandt, T. Bajanowski, G. Sangiorgi, R. Erbel,
E. L. Ritman, L. O. Lerman, and A. Lerman, "Segmental Heterogeneity of Vasa
Vasorum Neovascularization in Human Coronary Atherosclerosis," JACC:
Cardiovascular Imaging, 3(1), pp. 32-40, (2010).
[12] J. Sanz and Z. A. Fayad, "Imaging of atherosclerotic cardiovascular disease,"
Nature, 451(7181), pp. 953-957, (2008).
[13] K. Briley-Saebo, W. Mulder, V. Mani, F. Hyafil, V. Amirbekian, and J.
Aguinaldo, "Magnetic resonance imaging of vulnerable atherosclerotic plaques:
current imaging strategies and molecular imaging probes," Journal of Magnetic
Resonance Imaging, 26(3), pp. 460-479, (2007).
[14] C. M. Matter, M. Stuber, and M. Nahrendorf, "Imaging of the unstable plaque:
how far have we got?," European Heart Journal, 30(21), pp. 2566-2574,
November 1, 2009 (2009).
[15] P. Greenland, L. LaBree, S. P. Azen, T. M. Doherty, and R. C. Detrano,
"Coronary Artery Calcium Score Combined With Framingham Score for Risk
Prediction in Asymptomatic Individuals," JAMA: The Journal of the American
Medical Association, 291(2), pp. 210-215, January 14, 2004 (2004).
[16] R. P. Choudhury and E. A. Fisher, "Molecular Imaging in Atherosclerosis,
Thrombosis, and Vascular Inflammation," Arterioscler Thromb Vasc Biol, 29(7),
pp. 983-991, July 1, 2009 (2009).
22
[17] J. H. F. Rudd, F. Hyafil, and Z. A. Fayad, "Inflammation Imaging in
Atherosclerosis," Arterioscler Thromb Vasc Biol, 29(7), pp. 1009-1016, July 1,
2009 (2009).
[18] P. H. Davis, J. D. Dawson, W. A. Riley, and R. M. Lauer, "Carotid Intimal-
Medial Thickness Is Related to Cardiovascular Risk Factors Measured From
Childhood Through Middle Age: The Muscatine Study," Circulation, 104(23), pp.
2815-2819, December 4, 2001 (2001).
[19] P. Costanzo, P. Perrone-Filardi, E. Vassallo, S. Paolillo, P. Cesarano, G. Brevetti,
and M. Chiariello, "Does Carotid Intima-Media Thickness Regression Predict
Reduction of Cardiovascular Events?: A Meta-Analysis of 41 Randomized
Trials," Journal of the American College of Cardiology, 56(24), pp. 2006-2020,
(2010).
[20] S. B. Feinstein, "Contrast Ultrasound Imaging of the Carotid Artery Vasa
Vasorum and Atherosclerotic Plaque Neovascularization," Journal of the
American College of Cardiology, 48(2), pp. 236-243, (2006).
[21] S. Nissen and P. Yock, "Intravascular ultrasound novel pathophysiological
insights and current clinical applications," Circulation, 103(4), pp. 604-616,
(2001).
[22] G. Finet, E. Maurincomme, A. Tabib, R. J. Crowley, I. Magnin, R. Roriz, J.
Beaune, and M. Amiel, "Artifacts in intravascular ultrasound imaging: Analyses
and implications," Ultrasound in medicine & biology, 19(7), pp. 533-547, (1993).
[23] A. Nair, B. D. Kuban, E. M. Tuzcu, P. Schoenhagen, S. E. Nissen, and D. G.
Vince, "Coronary Plaque Classification With Intravascular Ultrasound
Radiofrequency Data Analysis," Circulation, 106(17), pp. 2200-2206, October
22, 2002 (2002).
[24] A. Konig and V. Klauss, "Virtual histology," Heart, 93(8), pp. 977-982, August 1,
2007 (2007).
[25] A. König, M. P. Margolis, R. Virmani, D. Holmes, and V. Klauss, "Technology
Insight: in vivo coronary plaque classification by intravascular ultrasonography
radiofrequency analysis," Nature Clinical Practice Cardiovascular Medicine,
5(4), pp. 219-229, (2008).
[26] A. Katouzian, S. Sathyanarayana, B. Baseri, E. E. Konofagou, and S. Carlier,
"Challenges in Atherosclerotic Plaque Characterization With Intravascular
23
Ultrasound (IVUS): From Data Collection to Classification," Information
Technology in Biomedicine, IEEE Transactions on, 12(3), pp. 315-327, (2008).
[27] T. Thim, M. K. Hagensen, D. Wallace-Bradley, J. F. Granada, G. L. Kaluza, L.
Drouet, W. P. Paaske, H. E. Botker, and E. Falk, "Unreliable Assessment of
Necrotic Core by Virtual Histology Intravascular Ultrasound in Porcine Coronary
Artery Disease," Circ Cardiovasc Imaging, 3(4), pp. 384-391, July 1, 2010
(2010).
[28] Y. Honda and P. J. Fitzgerald, "Frontiers in Intravascular Imaging Technologies,"
Circulation, 117(15), pp. 2024-2037, April 15, 2008 (2008).
[29] Y. Komachi, H. Sato, and H. Tashiro, "Intravascular Raman spectroscopic
catheter for molecular diagnosis of atherosclerotic coronary disease," Appl. Opt.,
45(30), pp. 7938-7943, (2006).
[30] J. G. Fujimoto, "Optical coherence tomography for ultrahigh resolution in vivo
imaging," Nature Biotechnology, 21pp. 1361-1367, (2003).
[31] S. H. Yun, G. J. Tearney, B. J. Vakoc, M. Shishkov, W. Y. Oh, A. E. Desjardins,
M. J. Suter, R. C. Chan, J. A. Evans, I.-K. Jang, N. S. Nishioka, J. F. de Boer, and
B. E. Bouma, "Comprehensive volumetric optical microscopy in vivo," Nat Med,
12(12), pp. 1429-1433, (2006).
[32] G. v. Soest, T. Goderie, E. Regar, S. Koljenovic, G. L. J. H. v. Leenders, N.
Gonzalo, S. v. Noorden, T. Okamura, B. E. Bouma, G. J. Tearney, J. W.
Oosterhuis, P. W. Serruys, and A. F. W. v. d. Steen, "Atherosclerotic tissue
characterization in vivo by optical coherence tomography attenuation imaging,"
Journal of Biomedical Optics, 15(1), p. 011105, (2010).
[33] K. Fujii, D. Kawasaki, M. Masutani, T. Okumura, T. Akagami, T. Sakoda, T.
Tsujino, M. Ohyanagi, and T. Masuyama, "OCT Assessment of Thin-Cap
Fibroatheroma Distribution in Native Coronary Arteries," J Am Coll Cardiol Img,
3(2), pp. 168-175, February 1, 2010 (2010).
[34] G. J. Tearney, H. Yabushita, S. L. Houser, H. T. Aretz, I.-K. Jang, K. H.
Schlendorf, C. R. Kauffman, M. Shishkov, E. F. Halpern, and B. E. Bouma,
"Quantification of Macrophage Content in Atherosclerotic Plaques by Optical
Coherence Tomography," Circulation, 107(1), pp. 113-119, January 7, 2003
(2003).

24
[35] K. Douma, L. Prinzen, D. W. Slaaf, C. P. M. Reutelingsperger, E. A. L. Biessen,
T. M. Hackeng, M. J. Post, and M. van Zandvoort, "Nanoparticles for Optical
Molecular Imaging of Atherosclerosis," Small, 5(5), (2009).
[36] D. C. Emmony, "Interaction of IR laser radiation with liquids," Infrared Physics,
25(1-2), pp. 133-139, (1985).
[37] M. W. Sigrist, "Laser generation of acoustic waves in liquids and gases," Journal
of Applied Physics, 60(7), pp. R83-R122, (1986).
[38] A. C. Tam, "Applications of photoacoustic sensing techniques," Reviews of
Modern Physics, 58(2), p. 381, (1986).
[39] L. V. Wang and H.-I. Wu, Biomedical opitcs: John Wiley & Sons, 2007.
[40] J. M. Sun and B. S. Gerstman, "Photoacoustic generation for a spherical absorber
with impedance mismatch with the surrounding media," Physical Review E,
59(5), p. 5772, (1999).
[41] A.A.Oraevsky and A.A.Karabutov, Optoacoustic Tomography vol. 34: CRC
Press, 2003.
[42] E. Zhang, J. Laufer, and P. Beard, "Backward-mode multiwavelength
photoacoustic scanner using a planar Fabry-Perot polymer film ultrasound sensor
for high-resolution three-dimensional imaging of biological tissues," Appl Opt,
47(4), pp. 561-77, (2008).
[43] H. F. Zhang, K. Maslov, G. Stoica, and L. V. Wang, "Functional photoacoustic
microscopy for high-resolution and noninvasive in vivo imaging," Nature
Biotechnology, 24pp. 848-851, (2006).
[44] K. Homan, S. Kim, Y.-S. Chen, B. Wang, S. Mallidi, and S. Emelianov,
"Prospects of molecular photoacoustic imaging at 1064 nm wavelength," Opt.
Lett., 35(15), pp. 2663-2665, (2010).
[45] S. Y. Emelianov, S. R. Aglyamov, A. B. Karpiouk, S. Mallidi, S. Park, S.
Sethuraman, J. Shah, R. W. Smalling, and W. G. S. J.M. Rubin, "Synergy and
Applications of Combined Ultrasound, Elasticity, and Photoacoustic Imaging," in
Proc. IEEE International Ultrasonics Symposium, 2006, pp. 405-415.
[46] S. Sethuraman, S. R. Aglyamov, J. H. Amirian, R. W. Smalling, and S. Y.
Emelianov, "Intravascular Photoacoustic Imaging Using an IVUS Imaging
Catheter," IEEE Trans Ultrason Ferroelectr Freq Control, 54(5), (2007).

25
[47] S. Sethuraman, J. H. Amirian, S. H. Litovsky, R. W. Smalling, and S. Y.
Emelianov, "Spectroscopic intravascular photoacoustic imaging to differentiate
atherosclerotic plaques," Optics Express, 16(5), pp. 3362-3367, (2008).
[48] S. A. Prahl. (2001, Optical properties spectra compiled by Scott Prahl. Available:
http://omlc.ogi.edu/spectra/
[49] C. L. Tsai, J. C. Chen, and W. J. Wang, "Near-infrared absorption property of
biological soft tissue constituents," Journal of Medical and Biological
Engineering, 21(1), pp. 7-14, (2001).
[50] B. Wang, A. B. Karpiouk, and S. Y. Emelianov, "Design of catheter for combined
intravascular photoacoustic and ultrasound imaging," Proceedings of the 2008
IEEE Ultrasonics Symposium, pp. 1150-1153, (2008).
[51] Z. Zhang, J. Machac, G. Helft, S. G. Worthley, C. Tang, A. G. Zaman, O. J.
Rodriguez, M. S. Buchsbaum, V. Fuster, and J. J. Badimon, "Non-invasive
imaging of atherosclerotic plaque macrophage in a rabbit model with F-18 FDG
PET: a histopathological correlation," BMC Nucl Med, 6p. 3, (2006).
[52] H. M. Kwon, G. Sangiorgi, E. L. Ritman, A. Lerman, C. McKenna, R. Virmani,
W. D. Edwards, D. R. Holmes, and R. S. Schwartz, "Adventitial vasa vasorum in
balloon-injured coronary arteries: visualization and quantitation by a microscopic
three-dimensional computed tomography technique," J Am Coll Cardiol, 32(7),
pp. 2072-9, (1998).
[53] F. Hyafil, J. C. Cornily, J. E. Feig, R. Gordon, E. Vucic, V. Amirbekian, E. A.
Fisher, V. Fuster, L. J. Feldman, and Z. A. Fayad, "Noninvasive detection of
macrophages using a nanoparticulate contrast agent for computed tomography,"
Nat Med, 13(5), pp. 636-41, (2007).
[54] E. Durand, J. S. Raynaud, P. Bruneval, I. Brigger, Z. A. Al Haj, C. Mandet, E.
Lancelot, and A. Lafont, "Magnetic resonance imaging of ruptured plaques in the
rabbit with ultrasmall superparamagnetic particles of iron oxide," J Vasc Res,
44(2), pp. 119-28, (2007).
[55] S. Masashi and I. Takashi, "The Watanabe heritable hyperlipidemic (WHHL)
rabbit, its characteristics and history of development: A tribute to the late Dr.
Yoshio Watanabe," Atherosclerosis, 207(1), pp. 1-7, (2009).

26
Chapter 2: Spectroscopic IVPA imaging of lipid deposits
2.1 INTRODUCTION
Lipid is an important component in atherosclerotic plaques. Lipid in the plaques
originates from LDL particles circulating in the blood stream. After entering the leaky
endothelial layer, LDL particles are endocytosed by macrophages located in the arterial
wall. These LDL loaded macrophages later contribute to the lipid-rich necrotic core in the
classical rupture prone plaques [1]. Moreover, it has been shown that periadventitial fat is
related to vessel remodeling and inflammation in atherosclerosis [2]. Imaging lipid
deposits in atherosclerotic vessels will benefit both diagnosis and the understanding of
the pathology of atherosclerosis.
IVPA imaging is well suited for lipid detection in atherosclerosis. The Grüneisen
coefficients of fat and lipid are about two orders of magnitude higher than that of water.
Therefore, lipid is one of the most efficient biological media for the generation of
photoacoustic transients [3]. Consequently, IVPA imaging may detect lipid with high
sensitivity even though the optical absorption coefficient of lipid is lower compared to
other tissue types. In the wavelength range between 1150 nm and 1250 nm, the optical
absorption spectra of fatty acid and water behave differently (Figure 1.8) – the optical
absorption spectrum of fatty acid has a local maxima in this spectral range, while the
spectrum of water is nearly constant [4]. Therefore, spectroscopic IVPA imaging of lipid
may be used to differentiate lipid-rich tissue from other water-based tissues in
atherosclerotic vessels [5].

27
2.2 METHODS
2.2.1 Animal model
A New Zealand white rabbit was kept under a 0.25% cholesterol chow for 20
months. A rabbit subject to such a diet will develop advanced atherosclerosis in the aorta
[6]. Another rabbit fed a normal diet was used as a control. After sacrificing the rabbits,
the aortas were removed and preserved in saline dampened gauze at 4°C. Imaging
experiments were performed within 36 hours of sacrificing the rabbits.
2.2.1 Imaging system
The combined IVUS/IVPA imaging system consisted of a tunable Nd:YAG
pumped OPO laser (OPOTEK, Inc.) capable of generating laser pulses within 680 –
950 nm and 1200 – 2400 nm spectral ranges. The laser pulse duration was 5–7 ns and the
maximum wavelength-dependent fluence was 30 mJ/cm2. A 40 MHz single element
IVUS catheter (Boston Scientific, Inc.) driven by a pulser/receiver (5073PR, Olympus
Inc.) was used for both ultrasound pulse-echo imaging and photoacoustic imaging.
During the imaging experiment, the arterial sample was placed into a water tank and
immersed in saline solution. The IVUS catheter was inserted into the lumen of aorta
while the laser light was delivered by an optical fiber and irradiated the aorta from the
outside (Figure 2.1). The ultrasound beam of the transducer located at the tip of the IVUS
imaging catheter was aligned with the laser beam from the optical fiber. A stepper motor
mechanically rotated the artery for cross-sectional scanning. At each angular position, the
laser light irradiated the tissue and the IVUS transducer was used to receive the
photoacoustic signal. To increase signal-to-noise ratio, 8 photoacoustic signals were
collected and averaged. Then, followed by a user defined delay of several microseconds,
the same IVUS transducer was used to transmit and receive the ultrasound pulse-echo

28
signal. After rotating the arterial sample 360 degrees in 256 incremental angular steps,
co-registered IVPA and IVUS images of the sample were collected. Both IVUS and
IVPA radio frequency signals were acquired using an A/D card (Gage, Inc.) at 200 MHz
sampling rate. A power meter (Ophir, Inc.) was used to measure the energy of laser
pulses at various wavelengths.
Figure 2.1: Laboratory prototype of IVUS-guided multi-wavelength IVPA imaging
system.
2.2.2 SPECTROSCOPIC IVPA SIGNAL PROCESSING
2.2.2.1 Spectroscopic analysis methods for photoacoustic imaging
The specific chemical composition of tissue or plasmon resonance frequency of
metal nanoparticles provides them characteristic optical absorption spectra. Based on the
reconstructed optical absorption spectrum from photoacoustic imaging, spectroscopic
analysis may yield tissue composition information. Various methods have been used for

29
spectroscopic photoacoustic analysis. Most of the methods were applied to measure the
oxygen saturation (SO2) of blood. Because blood is a very strong optical absorber in the
visible-NIR wavelength range, and the difference in blood oxygen saturation changes its
optical absorption spectrum (Figure 1.8), oxygen saturation may be estimated from the
reconstructed spectrum using photoacoustic imaging[8]. However, because of the
wavelength dependent optical property of the tissue, absolute value of the optical
absorption coefficient (i.e. oxygen saturation) is very difficult to find. Pre-knowledge
such as tissue composition is required [9-10]. However, the changes in blood oxygenation
can be measured without wavelength dependent photoacoustic signal compensation [10-
11].
The goal of this work is to identify tissue composition rather than measuring the
absolute optical absorption coefficient. To achieve this goal, the normalized
photoacoustic spectrum is compared with the known tissue absorption spectrum. Two
types of comparison methods are generally used – least square error based and correlation
coefficient based.
1) If the least square error between the measured spectrum and tissue spectrum is
small, then the photoacoustic signal is classified as generated from a certain tissue type.
However, wavelength dependent tissue optical property along the laser beam path can
affect the measured photoacoustic spectrum, especially when the imaging depth is large.
To minimize estimation error, specific wavelength ranges for spectroscopic imaging need
to be carefully selected [10]. However, the selected imaging wavelengths are related to
the pre-knowledge of tissue composition, which is unavailable in the intravascular
imaging scenario. Moreover, in the case of contrast enhanced imaging, it would be ideal
to image at the absorption peak of the contrast agent to achieve better imaging depth than
the wavelength range that the estimation error is small.

30
2) Another type of comparison is utilizing the correlation based method (e.g.
intraclass correlation) as a measure of the similarity between the reconstructed spectrum
and the tissue spectrum [12]. However, prior knowledge of tissue composition (e.g. skin
thickness when imaging mouse tumor) is still required. Therefore, neither of these two
spectroscopic analysis methods is suitable for IVPA imaging. An algorithm needs to be
developed for tissue characterization in IVPA imaging.
2.2.2.2 Slope based algorithm for spectroscopic analysis
A slope based spectroscopic analysis method is developed to differentiate
photoacoustic signals generated from lipid. In contrast to the relatively constant optical
absorption spectrum of water within 1200 – 1230 nm wavelength range, the spectrum of
fatty acid decreases in this spectral range (Figure 1.8). Therefore, for lipid, the
photoacoustic signal amplitude at 1230 nm should be lower than that at 1200 nm. We
further assume that the absorption spectrum of lipid decreases nearly linearly within this
wavelength range. To identify the lipid region from the multi-wavelength IVPA data, a
three-step image processing algorithm was developed.
The flowchart in Figure 2.2 outlines the image processing algorithm used to
analyze multi-wavelength IVPA data. To obtain cross-sectional scans at multiple
wavelengths, the arterial sample was mechanically rotated several times. Consequently,
the elastic arterial tissue may not return to exactly the same position from one scan to
another. Therefore, the displacement of tissue between multi-wavelength scans was
estimated first. Since there was a co-registered IVUS image for each IVPA scan, IVUS
images with abundant anatomical information were used to estimate the tissue
displacement. Suppose the spectroscopic IVPA imaging was performed at multiple
wavelengths 1,[ ], ( 2,3,...),k l l the IVUS image taken at wavelength 1 was then

31
selected as the reference image, and the relative displacements of tissue in the scans at the
other wavelengths ( 2 l ) were estimated using a correlation-based motion tracking
method [13]. IVPA images at other wavelengths ( 2 l ) were then re-registered to the
reference ( 1 ) IVPA image to compensate for tissue motion due to inconsistent rotation
of the arterial sample.
Figure 2.2: Image processing algorithm for analyzing multi-wavelength IVPA and
IVUS data.
In the second step, the slopes of the photoacoustic signal amplitude from 1 to
l were calculated. All IVPA images were first low-pass filtered using a (m+1) by (n+1)
moving average filter. Then, at each pixel, the slope S of the photoacoustic signal
amplitude was calculated and normalized to the photoacoustic signal amplitude at 1
wavelength:
, , 1
,
, 1 1
( ) ( )1,
( )
i j l i j
i j
i j l
S SS
S
(2.1)
where S is the photoacoustic signal amplitude and is the laser wavelength.
Regions with negative slopes within a certain range were selected to indicate the potential
lipid region.
Estimation of Displacement
Calculation of PA Slope
Multi-wavelength IVPA Images
Co-registered IVUS Images
Generation of Error Mask
Combined IVUS and
Spectroscopic IVPA image
Realignment of IVPA images
Image Segmentation

32
In the third step, an error mask was introduced to identify regions with a high
level of noise based on the assumption that the photoacoustic signal amplitude should
have a nearly linear decline from 1 to l . Multi-wavelength IVPA images from 2 to
1l were utilized to identify and reject large photoacoustic signal amplitude fluctuations
from the linear decline with a slope of ,i jS :
, , 1
1 ,
, 1
( ) ( )( , ) ( ) , 2,3,..., 1.
( )
i j k i j
k i jki j
S SE i j S k l
S
(2.2)
An error ( , )E i j is the difference between the measured photoacoustic signal
amplitude at 2 to 1l and the linear fit of the photoacoustic signal amplitude between
1 and l . The potential lipid regions defined in step two were rejected if the error E
exceeded a certain value. The remaining regions were considered to contain lipid.
For display purposes, tissue boundaries, identified from the IVUS image taken
during the IVPA scan at 1 wavelength, were used to segment the spectroscopic IVPA
image. Furthermore, because the images were acquired and processed in the polar system
of coordinates, the IVUS and the spectroscopic IVPA images were scan converted to a
Cartesian grid and displayed using logarithmic scale.
In this study, the tissue sample was imaged every 10 nm within 1200–1230 nm
wavelength range. A kernel measuring 79 µm axially (21 samples) and 7 degrees
azimuthally (5 beams) was used for low-pass filtering. Potential lipid regions were
identified using negative slopes in the range from -0.02/nm to -0.007/nm (Equation 2.2).
An error threshold of 40% was used to reject regions with large fluctuations of the slope.
2.2.2.3 Effect of wavelength dependent tissue property on spectroscopic analysis
As discussed in section 2.2.2.1, the wavelength dependent optical property affects
the spectroscopic analysis. One-dimensional Monte Carlo simulation was performed to

33
analyze the effect of wavelength depended fluence distribution and its effect on the
regional optical absorption of tissue. Four types of tissues were used in the simulation:
water, lipid, adventitia and blood. Due to the limited information on the optical property
of tissue around the 1200 nm wavelength range, scattering coefficients of adventitia and
lipid are assumed to be the same as dermis. Optical scattering from water is assumed to
be negligible, and the absorption coefficient of water was used for the absorption
coefficient of adventitia tissue (Figure 2.3). The optical properties of tissues were
digitized from papers by Roggan et al., Tai et al. and online resources [4, 14-15]. We
also assumed that the anisotropic factor g is 0.99 for all tissue types.
Figure 2.3: Wavelength dependent optical absorption and scattering parameters used in
the Monte Carlo simulation.
To simulate the ex vivo experiment performed in saline, a two layer tissue model
was used for simulation (Figure 2.4(a)). The absorbed optical energy at different depths
in the lipid layer was calculated and plotted (Figure 2.4(b)). The photoacoustic signal
amplitude generated from different depths of lipid did not change significantly at
1180 1190 1200 1210 1220 1230 12400
2
4
6
8
10
12
14
16
18
Wavelength (nm)
Scatt
ering S
pectr
a (
1/c
m)
adventitia
water
blood
lipid
1180 1190 1200 1210 1220 1230 12400.4
0.6
0.8
1
1.2
1.4
1.6
1.8
2
Wavelength (nm)
Absorp
tion S
pectr
a (
1/c
m)
adventitia
water
blood
lipid

34
different wavelengths. More importantly, the normalized absorbed laser energy (Figure
2.4(c)) indicated that the shape and the peak of the absorption spectrum remained nearly
the same as the optical absorption spectrum of lipid.
In the second scenario, a blood-lipid two-layer model was used to simulate the
condition of in vivo IVPA imaging, in which the laser light illuminated the arterial tissue
from the inside and through a layer of oxygenated blood (Figure 2.5(a)). Due to the
optical scattering of the blood, the absorption peak of lipid at different imaging depth was
slightly blue-shifted (Figure 2.5(b)). However, after normalization, the absorbed laser
energy still followed a near linear decline with increasing wavelength (Figure 2.5(c)).
Figure 2.4: (a) Tissue structure used in Monte Carlo simulation to simulate the ex vivo
imaging experiment. (b) Absorbed laser energy at various depths of the lipid
layer. (c) Normalized laser energy absorption at various depths of the lipid
layer.
1-D Monte Carlo simulation results indicated the slope based spectroscopic
analysis performed in a small wavelength range around 1200 nm was not affected by the
wavelength dependent optical property of tissue. Therefore, lipid can be distinguished
from the spectroscopic analysis. Moreover, the algorithm may also be used in future in
vivo IVPA imaging in the presence of oxygenated blood.
Adventitia
Lipid0
.6 m
m0
.8 m
m
1180 1190 1200 1210 1220 1230 12400.2
0.3
0.4
0.5
0.6
0.7
0.8
0.9
1
Norm
aliz
ed A
bsorp
tion
Wavelength (nm)
lipid
0.65 mm
0.85 mm
1.05 mm
1.25 mm
1180 1190 1200 1210 1220 1230 12400.4
0.6
0.8
1
1.2
1.4
1.6
1.8
2
Absorp
tion (
1/c
m)
Wavelength (nm)
lipid
0.65 mm
0.85 mm
1.05 mm
1.25 mm
(a) (b) (c)
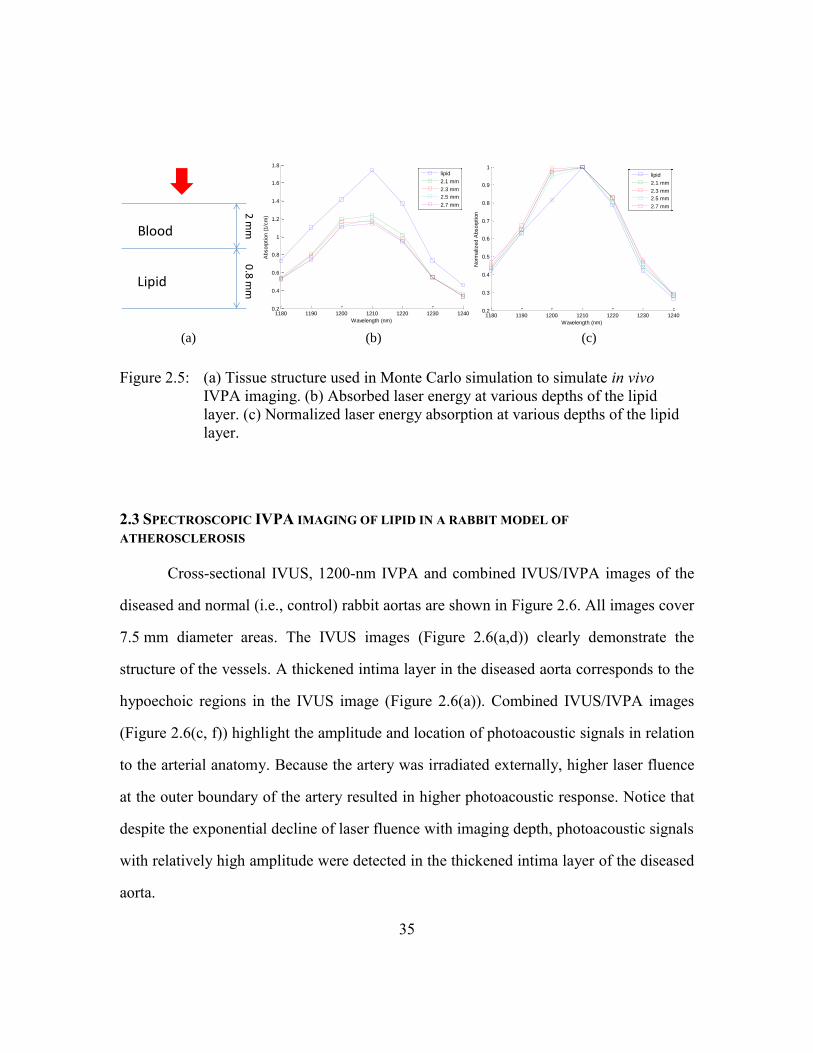
35
Figure 2.5: (a) Tissue structure used in Monte Carlo simulation to simulate in vivo
IVPA imaging. (b) Absorbed laser energy at various depths of the lipid
layer. (c) Normalized laser energy absorption at various depths of the lipid
layer.
2.3 SPECTROSCOPIC IVPA IMAGING OF LIPID IN A RABBIT MODEL OF
ATHEROSCLEROSIS
Cross-sectional IVUS, 1200-nm IVPA and combined IVUS/IVPA images of the
diseased and normal (i.e., control) rabbit aortas are shown in Figure 2.6. All images cover
7.5 mm diameter areas. The IVUS images (Figure 2.6(a,d)) clearly demonstrate the
structure of the vessels. A thickened intima layer in the diseased aorta corresponds to the
hypoechoic regions in the IVUS image (Figure 2.6(a)). Combined IVUS/IVPA images
(Figure 2.6(c, f)) highlight the amplitude and location of photoacoustic signals in relation
to the arterial anatomy. Because the artery was irradiated externally, higher laser fluence
at the outer boundary of the artery resulted in higher photoacoustic response. Notice that
despite the exponential decline of laser fluence with imaging depth, photoacoustic signals
with relatively high amplitude were detected in the thickened intima layer of the diseased
aorta.
1180 1190 1200 1210 1220 1230 12400.2
0.4
0.6
0.8
1
1.2
1.4
1.6
1.8
Absorp
tion (
1/c
m)
Wavelength (nm)
lipid
2.1 mm
2.3 mm
2.5 mm
2.7 mm
1180 1190 1200 1210 1220 1230 12400.2
0.3
0.4
0.5
0.6
0.7
0.8
0.9
1
Norm
aliz
ed A
bsorp
tion
Wavelength (nm)
lipid
2.1 mm
2.3 mm
2.5 mm
2.7 mm
Blood
Lipid
2 m
m0
.8 m
m
(a) (b) (c)

36
Figure 2.6: Cross-sectional (a,d) IVUS, (b,e) 1200-nm IVPA, and (c,f) combined
IVUS/IVPA images of the diseased and normal aorta. The IVUS and IVPA
images are displayed using a 40 dB dynamic range.
The multi-wavelength photoacoustic response from several representative regions
of the aortas are presented in Figure 2.7. Specifically, a photoacoustic response in the
thickened intima (region 1, Figure 2.7(a)) is compared with that in the media-adventitia
of both the diseased (region 2, Figure 2.7(a)) and normal aorta (region 3, Figure 2.7(b)).
The signal amplitude in region 1 monotonically decreases with increased wavelength
(Figure 2.7(c)). This decreasing trend corresponds to the absorption spectrum of fatty
acid (Figure 1.8). Therefore, we assumed that photoacoustic signals in region 1 were
generated from the lipid-rich areas. In contrast, photoacoustic signal amplitudes from the
media-adventitia of both the diseased and normal aorta remain relatively constant – such
photoacoustic response in this spectral region closely corresponds to the optical
(a) (b) (c)
(d) (e) (f)
Dis
ease
dC
on
tro
l

37
absorption spectrum of water-based tissues. Therefore, lipid-rich regions in
atherosclerotic vessels may be detected by analyzing the multi-wavelength photoacoustic
signal, e.g. by differentiating areas with different spectral behavior of multi-wavelength
photoacoustic signals.
Figure 2.7: Cross-sectional IVPA images of (a) diseased and (b) normal aortas obtained
using 1200 nm wavelength. (c) Comparison of the wavelength-dependent
photoacoustic responses from the lipid-rich area of the atherosclerotic
plaque (region 1) and media-adventitial layer of diseased (region 2) and
normal (region 3) aortas.
Given the differences in tissue type-dependent spectral behavior of photoacoustic
signals, analysis of multi-wavelength IVPA images was performed to identify regions
with an enhanced content of lipid. The lipid-rich regions, i.e. regions with anticipated
spectroscopic behavior of lipid (Figure 2.7), were color-coded and plotted over co-
registered IVUS images (Figure 2.8(a) and Figure 2.8(d)). Clearly, lipid-rich regions
were detected in the thickened intima of the diseased aorta but no significant lipid-rich
regions were present in the normal aorta. The location of lipid-rich areas was further
confirmed by examination of tissue cross-sections adjacent to the imaged location. Both
the Oil red O stain for lipid (Figure 2.8 (b)) and H&E stain (Figure 2.8 (c)) show that the
plaques in the diseased aorta are lipid-rich, whereas no lipid was present in the intima of
1
2
1200 1205 1210 1215 1220 1225 1230
0.7
0.8
0.9
1
1.1
Wavelength (nm)
No
rma
lize
d P
ho
toa
co
ustic A
mp
litu
de
Region 1
Region 2
Region 3
3
(a) (b) (c)

38
the normal aorta (Figure 2.8 (e) and Figure 2.8(f)). Both normal and diseased aortas show
some lipid in the periadventia but this is unrelated to atherosclerosis. The Oil red O stain
of the diseased aorta shows diffuse distribution of the lipid deposits. A similar scattered
distribution of lipid is reflected in the spectroscopic IVPA image (Figure 2.8(a)). These
results suggest that spectroscopic IVPA imaging may be used to identify the lipid-rich
regions in atherosclerotic vessels.
Figure 2.8: Combined IVUS and spectroscopic IVPA images and corresponding
histological slices of the diseased atherosclerotic aorta (a-c) and normal (i.e.,
control) aorta (d-e). Lipid-rich regions (orange color) were identified from
multi-wavelength photoacoustic imaging and displayed over the IVUS
images. Lipid-rich regions were detected in the thickened intima layer of the
diseased aorta (a) confirmed by Oil red O stain for lipid (b) and H&E stain
(c). In contrast, spectroscopic IVPA imaging (d) and tissue histology (e and
f) show insignificant lipid-rich regions in normal rabbit aorta. Both normal
and diseased aortas show some insignificant deposits of lipid in the
periadventitia.
(a) (b) (c)
(d) (e) (f)
Dis
ease
dC
on
tro
l

39
2.4 DISCUSSION AND CONCLUSION
To quantitatively evaluate the optical absorption property of tissue based on the
photoacoustic response, wavelength dependent optical properties of tissues need to be
taken into account.[9]. In this chapter, a narrow wavelength range of 1200–1230 nm was
used for IVPA imaging to minimize the effect of wavelength-dependent optical
properties on the spectroscopic IVPA data analysis. The narrow imaging wavelength
range benefited the spectroscopic analysis in two ways. First, the limited range of IVPA
imaging wavelength guaranteed the nearly linear decline of the photoacoustic signal from
lipid-rich regions within 1200–1230 nm. Second, the effect of wavelength-dependent
laser fluence distribution was minimal and thus did not significantly affect the relative
changes of the photoacoustic signal amplitude.
The photoacoustic response of the suspected lipid-rich region in the diseased aorta
followed a monotonic decrease in the 1200–1230 nm range (region 1 in Fig. 5). However,
other researchers have found that fatty acid, pork lard and human fat have an absorption
peak at around 1210 nm wavelength [4, 16]. The discrepancy between multi-wavelength
photoacoustic signal amplitude and the optical absorption spectrum of lipid may be due
to several factors including the wavelength dependent fluence distribution in the tissue,
the spectral line width of the laser source, the mixture of lipid and other tissue types in
the intima of the diseased aorta, the small inaccuracy in the reported wavelength of our
OPO laser, and the differences in the absorption spectrum between fatty acid and lipid in
plaques. To capture the peak absorption of the lipid, the artery should be imaged within,
for example, 1170–1230 nm range to include anticipated peak absorption – our pulsed
laser system was operating at the spectral edge of its idler mode (1200 nm to 2400 nm)
and did not allow such measurements. However, if the measurements are performed
around the peak optical absorption of tissue, other correlation based methods, e.g.

40
intraclass correlation analysis [17], may provide better sensitivity than the slope-based
method. Nevertheless, the slope-based method is computationally efficient and is less
sensitive to the shift or shape change of the measured photoacoustic signal peak caused
by wavelength dependent optical properties. The slope-based algorithm only requires
imaging at several wavelengths thus shortening the imaging time and reducing the
complexity of image processing. In comparison, the correlation-based methods may
require measurements covering a broader range of wavelengths and resulting in larger
datasets.
The parameters of the slope-based spectroscopic analysis were selected based on
the optical absorption spectrum of fatty acid. After the peak absorption at 1210 nm
wavelength, the absorption coefficient of fatty acid drops 60% as the wavelength
increases to 1230 nm. Considering the smoothing effect of spectral line width of the laser
source, we selected the slopes ranging between –0.02/nm to –0.007/nm to represent lipid-
rich areas. Given the wavelength dependent fluence distribution and laser pulse energy
variation, we used a 20% error per wavelength to tolerate the change in the photoacoustic
signal amplitude.
The false positive signals in the normal aorta and the media-adventitial layer of
the diseased aorta may be due to inaccuracies in tissue displacement estimation due to
out-of-plane motion during mechanical rotation of the tissue sample. The normal aorta
was more likely subject to this type of artifact because it was more flexible compared to
the diseased aorta characterized by a thick vessel wall. However, compensation for tissue
motion may become even more critical in spectroscopic IVPA imaging in vivo because
cardiac motion will introduce tissue displacement between multi-wavelength IVPA scans.
The sensitivity and specificity of the measurements were affected by the laser
system and the limited knowledge of optical properties of arterial tissue. Because the

41
OPO laser was operating at the spectral edge of its idler mode, the line width of the laser
pulse was around 10 nm. Such broad line width may reduce the sensitivity for imaging
lipid, which has a sharp absorption peak. Using a laser with a narrower spectral line
width may increase the sensitivity and reduce the required laser energy to detect lipid-
rich regions in the vessels. Because of limited available measurements of optical spectra
of different tissue types in the wavelength around 1200 nm, we generally classify tissues
into two categories: lipid-rich tissues or water-based tissues. Knowledge of the absorption
spectra of lipid and other tissue will improve the specificity of identifying lipid-rich
regions.
Using integrated IVUS/IVPA catheter, high sensitivity and high resolution
spectroscopic IVPA imaging in vivo is possible [18]. Indeed, the low optical scattering of
blood and arterial tissue around 1200 nm wavelength ensures sufficient penetration depth
in IVPA imaging [14]. The higher threshold of the maximum permissible exposure at this
wavelength range reduces the concern of laser thermal damage [19]. Moreover, IVPA
imaging with a high frequency IVUS transducer can achieve axial resolution of tens of
micrometers. Since modest low-pass filtering was applied in spectroscopic IVPA
imaging, the axial resolution of the spectroscopic IVPA image is decreased by 2-3 times
compared to the axial resolution of the IVPA image alone.
In the future, quantitative studies will be performed to examine the agreement
between lipid-rich regions identified from spectroscopic IVPA and histological stain.
Furthermore, human atherosclerotic lesions tend to have more complex plaques.
Therefore, the performance of spectroscopic IVPA to differentiate various tissue types
including lipid needs to be studied.
In conclusion, a method to differentiate lipid-rich regions in atherosclerotic
vessels using spectroscopic IVPA imaging together with IVUS imaging was introduced.

42
Ex vivo tissue studies demonstrated that the spectroscopic IVPA imaging in the 1200-
1230 nm wavelength range can successfully identify lipid-rich regions in the
atherosclerotic rabbit aorta. Generally, spectroscopic IVPA imaging has the potential to
identify tissue composition based on intrinsic optical absorption contrast between various
types of tissues.
2.5 REFERENCES
[1] E. Falk, "Pathogenesis of Atherosclerosis," J Am Coll Cardiol, 47(8_Suppl_C),
pp. C7-12, April 18, 2006 (2006).
[2] D. Vela, L. Buja, M. Madjid, A. Burke, M. Naghavi, J. Willerson, S. Casscells,
and S. Litovsky, "The role of periadventitial fat in atherosclerosis," Archives of
pathology & laboratory medicine, 131(3), p. 481, (2007).
[3] A.A.Oraevsky and A.A.Karabutov, Optoacoustic tomography vol. 34: CRC Press,
2003.
[4] C. L. Tsai, J. C. Chen, and W. J. Wang, "Near-infrared absorption property of
biological soft tissue constituents," Journal of Medical and Biological
Engineering, 21(1), pp. 7-14, (2001).
[5] T. J. Allen and P. C. Beard, "Photoacoustic characterisation of vascular tissue at
NIR wavelengths," Proceedings of SPIE, 7177p. 71770A, (2009).
[6] F. D. Kolodgie, A. S. Katocs, Jr, E. E. Largis, S. M. Wrenn, J. F. Cornhill, E. E.
Herderick, S. J. Lee, and R. Virmani, "Hypercholesterolemia in the rabbit induced
by feeding graded amounts of low-level cholesterol: methodological
considerations regarding individual variability in response to dietary cholesterol
and development of lesion type," Arterioscler Thromb Vasc Biol, 16(12), pp.
1454-1464, December 1, 1996 (1996).
[7] B. Wang, J. L. Su, J. Amirian, S. H. Litovsky, R. Smalling, and S. Emelianov,
"Detection of lipid in atherosclerotic vessels using ultrasound-guided
spectroscopic intravascular photoacoustic imaging," Opt. Express, 18(5), pp.
4889-4897, (2010).

43
[8] H. F. Zhang, K. Maslov, G. Stoica, and L. V. Wang, "Functional photoacoustic
microscopy for high-resolution and noninvasive in vivo imaging," Nature
Biotechnology, 24pp. 848-851, (2006).
[9] J. Laufer, D. Delpy, C. Elwell, and P. Beard, "Quantitative spatially resolved
measurement of tissue chromophore concentrations," Physics in Medicine and
Biology, 52pp. 141-168, (2007).
[10] K. Maslov and et al., "Effects of wavelength-dependent fluence attenuation on the
noninvasive photoacoustic imaging of hemoglobin oxygen saturation in
subcutaneous vasculature in vivo," Inverse Problems, 23(6), p. S113, (2007).
[11] H. P. Brecht, D. S. Prough, Y. Y. Petrov, I. Patrikeev, I. Y. Petrova, D. J. Deyo, I.
Cicenaite, and R. O. Esenaliev, "In vivo monitoring of blood oxygenation in large
veins with a triple-wavelength optoacoustic system," Optics Express, 15(24), pp.
16261-16269, (2007).
[12] S. Mallidi, T. Larson, J. Tam, P. P. Joshi, A. Karpiouk, K. Sokolov, and S.
Emelianov, "Multiwavelength Photoacoustic Imaging and Plasmon Resonance
Coupling of Gold Nanoparticles for Selective Detection of Cancer," Nano Letters,
9(8), pp. 2825-2831, (2009).
[13] S. Kim, S. Park, S.R. Aglyamov, M. O'Donnell, and S. Y. Emelianov,
"Improvement of displacement estimation using autocorrelation," Proc.
International Conference on the Ultrasonic Measurement and Imaging of Tissue
Elasticity, p. 58, (2008).
[14] A. Roggan, M. Friebel, K. Dorschel, A. Hahn, and G. Muller, "Optical Properties
of Circulating Human Blood in the Wavelength Range 400--2500 nm," Journal of
Biomedical Optics, 4(1), pp. 36-46, (1999).
[15] Prahl, S. A. "Optical properties spectra compiled by Scott Prahl." 2009, from
http://omlc.ogi.edu/spectra/.
[16] R. R. Anderson, W. Farinelli, H. Laubach, D. Manstein, A. N. Yaroslavsky, J.
Gubeli 3rd, K. Jordan, G. R. Neil, M. Shinn, and W. Chandler, "Selective
photothermolysis of lipid-rich tissues: a free electron laser study," Lasers in
Surgery and Medicine, 38(10), pp. 913-9, (2006).
[17] S. Mallidi, T. Larson, J. Tam, P. Joshi, A. Karpiouk, K. Sokolov, and S.
Emelianov, "Multiwavelength photoacoustic imaging and plasmon resonance
coupling of gold nanoparticles for selective detection of cancer," Nano letters,
(2009).

44
[18] A.B. Karpiouk, B. Wang, and S. Y. Emelianov, "Development of a catheter for
combined intravascular ultrasound and photoacoustic imaging," Review of
Scientific Instruments, 81(014901), pp. 1-7, (2010).
[19] L. I. o. American, "American National Standard for Safe Use of Lasers," vol.
ANSI Z136.1-2007, ed: American National Standards Institute, Inc., 2007.

45
Chapter 3: Plasmonic gold nanoparticles (Au NPs) as contrast agent
for IVPA imaging of phagocytically active macrophages
3.1 INTRODUCTION
Atherosclerosis is an inflammatory disease. Many risk factors for cardiovascular
disease, such as hypercholesterolemia, hypertension, diabetes or obesity, can be directly
related to the inflammatory process [1]. Monocyte derived macrophages are the primary
players in the physiological responses to inflammation. Monocytes first enter the intimal
layer of the vessel wall through disrupted endothelium, and derive into phagocytically
active macrophages. Activated macrophages engulf modified low density lipoprotein
(LDL) particles through scavenger receptors and LDL receptors [2], and become foam
cells. Foam cells undergo apoptosis and release the internalized lipids into the vessel
wall, which turn into the lipid pool [3]. Plaque regions containing active macrophages
indicate ongoing inflammation processes and are prone to rupture [4].
The goal of this chapter is to demonstrate through in vitro cell studies that
phagocytically active macrophages can be imaged using contrast enhanced IVPA
imaging.
3.2 AU NPS AS A CONTRAST AGENT FOR PHOTOACOUSTIC IMAGING
Plasmonic gold nanoparticles are attractive candidates as contrast agents for
photoacoustic imaging because of their large optical absorption cross-sections per
volume, superior biocompatibility, and tunable plasmon resonance peak [5-7]. Plasmonic
Au NPs are not subject to photo bleaching like many kinds of dyes, thus can be reliably
imaged using photoacoustic imaging [8]. Spherical Au NPs have a plasma resonance
peak around 530 nm, which is not preferable for in vivo imaging, because the high optical
scattering of tissue and the high optical absorption of blood. Gold nanorods, on the other

46
hand, have two plasmon resonance peaks – one around 530 nm, the other peak can be
tuned to the near infrared wavelength range by changing particles aspect ratio [9]. The
high optical absorption of gold nanorods in the near infrared range is favorable for
photoacoustic imaging because larger imaging depths can be achieved with relatively low
blood absorption. Gold nanoshells that have a broad absorption spectrum were also used
in optical based imaging or photothermal therapy [7, 10]. Moreover, antibodies that target
specific biomarkers can be bio-conjugated to the surface of the particles to achieve active
delivery of the contrast agent [11]. In this chapter, spherical Au NPs with a diameter
under 50 nm were used to image macrophages.
Photoacoustic signals can be generated by irradiating Au NPs with laser pulses
with a duration from several to tens of nanoseconds [8, 12]. It is interesting to look into
the photoacoustic signal generation mechanism. Apparently, for nanostructures,
nanosecond-duration laser pulses do not satisfy the thermal or stress confinement
requirements for photoacoustic signal generation. The acoustic signals can be generated
by microbubbles formed by boiling water surrounding the particle [13]. It turns out the
bubble generation mechanism is very different at the nano-scale comparing to at the
micro-scale. Because of greater surface tension of water around particles with a diameter
in the nanometer range, very high fluence is required for bubble generation [14].
However, bubbles are unlikely to be generated under the laser fluence used for
photoacoustic imaging, which is usually under the ANSI standard of laser exposure
threshold for skin (typically 15 mJ/cm2 in the visible wavelength range) [15].
Photoacoustic signals from the medium containing NPs can be generated through thermal
expansion mechanism. Once the laser energy has been absorbed by a nanoparticle, heat
will be generated and conduct to the medium surrounding the nanoparticle. Therefore,
photoacoustic signals will be produced by the particle and its intermediate surrounding

47
medium. The temperature profile around Au NPs determines the amplitude of
photoacoustic signal. As a result, photoacoustic signal amplitude not only depends on the
optical absorption property of Au NPs, but also on the thermal properties of the medium
surrounding the particles [16].
3.3 IMAGING PHAGOCYTICALLY ACTIVE MACROPHAGES USING AU NPS
3.3.1 Imaging system
The IVUS/IVPA imaging system for cell study is shown in Figure 3.1. During
imaging, the sample was placed in a water cuvette filled with saline. The IVPA images of
the phantom were obtained using either a 532 nm wavelength Nd:YAG laser or an OPO
laser system (OPOTEK, Inc.) tunable within 680-750 nm, respectively. Both laser
systems produced 4-7 ns pulses. The photoacoustic signals generated by each laser pulse
were collected with a 40 MHz single element IVUS transducer (Boston Scientific, Inc.)
inserted into the lumen of the modeled vessel. The radio frequency (RF) data were
digitized at 200 MHz with data acquisition card (CompuScope 14200, GAGE, Inc.).
After a 9 µs user defined time delay, an ultrasound signal was generated and received by
the same transducer. Once the photoacoustic and ultrasound signals were acquired, the
sample was then rotated around the longitudinal axis to a new angular position using a
stepper motor. As the phantom was rotated 360°, co-registered IVUS and IVPA images
of the vessel’s cross-section were collected.

48
Figure 3.1: Intravascular photoacoustic (IVPA) and intravascular ultrasound (IVUS)
imaging system setup.
3.3.2 In vitro cell experiment
3.3.2.1 Plasmon resonance coupling of Au NPs in macrophages
Fifty nanometer diameter spherical Au NPs (Figure 3.2 (a)) were synthesized via
citrate reduction of HAuCl4 under reflux [17]
. To passivate the surface of NPs, the NPs
were coated with methoxy-polyethylene glycol-thiol (mPEG-SH): a small volume of
104M mPEG-SH solution (MW 5kD, Shearwater) was added to the gold suspension and
allowed to react for 30 minutes on shaker. After incubation, a small volume of 2% PEG
polymer (MW 15 kD, Sigma) was added to the mixture as a surfactant to prevent
aggregation of NPs during centrifugation.
Mouse monocytes – macrophages (J774A.1 cell line) are characterized by a high
rate of non-specific uptake, similar to most cells of a macrophage phenotype. Cells were
cultivated in DMEM supplemented with 5% FBS at 37°C in 5% CO2. To load cells with
Au NPs, macrophages were incubated with a suspension of PEGylated nanoparticles
(approximately 4·1010 particles/ml) in phenol red free and serum free DMEM overnight
(Figure 3.2(b,c)). The optical density of the incubating medium was measured at 530 nm

49
wavelength before and after incubation to calculate the number of particles internalized
by cells. Then, macrophages were counted using a cell counting chamber under the
microscope. The concentration of particles per cell was later determined by dividing the
number of nanoparticles by the number of cells.
Figure 3.2: (a) STEM image of Au NPs. (b) Darkfield reflectance images of murine
macrophages. (c) Murine macrophages loaded with Au NPs. The darkfield
optical images (b,c) were obtained using Xe illumination and a 20x
darkfield objective (0.5 NA).
The absorbance spectra of NP suspension, NP loaded macrophages, and
macrophages only were measured using a UV-Vis spectrometer (BioTek) (Figure 3.3).
The particle suspension has an absorbance peak at 530 nm, whereas cells loaded with
particles have an absorbance peak around 540 nm. Also, the absorbance peak of cells
loaded with particles is broader than the peak of NP suspension. The red-shift and
spectral broadening are attributed to plasmon resonance coupling of particles inside the
macrophages [18-20]
. These features show that the NPs taken by macrophages are in an
aggregated state.
50 um 50 um50 nm
(a) (b) (c)

50
Figure 3.3: Normalized extinction spectra of Au NPs (dashed line) and macrophages
loaded with Au NPs (solid line). Both absorption spectra were normalized
with their corresponding maxima.
3.3.2.2 IVUS/IVPA imaging of cell phantom
A vessel mimicking phantom (Figure 3.4) was made to test whether Au NPs can
be used as contrast agents in IVPA imaging. To simulate the arterial wall, a 25 mm long
and 6 mm in diameter cylindrical tube was made out of 8% polyvinyl alcohol mixed with
0.4% silica by weight to mimic the optical and acoustic scattering of tissue [21]
. Within
the phantom wall, four compartments near and around the lumen were made. Each of the
four compartments was filled with 10% gelatin gel containing either 1) Au NPs (2∙1011
NPs per ml), 2) gelatin only, 3) murine macrophages loaded with Au NPs (1∙104 - 6∙104
NPs per cell, 2∙1011 NPs per ml), or 4) murine macrophages without Au NPs. The last
two compartments, containing an equal number of cells, simulated the macrophage-rich
atherosclerotic plaques before and after the intravenous injection of Au NPs. The PVA
400 450 500 550 600 650 700 750 8000
0.1
0.2
0.3
0.4
0.5
0.6
0.7
0.8
0.9
1
Wavelength (nm)
No
rma
lize
d a
bso
rptio
n in
ten
sity

51
and gelatin gel simulated healthy tissue, and the compartment with Au NPs simulated
segregated Au NPs in blood stream. An IVPA image of the phantom was collected at
532 nm wavelength to verify the phantom’s composition. Then, a tunable OPO laser
operating from 680 nm to 750 nm wavelength was used for IVPA imaging.
Figure 3.4: (a) Vessel mimicking phantom with four compartments. Different
compartment were injected with cells suspended in gelatin or gelatin alone.
(b) Cross-sectional view of the phantom.
The IVUS, IVPA and combined IVUS/IVPA images of the same cross-section of
the phantom are shown in Figure 3.5 [22]. Images presented in Figure 3.5(b)-(c) were
collected at 532 nm wavelength, and images in Figure 3.5(e)-(f) were collected at
680 nm. In the IVUS image (Figure 3.5(d)), the compartments filled with macrophages
are characterized by the presence of a weak echo signal (small intensity of grayscale
ultrasound). Neither gelatin nor Au NPs affect contrast in ultrasound images – low
concentrations of Au NPs cannot be seen directly from IVUS images. At 532 nm
wavelength, both isolated Au NPs and the nanoparticles aggregated inside of the
macrophages have high contrast in the IVPA image (Figure 3.5(b)). However, the IVPA
image alone may not provide sufficient anatomical information. By combining the IVUS
1mm
(a) (b)

52
and IVPA images (Figure 3.5(c)), the location of Au NPs can be identified and the
composition in each compartment can be further inferred. At 680 nm wavelength (Figure
3.5(e)), only the compartment filled with NP loaded macrophages produces photoacoustic
signal. This is due to the elevated absorption of aggregated NPs at this wavelength
(Figure 3.3). In contrast, the signal from the compartment filled with suspended Au NPs
is very weak and below the noise level of the imaging system. The high photoacoustic
signal strength from the aggregated NPs compared to the non-aggregated or suspended
NPs suggests that only Au NPs internalized by the macrophages will provide contrast in
clinical IVPA imaging performed using 680 nm wavelength. Indeed, the photoacoustic
response from macrophages is enhanced once the Au NPs are endocytosed. At the same
time, the IVPA imaging at this wavelength can be used to avoid imaging of non-
aggregated Au NPs, such as NPs circulating in the luminal blood. Finally, imaging in this
spectral range reduced the influence of optical absorption of luminal blood.

53
Figure 3.5: The structure (a) and the IVUS image (d) of the tissue mimicking phantom.
The IVPA images of the same cross-section of the phantom were taken at
532 nm wavelength (b) and 680 nm wavelength (e). The combined IVUS
and IVPA images of the phantom (c: 532 nm wavelength and f: 680 nm
wavelength) indicated the origin of the photoacoustic responses in IVPA
images.
Multi-wavelength IVPA imaging was performed to further confirm the presence
of aggregated particles and to differentiate labeled macrophages from other tissue
constituents such as red blood cells or lipids. The phantom was imaged every 10 nm
within the 680-750 nm wavelength range. Figure 3.6 [22] shows the quantitative behavior
of the wavelength-dependent photoacoustic response from specific parts of the phantom:
macrophages loaded with Au NPs, 10% gelatin and PVA. The highest normalized energy
of the IVPA signal was detected from NP-loaded macrophages at 680 nm wavelength. As
the wavelength increases, the IVPA signal amplitude from NP-loaded macrophages
NPs
Gelatin
Macrophages
Macrophages
loaded with NPs
Lumen
(a) (b) (c)
(d) (e) (f)

54
decreases. This measurement qualitatively correlates with the direct measurements of
absorbance spectrum from labeled macrophages (Figure 3.3). In contrast, the
photoacoustic response from gelatin gel and PVA is much lower and increases with
optical wavelength. This trend of increasing photoacoustic signal strength with increasing
wavelength is typical of many soft tissues including blood, muscle and fat. Since the
absorption spectrum of arterial tissue behaves differently from aggregated Au NPs at
wavelengths from 680 nm to 750 nm, Au NPs and, therefore, labeled macrophages may
be distinguished by multi-wavelength IVPA imaging.
Figure 3.6: Strength of the photoacoustic signal at different wavelength measured from
the small regions containing macrophages loaded with Au NPs, gelatin gel
and PVA. Each spectrum is normalized to the maximum signal strength
from Au NPs loaded macrophages at 680 nm wavelength.
680 690 700 710 720 730 740 7500.2
0.3
0.4
0.5
0.6
0.7
0.8
0.9
1
Wavelength (nm)
No
rma
lize
d e
ne
rgy
Macrophages loaded with Au NPs
Gelatin gel
PVA

55
3.3.3 Experiment using ex vivo tissue injected with Au NP-labeled macrophages
To further demonstrate that IVPA imaging with Au NPs can be used for imaging
of macrophages in atherosclerotic plaques, ex vivo tissue experiments were performed on
a diseased rabbit aorta. A section of the aorta was extracted from a rabbit that subjected
to high cholesterol diet for 3 months. Macrophages loaded with Au NPs (approximately
4∙104
nanoparticles per cell) were mixed with gelatin (2∙107 cells per ml) and injected into
the outer and inner boundary of the aorta. The sample was imaged by the same
IVPA/IVUS imaging system used in phantom experiments. The hypoechoic regions in
the IVUS image, denoted by green arrows in Figure 3.7(a,b,e) indicate the areas of the
injection of macrophages loaded with Au NPs. IVPA images of this cross-section were
taken at 700 nm, 750 nm and 800 nm wavelengths. As shown in Figure 3.7 [22], Au NPs
produce the strongest photoacoustic signal when irradiated with laser pulses at 700 nm
wavelength. At a laser fluence of 15 mJ/cm2, the particles produce readily detectable
photoacoustic signal from the laser light traveling through more than 1 mm of the arterial
tissue. As the wavelength increased, the photoacoustic signal strength from Au NPs
decreased – the photoacoustic response is hardly visible at 800 nm wavelength. This
decreasing trend of photoacoustic signal magnitude closely corresponds to the absorbance
spectra of aggregated Au NPs. Therefore, the ex-vivo tissue experiment demonstrates the
ability of IVPA imaging to detect macrophages loaded with Au NPs.

56
Figure 3.7: IVUS, IVPA and combined IVUS/IVPA images of a diseased rabbit aorta
injected with macrophages loaded with Au NPs. The IVUS image (panel
(a)) is displayed using a 50 dB dynamic range. The injected macrophages in
the outer and inner regions of the aorta are denoted in the images (a, b, e)
with green arrows. The normalized IVPA images (panels (b)-(d)) and
combined IVUS/IVPA images (panels (e)-(g)) obtained using 700 nm,
750 nm and 800 nm wavelengths are displayed using 20 dB display dynamic
range. The IVPA and combined IVUS/IVPA images taken at 700 nm
wavelength (panels (b) and (e)) showed high photoacoustic signals at the
injected regions denoted by arrows.
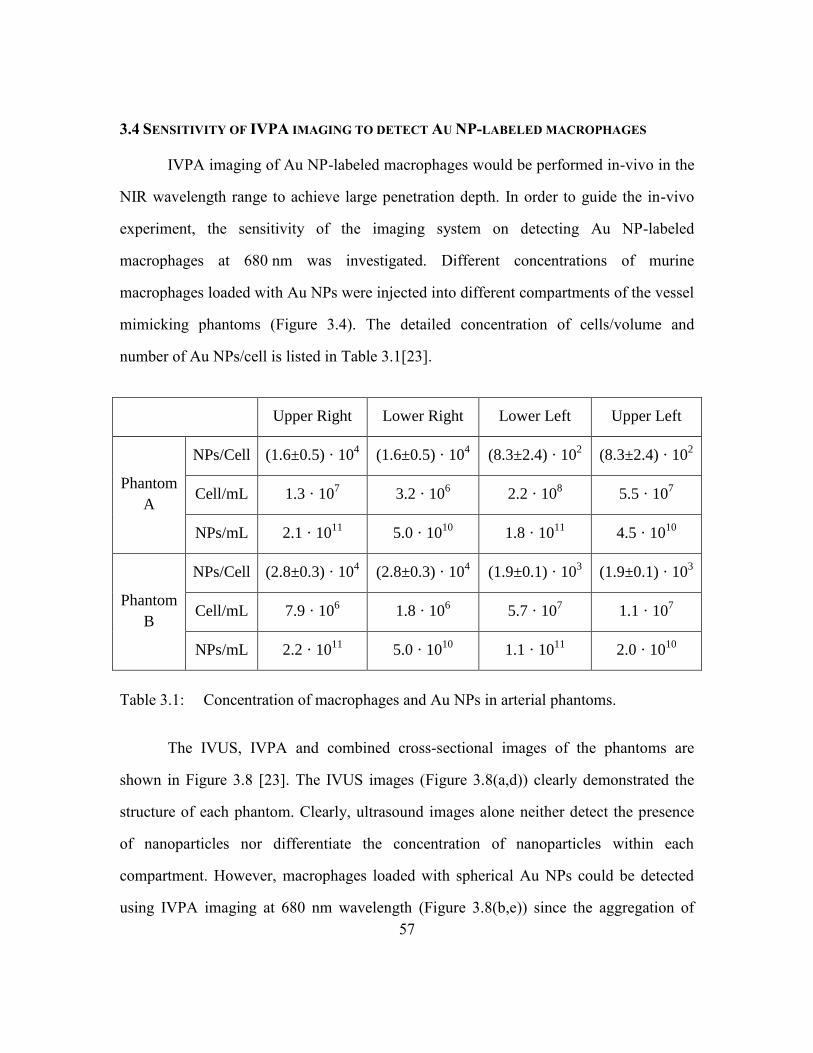
57
3.4 SENSITIVITY OF IVPA IMAGING TO DETECT AU NP-LABELED MACROPHAGES
IVPA imaging of Au NP-labeled macrophages would be performed in-vivo in the
NIR wavelength range to achieve large penetration depth. In order to guide the in-vivo
experiment, the sensitivity of the imaging system on detecting Au NP-labeled
macrophages at 680 nm was investigated. Different concentrations of murine
macrophages loaded with Au NPs were injected into different compartments of the vessel
mimicking phantoms (Figure 3.4). The detailed concentration of cells/volume and
number of Au NPs/cell is listed in Table 3.1[23].
Upper Right Lower Right Lower Left Upper Left
Phantom
A
NPs/Cell (1.6±0.5) · 104 (1.6±0.5) · 10
4 (8.3±2.4) · 10
2 (8.3±2.4) · 10
2
Cell/mL 1.3 · 107 3.2 · 10
6 2.2 · 10
8 5.5 · 10
7
NPs/mL 2.1 · 1011
5.0 · 1010
1.8 · 1011
4.5 · 1010
Phantom
B
NPs/Cell (2.8±0.3) · 104 (2.8±0.3) · 10
4 (1.9±0.1) · 10
3 (1.9±0.1) · 10
3
Cell/mL 7.9 · 106 1.8 · 10
6 5.7 · 10
7 1.1 · 10
7
NPs/mL 2.2 · 1011
5.0 · 1010
1.1 · 1011
2.0 · 1010
Table 3.1: Concentration of macrophages and Au NPs in arterial phantoms.
The IVUS, IVPA and combined cross-sectional images of the phantoms are
shown in Figure 3.8 [23]. The IVUS images (Figure 3.8(a,d)) clearly demonstrated the
structure of each phantom. Clearly, ultrasound images alone neither detect the presence
of nanoparticles nor differentiate the concentration of nanoparticles within each
compartment. However, macrophages loaded with spherical Au NPs could be detected
using IVPA imaging at 680 nm wavelength (Figure 3.8(b,e)) since the aggregation of

58
NPs inside the macrophages shifts the peak and broadens the absorption spectra of Au
NPs. However, given the finite sensitivity of the IVPA imaging system, macrophages
could be reliably imaged once both the concentration of NPs/cell and concentration of
cells within a volume reaches certain level. Indeed, for both phantoms irradiated at a laser
fluence around 11 mJ/cm2, the upper right and lower right compartments generated a
photoacoustic signal strong enough to be detected by the imaging system. Interestingly,
the signal strength was not correlated with the concentration of particles per volume, but
was determined by the number of particles in each cell. As shown in Table 3.1, the lower
left compartments in both phantoms have higher numbers of NPs per volume than the
lower right compartments. However, the photoacoustic signals generated from the lower
left compartments were weaker than the signals from the lower right compartments.
Similarly, in Phantom A, the upper right and lower left compartments contain about the
same number of particles per volume, but the macrophages in the lower left compartment
did not generate photoacoustic signals of the same strength as the macrophages in the
upper right compartment. This is because the number of particles per cell in the lower left
compartment was too low although the cell concentration in the lower left compartment
was more than ten times higher than the upper right compartment. Imaging results from
Phantom B (Figure 3.8(d-f)) further confirmed that the amplitude of photoacoustic
signals is more related with the size of Au NPs cluster inside macrophages but not the
particle concentration. Due to close distance between Au NPs inside a cluster, the laser-
induced temperature profiles of single particles spatially overlap with each other. As a
result, local hot spots may be generated inside particle clusters, and further enhance the
photoacoustic signal from cells loaded with Au NPs [24].

59
Figure 3.8: IVUS images (a,d), IVPA images (b,e) and combined IVPA/IVUS images
(c,f) of the vessel phantoms with plaque mimicking compartments. IVUS
images are displayed using a 40 dB dynamic range. IVPA images, obtained
using 680 nm wavelength, are displayed using a 20 dB dynamic range.
The results presented in Figure 3.8 showed that the IVPA imaging system
operating at 680 nm wavelength can detect the macrophages loaded with nanoparticles
when the concentration of particles is around 1.5·104 NPs/cell and the concentration of
cells is around 1.3·107 cells/mL (lower right compartments of phantom A and and
phantom B). This concentration of Au NPs corresponds to 0.015 µmol/mL of gold. The
sensitivity of intravascular photoacoustic imaging is higher compared to the detection
limit of ferromagnetic nanoparticles in MRI (within 0.089-0.893 µmol/mL of iron [25]).
3.5 VIABILITY OF AU NP-LABELED CELLS EXPOSED TO PULSED LASER RADIATION
Increasing the laser energy would increase the detection limit of the IVPA
imaging system. However, heat generated by Au NPs because of optical absorption may
cause cell death. We have initially tested the safety of IVPA imaging with the laser
Ph
an
tom
A
(a) (b) (c)
Ph
an
tom
B
(d) (e) (f)

60
source operating in the near infrared range using Au NP loaded macrophages. The
concentration of NPs/cell was around 104. A single layer of macrophage cells was
irradiated with 50 laser pulses at 680 nm wavelength. After laser irradiation,
macrophages were stained with fluorescein diacetate (FDA) – live cells should exhibit the
florescence while the damaged cells should not. The cells showed metabolic activity and
membrane integrity with a laser irradiation as high as 114 mJ/cm2 (Figure 3.9(a)). At a
fluence of 344 mJ/cm2, cell death was observed within the region corresponding to the
irradiation area of the laser beam (Figure 3.9(b)). The macrophages loaded with NPs
remain alive after laser irradiation around 10 times of the laser energy used in the IVPA
imaging experiment (Figure 3.8). Therefore, IVPA imaging of Au NP labeled
macrophages in the NIR wavelength range will not cause cell death.
Figure 3.9: Viability of macrophages loaded with NPs and irradiated with 50 pulses at
680 nm wavelength: a) cells remain viable after irradiation at laser fluencies
reaching 114 mJ/cm2, b) cell death was observed for 344 mJ/cm2 laser
fluence. To cover the extent of the laser beam, the image in Figure 3.9(b)
was assembled from several optical images due to the limited field of view
of the optical microscope.
(a) (b)

61
3.6 CONCLUSION
Contrast enhanced IVPA imaging of in-vitro macrophages have been studied. The
results demonstrated that plasmon resonance coupling of Au NPs internalized by
macrophages broadened the optical absorption spectrum of the Au NP-labeled
macrophages. Utilizing this spectrum change, IVPA imaging in the NIR wavelength
range can selectively identify contrast agent labeled (phagocytically active) macrophages
but not isolated Au NPs. Au NP-labeled macrophages were also injected into a vessel
sample to demonstrate the possibility of identify Au NP-labeled macrophages in the
tissue environment. In all, cell experiments showed that IVPA imaging has the potential
to image phagocytically active macrophages located inside atherosclerotic plaques with
high specificity and sensitivity. Moreover, IVPA imaging of Au NP-labeled macrophages
does not induce tissue damage.
3.6 REFERENCES
[1] P. Libby, "Inflammation in atherosclerosis," Nature, 420(6917), pp. 868-874,
(2002).
[2] D. Steinberg, "Thematic review series: The Pathogenesis of Atherosclerosis. An
interpretive history of the cholesterol controversy, part III: mechanistically
defining the role of hyperlipidemia," Journal of Lipid Research, 46(10), pp. 2037-
2051, October 1, 2005 (2005).
[3] M. Naghavi, P. Libby, E. Falk, S. W. Casscells, S. Litovsky, J. Rumberger, J. J.
Badimon, C. Stefanadis, P. Moreno, and G. Pasterkamp, "From vulnerable plaque
to vulnerable patient a call for new definitions and risk assessment strategies: Part
I," Circulation, 108(14), pp. 1664-1672, (2003).
[4] E. Falk, P. K. Shah, and V. Fuster, "Coronary plaque disruption," Circulation,
92(3), pp. 657-671, (1995).
[5] P. Alivisatos, "The use of nanocrystals in biological detection," Nature
Biotechnology, 22pp. 47-52, (2004).

62
[6] C. J. Murphy, A. M. Gole, J. W. Stone, P. N. Sisco, A. M. Alkilany, E. C.
Goldsmith, and S. C. Baxter, "Gold Nanoparticles in Biology: Beyond Toxicity to
Cellular Imaging," Acc Chem Res, (2008).
[7] J. L.West and N. J. Halas, "Engineered Nanomaterials for Biophotonics
Applications: Improving Sensing, Imaging, and Therapeutic," Annu. Rev. Biomed.
Eng., 5pp. 285-292, (2003).
[8] S. A. E. Andre Conjusteau, Dmitri Lapotko, Hongwei Liao, Jason Hafner,
Mohammad Eghtedari, Massoud Motamedi, Nicholas Kotov, Alexander A.
Oraevsky, "Metallic nanoparticles as optoacoustic contrast agents for medical
imaging," presented at the Proceedings of SPIE, 2006.
[9] S. Link, M. B. Mohamed, and M. A. El-Sayed, "Simulation of the Optical
Absorption Spectra of Gold Nanorods as a Function of Their Aspect Ratio and the
Effect of the Medium Dielectric Constant," J. Phys. Chem. B, 103pp. 3073-3077,
(1999).
[10] A. M. Gobin, M. H. Lee, N. J. Halas, W. D. James, R. A. Drezek, and J. L. West,
"Near-Infrared Resonant Nanoshells for Combined Optical Imaging and
Photothermal Cancer Therapy," Nano Letters, 7(7), (2007).
[11] K. Sokolov, J. Aaron, B. Hsu, D. Nida, A. Gillenwater, M. Follen, C. MacAulay,
K. Adler-Storthz, B. Korgel, and M. Descour, "Optical systems for in vivo
molecular imaging of cancer," Technol Cancer Res Treat, 2(6), pp. 491-504,
(2003).
[12] P. C. Li, C. R. C. Wang, D. B. Shieh, C. W. Wei, C. K. Liao, C. Poe, S. Jhan, A.
A. Ding, and Y. N. Wu, "In vivo photoacoustic molecular imaging with
simultaneous multiple selective targeting using antibody-conjugated gold
nanorods," Optics Express, 16(23), pp. 18605-18615, (2008).
[13] S. Egerev, S. Ermilov, O. Ovchinnikov, A. Fokin, D. Guzatov, V. Klimov, A.
Kanavin, and A. Oraevsky, "Acoustic signals generated by laser-irradiated metal
nanoparticles," Applied Optics, 48(7), pp. 38-45, (2009).
[14] E. Lukianova-Hleb, Y. Hu, L. Latterini, L. Tarpani, S. Lee, R. A. Drezek, J. H.
Hafner, and D. O. Lapotko, "Plasmonic Nanobubbles as Transient Vapor
Nanobubbles Generated around Plasmonic Nanoparticles," ACS nano, 4(4), pp.
2109-2123, (2010).
[15] L. I. o. American, "American National Standard for Safe Use of Lasers," vol.
ANSI Z136.1-2007, ed: American National Standards Institute, Inc., 2007.

63
[16] Y.-S. Chen, W. Frey, S. Kim, P. Kruizinga, K. Homan, and S. Emelianov, "Silica-
Coated Gold Nanorods as Photoacoustic Signal Nanoamplifiers," Nano Letters,
pp. null-null, (2011).
[17] K. R. Brown, D. G. Walter, and M. J. Natan, "Seeding of colloidal Au
nanoparticle solutions. 2. Improved control of particle size and shape," Chem.
Mater, 12(2), pp. 306-313, (2000).
[18] W. Rechberger, A. Hohenau, A. Leitner, J. R. Krenn, B. Lamprecht, and F. R.
Aussenegg, "Optical properties of two interacting gold nanoparticles," Optics
Communications, 220(1-3), pp. 137-141, (2003).
[19] K. Sokolov, J. Aaron, B. Hsu, D. Nida, A. Gillenwater, M. Follen, C. MacAulay,
K. Adler-Storthz, B. Korgel, M. Descour, R. Pasqualini, W. Arap, W. Lam, and
R. Richards-Kortum, "Optical Systems for In Vivo Molecular Imaging of
Cancer," Technology in Cancer Research & Treatment, 2(6), (2003).
[20] J. Aaron, N. Nitin, K. Travis, S. Kumar, T. Collier, S. Y. Part, M. Jose-Yacaman,
L. Coghlan, M. Follen, R. Richards-Kortum, and K. Sokolov, "Plasmon resonance
coupling of metal nanoparticles for molecular imaging of carcinogenesis in vivo,"
Journal of Biomedical Optics, 12(3), (2007).
[21] A. Kharine, S. Manohar, R. Seeton, R. G. M. Kolkman, R. A. Bolt, W.
Steenbergen, and F. F. M. Mul, "Poly (vinyl alcohol) gels for use as tissue
phantoms in photoacoustic mammography," Physics in Medicine and Biology,
48(3), pp. 357-370, (2003).
[22] B. Wang, E. Yantsen, T. Larson, A. B. Karpiouk, S. Sethuraman, J. L. Su, K.
Sokolov, and S. Y. Emelianov, "Plasmonic Intravascular Photoacoustic Imaging
for Detection of Macrophages in Atherosclerotic Plaques," Nano Lett, 9(6), pp.
2212–2217, (2009).
[23] B. Wang, E. Yantsen, K. Sokolov, and S. Emelianov, "High sensitivity
intravascular photoacoustic imaging of macrophages," in Proceedings of SPIE,
2009, p. 71770V.
[24] Yun-Sheng Chen, W. Frey, C. Bayer, S.-Y. Nam, and S. J. Yoon, Personal
discussion, (2010).
[25] H. Pardoe, W. Chua-anusorn, T. G. StPierre, and J. Dobson, "Detection limits for
ferrimagnetic particle concentrations using magnetic resonance imaging based
proton transverse relaxation rate measurements," Phys Med Biol, 48(6), pp. N89-
95, (2003).

64
Chapter 4: Detection of phagocytically active macrophages in a rabbit
model of atherosclerosis
As an intermediate step towards in-vivo IVPA imaging, ex vivo imaging of
macrophages were performed on atherosclerotic rabbit aortas with a bench-top IVPA
imaging system. Au NPs were injected in-vivo to label phagocytically active
macrophages. Slope based spectroscopic analysis was applied to extract signals generated
from Au-NP-labeled macrophages based on multi-wavelength IVPA images. Delivery
and bio-distribution of Au NPs was also investigated. Finally, simultaneous imaging of
active macrophages and deposits of lipid was achieved by spectroscopic IVPA imaging in
two NIR spectral ranges.
4.1 METHODS
4.1.1 Imaging system
The imaging system consists of an OPO laser tunable from visible to NIR
wavelength range (PRO-290-10, Spectra Physics). The spectral linewidth is within 2 nm
from 700 to 1300 nm wavelength, and output laser pulse duration is around 6-11 ns. A
pulser/receiver (5073PR, Olympus) was connected with a 40 MHz single element IVUS
catheter (Atlantis SR Pro, Boston Sci. Inc.). The IVUS catheter was inserted into the
vessel lumen. The transducer located at the tip of the IVUS catheter was aligned with the
laser beam (Figure 4.1). After each laser pulse, the IVUS catheter first received
photoacoustic signals generated from vessel. After a user defined 9 µs delay, the catheter
performed ultrasound pulse-echo imaging at the same position of the vessel. A stepper
motor (T-NM, Zaber) rotated the vessel to complete a cross-sectional scan. Each cross-
sectional image consisted of 256 beams. At each cross-section, combined IVPA/IVUS

65
imaging was performed from 710 to 770 nm wavelength, 20 nm step size. The energy of
each laser pulse was monitored by a power meter (Ophir, Inc.) to compensate for the
laser energy fluctuation. A linear axis (T-LSR, Zaber) moved the sample at a 0.25 µm
step size for the longitudinal scan along the vessel. All radio frequency data was digitized
by a 14 bit data acquisition card (GageScope 14200, GaGe) working at 200 MHz
sampling frequency.
Figure 4.1: Setup for the bench-top combined IVUS/IVPA imaging system.
Figure 4.2 and Figure 4.3 are the user interface and the flow chart of the data
acquisition program (based on LabWindowsTM) for acquiring combined IVUS/IVPA
images. The program features an automatic 3D multi-wavelength IVUS/IVPA scan and
tracking the energy of each laser pulse. Because the OPO and the pump laser have their
own stand alone controlling program, another LabWindows based program – OPO
CONTROL – was developed to control and synchronize the OPO (for wavelength tuning)
and pump laser (for tuning laser output energy) (Figure 4.4). The main scanning program
PulserReceiver
IVUS Catheter
Optical Fiber
1-D Motion Axis
Computer
Sample
Water Tank
Motor
Laser
Delay
Power Meter

66
(Figure 4.3) communicates with OPO CONTROL and the power meter through the
DataSocketTM server (National Instruments, Inc.). Each acquired photoacoustic signal
can be registered with its corresponding laser pulse energy by matching the receiving
time stamps from the data acquisition system and power meter.
Figure 4.2: User interface of the combined IVUS/IVPA imaging system.

67
Figure 4.3: Flow chart for spectroscopic IVUS/IVPA data acquisition.
Initialize motors, A/D card;Read laser parameters
Start
End of scan ?
Set laser parameters
A/D cardtriggered?
First cross-section?
Start recording laser power
RF data acquisition
Motion control
Y
N
End
N
Y
Y
N
OPO
Pump Laser
Wavelength
Energy

68
Figure 4.4: User interface of a custom developed program to control laser systems.
4.1.2 Synthesis and characterization of Au NPs
Twenty nanometer diameter spherical Au NPs were synthesized via citrate
reduction of HAuCl4 under reflux and PEGylated as discussed in section 3.2.2.1 (Figure
4.5). The PEGylated Au NPs have a hydrodynamic diameter of around 42.5 nm
(DelsaNano, Beckman Coulter).

69
Figure 4.5: STEM image of Au NPs.
4.1.3 Animal protocol
Balloon injured rabbit was used in this study. A one year old New Zealand white
rabbit was subjected to a 0.5% cholesterol diet for 2 weeks. Balloon injury was
performed with a 4F Fogarty embolectomy catheter with 5 passes on the aorta from the
4th
to 11th
rib. The rabbit was fed a 0.5% cholesterol diet for another 4 months before the
imaging experiment. During the imaging experiment, Au NPs with a dose of 27.3 mg
Au/kg of body weight was injected through the rabbit’s ear vein. Blood samples were
collected at different time points post particle injection for analyzing the plasma
circulation time of Au NPs. The rabbit was sacrificed 28 hours post contrast agent
injection, and the abdominal aorta was extracted and used for ex vivo imaging. Major
organs were harvested and used for the contrast agent bio-distribution study. All animal
experiments were approved by the Animal Welfare Committee of the University of Texas
Health Science Center at Houston, and the Institutional Animal Care and Use Committee
of the University of Texas at Austin.
20 nm

70
4.1.4 Isolation of mononuclear cells from whole blood
Cell separation was performed within 2 hours after sampling the blood. Two mL
of whole blood was diluted with 2 mL of PBS, and then carefully layered on top of 4 mL
of Histopaque (Histopaque-1077, Sigma-Aldrich) solution. After centrifugation at 400 g
for 30 minutes, mononuclear cells were collected for dark field microscopic imaging.
4.1.5 Analysis of gold concentration in tissue samples
In order to analyze the concentration of gold in tissue samples, each tissue sample
(1-2 mL for blood, ~1 g for other tissues) was digested in 10 mL 35% HNO3 and 1 mL
18.5% HCL at a high pressure and temperature using a microwave digestion system
(Mars, CEM). The digested sample was diluted to around 7% acid concentration and
analyzed using an inductively coupled plasma mass spectrometry (ICP-MS) system.
4.2 IMAGE PROCESSING
Slope based spectroscopic analysis similar to that described in Chapter 3 was
applied to identify macrophages loaded with Au NPs and deposits of lipid using multi-
wavelength IVPA images. For imaging Au NP-labeled macrophages, multi-wavelength
IVPA images were acquired within 710-770 nm wavelength range, with a step size of
20 nm. Each acquired cross-sectional IVPA image was processed according to the
sequence of the following procedures (Figure 4.6).
Figure 4.6: Imaging processing algorithm for spectroscopic IVPA and IVUS images.
Calculation of PA Slopes
Multi-wavelength IVPA Images
Co-registered IVUS Images
Generation of Masks
Combined IVUS and
Spectroscopic IVPA image
Image Segmentation
Scan conversion

71
1) Multi-wavelength IVPA images were first spatially low-pass filtered using
running average with a kernel size of 80 µm (axial) by 7 degrees (lateral). The
size of the kernel is around 2 times that of the resolution of the IVPA image.
2) Three slope maps of the photoacoustic amplitude between 710 nm to 730, 750 and
770 nm were calculated at each pixel of the image:
, , 710
,
, 710
( ) ( )1, 730,750,770
( ) 710
i j l i jl
i j
i j
S SS l
S l
, (4.1)
where ,i jS is the normalized photoacoustic amplitude at pixel i, j, and ,
l
i jS is the
photoacoustic amplitude slope at wavelength l .
3) Three masks where generated in order to differentiate PA signal from Au NPs.
From 710 to 770 nm, other than Au NPs, oxygenated blood is another strongly
absorbing chromophore that may generate photoacoustic signal. The
spectroscopic photoacoustic amplitude from blood has a positive slope, while
macrophages loaded with Au NPs has a negative one. Therefore, the first mask
selected signals with a negative photoacoustic amplitude slope in the range of
770
,0.8 0
(770 710) i jS
. Then, two other masks were introduced to reject regions
with high level of noise based on the assumption that the photoacoustic amplitude
should have a nearly linear decline in 710-770 nm wavelength. Regions with
photoacoustic slope maps satisfying equation (4.2) are considered as regions
containing Au NP-labeled macrophages.
770
, ,
0.3, 730,750
710
l
i j i jS S ll
. (4.2)

72
4) For display purposes, vessel regions in the spectroscopic IVPA images were
segmented based on the co-registered IVUS images.
5) Spectroscopic IVPA and IVUS images were scan converted to the Cartesian grid.
Image processing procedures for the detection of lipid deposits are similar to Au
NP-labeled macrophages. Instead of imaging at four wavelengths, IVPA images acquired
at three wavelengths (1210-1230 nm, step size 10 nm) were used. Multi-wavelength
IVPA images were first spatially filtered using a running average. Then, a photoacoustic
amplitude slope was calculated between 1210 and 1230 nm using equation (4.3).
, , 1210
,
, 1210
( ) ( )1, 1220,1230.
( ) 1210
i j l i jl
i j
i j
S SS l
S l
(4.3)
Based on the optical absorption spectrum of fatty acid (Fig. 1c), slopes satisfying
the following condition: 1230
,0.7 0.25
(1230 1210) (1230 1210)i jS
were selected. A
mask generated using the image at 1220 nm was used to further differentiate lipid
deposits from water based tissue: 1220 1210
, ,
0.2.
1220 1210i j i jS S
4.3 RESULTS
4.3.1 Imaging the distribution of phagocytically active macrophages in
atherosclerotic rabbit aortas
PEGylated 20 nm diameter spherical Au NPs were injected into a rabbit model of
atherosclerosis through the ear vein. PEG coating was used to improve the
biocompatibility and to prolong the circulation of nanoparticles [1]. Analysis of gold
concentration in the blood samples showed a long plasma circulation halftime of over 20
hours (Figure 4.7(a)). Aorta sections were scanned ex-vivo for macrophages at 710-
770 nm wavelength.

73
In order to identify regions containing Au NP-labeled macrophages or lipid
deposits, spectroscopic analysis was performed to separate the tissue components of
interest from other major absorbing chromophores. With increasing wavelength within
710-770 nm range, regions with increased photoacoustic amplitude indicate the presence
of oxygenated hemoglobin; while regions with decreased amplitude outline regions
containing Au NPs (Figure 4.7(b)). For advanced plaques, most of the labeled
macrophages were located in the subendothelial layer, where phagocytically active
macrophages are normally localized (Figure 4.7(c,f)). In some regions, Au NPs were
located 0.5 mm deep into the plaques (3 o’clock in Figure 4.7(c,d)). For early plaques,
both the spectroscopic IVPA image and the silver stain showed a high concentration of
Au NPs located in the “shoulder region” of the fatty streaks (Figure 4.7(f,g), region at 6
o’clock), where macrophage infiltration and plaque disruption most frequently occurs [2].
Au NPs may penetrate into the plaques and be internalized by activated macrophages
through different pathways. Particles located in the subendothelial layer may infiltrate
into the plaques through leaky endothelium. Au NPs may also be delivered deep into the
plaques through the intraplaque vasa vasorum. Similar to dysfunctional endothelium, the
vasa vasorum can be leaky. The density of vasa vasorum may indicate the stage of the
atherosclerotic plaques [3-4]. In the combined IVUS/spectroscopic IVPA images
(Figure 4.7(c,f)), we observed Au NPs delivered through vasa vasorum into the adventitia
(Figure 4.8). These Au NPs may enter the plaques through incomplete endothelial
junctions [4]. Note that although plaques were rich in macrophages, not all macrophages
were labeled with Au NPs (Figure 4.7(c-h)). Insufficient labeling may be because the
macrophages deep inside the plaques were not phagocytically active although it is
possible that not enough nanoparticles diffused deep into the plaques. However, the 28

74
hour post-injection images shown here effectively indicate regions with leaky
endothelium.
Figure 4.7: (a) Gold concentration in the blood after 20 nm diameter spherical
PEGylated Au NPs were intravenously injected into the rabbit. The dashed
line is an exponential fit. (b) The spectroscopic photoacoustic response was
different for regions containing Au NP-labeled macrophages and the region
containing blood. (c,f), Combined spectroscopic IVPA and IVUS images
(scale bar 0.5 mm) demonstrated the location of Au NP-labeled
macrophages in the atherosclerotic plaques. Spectroscopic IVPA images of
Au NP-labeled macrophages were color coded in green, while IVUS images
were shown in gray scale. Corresponding histochemistry stains were shown
to the right of each image. (d,g), Silver stain for nanoparticles. (e,h),
RAM11 stain for macrophages.
1
3
2
0
20
40
60
80
100
120
0 5 10 15 20 25 30
% r
emai
nin
g A
u N
Ps
in b
loo
d
Hours
a b
c d e
gf h
710 720 730 740 750 760 7700
0.5
1
1.5
2
wavelength (nm)
No
rma
lized
PA
am
plit
ud
e (
a.u
.)
Region 1 (Au NPs)
Region 2 (Au NPs)
Region 3 (Tissue/blood)

75
Figure 4.8: Distribution of Au NPs within the vessel wall. Au NPs are present in or
around the vasa vasorum embedded in the adventitia.
4.3.2 Imaging deposits of lipid in atherosclerotic rabbit aorta
Lipid in the atherosclerotic plaques can be detected using spectroscopic IVPA
imaging based on the difference in the optical absorption spectra between fatty acid and
water based tissue (Figure 1.5). In advanced plaques, the thickened intimal layer is rich in
lipid (Figure 4.9(b,c)) whereas, in early plaques, lipid is located inside the fatty streaks
(Figure 4.9(d,e)). In several cross-sections, spectroscopic IVPA imaging did not delineate
all lipid content in the thickened intimal layer, as seen in the Oil Red O stain
(Supplementary Fig. S3). This may be caused by finite sensitivity of our IVPA imaging.
system.
100 µm

76
Figure 4.9: IVPA imaging of lipid. (a) Normalized spectroscopic photoacoustic signal
amplitude from different regions of the vessel wall. For the lipid-rich region,
the signal decreased with increased wavelength, while the normal vessel had
a relatively flat spectroscopic response. (b,d) Combined spectroscopic IVPA
and IVUS images of one cross-section of the vessel wall. Spectroscopic
IVPA images of lipid deposits were color coded in red, while IVUS images
were displayed in gray scale. Scale bars are 0.5 mm. (c,e) Corresponding Oil
red O stain for lipid.
1
2
3
1210 1215 1220 1225 12300
0.2
0.4
0.6
0.8
1
wavelength (nm)
No
rma
lized
PA
am
plit
ud
e (
a.u
.)
Region 1 (lipid)
Region 2 (lipid)
Region 3 (normal vessel)
a
b
d e
c
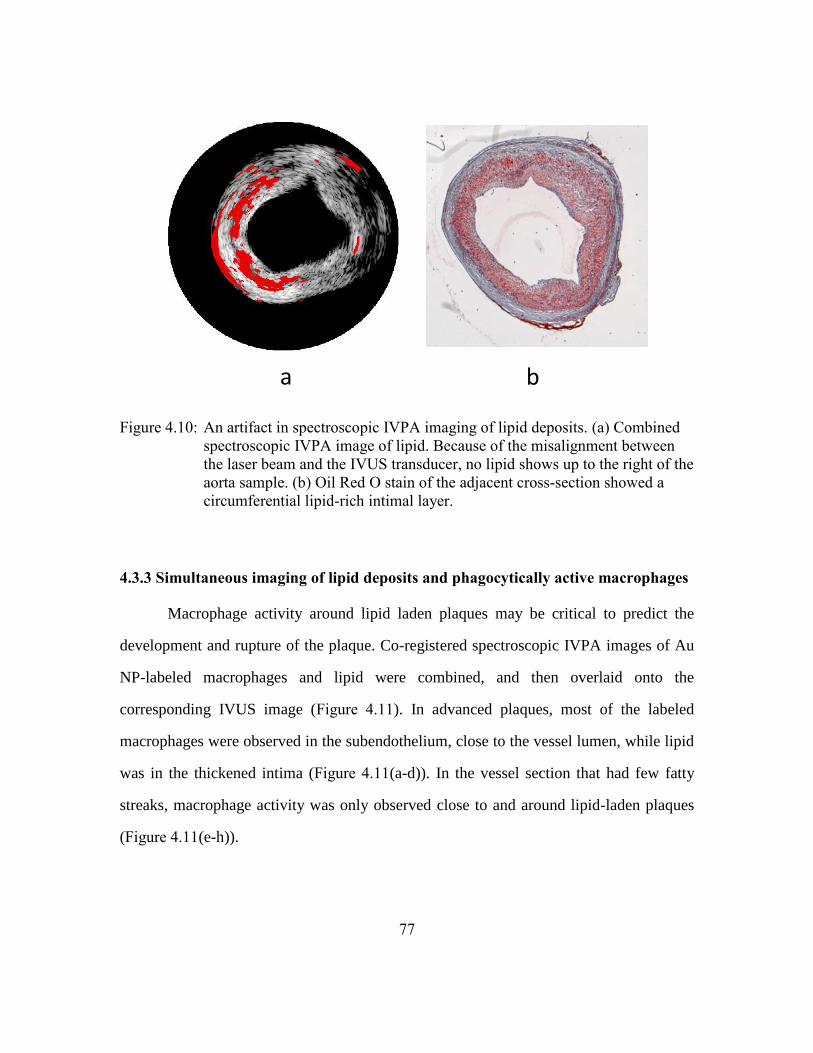
77
Figure 4.10: An artifact in spectroscopic IVPA imaging of lipid deposits. (a) Combined
spectroscopic IVPA image of lipid. Because of the misalignment between
the laser beam and the IVUS transducer, no lipid shows up to the right of the
aorta sample. (b) Oil Red O stain of the adjacent cross-section showed a
circumferential lipid-rich intimal layer.
4.3.3 Simultaneous imaging of lipid deposits and phagocytically active macrophages
Macrophage activity around lipid laden plaques may be critical to predict the
development and rupture of the plaque. Co-registered spectroscopic IVPA images of Au
NP-labeled macrophages and lipid were combined, and then overlaid onto the
corresponding IVUS image (Figure 4.11). In advanced plaques, most of the labeled
macrophages were observed in the subendothelium, close to the vessel lumen, while lipid
was in the thickened intima (Figure 4.11(a-d)). In the vessel section that had few fatty
streaks, macrophage activity was only observed close to and around lipid-laden plaques
(Figure 4.11(e-h)).
a b

78
Figure 4.11: 3D IVPA simultaneous imaging of macrophages and lipid. (a,b) Cross-
sectional view of IVUS/spectroscopic IVPA images revealing both Au NP-
labeled macrophages (green) and lipid (red) in atherosclerotic plaques. (c-h),
Reconstructed 3D images showing the distribution of Au NP loaded
macrophages (b,f), lipid (c,g) and macrophages and lipid together (d,h). The
yellow regions in figures (d,h) resulted from the overlay of green
(macrophages) and red (lipid).
Lipid and Au NPs
Cross-sectional view
Au NPs 3D view
(macrophage activity)
Lipid
3D view
Lipid and Au NPs
3D view
a
b
c
d
e
f
g
h

79
4.4 DISCUSSION
4.4.1 Delivery pathways of Au NPs to phagocytically active macrophages
Plasmonic Au NPs were introduced to label macrophages in atherosclerotic
plaques in vivo. Macrophage labeling may occur via two different pathways. First,
isolated Au NP may diffuse through the leaky endothelium and then be internalized by
phagocytically active macrophages inside the plaques. Second, Au NPs may first be
internalized by peripheral blood monocytes and then these labeled monocytes enter
plaques through the endothelium. We observed Au NP uptake by mononuclear cells in
peripheral blood 6 hours post contrast agent injection (Figure 4.12).
Figure 4.12: Dark-field image of mononuclear cells separated from a rabbit blood
sample 6 hours after contrast agent administration. Some of the cells were
labeled by Au NPs (arrows).

80
4.4.2 Size and shape dependent delivery of Au NPs
Delivery of contrast agents specifically targeting a cell type depends on many
factors such as the cell type, as well as the size, shape and coating of the contrast agent.
The surface charge of the particles dramatically affects the cell uptake. Positively charged
particles were internalized within an hour of incubation [5], therefore they may increase
the non-specific uptake by untargeted cells and are not ideal to use as a contrast agent.
For antibody coated spherical Au NPs, studies have shown that the optimal cellular
uptake happens when the size of the particle is around 40-50 nm diameter. Smaller or
larger Au NPs may shorten the cell membrane wrapping time, which resulted in
decreased internalization [6]. However, in the in vivo scenario, particle delivery may vary
significantly from the observations in cell culture. Parameters such as plasma circulation
half time and the ability for the particle to penetrate through the endothelium will
significantly affect the in vivo cellular uptake. Meanwhile, the size and the coating of the
particles will also significantly affect the bio-distribution, and ultimately the clearance
pathway for the contrast agent. Different studies shows quantitatively different bio-
distribution of the Au NPs with most of the particles accumulated in the liver or spleen
[1, 7-8].
Table 4.1: Au NPs injected in two balloon injured rabbits.
Particle
diameter (nm)
Injected concentration
(mg/kg)
Rabbit 1 20 27.4
Rabbit 2 50 19.41

81
As a preliminary study, two sizes of spherical Au NPs coated with 5 kD PEG
were injected into two balloon injured rabbits (Table 4.1). The circulation time of 20 nm
spherical Au NPs was significantly longer than 50 nm ones. Interestingly, the bio-
distribution of gold shows that up to 28 hours post injection, more 20 nm particles
accumulated in spleen than 50 nm particles, while 50 nm particles were more
concentrated in liver. Small particles may accumulate more easily in brain. However,
because around half of the particles were still in circulation at the time of sacrifice for the
rabbit injected with 20 nm particles, the bio-distribution of gold in different organs may
be confounded by the gold in the blood vessels.
Figure 4.13: Gold concentration in rabbits injected with 20 nm (Rabbit 1) and 50 nm
(Rabbit 2) spherical PEGylated Au NPs.
0
10
20
30
40
50
60
70
80
90
100
0 5 10 15 20 25 30
% r
em
ain
ing A
u N
Ps
in b
loo
d
Hours after injection
Rabbit 1
Rabbit 2

82
Figure 4.14: Bio-distribution of gold in rabbits injected with 20 nm (a) and 50 nm (b)
spherical PEGylated Au NPs.
0
0.02
0.04
0.06
0.08
0.1
0.12
0.14
lung liver spleen pancreas brain kidney
Au
co
nce
ntr
atio
n (m
g/g)
(a)
0
0.02
0.04
0.06
0.08
0.1
0.12
0.14
0.16
lung liver spleen pancreas brain kidney
Au
co
nce
ntr
atio
n m
g/g
(b)

83
4.5 CONCLUSION
We demonstrated in vivo delivery of Au NPs to macrophages in atherosclerotic
plaques. The long circulation time of these Au NPs facilitated in vivo labeling of
macrophages deep inside the plaques. Due to plasmon resonance coupling of aggregated
Au NPs internalized by macrophages, spectroscopic IVPA imaging can identify
phagocytically active macrophages inside plaques. Furthermore, lipid deposits were
simultaneously imaged based on their characteristic optical absorption peak. Therefore,
combined spectroscopic IVPA and IVUS images can depict macrophage activity around
lipid-rich plaques, which is critical for characterization and treatment planning of
atherosclerotic plaques.
4.6 REFERENCES
[1] G. von Maltzahn, J.-H. Park, A. Agrawal, N. K. Bandaru, S. K. Das, M. J. Sailor,
and S. N. Bhatia, "Computationally guided photothermal tumor therapy using
long-circulating gold nanorod antennas," Cancer Research, 69(9), pp. 3892-3900,
May 1, 2009 (2009).
[2] E. Falk, "Pathogenesis of Atherosclerosis," J Am Coll Cardiol, 47(8_Suppl_C),
pp. C7-12, (2006).
[3] M. Gössl, D. Versari, H. A. Hildebrandt, T. Bajanowski, G. Sangiorgi, R. Erbel,
E. L. Ritman, L. O. Lerman, and A. Lerman, "Segmental Heterogeneity of Vasa
Vasorum Neovascularization in Human Coronary Atherosclerosis," JACC:
Cardiovascular Imaging, 3(1), pp. 32-40, (2010).
[4] J. C. Sluimer, F. D. Kolodgie, A. P. J. J. Bijnens, K. Maxfield, E. Pacheco, B.
Kutys, H. Duimel, P. M. Frederik, V. W. M. van Hinsbergh, R. Virmani, and M.
J. A. P. Daemen, "Thin-Walled Microvessels in Human Coronary Atherosclerotic
Plaques Show Incomplete Endothelial Junctions: Relevance of Compromised
Structural Integrity for Intraplaque Microvascular Leakage," Journal of the
American College of Cardiology, 53(17), pp. 1517-1527, (2009).
[5] S. E. A. Gratton, P. A. Ropp, P. D. Pohlhaus, J. C. Luft, V. J. Madden, M. E.
Napier, and J. M. DeSimone, "The effect of particle design on cellular

84
internalization pathways," Proceedings of the National Academy of Sciences,
105(33), p. 11613, (2008).
[6] W. Jiang, B. Kim, J. Rutka, and W. Chan, "Nanoparticle-mediated cellular
response is size-dependent," Nature Nanotechnology, 3(3), pp. 145-150, (2008).
[7] T. Niidome, M. Yamagata, Y. Okamoto, Y. Akiyama, H. Takahashi, T. Kawano,
Y. Katayama, and Y. Niidome, "PEG-modified gold nanorods with a stealth
character for in vivo applications," Journal of Controlled Release, 114(3), pp.
343-347, (2006).
[8] Q.-Y. Cai, S. H. Kim, K. S. Choi, S. Y. Kim, S. J. Byun, K. W. Kim, S. H. Park,
S. K. Juhng, and K.-H. Yoon, "Colloidal Gold Nanoparticles as a Blood-Pool
Contrast Agent for X-ray Computed Tomography in Mice," Investigative
Radiology, 42(12), pp. 797-806 10.1097/RLI.0b013e31811ecdcd, (2007).

85
Chapter 5: Conclusion and future work
5.1 SUMMARY OF RESEARCH
IVPA imaging is a recently developed imaging modality that may non-invasively
image the composition of the atherosclerotic plaques at a resolution similar to IVUS
images (tens of micron), and at an imaging depth of several millimeters [1]. The
uniqueness of IVPA imaging is that it provides a direct measurement of the spatially
resolved optical absorption property of the plaques. The optical absorption information
can be used to identify tissue composition, or detect the optically absorbing contrast
agents. In this dissertation, IVPA imaging was used to detect lipid deposits and
macrophages labeled by gold nanoparticles.
Lipid deposits in atherosclerotic plaques were first imaged using spectroscopic
IVPA imaging. The imaging contrast for lipid came from the characteristic optical
absorption peak of fatty acid around 1210 nm wavelength range. An ex vivo combined
IVPA and IVUS imaging system based on a single element 40 MHz IVUS imaging
catheter and OPO tunable pulsed laser was developed to acquire co-registered IVUS and
multi-wavelength IVPA images. A healthy rabbit aorta and a rabbit aorta from a
cholesterol fed rabbit were imaged from 1200 to 1230 nm wavelengths. A slope based
algorithm was applied to generate spectroscopic IVPA image of the lipid in plaques.
Histology stain confirmed that spectroscopic IVPA imaging can successfully detect lipid
deposits in atherosclerotic plaques.
Contrast enhanced molecular IVPA imaging of macrophages was presented in
Chapter 3. In vitro cell phantom studies were first performed to investigate the feasibility
of using Au NPs as a contrast agent for IVPA imaging of macrophages. Murine
macrophages labeled with Au NPs showed elevated optical absorption in the NIR
wavelength range compared to Au NPs alone. Macrophages labeled with Au NPs were

86
microinjected into a vessel mimicking phantom and an excised rabbit aorta. Due to
increased optical absorption of cells labeled with Au NPs, IVPA imaging at NIR
wavelength range, e.g. 680 nm, can selectively image Au NP-labeled macrophages. The
results indicate that NIR IVPA imaging can detect phagocytically active macrophages.
Experiments also showed that NIR IVPA imaging of macrophages has high sensitivity
and the laser fluence used for imaging does not cause cell death.
PEGylated Au NPs were then injected in vivo into a balloon injured
atherosclerotic rabbit aorta. The excised rabbit aorta was scanned at multiple wavelengths
in the NIR range for simultaneous detection of phagocytically active macrophages and
lipid deposits. An ex vivo imaging system was designed for the 3D spectroscopic scan
from 710-770 nm for imaging macrophages, and 1210-1230 nm for imaging lipid.
Because the optical absorption peaks of Au NPs and lipids do not overlap, simultaneous
imaging of Au NP-labeled macrophages and lipid deposits can be achieved. Results
showed that 20 nm diameter PEGylated Au NPs had a long plasma circulation time and
penetrated deep inside the plaques. IVPA imaging successfully detected the distribution
of macrophages loaded with Au NPs, as well as the distribution of lipid deposits.
Macrophage activity in or around the lipid-rich plaques provides valuable information in
indentifying vulnerable plaques. For example, Au NP-labeled macrophages located at the
shoulder region of the lipid-rich plaques indicated the rupture-prone regions.
In summary, using rabbit models of atherosclerosis, the study presented in this
dissertation demonstrated that IVPA imaging can detect lipid deposits using
spectroscopic IVPA imaging. PEGylated Au NPs can label phagocytically active
macrophages in atherosclerotic plaques in vivo, and Au NP-labeled macrophages were
detected using IVPA imaging in the NIR wavelength range. Simultaneous detection of

87
macrophage activity and lipid deposits were achieved using spectroscopic IVPA imaging
at two NIR wavelength ranges.
5.2 LIMITATIONS
5.2.1 Animal model of atherosclerosis
In this study, characterization of plaques was performed using rabbit models of
atherosclerosis. Similarity of plaques between the animal model and human is critical to
ensure that the plaque characterization methods can be transferred to clinical use.
Atherosclerotic plaques induced in NZW rabbit generally are lipid-rich and have high
macrophage activity. These plaques are suitable for the detection of lipid and
macrophages. However, vulnerable human plaques usually contain many other
components such as calcification and intraplaque hemorrhage. Complex plaque
composition may affect the laser fluence distribution inside the vessel wall, and therefore
may introduce error when using the spectroscopic analysis presented in this paper. Fine
adjustments of the imaging wavelength range or the threshold in the spectroscopic
analysis are necessary to increase the sensitivity and specificity of human plaque
characterization.
5.2.2 Ex vivo imaging of atherosclerotic plaques
In the current setup, the laser beam was delivered externally onto the vessel. The
ex vivo imaging system guaranteed superior alignment between the laser beam and the
IVUS catheter, and the consistency of laser fluence distribution between experiments.
However, for the in vivo application, an integrated catheter that can deliver laser pulses
into the vessel is required. When using an integrated catheter for in vivo imaging, light
distribution will be affected by the luminal blood. Laser fluence reaching the vessel wall

88
will be lower than that in the ex vivo imaging setup. Moreover, the optical property of
blood may change the spectroscopic responses of photoacoustic signals. Imaging in a
small NIR wavelength range may help the spectroscopic analysis (Figure 2.5). However,
higher fluence and further validation of spectroscopic analysis may be necessary for the
in vivo imaging.
5.2.3 Imaging speed
IVPA imaging can potentially be performed real-time imaging. Imaging speed of
the current ex vivo imaging system is limited by the 10 Hz repetition rate of the laser
system. The OPO laser system is suitable for bench-top imaging because of its
nanosecond duration laser pulses, broad tunable wavelength range, and high laser energy
output. In the clinical practice, when the laser wavelength range has been selected based
on the optical absorption spectrum of tissue of interest, dye or other lasers with high
repetition rate may be used. Another option to achieve real-time IVPA imaging is to
design the combined IVPA/IVUS imaging system based on IVUS array transducers.
After irradiating a region of the vessel wall with laser pulse, photoacoustic signals may
be acquired simultaneously through multiple channels. However, an array based
IVPA/IVUS imaging system requires a significant modification from the current array
catheter based IVUS imaging system, for example, by adding more parallel data
acquisition channels. Moreover, array based catheter will have a larger profile than
rotational catheter.

89
5.3 FUTURE DIRECTIONS
5.3.1 Detecting lipids using thermal IVPA imaging
Unlike previous studies reported here, where plaques were characterized based on
their optical contrast, temperature dependent Grüneisen coefficient may also be used to
differentiate tissue composition. When the laser pulse duration satisfies stress
confinement and thermal confinement, the photoacoustic signal amplitude generated from
optically absorbing biological tissue is proportional to the product of the Grüneisen
coefficient, the tissue’s optical absorption coefficient, and the local optical fluence
(Equation (1.2)). The Grüneisen coefficient is defined as:
2
s
p
v
C
, (5.1)
where sv is the speed of sound, is the thermal coefficient of volume expansion, and
pC is the specific heat capacity at constant pressure. Generally, all three parameters are
temperature dependent and differ between types of tissue. Studies have shown the
opposite trend of sound speed and the thermal coefficient of volume expansion between
animal fat and water [2-4]. Meanwhile, the specific heat capacity also behaves differently
in animal fat and water [2]. Therefore, there may be imaging contrast between lipid in
plaques and other water based tissue as a result of the temperature dependent Grüneisen
coefficient. This imaging contrast may be used for detecting lipids in plaques using IVPA
imaging. We named this approach as thermal IVPA imaging.
One cross-section of the WHHL rabbit aorta was imaged with thermal IVPA
imaging. Histology stains of the aorta cross-section showed eccentric and lipid rich
plaques in the inner lumen of the vessel (Figure 5.1 (a,b)). An IVUS image of the
adjacent cross-section showed two hypo-echoic regions that correspond to the plaques

90
(yellow arrows in Figure 5.1(c)). The IVPA image acquired at 25 oC with 1210 nm
wavelength was overlaid onto the IVUS image. Strong photoacoustic signals were
presented at the plaque region because of the strong optical absorption of lipid at
1210 nm wavelength (Figure 1.8). Strong photoacoustic signals were also observed at the
outer boundary of the aorta. These signals may be generated from the connective adipose
tissue due to either high optical absorption or high subsurface optical fluence caused by
the optical scattering mismatch between saline and arterial tissue. Temperature dependent
photoacoustic responses from four regions in the plaques and vessel wall were
normalized and are plotted in Figure 5.1(e). The photoacoustic amplitude generated from
the vessel wall remained relatively constant, while the IVPA signal amplitude from
plaques decreased with increasing temperature. This different trend of photoacoustic
amplitude indicates that the Grüneisen coefficient for lipid in plaques and other types of
tissue has a different temperature dependence. Therefore, lipid distribution may be
imaged based on the temperature dependent photoacoustic signal amplitude.
Figure 5.2 shows the image processing algorithm used to generate the lipid image
based on the temperature dependent IVPA images. The IVPA images acquired at two
different temperatures were first running averaged with a kernel size of 266 µm by 15.5
degrees. Then, the finite difference of the photoacoustic amplitude between the two
images was calculated:
1 2
2
, ,
,
,
,
T T
i j i j
i j T
i j
S SD
S
(5.2)
where in ,
T
i jS is the photoacoustic signal amplitude at pixel ,i j at temperature T and
,i jD is the resulting finite difference map. ,i jD was used to form the lipid image.

91
Figure 5.1: (a) Oil red O stain for lipid, and (b) H&E stain were performed in tissue
slices adjacent to the imaged cross-section. (c) IVUS image of the aorta. (d)
Combined IVUS and IVPA image acquired at 25 oC. (e) Temperature
dependent photoacoustic responses from plaques and vessel wall.
15 20 25 30 35 400.2
0.3
0.4
0.5
0.6
0.7
0.8
0.9
1
1.1
1.2
Temperature oC
Nor
mal
ize
d P
A a
mp
litud
e a
.u.
x Plaquex Vessel wall
(a) (b)
(c) (d)
(e)

92
Figure 5.2: Image processing algorithm to generate combined IVUS and lipid image of
the aorta.
IVPA images taken at 38 ºC and 25 ºC were used to generate thermal IVPA
image. The finite difference map was formed based on Equation (5.2), with
1 238 , 25o oT C T C . Regions with decreasing photoacoustic amplitude versus
temperature ( ,0.4 0.95i jD ) were color coded red and overlaid onto the co-registered
IVUS image. As shown in Figure 5.3(a), red-colored regions coincide with the location of
plaques. Oil red O stain for lipid and H&E stains (Figure 5.3 (c,d)) of the adjacent cross-
sections also confirmed that the plaques are eccentric and lipid rich.
A spectroscopic IVPA image of lipid at the same cross-section of the aorta was
generated using the method introduced in Chapter 4. The spectroscopic IVPA image also
successfully delineated lipid-rich regions inside the plaque (Figure 5.3(b)), confirming
that the lipid image generated based on the temperature dependent photoacoustic
response reflects lipid deposits inside the plaque. However, compared to Figure 5.3(a),
Figure 5.3(b) showed more lipid in the periadventitial regions of the aorta. The difference
indicates that although the lipid deposits in plaques and the periadventitial fat have
similar optical property, their thermal photoacoustic responses are different.
IVPA Images taken at two temperatures
Co-registered IVUS Images
Combined IVUS and thermal IVPA image
Spatial Filter(Running average)
Calculate PA difference
Image segmentation

93
Figure 5.3: (a) Lipid image generated by temperature dependent IVPA imaging overlaid
onto IVUS image to demonstrate the distribution of lipid in an
atherosclerotic rabbit aorta. (b) Spectroscopic IVPA image of lipid at the
same cross-section of the aorta.
5.3.2 Imaging lipid in vivo at 1720 nm wavelength
Besides the 1210 nm wavelength peak used for spectroscopic IVPA imaging of
lipid presented in Chapter 2, lipid has another optical absorption peak at 1720 nm [5-6].
An atherosclerotic aorta from a balloon injured rabbit was imaged ex vivo at both 1210
and 1720 nm wavelength using the bench-top IVPA/IVUS imaging system (Figure 4.1).
With the same optical alignment, the IVPA image acquired at 1210 nm wavelength
showed much stronger photoacoustic signal from the outer boundary than the image
taken at 1720 nm wavelength (Figure 5.4(c,f)). The high photoacoustic signal at the outer
boundary is induced by the scattering mismatch between the vessel tissue and saline
solution. The scattering mismatch created a strong subsurface fluence that led to strong
photoacoustic signal. At 1720 nm, tissue optical scattering is significantly lower than that
at 1210 nm. Therefore, the IVPA image showed lower photoacoustic signal at the outer
(b)(a)

94
boundary (Figure 5.4(e)). Unlike lipid imaging at 1210 nm wavelength, where
spectroscopic analysis has to be performed to eliminate strong photoacoustic signals
generated by strong subsurface fluence but not strong optical absorption, lipid imaging at
1720 nm may directly detect lipid without spectroscopic analysis (Figure 5.4(e-f)).
Moreover, due to the reduced optical scattering of blood, in vivo lipid imaging at
1720 nm may achieve better imaging depth than imaging at shorter wavelengths.
Figure 5.4: (a-c) IVUS, IVPA, and combined IVPA/IVUS images taken at 1210 nm
wavelength. (d-f) IVUS, IVPA, and combined IVPA/IVUS images taken at
1720 nm wavelength. The IVUS and IVPA images are shown at a 35 dB
dynamic range.
(a) (b) (c)
(d) (e) (f)

95
5.3.3 Designing integrated catheter for combined IVPA/IVUS imaging in vivo
An integrated catheter capable of in vivo combined IVPA/IVUS imaging is
required for in vivo imaging. The catheter should deliver nanosecond duration laser
pulses into the vessel, receive photoacoustic signals and perform conventional IVUS
imaging. The diameter of the catheter should be around 1 mm, and flexible enough for
intracoronary imaging. Figure 5.5 showed one of the designs for an integrated catheter
based on a side-fire optical fiber and a single element IVUS catheter [7]. The distal end
of the side-fire fiber was polished 45 degrees, and capped with a quartz tube to redirect
the light towards the vessel wall. The integrated catheter could image the optical
absorbing inclusions embedded in the tissue mimicking phantom in both IVPA and IVUS
modes (Figure 5.5(c-e)). Jansen et al. used a similar design and made an integrated
catheter 1.2 cm in diameter [8]. Other designs of the light delivery system, such as micro-
optics based assembly, can also be used to construct the integrated catheter [9].

96
Figure 5.5: (a) Photo of the distal end of the integrated catheter. (b) Tissue mimicking
phantom with three optical absorbing inclusions. (c) IVUS image of the
phantom. (d) IVPA image of the phantom. (e) Combined IVPA/IVUS image
of the phantom.
5.3.4 Accurately detecting of vessel lumen borders
High frequency IVUS imaging provides high resolution images, but at the same
time is more likely to be affected by the high acoustic scattering from the blood than
imaging at low frequencies. Strong scattered acoustic signals from blood impair
visualization of the border of the vessel lumen, and therefore affect accurate estimation of
the luminal narrowing and area of the necrotic core. Blood signal in conventional IVUS
imaging can be reduced by subtraction, averaging, saline flush, or more sophisticated
image processing based on the temporal and spatial variation of speckles from blood [10-
IVUS Catheter
Optical Fiber
(a) (b)
(c) (d) (e)

97
11]. IVPA imaging may image the lumen borders with minimal image processing. Two
methods can be used to accurately detect the lumen borders. The first method is utilizing
the optical absorption property of blood: detect the luminal border by accurately
delineating the border of the luminal blood. The optical wavelength chosen for this
purpose should satisfy 1) optical absorption of blood at the wavelength is strong enough
to produce IVPA signals, and 2) the optical absorption and scattering of blood is not too
strong so that imaging depth can be guaranteed. The second method for border detection
is utilizing the scattering mismatch of the blood and vessel wall. As shown in Figure 5.6,
when imaging with an integrated catheter, due to scattering mismatch between blood and
the vessel wall, strong photoacoustic signals were presented at the luminal borders when
imaging at 900 nm wavelength. Note that the excised aorta was immersed in 30% whole
blood in this experiment. In the future, the optimal wavelength for lumen border
detection should be investigated.
Figure 5.6: IVUS (a), IVPA (b), and combined IVUS/IVPA (c) images of an
atherosclerotic rabbit aorta acquired at 900 nm wavelength using an
integrated IVUS/IVPA imaging catheter. The aorta was embedded inside
30% whole blood.
(a) (b) (c)

98
5.3.5 Imaging thrombus and vasa vasorum
Thrombus in an artery is a blood clot formed after plaque rupture. After plaque
rupture, the constituents inside plaques are released into the lumen, which attract platelets
and forming thrombus [12]. Arterial thrombus is rich in platelets and fibrin and has a high
possibility lead to severe stenosis, myocardium infarction or stroke. Thrombus may be
identified by spectroscopic IVPA imaging based on the difference on optical property
between thrombus and luminal blood.
Vasa vasorum are micro-vessels developed inside or around the arterial wall.
Atherosclerotic plaques have more extensive vasa vasorum distribution [13]. Although
spectroscopic photoacoustic imaging has been widely used to image blood vessels, IVPA
imaging of vasa vasorum is challenging because it requires to image through luminal
blood. Meanwhile, the distance between the micro-vessels and the catheter, and the small
vessel diameter of the vessel make IVPA hard to resolve an individual micro-vessel.
However, spectroscopic IVPA has the potential to detect high density vasa vasorum.
5.3.6 Engineering contrast agents for high sensitivity and specificity IVPA imaging
Using spherical Au NPs as a contrast agent for IVPA imaging has the advantage
of detecting the interaction of particles with cells. However, spherical Au NPs needs to
aggregate at a relatively high concentration to elevate their optical absorption spectrum in
the NIR wavelength range and therefore, to become detectable for IVPA imaging. Other
types of Au NPs, such as gold nanorods, have high optical absorption in the NIR range
[14-16]. The detection limit of IVPA imaging for these contrast agents may be much
lower than for spherical Au NPs. Moreover, gold nanorods have a narrow tunable
absorption peak in the NIR range, and high optical absorption contrast compared to other
types of tissue. Therefore gold nanorods may be more easily distinguished from
background tissue using spectroscopic analysis.

99
The Au NPs used in this study were coated with PEG-thiol, which prevented the
aggregation of particles and prolonged the particle circulation time. PEGylated Au NPs
were internalized passively by macrophages. Active delivery of contrast agents can be
achieved by conjugating antibodies or ligands to the surface of the nanoparticles that
specifically target the biomarkers. Active delivery may increase the delivery efficiency of
the contrast agents. One challenge facing the design of targeting particles is the avoidance
of fast clearance of the particles. Surface modification may trigger the immune system to
eliminate the contrast agents before they reach the targeted cells or molecules. Therefore,
there may be a tradeoff between uptake or binding speed and clearance time when
designing the targeted nanoparticles.
Nanoparticles can also be engineered to simulate assemblies inside the human
body to avoid triggering the immune response and achieve efficient delivery. HDL-like
nanoparticles were engineered to encapsulate various contrast agents inside the
monolayer phospholipid. The surface of the particle was decorated apolipoprotein to
simulate HDL particles [17]. Contrast agents can also be loaded inside the cells, such as
monocytes, to image plaques as well as monitor the cell tracking in atherosclerotic
disease [18].
5.3.7 Delivering contrast agents
The delivery of contrast agents to their target sites in molecular imaging is
challenging. Plasma circulation time, particle size and shape will all affect the efficiency
of contrast agent delivery. In chapter 4, it has been shown that in vivo delivery efficiency
of spherical Au NPs is different from the results acquired in cell culture environments.
Twenty nanometer diameter particles had a longer blood circulation time than 50 nm
particles and can penetrate deep inside the plaques. It is not clear what the optimal size of

100
a particle is for molecular imaging of atherosclerosis. The size of lipoprotein particles
may provide some insight. LDL and HDL particles are more likely to enter into the vessel
wall than larger particles such VLDL (very low density lipoprotein) particles. Therefore,
there may be an upper limit of size around 40 nm for engineered contrast agents to be
passively delivered into atherosclerotic plaques. Meanwhile, the shape of particles (e.g.
rods versus sphere) will also affect how the particles enter the leaky endothelium in a
diseased artery.
For intravascular imaging, the mechanical property of the flow and the
morphology of the artery and plaque may affect the distribution of particles inside the
vessel wall. Atherosclerotic plaques tend to accumulate at the vessel bifurcation, which
may due to the flow-related haemodynamics. Research on the relative distribution of
plaques and nanoparticles delivered through blood may provide insights on the
distribution of plaques inside the artery.
5.4 CONCLUSION
Intravascular photoacoustic imaging is an emerging intravascular imaging
modality that can provide the depth-resolved optical absorption property of the vessel
wall. Based on the characteristic optical absorption spectra of tissues or contrast agents,
IVPA imaging may determine plaque composition, and perform molecular/cellular
specific imaging. Therefore, intravascular ultrasound guided IVPA imaging has the
potential for real-time detection of vulnerable plaques with high accuracy and sufficient
resolution.
Lipid deposits and phagocytically active macrophages in atherosclerotic plaques
were detected ex vivo with spectroscopic IVPA imaging. Lipid deposits were detected

101
based on their absorption peak around 1210 nm wavelength. Phagocytically macrophages
that were in vivo labeled with PEGylated Au NPs can also be detected with spectroscopic
IVPA imaging in the NIR wavelength range with high sensitivity. Because the spectra of
lipids and macrophages loaded with Au NPs do not overlap, IVPA can image
macrophage activity around the lipid-rich plaques in a rabbit model of atherosclerosis. In
the future, in vivo lipid and macrophage detection will be studied with an integrated
IVPA/IVUS imaging catheter, and IVPA imaging of other constituents in atherosclerotic
plaques will be investigated.
5.5 REFERENCES
[1] S. Sethuraman, S. R. Aglyamov, J. H. Amirian, R. W. Smalling, and S. Y.
Emelianov, "Intravascular Photoacoustic Imaging Using an IVUS Imaging
Catheter," IEEE Trans Ultrason Ferroelectr Freq Control, 54(5), (2007).
[2] F. A. Duck, Physical properties of tissue: a comprehensive reference book:
Academic, 1990.
[3] F. Fidanza, A. Keys, and J. T. Anderson, "Density of Body Fat in Man and Other
Mammals," J Appl Physiol, 6(4), pp. 252-256, October 1, 1953 (1953).
[4] J. Shah, S. Thomsen, T. E. Milner, and S. Y. Emelianov, "Ultrasound guidance
and monitoring of laser-based fat removal," Lasers in Surgery and Medicine,
40(10), pp. 680-687, (2008).
[5] J. D. Caplan, S. Waxman, R. W. Nesto, and J. E. Muller, "Near-Infrared
Spectroscopy for the Detection of Vulnerable Coronary Artery Plaques," J Am
Coll Cardiol, 47(8_Suppl_C), pp. C92-96, April 18, 2006 (2006).
[6] R. R. Anderson, W. Farinelli, H. Laubach, D. Manstein, A. N. Yaroslavsky, J.
Gubeli 3rd, K. Jordan, G. R. Neil, M. Shinn, and W. Chandler, "Selective
photothermolysis of lipid-rich tissues: a free electron laser study," Lasers Surg
Med, 38(10), pp. 913-9, (2006).

102
[7] B. Wang, A. B. Karpiouk, and S. Y. Emelianov, "Design of catheter for combined
intravascular photoacoustic and ultrasound imaging," Proceedings of the 2008
IEEE Ultrasonics Symposium, pp. 1150-1153, (2008).
[8] K. Jansen, A. F. W. van der Steen, H. M. M. van Beusekom, J. W. Oosterhuis,
and G. van Soest, "Intravascular photoacoustic imaging of human coronary
atherosclerosis," Opt. Lett., 36(5), pp. 597-599, (2011).
[9] A. B. Karpiouk, B. Wang, and S. Y. Emelianov, "Development of a catheter for
combined intravascular ultrasound and photoacoustic imaging," Review of
Scientific Instruments, 81(1), p. 014901, (2010).
[10] G. Pasterkamp, M. S. van der Heiden, M. J. Post, C. Borst, E. J. Gussenhoven, H.
Pieterman, H. van Urk, and N. Bom, "Discrimination of intravascular lumen and
dissections in single intravascular ultrasound images using subtraction,
conventional averaging and saline flush," Ultrasound in medicine & biology,
21(2), pp. 149-156, (1995).
[11] A. Takagi, K. Hibi, X. Zhang, T. J. Teo, H. N. Bonneau, P. G. Yock, and P. J.
Fitzgerald, "Automated contour detection for high-frequency intravascular
ultrasound imaging: a technique with blood noise reduction for edge
enhancement," Ultrasound in medicine & biology, 26(6), pp. 1033-1041, (2000).
[12] N. Mackman, "Triggers, targets and treatments for thrombosis," Nature,
451(7181), pp. 914-918, (2008).
[13] M. Gössl, D. Versari, H. A. Hildebrandt, T. Bajanowski, G. Sangiorgi, R. Erbel,
E. L. Ritman, L. O. Lerman, and A. Lerman, "Segmental Heterogeneity of Vasa
Vasorum Neovascularization in Human Coronary Atherosclerosis," JACC:
Cardiovascular Imaging, 3(1), pp. 32-40, (2010).
[14] S. Link, M. B. Mohamed, and M. A. El-Sayed, "Simulation of the Optical
Absorption Spectra of Gold Nanorods as a Function of Their Aspect Ratio and the
Effect of the Medium Dielectric Constant," J. Phys. Chem. B, 103pp. 3073-3077,
(1999).
[15] J. L.West and N. J. Halas, "Engineered Nanomaterials for Biophotonics
Applications: Improving Sensing, Imaging, and Therapeutic," Annu. Rev. Biomed.
Eng., 5pp. 285-292, (2003).
[16] Y.-S. Chen, W. Frey, S. Kim, P. Kruizinga, K. Homan, and S. Emelianov, "Silica-
Coated Gold Nanorods as Photoacoustic Signal Nanoamplifiers," Nano Letters,
pp. null-null, (2011).

103
[17] T. Skajaa, D. P. Cormode, E. Falk, W. J. M. Mulder, E. A. Fisher, and Z. A.
Fayad, "High-Density Lipoprotein-Based Contrast Agents for Multimodal
Imaging of Atherosclerosis," Arterioscler Thromb Vasc Biol, 30(2), pp. 169-176,
February 1, 2010 (2010).
[18] M. F. Kircher, J. Grimm, F. K. Swirski, P. Libby, R. E. Gerszten, J. R. Allport,
and R. Weissleder, "Noninvasive In Vivo Imaging of Monocyte Trafficking to
Atherosclerotic Lesions," Circulation, 117(3), pp. 388-395, January 22, 2008
(2008).

104
Bibliography
A.A.Oraevsky and A.A.Karabutov (2003). Optoacoustic tomography, CRC Press.
A.B. Karpiouk, B. Wang, et al. (2010). "Development of a catheter for combined
intravascular ultrasound and photoacoustic imaging." Review of Scientific
Instruments 81(014901): 1-7.
Aaron, J., N. Nitin, et al. (2007). "Plasmon resonance coupling of metal nanoparticles for
molecular imaging of carcinogenesis in vivo." Journal of Biomedical Optics
12(3).
Alivisatos, P. (2004). "The use of nanocrystals in biological detection." Nature
Biotechnology 22: 47-52.
Allen, T. J. and P. C. Beard (2009). "Photoacoustic characterisation of vascular tissue at
NIR wavelengths." Proceedings of SPIE 7177: 71770A.
American, L. I. o. (2007). American National Standard for Safe Use of Lasers, American
National Standards Institute, Inc. ANSI Z136.1-2007.
Anderson, R. R., W. Farinelli, et al. (2006). "Selective photothermolysis of lipid-rich
tissues: a free electron laser study." Lasers in Surgery and Medicine 38(10): 913-
919.
Anderson, R. R., W. Farinelli, et al. (2006). "Selective photothermolysis of lipid-rich
tissues: a free electron laser study." Lasers Surg Med 38(10): 913-919.
Andre Conjusteau, S. A. E., Dmitri Lapotko, Hongwei Liao, Jason Hafner, Mohammad
Eghtedari, Massoud Motamedi, Nicholas Kotov, Alexander A. Oraevsky (2006).
Metallic nanoparticles as optoacoustic contrast agents for medical imaging.
Proceedings of SPIE. 6086: 1605-7422.
Brecht, H. P., D. S. Prough, et al. (2007). "In vivo monitoring of blood oxygenation in
large veins with a triple-wavelength optoacoustic system." Optics Express 15(24):
16261-16269.
Briley-Saebo, K., W. Mulder, et al. (2007). "Magnetic resonance imaging of vulnerable
atherosclerotic plaques: current imaging strategies and molecular imaging
probes." Journal of Magnetic Resonance Imaging 26(3): 460-479.
Brown, K. R., D. G. Walter, et al. (2000). "Seeding of colloidal Au nanoparticle
solutions. 2. Improved control of particle size and shape." Chem. Mater 12(2):
306-313.
Cai, Q.-Y., S. H. Kim, et al. (2007). "Colloidal Gold Nanoparticles as a Blood-Pool
Contrast Agent for X-ray Computed Tomography in Mice." Investigative
Radiology 42(12): 797-806 710.1097/RLI.1090b1013e31811ecdcd.
Caplan, J. D., S. Waxman, et al. (2006). "Near-Infrared Spectroscopy for the Detection of
Vulnerable Coronary Artery Plaques." J Am Coll Cardiol 47(8_Suppl_C): C92-
96.
Chen, Y.-S., W. Frey, et al. (2011). "Silica-Coated Gold Nanorods as Photoacoustic
Signal Nanoamplifiers." Nano Letters: null-null.

105
Choudhury, R. P. and E. A. Fisher (2009). "Molecular Imaging in Atherosclerosis,
Thrombosis, and Vascular Inflammation." Arterioscler Thromb Vasc Biol 29(7):
983-991.
Costanzo, P., P. Perrone-Filardi, et al. (2010). "Does Carotid Intima-Media Thickness
Regression Predict Reduction of Cardiovascular Events?: A Meta-Analysis of 41
Randomized Trials." Journal of the American College of Cardiology 56(24):
2006-2020.
Davis, P. H., J. D. Dawson, et al. (2001). "Carotid Intimal-Medial Thickness Is Related to
Cardiovascular Risk Factors Measured From Childhood Through Middle Age:
The Muscatine Study." Circulation 104(23): 2815-2819.
Diethrich, E. B., M. P. Margolis, et al. (2007). "Virtual Histology Intravascular
Ultrasound Assessment of Carotid Artery Disease: The Carotid Artery Plaque
Virtual Histology Evaluation (CAPITAL) Study." Journal of Endovascular
Therapy 14(5): 676-686.
Douma, K., L. Prinzen, et al. (2009). "Nanoparticles for Optical Molecular Imaging of
Atherosclerosis." Small 5(5).
Duck, F. A. (1990). Physical properties of tissue: a comprehensive reference book,
Academic.
Durand, E., J. S. Raynaud, et al. (2007). "Magnetic resonance imaging of ruptured
plaques in the rabbit with ultrasmall superparamagnetic particles of iron oxide." J
Vasc Res 44(2): 119-128.
Egerev, S., S. Ermilov, et al. (2009). "Acoustic signals generated by laser-irradiated metal
nanoparticles." Applied Optics 48(7): 38-45.
Emelianov, S. Y., S. R. Aglyamov, et al. (2006). Synergy and Applications of Combined
Ultrasound, Elasticity, and Photoacoustic Imaging. Proc. IEEE International
Ultrasonics Symposium.
Emmony, D. C. (1985). "Interaction of IR laser radiation with liquids." Infrared Physics
25(1-2): 133-139.
Falk, E. (2006). "Pathogenesis of Atherosclerosis." J Am Coll Cardiol 47(8_Suppl_C):
C7-12.
Falk, E., P. K. Shah, et al. (1995). "Coronary plaque disruption." Circulation 92(3): 657-
671.
Feinstein, S. B. (2006). "Contrast Ultrasound Imaging of the Carotid Artery Vasa
Vasorum and Atherosclerotic Plaque Neovascularization." Journal of the
American College of Cardiology 48(2): 236-243.
Fidanza, F., A. Keys, et al. (1953). "Density of Body Fat in Man and Other Mammals." J
Appl Physiol 6(4): 252-256.
Finet, G., E. Maurincomme, et al. (1993). "Artifacts in intravascular ultrasound imaging:
Analyses and implications." Ultrasound in medicine & biology 19(7): 533-547.
Fujii, K., D. Kawasaki, et al. (2010). "OCT Assessment of Thin-Cap Fibroatheroma
Distribution in Native Coronary Arteries." J Am Coll Cardiol Img 3(2): 168-175.
Fujimoto, J. G. (2003). "Optical coherence tomography for ultrahigh resolution in vivo
imaging." Nature Biotechnology 21: 1361-1367.

106
Gobin, A. M., M. H. Lee, et al. (2007). "Near-Infrared Resonant Nanoshells for
Combined Optical Imaging and Photothermal Cancer Therapy." Nano Letters
7(7).
Gössl, M., D. Versari, et al. (2010). "Segmental Heterogeneity of Vasa Vasorum
Neovascularization in Human Coronary Atherosclerosis." JACC: Cardiovascular
Imaging 3(1): 32-40.
Gratton, S. E. A., P. A. Ropp, et al. (2008). "The effect of particle design on cellular
internalization pathways." Proceedings of the National Academy of Sciences
105(33): 11613.
Greenland, P., L. LaBree, et al. (2004). "Coronary Artery Calcium Score Combined With
Framingham Score for Risk Prediction in Asymptomatic Individuals." JAMA:
The Journal of the American Medical Association 291(2): 210-215.
Homan, K., S. Kim, et al. (2010). "Prospects of molecular photoacoustic imaging at 1064
nm wavelength." Opt. Lett. 35(15): 2663-2665.
Honda, Y. and P. J. Fitzgerald (2008). "Frontiers in Intravascular Imaging Technologies."
Circulation 117(15): 2024-2037.
Hyafil, F., J. C. Cornily, et al. (2007). "Noninvasive detection of macrophages using a
nanoparticulate contrast agent for computed tomography." Nat Med 13(5): 636-
641.
Jansen, K., A. F. W. van der Steen, et al. (2011). "Intravascular photoacoustic imaging of
human coronary atherosclerosis." Opt. Lett. 36(5): 597-599.
Jiang, W., B. Kim, et al. (2008). "Nanoparticle-mediated cellular response is size-
dependent." Nature Nanotechnology 3(3): 145-150.
Karpiouk, A. B., B. Wang, et al. (2010). "Development of a catheter for combined
intravascular ultrasound and photoacoustic imaging." Review of Scientific
Instruments 81(1): 014901.
Katouzian, A., S. Sathyanarayana, et al. (2008). "Challenges in Atherosclerotic Plaque
Characterization With Intravascular Ultrasound (IVUS): From Data Collection to
Classification." Information Technology in Biomedicine, IEEE Transactions on
12(3): 315-327.
Kharine, A., S. Manohar, et al. (2003). "Poly (vinyl alcohol) gels for use as tissue
phantoms in photoacoustic mammography." Physics in Medicine and Biology
48(3): 357-370.
Kircher, M. F., J. Grimm, et al. (2008). "Noninvasive In Vivo Imaging of Monocyte
Trafficking to Atherosclerotic Lesions." Circulation 117(3): 388-395.
Kolodgie, F. D., H. K. Gold, et al. (2003). "Intraplaque Hemorrhage and Progression of
Coronary Atheroma." New England Journal of Medicine 349(24): 2316-2325.
Kolodgie, F. D., A. S. Katocs, Jr, et al. (1996). "Hypercholesterolemia in the rabbit
induced by feeding graded amounts of low-level cholesterol: methodological
considerations regarding individual variability in response to dietary cholesterol
and development of lesion type." Arterioscler Thromb Vasc Biol 16(12): 1454-
1464.

107
Komachi, Y., H. Sato, et al. (2006). "Intravascular Raman spectroscopic catheter for
molecular diagnosis of atherosclerotic coronary disease." Appl. Opt. 45(30):
7938-7943.
Konig, A. and V. Klauss (2007). "Virtual histology." Heart 93(8): 977-982.
König, A., M. P. Margolis, et al. (2008). "Technology Insight: in vivo coronary plaque
classification by intravascular ultrasonography radiofrequency analysis." Nature
Clinical Practice Cardiovascular Medicine 5(4): 219-229.
Kwon, H. M., G. Sangiorgi, et al. (1998). "Adventitial vasa vasorum in balloon-injured
coronary arteries: visualization and quantitation by a microscopic three-
dimensional computed tomography technique." J Am Coll Cardiol 32(7): 2072-
2079.
L.West, J. and N. J. Halas (2003). "Engineered Nanomaterials for Biophotonics
Applications: Improving Sensing, Imaging, and Therapeutic." Annu. Rev.
Biomed. Eng. 5: 285-292.
Laufer, J., D. Delpy, et al. (2007). "Quantitative spatially resolved measurement of tissue
chromophore concentrations." Physics in Medicine and Biology 52: 141-168.
Li, P. C., C. R. C. Wang, et al. (2008). "In vivo photoacoustic molecular imaging with
simultaneous multiple selective targeting using antibody-conjugated gold
nanorods." Optics Express 16(23): 18605-18615.
Libby, P. (2002). "Inflammation in atherosclerosis." Nature 420(6917): 868-874.
Link, S., M. B. Mohamed, et al. (1999). "Simulation of the Optical Absorption Spectra of
Gold Nanorods as a Function of Their Aspect Ratio and the Effect of the Medium
Dielectric Constant." J. Phys. Chem. B 103: 3073-3077.
Lloyd-Jones, D., R. Adams, et al. (2008). "Heart Disease and Stroke Statistics--2009
Update. A Report From the American Heart Association Statistics Committee and
Stroke Statistics Subcommittee." Circulation.
Lukianova-Hleb, E., Y. Hu, et al. (2010). "Plasmonic Nanobubbles as Transient Vapor
Nanobubbles Generated around Plasmonic Nanoparticles." ACS nano 4(4): 2109-
2123.
Mackman, N. (2008). "Triggers, targets and treatments for thrombosis." Nature
451(7181): 914-918.
Mallidi, S., T. Larson, et al. (2009). "Multiwavelength photoacoustic imaging and
plasmon resonance coupling of gold nanoparticles for selective detection of
cancer." Nano letters.
Mallidi, S., T. Larson, et al. (2009). "Multiwavelength Photoacoustic Imaging and
Plasmon Resonance Coupling of Gold Nanoparticles for Selective Detection of
Cancer." Nano Letters 9(8): 2825-2831.
Masashi, S. and I. Takashi (2009). "The Watanabe heritable hyperlipidemic (WHHL)
rabbit, its characteristics and history of development: A tribute to the late Dr.
Yoshio Watanabe." Atherosclerosis 207(1): 1-7.
Maslov, K. and et al. (2007). "Effects of wavelength-dependent fluence attenuation on
the noninvasive photoacoustic imaging of hemoglobin oxygen saturation in
subcutaneous vasculature in vivo." Inverse Problems 23(6): S113.

108
Matter, C. M., M. Stuber, et al. (2009). "Imaging of the unstable plaque: how far have we
got?" European Heart Journal 30(21): 2566-2574.
Moreno, P. R., K. R. Purushothaman, et al. (2004). "Plaque Neovascularization Is
Increased in Ruptured Atherosclerotic Lesions of Human Aorta: Implications for
Plaque Vulnerability." Circulation 110(14): 2032-2038.
Murphy, C. J., A. M. Gole, et al. (2008). "Gold Nanoparticles in Biology: Beyond
Toxicity to Cellular Imaging." Acc Chem Res.
Naghavi, M., P. Libby, et al. (2003). "From vulnerable plaque to vulnerable patient a call
for new definitions and risk assessment strategies: Part I." Circulation 108(14):
1664-1672.
Nair, A., B. D. Kuban, et al. (2002). "Coronary Plaque Classification With Intravascular
Ultrasound Radiofrequency Data Analysis." Circulation 106(17): 2200-2206.
Niidome, T., M. Yamagata, et al. (2006). "PEG-modified gold nanorods with a stealth
character for in vivo applications." Journal of Controlled Release 114(3): 343-
347.
Nissen, S. and P. Yock (2001). "Intravascular ultrasound novel pathophysiological
insights and current clinical applications." Circulation 103(4): 604-616.
Pardoe, H., W. Chua-anusorn, et al. (2003). "Detection limits for ferrimagnetic particle
concentrations using magnetic resonance imaging based proton transverse
relaxation rate measurements." Phys Med Biol 48(6): N89-95.
Pasterkamp, G., M. S. van der Heiden, et al. (1995). "Discrimination of intravascular
lumen and dissections in single intravascular ultrasound images using subtraction,
conventional averaging and saline flush." Ultrasound in medicine & biology
21(2): 149-156.
Prahl, S. A. (2001). "Optical properties spectra compiled by Scott Prahl." 2009, from
http://omlc.ogi.edu/spectra/.
Rechberger, W., A. Hohenau, et al. (2003). "Optical properties of two interacting gold
nanoparticles." Optics Communications 220(1-3): 137-141.
Roggan, A., M. Friebel, et al. (1999). "Optical properties of circulating human blood in
the wavelength range 400--2500 nm." Journal of Biomedical Optics 4(1): 36-46.
Rudd, J. H. F., F. Hyafil, et al. (2009). "Inflammation Imaging in Atherosclerosis."
Arterioscler Thromb Vasc Biol 29(7): 1009-1016.
S. Kim, S. Park, et al. (2008). "Improvement of displacement estimation using
autocorrelation." Proc. International Conference on the Ultrasonic Measurement
and Imaging of Tissue Elasticity: 58.
Sanz, J. and Z. A. Fayad (2008). "Imaging of atherosclerotic cardiovascular disease."
Nature 451(7181): 953-957.
Sethuraman, S., S. R. Aglyamov, et al. (2007). "Intravascular Photoacoustic Imaging
Using an IVUS Imaging Catheter." IEEE Trans Ultrason Ferroelectr Freq Control
54(5).
Sethuraman, S., J. H. Amirian, et al. (2008). "Spectroscopic intravascular photoacoustic
imaging to differentiate atherosclerotic plaques." Optics Express 16(5): 3362-
3367.

109
Shah, J., S. Thomsen, et al. (2008). "Ultrasound guidance and monitoring of laser-based
fat removal." Lasers in Surgery and Medicine 40(10): 680-687.
Sigrist, M. W. (1986). "Laser generation of acoustic waves in liquids and gases." Journal
of Applied Physics 60(7): R83-R122.
Skajaa, T., D. P. Cormode, et al. (2010). "High-Density Lipoprotein-Based Contrast
Agents for Multimodal Imaging of Atherosclerosis." Arterioscler Thromb Vasc
Biol 30(2): 169-176.
Sluimer, J. C., F. D. Kolodgie, et al. (2009). "Thin-Walled Microvessels in Human
Coronary Atherosclerotic Plaques Show Incomplete Endothelial Junctions:
Relevance of Compromised Structural Integrity for Intraplaque Microvascular
Leakage." Journal of the American College of Cardiology 53(17): 1517-1527.
Soest, G. v., T. Goderie, et al. (2010). "Atherosclerotic tissue characterization in vivo by
optical coherence tomography attenuation imaging." Journal of Biomedical Optics
15(1): 011105.
Sokolov, K., J. Aaron, et al. (2003). "Optical systems for in vivo molecular imaging of
cancer." Technol Cancer Res Treat 2(6): 491-504.
Sokolov, K., J. Aaron, et al. (2003). "Optical Systems for In Vivo Molecular Imaging of
Cancer." Technology in Cancer Research & Treatment 2(6).
Steinberg, D. (2005). "Thematic review series: The Pathogenesis of Atherosclerosis. An
interpretive history of the cholesterol controversy, part III: mechanistically
defining the role of hyperlipidemia." Journal of Lipid Research 46(10): 2037-
2051.
Sun, J. M. and B. S. Gerstman (1999). "Photoacoustic generation for a spherical absorber
with impedance mismatch with the surrounding media." Physical Review E 59(5):
5772.
Takagi, A., K. Hibi, et al. (2000). "Automated contour detection for high-frequency
intravascular ultrasound imaging: a technique with blood noise reduction for edge
enhancement." Ultrasound in medicine & biology 26(6): 1033-1041.
Tam, A. C. (1986). "Applications of photoacoustic sensing techniques." Reviews of
Modern Physics 58(2): 381.
Tearney, G. J., H. Yabushita, et al. (2003). "Quantification of Macrophage Content in
Atherosclerotic Plaques by Optical Coherence Tomography." Circulation 107(1):
113-119.
Thim, T., M. K. Hagensen, et al. (2010). "Unreliable Assessment of Necrotic Core by
Virtual Histology Intravascular Ultrasound in Porcine Coronary Artery Disease."
Circ Cardiovasc Imaging 3(4): 384-391.
Tsai, C. L., J. C. Chen, et al. (2001). "Near-infrared absorption property of biological soft
tissue constituents." Journal of Medical and Biological Engineering 21(1): 7-14.
Vela, D., L. Buja, et al. (2007). "The role of periadventitial fat in atherosclerosis."
Archives of pathology & laboratory medicine 131(3): 481.
Virmani, R., A. P. Burke, et al. (2002). "Pathology of the unstable plaque." Progress in
Cardiovascular Diseases 44(5): 349-356.

110
von Maltzahn, G., J.-H. Park, et al. (2009). "Computationally guided photothermal tumor
therapy using long-circulating gold nanorod antennas." Cancer Research 69(9):
3892-3900.
Wang, B., A. B. Karpiouk, et al. (2008). "Design of catheter for combined intravascular
photoacoustic and ultrasound imaging." Proceedings of the 2008 IEEE
Ultrasonics Symposium: 1150-1153.
Wang, B., E. Yantsen, et al. (2009). "Plasmonic Intravascular Photoacoustic Imaging for
Detection of Macrophages in Atherosclerotic Plaques." Nano Lett 9(6): 2212–
2217.
Wang, B., E. Yantsen, et al. (2009). High sensitivity intravascular photoacoustic imaging
of macrophages. Proceedings of SPIE.
Wang, B., J. L. Su, et al. (2010). "Detection of lipid in atherosclerotic vessels using
ultrasound-guided spectroscopic intravascular photoacoustic imaging." Opt.
Express 18(5): 4889-4897.
Wang, L. V. and H.-I. Wu (2007). Biomedical opitcs, John Wiley & Sons.
Yun-Sheng Chen, W. Frey, et al. (2011). Personal discussion.
Yun, S. H., G. J. Tearney, et al. (2006). "Comprehensive volumetric optical microscopy
in vivo." Nat Med 12(12): 1429-1433.
Zhang, E., J. Laufer, et al. (2008). "Backward-mode multiwavelength photoacoustic
scanner using a planar Fabry-Perot polymer film ultrasound sensor for high-
resolution three-dimensional imaging of biological tissues." Appl Opt 47(4): 561-
577.
Zhang, H. F., K. Maslov, et al. (2006). "Functional photoacoustic microscopy for high-
resolution and noninvasive in vivo imaging." Nature Biotechnology 24: 848-851.
Zhang, Z., J. Machac, et al. (2006). "Non-invasive imaging of atherosclerotic plaque
macrophage in a rabbit model with F-18 FDG PET: a histopathological
correlation." BMC Nucl Med 6: 3.


