51
Copyright by Christopher Jessie Rodriguez 2013

Copyright
by
Christopher Jessie Rodriguez
2013

The Report Committee for Christopher Jessie Rodriguez
Certifies that this is the approved version of the following report:
Applied Statistics in the Classroom
APPROVED BY
SUPERVISING COMMITTEE:
David Allen
Pengyu Ren
Supervisor:
Co-Supervisor:
Applied Statistics in the Classroom
by
Christopher Jessie Rodriguez, B.S.
Report
Presented to the Faculty of the Graduate School of
The University of Texas at Austin
in Partial Fulfillment
of the Requirements
for the Degree of
Master of Arts
The University of Texas at Austin
August 2013

Dedication
I dedicate this work to my loving, supportive parents, without whom I could not
have the resolve and perseverance to extend my education this far. My parents inspire me
to reach for seemingly unattainable heights and to continue striving through both hard
times and good, for they have shown me what can be accomplished through honest, hard
work. I owe any degree of success I achieve to them.
I also want to thank my educators and mentors for their help and guidance
throughout this program. They have set forth such a model of excellence and
professionalism that is truly motivational. I will consider myself blessed to attain but a
fraction of the poise and regard they have.
v
Applied Statistics in the Classroom
Christopher Jessie Rodriguez, M.A.
The University of Texas at Austin, 2013
Supervisors: David Allen, Pengyu Ren
The purpose of this report is to give teachers of AP Statistics a way to enrich
student learning with an engaging, rigorous and relevant project. The report details the
reasons necessary for student-based learning, along with examples in which projects in
classrooms were successful. The project is centered on categorical data analysis involving
tests of proportions, chi-squared distributions and confidence intervals. There are
supplemental worksheets provided with the intent of showing students the relevance and
applications of what they are learning to actual studies. Finally, a rubric is provided for
students to align and focus their projects as well as for teachers to assess student learning.

vi
Table of Contents
Chapter 1: Introduction………… ............................................................................1
Chapter 2: Review of Literature ..............................................................................3
Statistics in the Classroom: A Brief History ...................................................3
The Importance of Applied Statistics in the Classroom .................................4
The Current State of Applied Statistics in the Classroom ..............................4
Problems with Applied Statistics in the Classroom ........................................8
Chapter 3: Lesson Discussion ...................................................………………….10
Aligning to the Exam ....................................................................................10
Unit Discussion: Introduction .......................................................................12
Unit Discussion: Worksheet 1 ......................................................................13
Unit Discussion: Worksheet 2 ......................................................................15
Unit Discussion: Worksheet 3 ......................................................................17
Unit Discussion: The Project ........................................................................19
Chapter 4: Discussion and Conclusion .....................................………………….22
Revisions and Modifications.........................................................................22
Conclusion ....................................................................................................23
Chapter 5: Application to Practice ............................................………………….25
Revisions and Modifications.........................................................................25
Revisions and Modifications.........................................................................25
Revisions and Modifications.........................................................................26
Revisions and Modifications.........................................................................28
Appendix A: Worksheet 1 .....................................................................................30
Appendix B: Worksheet 2 ......................................................................................33
Appendix C: Worksheet 3 ......................................................................................37
Appendix D: Project Handouts ..............................................................................41
Bibliography ..........................................................................................................44

1
Chapter 1: Introduction
Statistical knowledge and understanding play an important part in connecting
mathematics to our everyday lives and take a central role in exercising citizenship. We
are constantly called upon to make choices based on analyzing data and frequent
references to statistics fill our days. (Carvalho and Solomon 2012) From politics to
science, healthcare to sports, shopping, money management or even checking the
weather, collecting, organizing, describing and interpreting data are skills that are
increasingly important and are the core of statistics. Therefore, improving these skills
should be the main goal of statistics education.
Statistics is important for various disciplines such as education, business,
psychology and government. Our world is rapidly changing and students, as future
members of the workforce, will need to reason mathematically to use advanced
technology and other sophisticated resources to stay current with this evolving
technology. As such, students require access to quality mathematics education or we risk
hindering their success. (Halili and Olea 2012) Statistics education teaches how to read
and comprehend data and studies presented in scientific publications, newspapers and
other media, evaluate arguments based on research and then make sound decisions
informed by data. These are necessary skills for reading and understanding information
encountered in daily life, advancing further in one’s career and continuing one’s
education. (Cantürk-Günhan , Bukova-Güzel & Özgür 2012)

2
Applied statistics in the classroom is immensely helpful to our students. As
teachers, we have to keep our students interested long enough so that learning can take
place. In this regard, statistics has the ability to delve into their lives, building
mathematics around them in ways that are directly relatable to our students and engage
them in ways that surpass traditional teaching methods. Students are more willing to
participate in assignments that directly relate to their everyday lives. Studying local
issues, the issues of their peers and subjects relevant to the student can increase
motivation and strengthen understanding. An applied statistics class or a course
integrating applied statistics can accomplish these goals for us as teachers and our
students. (Burdette and McLoughlin 2010)
To this end, incorporating applied statistics into the classroom is necessary not
just for statistics education but education as a whole. The inferential reasoning that comes
from statistics is essential in our school curriculum. The obvious choice is in an AP
Statistics classroom where all subjects can be broached. Any topic in the news can be
made into an AP Statistics lesson of the day and, if done correctly, an engaging, relatable
and worthwhile unit. By making students grapple with intriguing real-world problems
that demonstrate the intellectual content and broad applicability of statistics as a
discipline, we can foster critical reasoning skills and inferential reasoning necessary to
elevate our students to the next level and ready them for post-secondary education and
the workforce.
3
Chapter 2: Review of Literature
Statistics in the Classroom: A Brief History
Statistics, as a discipline, has been around for roughly 250 years, making it a
relatively new mathematical concept. As a high school course, statistics is still in its
infancy. The first AP Statistics course was not taught until the 1996-1997 school year.
Before this, statistics classes were not very cohesive. The first curriculum strand by the
National Council of Teachers of Mathematics was not published until the late 1980s. The
strand contained data analysis and probability which, before, had no identifiable place in
the K-12 curriculum. However, teachers failed to promote data analysis in their
classrooms in the mid-90s, spending less time than what was proposed, despite
interventions and adequate resources provided. (Franklin, Hartlaub, Peck, Scheaffer,
Thiel and Freier 2011)
This coincided with The College Board’s interest in offering a statistics course.
The amount of mathematical science courses offered by The College Board was slim and
the institution was looking to expand this section. The developers of this course focused
on conceptual understanding and understood the importance of technological advances in
mathematics as a tool for data collection, analysis and conceptual understanding.
(Franklin, Hartlaub, Peck, Scheaffer, Thiel and Freier 2011)
As an AP course, The College Board needed AP Statistics to be accepted by
colleges and universities as credit for an introductory statistics course. To do so, the
developers decided that AP Statistics would cover more content topics than what typical

4
college-level introductory statistics classes cover. Despite not mirroring a typical college
course in its first years, universities, colleges, professors and other mathematical entities
decided that The College Board had developed a richer, deeper, more engaging and more
effective curriculum. Introductory statistics courses at colleges have now been
transformed based on the achievements, research and success of AP Statistics. (Franklin,
Hartlaub, Peck, Scheaffer, Thiel and Freier 2011)
The Importance of Applied Statistics in the Classroom
Teachers today have the responsibility of narrowing down the different aspects of
various subjects and applying them to their lessons. If done correctly, these lectures
further the ability of students to “question reality, identify the knowledge required for
dealing with problems common in daily life and assess the appropriateness of knowledge
and procedures”. (Carvalho and Solomon 2012) One problem that commonly arises in
this area is that different social classes and ethnicities have differing perspectives in their
daily lives and the problems they encounter. For instance, word problems combine
mathematics with familiar situations that normally are not associated with mathematics.
Because the circumstances of the problems are familiar enough, students incorporate their
own understanding of everyday life into the problem. The dilemma for the educator then
becomes discerning what the student’s understanding of everyday life is and its
appropriateness for the current problem. Working class students, more so than middle
class students, are more likely to accidentally call upon “inappropriate” every day
knowledge because “the sense of the ‘obvious’ or the ‘appropriate’ has to be learned,

5
either in the home or the school” (Carvalho and Solomon 2012). Working class students
are at a disadvantage in this respect, having to rely primarily upon school to teach them
this sense of the ‘obvious’.
In the statistics classroom, we can help overcome these issues by relating statistics
to real life, organizing open-ended activities and infusing these activities with guided
questions. (Cantürk-Günhan , Bukova-Güzel & Özgür 2012) The transition from
traditional lectures to open-ended activities can be done through the use of these guided
questions, which can lead students through an entire research process and keep teacher-
centered instruction to a minimum. This method of learning helps move students from
doing short, focused homework problems to creating open-ended investigations using
statistics that can last upwards to an entire term (Kuiper and Collins 2009). Students then
become more engaged and more willing to examine “nuances and difficulties that seem
unimportant in a traditional textbook/lecture presentation” (Root and Thorme 2001).
Student-centered learning, in which the student plays an active role in their own
education, gives students opportunities to apply prior knowledge to new situations and
achieve new knowledge through this interaction. If students are only exposed to the
traditional way of learning, they cannot learn how to analyze information critically or
deal with original problems or situations (Cantürk-Günhan , Bukova-Güzel & Özgür
2012). To accomplish this goal, statistics should be problem-solving rather than simply
formulas and rote operations. Students should have the opportunity to become
statisticians through data analysis of real sets of data that provide legitimacy and
6
credibility to the project. Analysis of data and critical thinking through higher-ordered
questioning of the world presented to our students is much needed in disciplines
involving statistics. Combining this with critical discussion at each crucial juncture of the
project of how and why statistics are used provide enriching, worthwhile and relatable
learning opportunities in ways that traditional lecturing simply cannot (Carvalho and
Solomon 2012).
The Current State of Applied Statistics in the Classroom
Applied statistics in the classroom is still a relatively new field but is emerging
quickly. The University of Toronto offers a series of First Year Seminars, titled ‘Lies,
Damned Lies, and Statistics’ intended to serve as a small-group learning experience for
the students. The seminar has no assigned textbook, instead choosing current news items,
health studies and clinical trials to discuss descriptive statistics, linear regression,
confounding variables, time series, ethics in statistical practice and other topics that
normally do not appear in an introductory statistics class. The seminar generally receives
positive reviews and provides a great refresher course for beginning statistics students
who plan to take an introductory statistics course (Plante and Reid 2011).
An applied statistics project done at a community college had students in
introductory sociology courses compare and contrast the demographic characteristics of
two counties in their state using the data from the 2000 Census Bureau. Students
compared and contrasted the two counties’ local media information and
sociological thinking. The project had five main steps: data collection, critical

7
examination of the data, formulation of two research questions, literature research, and a
summary. Throughout the project, students made connections and used a sociological
framework to understand trends in their local communities. (Burdette and McLoughlin
2010)
Another college had a course that was a series of 2-3 weeklong guided labs of
increasing difficulty. The first lab had students figure out how to predict the worth of a
car through multiple linear regression of various pre-determined data sets and heavily
guided leading questions. The next set of labs set aside a day for discussion over
assigned reading related to the lab, followed by data analysis, interpretation and
presentations of their findings. Later, in more advanced labs, students formulated their
own hypotheses and explanatory variables. The professors have found that this course
and the labs involved improve the overall quality of student work. Students are better
able to develop research questions that are general enough to be interesting, yet specific
enough to analyze in the given time frame. Students become enthusiastic about their work
and improve upon the presentation of key concepts to peers and faculty. (Kuiper and
Collins 2009)
A professor at a different college implements statistics projects in her social work
statistics class. She first identifies a community social service agency wanting data
analysis assistance and then structures class assignments around that agency's data and
her prescribed textbook. Students spend a few weeks of the course working on
preparing agency documents for data entry and entering the data, which, with teacher-led
discussions and guiding questions, coincides with coverage of introductory chapters in
8
the course text. The first major class assignment evaluates student interpretations
of frequency tables, measures of central tendency, figures and graphs, and other
descriptive statistics. Class sessions in the second half of the semester are divided into
class lecture and hands-on bivariate data analysis, focusing on chi square, t test, ANOVA,
and correlation to stay aligned with the textbook. The second major class assignment
evaluates student interpretation of appropriate bivariate or multivariate analyses, or both.
Students revise the first two major assignments and put together a final report for
the community agency. (Wells 2006)
Problems with Applied Statistics in the Classroom
In the previous examples, some common problems occurred. Students reported
that they did not have enough time to properly analyze the data and do more with their
project. Students also complained that data entry is too time consuming and difficult
(Wells 2006).Conducting literature research also proved problematic. Finding useful,
reliable sources was the most difficult part for most projects. Students turned in papers
trying to explain their research questions without using any sources or using unreliable
sources, such as blogs or non-credible Web sites (Burdette and McLoughlin 2010).
Another, somewhat surprising, problem is over-skepticism in dealing with
articles. Many newspaper articles are overstated and tend to use misleading statistics to
increase their shock value. After reviewing numerous news articles over the weeks,
students begin to have a negative outlook on their media sources. One student was quoted
as saying, “Can we believe any of these studies?” (Plante and Reid 2011).
9
As identified earlier, social classes and ethnicities may be treated unfairly if the
project is not set-up correctly. Without the use of proper guiding questions, students’
discussions and interpretations may be too dependent on their prior experiences and
cultural influences, leading to “the use of factually incorrect or contextually
inappropriate experiences and influences.” (Carvalho and Solomon 2012)
Despite the pitfalls that may be embedded in certain aspects of project-based
activities or overly strict time constraints of the testing schedule, students can still take
away much from these courses. For example, while students may report that data entry is
too time consuming or difficult, their comments also suggest that these difficulties
provide valuable insights into how the method of collecting data affects statistical
analysis. Students noted that data entry allowed the class to see "a real-life dilemma" and
that overall data entry provided "a good learning opportunity." (Wells 2006)

10
Chapter 3: Lesson Discussion
Aligning to the Exam
By the end of this unit, the student will have reviewed roughly 50% of what is
covered on the AP Statistics exam. The College Board website has the following topics
and the percentage each topic is covered on the test. I have included the topics that the
worksheets and project will cover.
Sampling and Experimentation: Planning and conducting a study (10%–15%)
Data must be collected according to a well-developed plan if valid information on a
conjecture is to be obtained. This plan includes clarifying the question and deciding upon
a method of data collection and analysis.
o Overview of methods of data collection
Census
Sample survey
Experiment
Observational study
o Planning and conducting surveys
Characteristics of a well-designed and well-conducted survey
Populations, samples and random selection
Sources of bias in sampling and surveys
Sampling methods, including simple random sampling, stratified
random sampling and cluster sampling
o Planning and conducting experiments
Characteristics of a well-designed and well-conducted experiment
Treatments, control groups, experimental units, random
assignments and replication
Sources of bias and confounding, including placebo effect and
blinding
Completely randomized design
o Generalizability of results and types of conclusions that can be drawn
from observational studies, experiments and surveys
Anticipating Patterns: Exploring random phenomena using probability and
simulation (20%–30%)
Probability is the tool used for anticipating what the distribution of data should look like
under a given model.
o Probability
Interpreting probability, including long-run relative frequency
interpretation

11
Addition rule, multiplication rule, conditional probability and
independence
o The normal distribution
Properties of the normal distribution
Using tables of the normal distribution
The normal distribution as a model for measurements
o Sampling distributions
Sampling distribution of a sample proportion
Sampling distribution of a sample mean
Central Limit Theorem
Sampling distribution of a difference between two independent
sample proportions
Chi-square distribution
Statistical Inference: Estimating population parameters and testing hypotheses
(30%–40%)
Statistical inference guides the selection of appropriate models.
o Estimation (point estimators and confidence intervals)
Estimating population parameters and margins of error
Logic of confidence intervals, meaning of confidence level and
confidence intervals, and properties of confidence intervals
Large sample confidence interval for a proportion
Large sample confidence interval for a difference between two
proportions
o Tests of significance
Logic of significance testing, null and alternative hypotheses; p-
values; one- and two-sided tests;
Large sample test for a proportion
Large sample test for a difference between two proportions
Chi-square test for goodness of fit, homogeneity of proportions,
and independence (one- and two-way tables)
There are 3 worksheets created involving peer-reviewed articles over relevant
issues to students, such as driving safety and drug usage amongst students. Each
worksheet has excerpts from a single article that has only been modified for length, not
vocabulary or syntax. Exposing students to professional works gives them expectations of
what they will need to do and can be engaging to the student if not too overwhelming,
which is why I decided to omit sentences that were not relevant to what students are
learning in the course.

12
The unit is designed with Block scheduling in mind and is meant to supplement
categorical analysis as it is covered, with the project being completed by the students
throughout. The topics covered throughout should involve categorical analysis, including
1- and 2-Sample Z Tests for Proportions, Confidence Intervals and Χ2 tests for Goodness
of Fit and Homogeneity/Independence. The focus of the unit is over categorical analysis
of contingency tables from independent populations, which can be explored using 1 or 2
sample proportion tests and confidence intervals and/or the various Χ2 tests. The project
designed at the end of the unit focuses solely on categorical data analysis. Throughout the
teaching of categorical analysis, frequent references to the students’ projects should be
made to engage student interest and get them thinking more critically since the methods
relate to them.
Unit Discussion: Introduction
For the intro of the unit, the project should be announced and the handouts, “AP
Statistics Project – Categorical Data” and “AP Statistics Survey Project Scoring Rubric”
(Appendix D), should be given to the students. This can be done any time during the
regular teaching of the categorical chapters but it is ideally done on the first day. The
teacher should either inform students that they are to form groups of 2 or 3 or assign
groups with whatever method deemed appropriate, i.e. needs-based, randomly. The first
goal of the students is to brainstorm ideas within their teams. Before the first worksheet
for this unit, the students should submit their typed proposal and been approved. Remind
students of the different sampling methods and different experimental designs for help
with their proposal and so inference can be made.

13
The worksheets are a mix of multiple choice and free response questions, as is the
format of the AP exam. The multiple choice questions are not designed to make
answering the question easier. They are in the format of the AP exam in which all
possible “plausible” answers are given as choices and students must choose the best
answer among several good, but flawed, answers. The worksheets are intended to be
covered as a class, unless otherwise stated. Making the worksheets relevant to the
students by referencing their project and relating the problems and calculations to what
the students should be doing for their data can build engagement in the students.
Unit Discussion: Worksheet 1
The first worksheet, “Driver and Passenger Seatbelt Use Among U.S. High
School Students” (Appendix A), covers sampling and experimentation, probability and
statistical inference with confidence intervals. This is best given after covering
confidence intervals in the categorical data chapters. The role of probability in this unit is
downplayed for time and relevance. The first 3 questions cover experimentation and
sampling design. A follow-up question to the sampling design can be to have a student
identify what the multiple stages of the sampling method are.
Question 4, dealing with probability, is fairly straight-forward and is a reminder to
the students that more information can be inferred from the table than what is shown, in
this case, by taking the complement. Question 5 is meant as a set-up for Question 6.
Question 5 can be done as a class and Question 6 can be done independently, checking
for understanding. Questions 7 and 8, done as a class, are meant to be set-up for questions
9 and 10, done independently to check for understanding. The teacher may choose to go

14
over 9 and 10 as a class after sufficient time has been given for students to complete it on
their own. Question 11 is designed so students review calculating confidence intervals.
No interpretation of the interval is necessary for this question because the remaining
questions deal strictly with interpretation. Question 12 can be independently solved to
check for understanding for Question 11. The remaining 3 questions should be discussed
as a class. The last question should bring about discussion over questions 4 and 5 since
question 4 deals with a “difference” in proportions and question 5 deals with an actual
direction. Discuss what the appropriate alpha levels are for those 2 questions. This can
also lead into a discussion about power since there are two alpha levels. Remind students
that they will need to use confidence intervals in their interpretation of their data.
Between the first worksheet and the second worksheet, the students should
complete their data collection. The second and third worksheets are designed as a review
of categorical analysis as well as present students with ideas as to how to arrange their
data and interpret. There most likely will not be much time between worksheets 2 and 3
since they are both given at the end of the unit, possibly back-to-back. A deadline for
phase 3 of the project, interpreting the data, should be informed at the beginning of
worksheet two and should be set after worksheet three. A day may be set aside after
worksheet three for students to work in groups on their project. This day should be
focused primarily on data organization and, based on the organization, the different tests
that are appropriate. This last point is stressed in the last worksheet where the students
see how a Goodness of Fit test for one organization of the data can be turned into a test
for difference in proportions or Test for Independence if the data are rearranged. Once the

15
students have analyzed their data, the written report and presentation should be due soon
after, possibly simultaneously.
Unit Discussion: Worksheet 2
Worksheet Two (Appendix B), “Panel Conditioning: Choosing Your Words
Carefully”, is best done after the first day of the Χ2 distribution. It focuses on
experimentation and sampling design, as well as probability and statistical inference
using the Χ2 Test for Independence. The first 7 questions are over sampling and
experimentation design. The intent of the research done in the article was to find out if
the act of exposing students to questions regarding drug use causes students to use drugs
more often. There was some significance found in the paper supporting their hypothesis
and this can lead to a discussion over ethics in statistics, relating to the appropriateness of
their projects.
The first 3 questions are a review of the first worksheet, so students can work
independently on those questions. Questions 4-7 may need some prepping as these relate
to the second part of the study. Have students answer question 4 independently. Then,
inform students that in order for the researchers to carry out their experiment, they
needed to gather preliminary data in the form of the survey done in the first part of the
study. This is done fairly often when data is not already present for comparison. For
question 7, some potential problems come from the randomization process, which can
make the generalization of results questionable.
Questions 8 – 12 deal with probability, with question 9, 11 and 12 dealing with
Independence of the form P(B|A) = P(B). Questions 8 – 12 should be worked together,

16
with teacher guidance. For Question 12, there should be some discussion over what it
means that the two responses are not independent. This could suggest that the researches
are correct in thinking that some change has occurred between the years. Discussion can
also be had over whether this could suggest that exposure to the drug module is
responsible for this change.
Questions 13 – 16 are very typical Χ2 related questions but can be done as a class.
The same discussions regarding independence can be had that were done for question 12,
emphasizing what the use of independence means. In this case, rejecting independence
means we conclude an association between the two years. Answering “Yes” for a
particular year is influenced by the answer of a different year.
For question 17, we get to the assumptions for the Χ2 test, the focus being that the
assumptions do not hold under inspection. The samples of data were obtained with some
degree of randomization but the samples are not independent. Discussion should revolve
around the use of the word independent for sample selection being different than for
sample responses. The samples, in this case, are dependent because they have been
matched. What one subject said in 2008 gets matched to 2009. Therefore, the conclusions
in question 16 are not valid because we chose the incorrect test. The correct test is
beyond the scope of this course. Some discussion may occur around what students are
doing in their project and making care to choose the correct test. If students find that their
samples are not independent, they may want to reconfigure their data so they can at least
run a Goodness of Fit test. The remainder of the worksheet can be assigned as homework

17
since it is a direct copy of questions 8 – 18, but with a different, still dependent, table
from the article. Again, remind students that Χ2 tests are necessary for their project.
Unit Discussion: Worksheet 3
The final worksheet (Appendix C), “Why Do People Drink?”, is best given at the
end of the categorical analysis chapter. It deals with surveys, Χ2 Goodness of Fit, 2-
Sample Z-Test for Proportions and the Χ2 Test for Independence. Of the first four
questions, only question 2 may need teacher led guidance but all four questions should be
answered independently before coming together as a class. The goal of question 2 is to
reinforce the differences between experimentation (using a treatment) and observation
studies (no treatment).
Questions 5 and 6 deal with univariate tables and serves more as a reminder of
what students can do with their table if they happen to have random variables involved.
Questions 7 – 11 deal with the GOF test. Some discussion should be made about failing
to reject the Null Hypothesis for this table. We do not accept that the amount of heavy
drinkers is the same for each level of income. This table simply does not show evidence
that the amount of heavy drinkers is different for the various levels of income. This is
shown in the remainder of the worksheet in which the drinkers are separated by gender
and we can see differences for this table. Questions 12 – 15 should be worked as a class.
Question 16 should entail discussion over what rejecting the Null Hypothesis means
versus failing to reject the Null Hypothesis. Question 15 should have discussion over why
the two separate tests result in the same conclusion, as in which test is more appropriate
and which test has more power. The remainder of the worksheet can be assigned for

18
homework since it is a copy of questions 5-16. The teacher may want to remind students
that, for their project, the students may want to examine their data as separate categories
or collapse categories, if possible and compare results.
With worksheet 3 completed, the unit is completed and the students should have
all relevant tools required to complete their project. If a day is set aside for phase 3, the
next meeting should be for turning in their written report and giving their presentation. If
frequent references to the students’ projects were made throughout the worksheets and
the categorical units about how the students can use the various methods for their data,
this can build student engagement and critical thinking. Student understanding can be
observed through their interpretation during the presentation, answering students’
questions and by reading their report and grading it according to the rubric. A more
formal test can be created, if desired, using the data obtained from the students’ projects
and turning them into AP style questions, both multiple choice and free response.
If a day is taken for students to work on their data analysis so students may work
in class with their partners, the teacher should facilitate discussion within groups rather
than provide answers. The goal of the project is for student-centered learning. The
teacher may find that directing the student to the appropriate worksheet is helpful. If a
student happens to have samples that are dependent on each other, have them look
carefully over Worksheet Two, for instance. Expectations should be made clear to
students what is expected during their presentations, such as visual aids, knowledge of
their material and adequate explanation of their findings. The teacher may find that

19
emphasizing the rubric is helpful in aiding the student to narrow his or her focus for the
presentation.
Unit Discussion: The Project
The project should be student-driven, starting with Phase I: Brainstorming. The
teacher may want to provide students with some examples of what studies where the data
type is categorical. Some examples are taste-tests of different products, opinion surveys
of males versus females or comparing distributions of local wildlife to national wildlife.
Students should work in their teams to decide what they find interesting that is also worth
exploring.
The role of the teacher for the brainstorming process should not be limited to
“idea generator”. The teacher should help students narrow the scope of their ideas in such
a way that data collection is possible within the students’ limited means and time.
Exploring the local wildlife, while an interesting idea, may not be suitable for a high
school student taking seven other AP classes and extra-curricular activities. The teacher
can help the teams focus more on the area around them. Instead of going as far as
counting local wildlife, students could look at the distributions of local fauna or
domesticated pets within their neighborhood. The teacher should also make sure the data
gathered by the students can be analyzed based on the inferential procedures in the unit.
A major component of these procedures is that the data be both random and independent.
Worksheet two explores the problems when the data is correlated or the samples are
dependent, namely that our inferential procedures are not appropriate.

20
Phases II and III are done at the students’ leisure and discretion. However,
throughout the unit, the teacher will want to stress the due dates for each of these. The
Proposal must be done and approved before the data collection can begin so that students
do not waste their time working for something that will not be interpretable or is not
relevant or rigorous enough. Despite the fact that the students are at an AP level and the
class is for college credit, the students are still teenagers that need guidance and focus.
Daily reminders of due dates will be helpful to the students but still leaves everything up
to them. Ultimately, the data should be obtained and organized by the time the unit is
completed.
Phase IV: Get It Together can be done as a class if a day is taken at the end of the
unit to do so. This will help the teacher ensure that students obtain the rigor desired in
their interpretations and reinforce the tests of inference studied throughout the unit. If
teams are finished with their analyses, then these groups can work on their presentations.
Before Phase IV, the teacher can also inform students who are done with their report that
they can bring whatever tools necessary to work on their presentations, such as
cardboard, poster board and markers. The teacher can request that a rough outline be
handed in by these teams of what they will be doing and saying for extra credit so that
these students are not sitting idle.
The presentation and written report can be turned in on the same day or on
separate days. During presentations, all students should be attentive and not allowed to
work on their own presentations or reports. The teacher may want to inform students that

21
every data set may be included on their Unit Exam that the teacher makes. If the teacher
decides to do this, then careful planning must be done to make sure no team gets an easier
test than another. For example, if a team has done their inference correctly, then they
already know the answer to a test question. The teacher may wish to alter the “prompt” of
the question, only use the summary statistics or scramble the data so that students have a
more difficult time distinguishing whose project was used for which question. As an
alternative to this, the teacher may simply state that if all students are paying attention
during the presentations, then they should all know how to solve each problem on a test.
In this way, no preferential treatment is given.

22
Chapter 4: Discussion and Conclusion
Revisions and Modifications
The content of this unit can be modified to fit a continuous data unit for 1- or 2-
sample Z or T tests. The teacher only needs to find a theme in which to focus the material
and find relevant research articles. For the purposes of the AP Statistics course, as long as
the research has a sample size larger than 30 units, students are taught that the t-
distribution is an adequate fit. In practice, for sample sizes larger than 30, the distribution
must also not be too skewed. In finding articles, special care should be made to construct
problems in such a way that balance the rigor of the AP exam and the relevance to their
projects. The project is student-driven and application to practice can result in greater
understanding than worksheets alone. The purpose of the worksheets should be to show
students the highest standards they can achieve in their project and the different ways the
content of the course is applied to their project.
An advantage in modifying this for a continuous data project is that different
graphical methods can also be utilized in comparing the distribution of the samples for
continuous data, such as box-plots, stem-and-leaf plots and histograms. Univariate Data
comprises about 20% of the AP exam. The biggest limitation is students can only
compare 2 samples, unless the project is given at the end of the year and the teacher has
covered ANOVA tests. However, since the F-test is not on the AP Exam, many teachers
feel ANOVA is beyond the scope of this course. Another limitation I have found in
experience is finding research articles that provide the raw data if the data is continuous.

23
To work around this, a teacher can use software to generate random normal numbers if
the research provides the mean and sample standard deviation. This method only works if
the researchers proved the data to be approximately normally distributed. If the data
happens to be skewed such that a different distribution was used, such as Poisson or Log
Normal, the random numbers generated using the sample mean and variance could
generate numbers that don’t really make sense, such as test scores over a 100 or lengths
that are negative. With this limitation in mind, finding appropriate and relevant research
articles for AP students can be difficult but not impossible.
Conclusion
Statistics, as a mathematical concept, is still in its infancy, especially when it
comes to the high school setting. Formal research in applied statistical projects for a high
school classroom is limited and not easy to find. The majority of the research found in
this report was for projects done in a college classroom. More research is needed for
project based learning for grade school but since AP Statistics is taught for college credit,
the college-based research and its success is somewhat appropriate.
The purpose of this report is to give AP Statistics teachers a foundation in applied
statistics on upon which they can build. Teachers undergo AP training every few years to
get a better understanding of the topics, share new, engaging activities and discuss
successes and failures in previous activities. While these activities are fun and a nice way
to introduce students to the content and formulas, I typically have not found these
activities to be rigorous or relevant to the students.

24
Furthermore, in terms of AP Statistics training, unit long projects are not
discussed and I feel that they should be. The purpose of this report is to give teachers a
starting point for a unit long project but give them the freedom to teach the unit how they
deem best. The worksheets provided are supplemental and only seek to add to the
relevance of categorical data, why students are learning the inferential procedures in the
unit, why the assumptions for these procedures are important and how these tests are
actually carried out. However, the project and worksheets herein are in no way the exact
route to take. I believe this work will take the form of a living document in which
teachers will add and subtract details as they feel necessary. I have provided some ideas
as to modifying the project already. The hope is that teachers will share their revisions,
successes and failures with others. Informal research and data will prove useful in
perfecting the teaching craft and helping our students to grow and understand statistics, as
well as other topics.

25
Chapter 5: Application to Practice
Developing Engineering Awareness
I believe I have a much better understanding of engineering practices than when I
started the program. I did not realize how much teamwork was emphasized. When we did
the race car in the first summer, I was very worried that I would not be able to design a
car by myself that would actually run. However, my partner and I came up with a solid
idea after a lot of brainstorming that was very different from the other cars. I am not too
sure how I can incorporate the idea of engineering careers into my lessons, as that was
not extensively covered in this program, but I will definitely emphasize teamwork in the
projects I develop.
The best way I can encourage teamwork in my classroom is to emphasize project-
based learning. This program has helped me value more student-driven learning through
projects. Most of the concepts we learned in the program was done through projects and
teamwork. The highlights of these projects were the presentations. Presentations give the
class a chance to view learning through the eyes of their peers as well as give the teacher
a chance to assess student understanding. With my future projects I hope to incorporate
into my classroom, I will make sure to highlight them with presentations.
Developing Engineering Habits of Mind
I feel that the UTeach Summer Master’s program has allowed me to think of
problem solving as a growing, living process rather than something that necessarily has a
concrete beginning and end. I plan on incorporating this idea more in my AP Statistics
classroom. Too often, students feel the need to reach an answer with finality to it rather

26
than embrace the journey taken. This journey can be long, uncertain and painful and my
students need to learn that failure is acceptable as long as they continue to try. They need
to accept that they might choose an inappropriate statistical test to a problem and will
simply need to erase and start over. I see students too afraid to attempt a word problem
unless they are sure they will do it correctly. They would rather not try and fail rather
than try, fail a few times and then maybe succeed.
The best way I can think of to force students to make attempts at problems they
are unsure of is to have daily warm-ups of AP essay problems that have been slightly
modified to ease students into the difficulty and rigor of the AP exam. I have done this in
the past and have graded the work somewhat leniently to coax students into writing
something down even if it is not completely correct. As the year progresses, students gain
more confidence in their statistical knowledge and know-how and less scaffolding is
necessary. I think I can improve on this by having students work together on difficult
problems that have not been modified. Then, as a class, have a group share at least part of
their solution and have a different group comment, critique or add to the solution. While
this was not done in our UTeach program, we did do a lot of peer sharing of different
parts of articles we read and then came together as a group to summarize the entire
article. I am simply modifying this to meet my needs, such as engineers do.
Developing an Understanding of the Design Process
With my thesis, I changed it multiple times before I decided on what I finally
have. I went too big in scope at first and realized quickly that I would not be able to
ensure that students stayed aligned with important topics in the AP outline. This meant

27
having to disregard a lot of research I read and completely changing the timeline of when
to apply the project. I would not consider this time wasted. I learned a lot about what I
wanted to do and found passion in what I finally created. I hope to instill in students that
hard work can lead to great success. I also hope to teach them that hard work does not
always look like success but is worth the risk. In practice, this comes in the form of more
open-ended questions, more projects, more presentations and more time analyzing the
process.
I believe this program has helped me to recognize the value of trying. Before I
started the MASEE program, I had reservations that my math-oriented background would
not be enough to get me through. Then, I attended the classes and realized that I had a lot
to offer. I could also rely on working as a team to be successful. My students need to
understand that we all can be important and useful. Again, I go back to the biggest
hindrance in the classroom: students are afraid to make an attempt and fail. They need to
recognize that there are so many opportunities for help. I hope to encourage more open-
ended activities with my students where they have to collaborate. I believe my current
project is designed so that 2 or 3 students working together can each contribute
something meaningful and substantial to the final product. Having done a project similar
to this with my students in the past, I can see the value students have in working hard and
impressing their classmates with what they have done. Having done projects through the
MASEE program that my team and I thought of on our own, I see the value in having
students attain a sense of self-worth in the classroom that does not deal with a

28
standardized test. While tests are important in our education system, informal
assessments can be immediate and just as useful.
The project is very simple and easy to implement. I have constructed it in such a
way that the unit be taught at the teacher’s discretion while focusing on the relevance of
the material to the students’ projects. I feel that my work is not reflective of the
UTeachEngineering process in that the unit is not necessarily taught from a student-based
learning perspective. Teachers can give small activities to help students familiarize
themselves with the topic, vocabulary and formulas but, in the end, the teacher decides
what works best for his/her classroom. In my classroom, we have activities once or twice
a week but other days are lecture based. The homework can be repetitive in the hopes of
helping the students memorize the formulas and recognize the types of problems for
which the formulas are appropriate.
Developing Knowledge for and of Engineering Teaching
As an AP Statistics teacher, I can incorporate a number of engineering-based
studies that will be of interest to some of my students but not to all. While the goal of the
teacher is to make everything engaging, I recognize my students have varied interests and
need to allow them to use statistics to explore their values, beliefs, hobbies and tastes. I
do not think I need to enforce the subject of engineering to develop an engineering state
of mind. Statistics, at its foundation, is the basics of the design process: hypotheses, data
collection, tests, interpretations, conclusions and revisions. Referencing the idea of
engineering and relating their projects to the design process can help keep engineering in
students’ minds and help them see the value of what engineers do.
29
In this past year of teaching, I had students working in groups more often and give
presentations more frequently. I did not restrict this to my AP Statistics classes. I tried
these techniques in my remedial senior level math classes as well, with varying success.
Some students were engaged and were able to find help in their peers while other
students simply were not able to be reached. In terms of success and failure, I thought
more students were more engaged while working in groups this year than in years past,
which I consider a success. I feel this program has helped me to grow as a teacher and
teach outside of my comfort zone. In the past, I felt like student-based learning involved
me relinquishing my power and hoping that students take advantage. Now, I feel that
student-based learning can be very teacher-guided and facilitated. With this project
already completed, I have the confidence to make more unit-length projects, encourage
more teamwork and take more time out from typical discussion for more student
presentations.

30
Appendix A: Worksheet 1

31
Name: _______________________________________ Date:_________________
Worksheet 1: Driver and Passenger Seatbelt Use Among U.S. High School Students “The national YRBS is a biennial self-administered survey of U.S. public and private high school students in grades 9–12. A stratified three-stage cluster sample design is used to obtain nationally representative samples of students. To provide sufficient statistical power for separate analyses of data among black and Hispanic students, the YRBS uses multiple strategies for oversampling by race and ethnicity.” (Briggs 2008) 1. Based on the excerpt, what kind of study was conducted? A. Experimental Study B. Observational Study 2. What primary method was used in the design of this study? Choose the best answer. A. Simple Random Sample B. Stratified Random Sample C. Cluster Random Sample D. Multi-stage Sampling E. Experiment with Blocking F. Experiment Completely Randomized 3. If we find that there is high correlation between ethnicity and seatbelt use, can we infer causation? Choose the best answer. A. Yes, since this study is an experiment. B. No, because this is not an experiment. C. Yes, since this study is an observational study. D. No, because this is not an observational study. E. Yes, since high correlation is present. The following are some summary statistics from the study.
4. What is the probability of a high school student over 18 not wearing a seatbelt while riding in the passenger seat? a. 0.578 b. 0.430 c. 0.570 d. 0.422 5. Based on the confidence interval for a student riding in the passenger seat and makes mostly B’s, is a different student more likely to wear a seatbelt riding in the passenger seat if that student makes mostly A’s? Explain. a. Yes, because the 95% confidence interval for “Passenger” and “Mostly B’s” contains 43.6% b. Yes, because the 95% confidence interval for “Passenger” and “Mostly B’s” does not contain 50.2% c. No, because the 95% confidence interval for “Passenger” and “Mostly B’s” contains 43.6% d. No, because the 95% confidence interval for “Passenger” and “Mostly B’s” does not contain 50.2% 6. Based on the confidence interval for seatbelt use while being the driver, are Hispanics more likely to wear a seatbelt than Blacks? Why or why not?
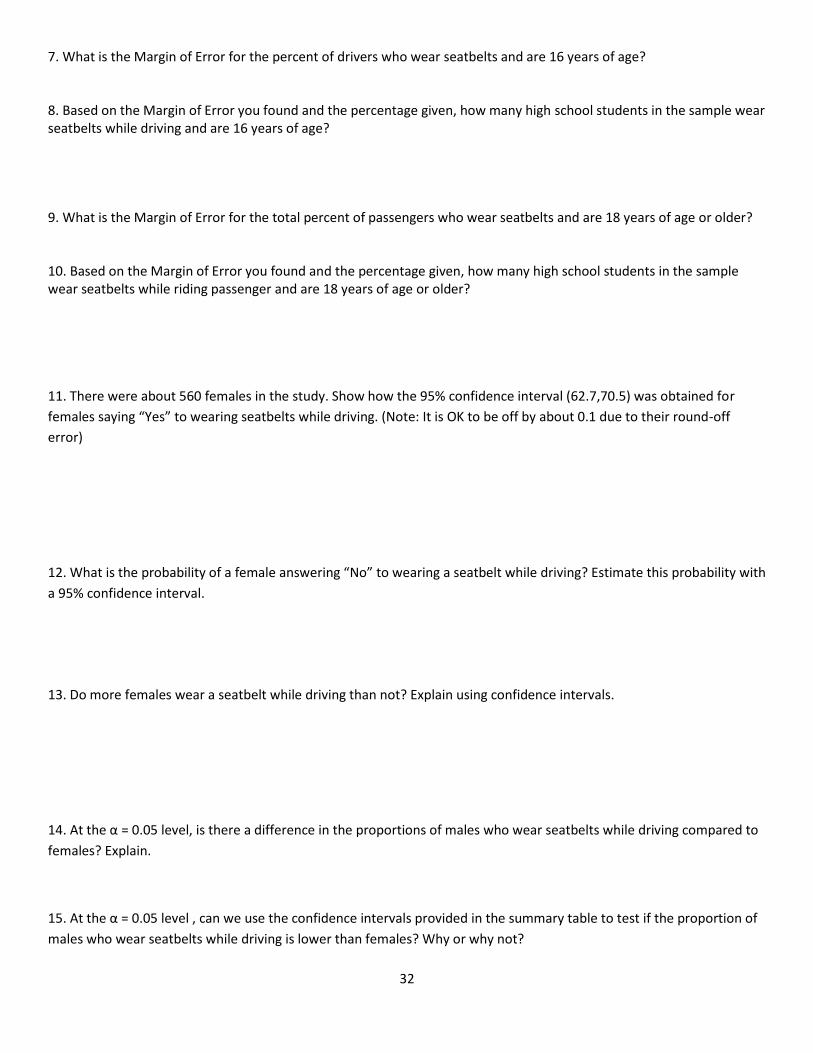
32
7. What is the Margin of Error for the percent of drivers who wear seatbelts and are 16 years of age? 8. Based on the Margin of Error you found and the percentage given, how many high school students in the sample wear seatbelts while driving and are 16 years of age? 9. What is the Margin of Error for the total percent of passengers who wear seatbelts and are 18 years of age or older? 10. Based on the Margin of Error you found and the percentage given, how many high school students in the sample wear seatbelts while riding passenger and are 18 years of age or older? 11. There were about 560 females in the study. Show how the 95% confidence interval (62.7,70.5) was obtained for
females saying “Yes” to wearing seatbelts while driving. (Note: It is OK to be off by about 0.1 due to their round-off
error)
12. What is the probability of a female answering “No” to wearing a seatbelt while driving? Estimate this probability with
a 95% confidence interval.
13. Do more females wear a seatbelt while driving than not? Explain using confidence intervals.
14. At the α = 0.05 level, is there a difference in the proportions of males who wear seatbelts while driving compared to
females? Explain.
15. At the α = 0.05 level , can we use the confidence intervals provided in the summary table to test if the proportion of
males who wear seatbelts while driving is lower than females? Why or why not?

33
Appendix B: Worksheet 2

34
Name: ____________________________________ Date: __________
Worksheet 2: Panel Conditioning: Choosing Your Words Carefully The following is an excerpt from "Panel Conditioning in a Longitudinal Study of Adolescents' Substance Use: Evidence from an Experiment." (2012)
“In October and November of 2008, adolescents were selected for a baseline survey … The primary sampling units were schools that contained a 7th grade. Schools were stratified by socioeconomic status (lower, middle and upper SES, as determined by the Chilean Ministry of Education) and a random sample was selected from within each stratum; low-SES schools were oversampled … The questionnaire included questions about their educational performance and expectations, relationship with parents, personality characteristics, social networks, family structure and socioeconomic characteristics. Most of the adolescents’ questionnaires also included a “drug module” – a set of questions about adolescents’ exposure to, perceptions of, and experiences with cigarettes, alcohol, marijuana and cocaine.”
1. Based on the excerpt, what kind of study was conducted? A. Experiment B. Survey C. Observational Study 2. What primary method was used in the design of this study? Choose the best answer. A. Simple Random Sample B. Stratified Random Sample C. Cluster Random Sample D. Convenience Sampling E. Experiment with Blocking F. Experiment Completely Randomized 3. If we find that there is high correlation between “relationship with parents” and “experiences with alcohol”, can we infer causation? Choose the best answer. A. Yes, since this study is an experiment. B. No, because this is not an experiment. C. Yes, since this study is a survey. D. No, because this is not a survey. E. Yes, since high correlation is present. The 2nd part of the study continues as follows:
“In an effort to assess whether responses to questions on the drug module were subject to panel conditioning, we conducted the following experiment: some respondents were randomly allocated to the treatment condition – their questionnaire included the drug module – and the rest were assigned to a control group in which questionnaires did not include the drug module … In the initial 33 schools (2,163 students), all children were exposed to the drug module. In the subsequent 39 schools (2,836 students), 329 children were randomly assigned to the control condition (no exposure to the drug module) and the remaining 2,507 were assigned to the treatment condition (exposure to the drug module)”
4. Based on the excerpt, what kind of study was conducted? A. Experiment B. Survey C. Observational Study 5. What primary method was used in the design of this study? Choose the best answer. A. Simple Random Sample B. Stratified Random Sample C. Cluster Random Sample D. Convenience Sampling E. Experiment with Blocking F. Experiment Completely Randomized 6. If the study shows that there is significant difference in answers between those that were exposed to the drug module and those that were not, can we infer causation? Explain. 7. Identify a potential problem that can be found in the design of the 2nd part of this study. Explain.

35
Some of the results from the study are as follows:
8. Based on the table, how many students said they had never tried alcohol in 2008? 9. What is the probability of a student in 2009 saying “Yes”? 10. What is the probability that a student changed his/her answer from 2008 to 2009? 11. What is P(Saying “Yes” in 2009|Saying “No” in 2008)? 12. Based on your answers above, is Saying “Yes” in 2009 independent of saying “No” in 2008? 13. Another way of testing for independence in a 2-way table is performing a Test for Independence. What is Ho for testing the table above for independence? 14. Create a table of the expected values, assuming Ho holds true. How many expected cell counts are greater than 5? 15. What is the test statistic? Show the appropriate amount of work. 16. Based only on your answers for the test, what conclusions can be made regarding independence for this table? 17. Were the two samples used in the survey obtained randomly and independent of each other? Keep in mind that the term “independent” is not used the same as in the previous questions. 18. Based on your answer to the previous question, does this change your conclusion for the test for Independence? Why or why not?

36
The following are more results from the study:
19. Based on the table, how many students said they had never smoked cigarettes in 2008? 20. What is the probability of a student in 2009 saying “Yes”? 21. What is the probability that a student changed his/her answer from 2008 to 2009? 22. What is P(Saying “Yes” in 2009|Saying “No” in 2008)? 23. Based on your answers above, is Saying “Yes” in 2009 independent of saying “No” in 2008? 24. Another way of testing for independence in a 2-way table is performing a Test for Independence. What is Ho for testing the table above for independence? 25. Create a table of expected cell values, assuming Ho holds true. How many expected cell counts are greater than 5? 26. What is the test statistic? Show the appropriate amount of work. 27. Based only on your answers for the test, what conclusions can be made regarding independence for this table? 28. Were the two samples used in the survey obtained randomly and independent of each other? Keep in mind that the term “independent” is not used the same as in the previous questions. 29. Based on your answer to the previous question, does this change your answer to the test for Independence? Why or why not? Explain.

37
Appendix C: Worksheet 3

38
Name: ____________________________________ Date: __________
Worksheet 3: Why Do People Drink? The following is an excerpt from “Cognitive Predictors of Alcohol Involvement and Alcohol Consumption-Related Consequences in a Sample of Drunk-Driving Offenders. Substance Use & Misuse” (2008):
“To better understand the pivotal role of cognition in drinking, the present study examines the prediction of high-risk drinking from a broad array of cognitive factors, using a sample of adults convicted of driving while impaired (DWI). DWI offenders represent a unique class of high-risk drinkers particularly because they often drink despite the severity of legal and financial sanctions imposed on them by society. In addition, some DWI offenders continue to drink unabated despite experiencing personal, social, and physical ramifications stemming from their excessive drinking practices. Evaluating the potential harmful effects from alcohol abuse, particularly for this group of high-risk drinkers, should entail considering a wide range of motivating factors that provides impetus for their continued drinking. Interviews were conducted from January 1994 to June 1997, and participants provided self-report information in response to survey questions and standardized tests and using a computerized version of the Diagnostic Interview Schedule (DIS) (Robins, Helzer, Croughan, and Ratcliff, 1981). Interviews were conducted by counselors having master’s degrees and trained in intake assessment and referral processes (and lasted no more than 2 hours). Counselors rendered diagnoses of alcohol abuse or dependence based on extensive interview materials and written test results.”
1. Based on the excerpt, what kind of study was conducted? A. Experimental Study B. Observational Study
2. If this is an example of an experimental study, how could it be modified to be an observational study? If this is an
example of an observational study, how could it be modified to be an experimental study?
3. What primary method was used in the design of this study? Choose the best answer. A. Simple Random Sample B. Stratified Random Sample C. Cluster Random Sample D. Convenience Sampling E. Experiment with Blocking F. Experiment Completely Randomized 4. If we find that there is high correlation between high-risk drinking and low income level, can we infer causation? Choose the best answer. A. Yes, since this study is an experiment. B. No, because this is not an experiment. C. Yes, since this study is an observational study. D. No, because this is not an observational study. E. Yes, since high correlation is present.

39
Some of the results of the study are as follows: (Univariate table, combining Male and Female, missing 31,200+ and Unknown)
5. What percentage of those sampled had family income less than $16,800? 6. What is the probability of person from this sample having income of $16,800 or higher? 7. If the distribution of family income amongst high-risk drinkers were the same, what would be the probability of having income higher than $16,800? 8. What is the Ho for the Goodness of Fit test? 9. Show the expected cell counts next to the table, assuming Ho is true. 10. What is the test statistic? Show all relevant work. 11. What conclusions can you make about family income distribution amongst high risk drinkers? Here are the same results, separated by gender.
12. Which category has the smallest difference in proportion? What is the value of that difference? 13. What is the Null Hypothesis for testing whether there is a difference in proportions for this category? 14. What is the test statistic for this Null Hypothesis? Show all appropriate work. 15. What conclusions can you make about the table based on the value of the test statistic? 16. The conclusion you reached for the difference in proportions is the same conclusion if we tested the entire table using a Test for Independence. However, this is a different conclusion from the GOF we ran earlier. Why do you think this occurred? Explain.

40
Some more of the results of the study are as follows:
17. What percentage of those sampled have an ethnicity of American Indian or Other? 18. If the distribution of ethnicity amongst high-risk drinkers were the same, what would be the probability of having an ethnicity of American Indian or Other? 19. What is the Ho for the Goodness of Fit test? 20. Show the expected cell counts next to the table, assuming Ho is true. 21. What is the test statistic? Show all relevant work. 22. What conclusions can you make about the distribution of ethnicity amongst high risk drinkers? Here are the same results, separated by gender.
23. Which category has the largest difference in proportion? What is the value of that difference? 24. What is the Null Hypothesis for testing whether there is a difference in proportions for this category? 25. What is the test statistic for this Null Hypothesis? Show all appropriate work. 26. What conclusions can you make about the table based on the value of the test statistic? 27. The conclusion you reached for the difference in proportions is the same conclusion if we tested the entire table using a Test for Independence. However, this is a different conclusion from the GOF we ran earlier. Why do you think this occurred? Explain.

41
Appendix D: Project Handouts
AP Statistics Project – Categorical Data
AP Statistics Survey Project Scoring Rubric
42
AP Statistics Project – Categorical Data Phase I: Brainstorming For this project, you will be in groups of 2 or 3. Your task is to design and execute an observational study, survey or experiment. You have complete freedom in your design of choice … just so long as it meets the following criteria:
Appropriately rigorous for an AP/College-level course
Is of interest to the school community (you may argue your case but I am both judge and jury)
Involves categorical data
Can be placed in a table in which the row and the column have 2 or more categories
The row, the column, or both must have 3 or more categories.
The sample/subjects/data is chosen in such a way that inference can be made (random, independent, etc)
Interpretation of this data must involve (at minimum) each of the following o 2 confidence intervals o 1 sample proportion Z-Test o 1 difference in proportions Z-test o 1 Test for Independence/Homogeneity
Phase II: The Proposal (Due Date: ______) Each team submits a typed proposal describing: • Project type – observational study/survey or experiment • General description of project idea What question are you answering? Why is this relevant? • General description of project process and methodology How will you gather the data? Sampling Method/Experimental Design Method What is your randomization process? Into what size table will the data fit? 3x2, 2x3, 3x4?
When, where, and how you will administer the project *******Note: Your proposal must be approved before you begin executing your project******* Phase III: Go Get That Data (Due Date: ______) Execute your project in accordance with your proposal, making sure to use the randomization you specified Phase IV: Get It Together Organize, summarize, and analyze your data Phase V: Write It Out (Due Date: ______)
Your written report will be graded based on the rubric provided, so read it carefully!!
Phase VI: Speak Your Mind (Due Date: ______) A ten (10) minute opportunity for you to share the critical aspects of your project with your classmates. Make it interesting and read the rubric again!
43
AP Statistics Survey Project Scoring Rubric Your work will be evaluated on a 0 to 4 scale on each dimension below.
4: Student meets every criterion listed in the category
3: One criterion is missing from the category
2: Two-Three criteria is missing from the category
1: Most criteria is not met
0: The category is missing
Topic/Question and Background (10%) ____*10 = ____
The project selected is clearly stated, is of interest to the school community, and is appropriately narrow in
scope. The background provided gives strong motivation for the team's choice of this project and delineates its
relevance to the school community. Also, the project is appropriately rigorous for an AP/College level course.
Methodology – Sampling/Survey Procedure or Experimental Design (15%) ____*15 = ____
The chosen sampling/survey procedure or experimental design is appropriate for addressing the selected
topic/question, is described accurately, and is implemented according to the stated plan. The appropriate
randomization process includes a clear and correct labeling of subjects, a description of the number selection
process (random number table or calculator), and the results of that randomization (i.e. the numbers and
subjects chosen).
Data Recording and Summarization (15%) ____*15 = ____
Original data provided and summarized in an appropriate neat and accurate tabular form. The student has
correctly summarized the data using bar graphs/pie charts and counts/proportions/ percentages. Graphs and
calculations are neat and accurate and well labeled.
Testing/Interpretation (25%) ____*25 = ____
The student thoroughly and accurately interprets the meaning of the graphical and numerical summaries in the
context of the data, supported by appropriate inference tests and/or confidence intervals. In addition, the student
identifies any generalizations that may be drawn about the population from which the sample was drawn.
Pitfalls and Extensions (10%) ____*10 = ____
The student articulates all pitfalls encountered, and clearly explains how (s)he dealt with each of these
obstacles. In addition, the student shares at least one plausible extension of the survey project.
English Mechanics (10%) ____*10 = ____ The student's writing is grammatically correct, is punctuated properly, and flows logical from one point to the
next. No spelling mistakes!!
Oral Presentation (15%) ____*15 = ____
The group accurately presents all key aspects of its survey project, including topic/question, background,
methodology, data summary, graphical and numerical analysis, interpretation, and possible pitfalls/extensions.
Correct terminology is used throughout and all members participate. The presentation is clear, well organized
and fluent. Visual aids are used to assist the audience in understanding important points.
Total Points: ______ /400
Final Score: ______

44
BIBLIOGRAPHY
Nathaniel C. Briggs, E. Warren Lambert, Irwin A. Goldzweig, Robert S. Levine, Rueben
C. Warren, Driver and Passenger Seatbelt Use Among U.S. High School Students,
American Journal of Preventive Medicine, Volume 35, Issue 3, September 2008, Pages
224-229
Amy M. Burdette and Kerry McLoughlin 2010: Using Census Data in the Classroom to
Increase Quantitative Literacy and Promote Critical Sociological Thinking, Teaching
Sociology 38: 247
Berna Cantürk-Günhan , Esra Bukova-Güzel & Zekiye Özgür (2012): The prospective
mathematics teachers’ thought processes and views about using problem-based learning
in statistics education, International Journal of Mathematical Education in Science and
Technology, 43:2, 145-165
Carolina Carvalho, Yvette Solomon, Supporting statistical literacy: What do culturally
relevant/realistic tasks show us about the nature of pupil engagement with statistics?,
International Journal of Educational Research, Volume 55, 2012, Pages 57-65, ISSN
0883-0355
Christine Franklin, Brad Hartlaub, Roxy Peck, Richard Scheaffer, David Thiel and
Katherine Tranbarger Freier (2011): AP Statistics: Building Bridges Between High
School and College Statistics Education, The American Statistician, 65:3, 177-182ccc
Sven Fuhrmann, Alan MacEachren, Marshall Deberry, John Bosley, Rachael LaPorte
Taylor, Mark Gahegan, Roger Downs . MapStats for Kids: Making Geographic and
Statistical Facts Available to Children. Journal of Geography, Volume 104, Number 6
(2005), pp. 233-241
Lorena Masangkay Halili and Melanio Trillanes Olea: Qualitative reasoning approach in
understanding mathematical Concept in statistics. Educ. Res. 2012 3(3): 284-289
Shonda Kuiper and Linda Collins (2009): Guided Labs That Introduce Statistical
Techniques Used in Research From Multiple Disciplines, The American Statistician,
63:4, 343-347
François Plante and Nancy Reid (2011): Statistics in the News, The American
Statistician, 65:2,
80-88
Rob Root and Trisha Thorme (2001): Community-Based Projects in Applied Statistics,
The American Statistician, 55:4, 326-331

45
Scheier L, Lapham S, C'de Baca J. Cognitive Predictors of Alcohol Involvement and
Alcohol Consumption-Related Consequences in a Sample of Drunk-Driving Offenders.
Substance Use & Misuse. December 2008;43(14):2089-2115
Florencia Torche, John Robert Warren, Andrew Halpern-Manners and Eduardo
Valenzuela. "Panel Conditioning in a Longitudinal Study of Adolescents' Substance Use:
Evidence from an Experiment." Social Forces 90.3 (2012): 891-918
Melissa Wells: Teaching Notes Making Statistics “Real” For Social Work Students,
Journal of Social Work Education Vol. 42, No. 2 (Spring/Summer 2006)


