144
Copyright by Manar Hasan 2019

Copyright
by
Manar Hasan
2019

The Thesis Committee for Manar Hasan Certifies that this is the approved version of the following Thesis:
Lift Axles in Ready Mix Trucking
APPROVED BY
SUPERVISING COMMITTEE:
C. Michael Walton, Supervisor
Michael Murphy

Lift Axles in Ready Mix Trucking
by
Manar Hasan
Thesis
Presented to the Faculty of the Graduate School of
The University of Texas at Austin
in Partial Fulfillment
of the Requirements
for the Degree of
Master of Science in Engineering
The University of Texas at Austin
December 2019

Dedication
Dedicated to my parents and my siblings

v
Acknowledgements
I would like to first thank my thesis advisor, Dr. C. Michael Walton of the
Transportation Engineering department. Throughout my thesis process and graduate
school, Dr. Walton has always been there for guidance. Dr. Walton always made me feel
as if I was in control of my work, but gave me enough guidance so that I benefited greatly
from his experience.
I would also like to thank Dr. Michael Murphy of the Center for Transportation
Research, who has been of immeasurable help to me in shaping my thesis topic and my
research in general. Dr. Murphy’s door has always been open for me, and he has been a
source of a deep wealth of information. Without all that I’ve learned from Dr. Murphy, this
thesis would not have been possible. I am grateful to Dr. Murphy for also being the second
reader for this thesis. Further, Dr. Nan Jiang and Dr. Juan D Porras Alvarado have helped
the development of this thesis considerably with their constructive feedback and guidance.
I would also like to thank all the experts who were involved in the data collection
for this research project: highway patrol personnel from ten states, lift axle manufacturers,
and truckers from various companies gave me their precious time and energy. Without their
passionate participation and input, the survey could not have been successfully conducted.
Finally, this acknowledgements page would be incomplete without mentioning my
friends and family, who provided me with the support and encouragement I needed to get
through this. Special mention must go to my Abbu and Ammu, who made sure I did not
have to worry about essentials like food/shelter, so that I could focus on my education, and
my partner, Sarah, who kept me motivated and prevented me from procrastinating. This
accomplishment would not have been possible without them. Thank you.
vi
Abstract
Lift Axles in Ready Mix Trucking
Manar Hasan, M.S.E
The University of Texas at Austin, 2019
Supervisor: C. Michael Walton
Lift axles on single-unit commercial vehicles, referred to as Specialized Hauling
Vehicles (SHVs) are being used today by various industries, allowing for heavier truck
loads and compliance with state / federal laws. Certain industries – such as aggregate and
hot mix, refuse, and ready mix – operate SHVs more frequently than other industries. The
purpose of this Thesis research is to analyze the ready mix industry and understand the
benefits and dis-benefits of operating SHVs as part of a company’s truck fleet. In addition,
the author seeks to gain an understanding of differences in state and federal laws, codes,
and regulations regarding SHVs. Further, the research aims to understand the reasons ready
mix companies choose to operate (or not operate) lift axles.
To achieve the objectives of this research, the author conducted a literature review,
performed statistical analysis on ready mix truck sales data, studied SHV operation data in
Texas, summarized lift axle regulations in the United States, analyzed previously
conducted trade group surveys, and administered a survey to determine patterns and gain

vii
information about lift axle use in the ready mix industry, with a focus on Texas and nine
other peer states.
Sales data showed that the ten states in focus had an overall proportion of 32% of
SHVs in the ready mix industry. In regulations, four of the states studied do not have
specific lift axle laws. In these states, regulations applicable to lift axle weights are those
applicable to general commercial vehicles based on the Federal Bridge Formula B, and
state axle weight exemptions, if they exist. Some states have regulations controlling where
the lift axle control mechanisms must be placed, while two states have regulations allowing
trucks to lift axles during turns.
Analyzed surveys showed an SHV proportion in the ready mix industry around 60-
70%. The author’s survey corroborated this, with 64% of the responses from companies
that operate SHVs. Analyzed survey data showed a growth trend in SHV configurations of
about 1% per year. Reponses to the author’s survey responses suggest companies select lift
axles for the following reasons: to carry more weight and to be legal on highways with load
ratings based on the Federal Bridge Formula.
All stakeholder contacts mentioned an upward trend in lift axle usage which was
corroborated, although to different degrees, in the previously performed data collection
efforts in Texas, analyzed surveys, and the author-administered survey.
viii
Lift Axles in Ready Mix Trucking
TABLE OF CONTENTS
Abstract .................................................................................................................. vi
List of Tables ...........................................................................................................x
List of Figures ....................................................................................................... xii
Chapter 1: Introduction ............................................................................................1
1.1 Background and Motivation .....................................................................1
1.2 Problem Statement ....................................................................................3
1.3 Scope of Thesis .........................................................................................4
1.4 Research Objectives ..................................................................................4
1.5 Methodology .............................................................................................5
1.6 Organization of Thesis ..............................................................................5
Chapter 2: SHVs: A Literature Review ...................................................................6
2.1 Specialized Hauling Vehicles ...................................................................6
2.2 Types of Lift Axles and How They Work ................................................6
2.3 Lift Axle Controls ...................................................................................16
2.4 Lift Axle Advantages and Disadvantages ...............................................20
2.5 Ready Mix Truck Discharge Type ..........................................................26
Chapter 3: Current SHV Operations ......................................................................30
3.1 Lift Axle Truck Configurations ..............................................................30
3.2 Ready Mix Axle Configurations .............................................................31
3.3 Lift Axle Research in Texas ...................................................................39
3.4 SHVs in Texas – UT-CTR Statistics ......................................................47
3.5 SHVs in Texas – Sales Data Statistics ....................................................54
Chapter 4: Regulation Analysis .............................................................................57
4.1 Federal and Texas Lift Axle Regulations ...............................................57

ix
4.2 Lift Axle Laws outside of Texas .............................................................62
4.3 Texas and Peer State Law Review ..........................................................63
4.4 NCHRP 575 ............................................................................................72
4.5 Commercial Vehicle Law Enforcement Contact / Survey ......................73
Chapter 5: Interviews and Survey Analyses ..........................................................82
5.1 NRMCA Survey Analysis.......................................................................83
5.2 Ready Mix Industry Survey on Lift Axles ..............................................90
5.3 Industry Insights from Online Forum .....................................................96
5.4 Insights From UT-CTR SHV Project .....................................................98
Chapter 6: Conclusion............................................................................................99
Appendices ...........................................................................................................101
Appendix A – Lift Axle Regulation Survey ...............................................101
Appendix B – Contacts for Lift Axle Regulation Survey ...........................112
Appendix C – Ready Mix Lift Axle Survey ...............................................113
Appendix D – Post on Online Trucking Forums Requesting Participation in Thesis Research .................................................................................123
References ............................................................................................................124
Vita ..................................................................................................................130

x
List of Tables
Table 2-1. Lift Axle Options from Various Lift Axle Manufacturers .............................. 13
Table 2-2. Stopping distances for single unit trucks for different vehicle speeds ............ 23
Table 2-3. Trucks in the Bedsworth study compared to regulated deceleration rate ........ 25
Table 2-4 Proportion of Rear-Front Discharge Mixers in Recent History
(NRMCA) ............................................................................................................. 27
Table 3-1. Example SHV Configuration Table Using Configuration Codes ................... 31
Table 3-2. SHV axle weight distributions for five-axle 1S-2L-2 lift axle dump
trucks (TX DPS weight data) ................................................................................ 41
Table 3-3. SHV axle spacing data for various configurations in Texas (WIM
weight data) ........................................................................................................... 42
Table 3-4. Estimated numbers of trucks by truck type and configuration ........................ 53
Table 3-5. Ready mix truck sales data summary .............................................................. 54
Table 3-6. Proportion of SHV configurations in sales data .............................................. 55
Table 4-1. State Adoption of Federal Bridge Formula ..................................................... 59
Table 4-2. US Laws Regulating SHVs (from Texas and Peer States) (as of July
2019) ..................................................................................................................... 65
Table 4-3. US Laws Regulating SHVs (from Other States) (as of July 2019) ................. 68
Table 4-4. NCHRP 575 Survey Questions about Lift Axle Regulations .......................... 73
Table 5-1. NRMCA Survey Response Geographical Spread (2006-2017) ...................... 85
Table 5-2. NRMCA 2017 Survey Response - Chassis Configuration .............................. 86
Table 5-3. NRMCA Survey - Proportion of Trucks with Lift Axles 2006 - 2017 ........... 87
Table 5-4. NRMCA Survey – Proportion of Axle Configurations 2006 – 2017 .............. 88
Table 5-5. NRMCA Survey – Growth Trend of Axle Configurations 2006 – 2017 ........ 89
Table 5-6. NRMCA Survey – Growth Trend of Axle Configurations 2006 – 2017 ........ 89
Table 5-7. Location of responses (with NRMCA categories and 2017 comparison) ....... 91
Table 5-8. For companies with no SHVs, reasons why not .............................................. 92
Table 5-9. For companies with no SHVs but intent to implement, reasons why ............. 92
Table 5-10. Survey Responses about SHV safety ............................................................ 93

xi
Table 5-11. Survey Responses about SHV costs .............................................................. 93
Table 5-12. For companies with SHVs, trend of SHV numbers over three years ............ 94
Table 5-13. For companies with SHVs, average mileage of SHV trucks......................... 94
Table 5-14. Number of Companies stating reasons for choosing to operate SHVs ......... 95
Table 5-15. For companies with SHVs, survey responses about SHV training ............... 95

xii
List of Figures
Figure 2-1. Hendrickson International Composilite TVR Lift Axle (Hendrickson
International, 2014) (used by permission – Hendrickson International) ................ 9
Figure 2-2. Four-axle ready mix truck [1S-2-1B] with a booster lift axle
(McNeilus, 2016) (used by permission – McNeilus) .............................................. 9
Figure 2-3. Hendrickson International Ride Height Measurement (Hendrickson
International, n.d.) (used by permission – Hendrickson International) ................ 11
Figure 2-4. Five-axle, SU5, front discharge ready mix truck [1S-2L-2] with
pusher axles (MyLittleSalesman, n.d.) ................................................................. 13
Figure 2-5. Four-axle truck [1S-2-1B] with one booster axle (McNeilus, 2017)
(used by permission – McNeilus) ......................................................................... 14
Figure 2-6. Six-axle truck [1S-2L-2-1L] with two pusher axles and tag axle (Seitz,
2004.) .................................................................................................................... 14
Figure 2-7. Six-axle truck [1S-2L-2-1B] with two pusher axles and retracted
booster axle (McNeilus, 2017) (used by permission – McNeilus) ....................... 15
Figure 2-8. Lift axle air bag pressure versus cubic yards in drum (Murphy, 2016) ......... 17
Figure 2-9. Inside-cab controls for booster axle (Hasan, 2016) ....................................... 18
Figure 2-10. Inside-cab controls for pusher axles (Hasan, 2016) ..................................... 18
Figure 2-11. Outside-cab pressure gages / controls for pusher axles (Jiang, 2016) ......... 19
Figure 2-12. Close-up of outside-cab pressure gage / control for pusher axle
(Jiang, 2016) ......................................................................................................... 19
Figure 2-13. Outside-cab pressure gage / control for booster axle (Jiang, 2016) ............. 20
Figure 3-1. 2-Axle Rear Discharge Truck [1S-1] in Pennsylvania
(CommercialTruckTrader, n.d.) ............................................................................ 32
Figure 3-2. 3-Axle Rear Discharge Truck [1S-2] (Kimble Mixer Company, n.d.)
(used by permission – Kimble Mixer Company) .................................................. 33
Figure 3-3. 3-Axle Front Discharge Truck [1S-2] in Tennessee
(CommercialTruckTrader, n.d.) ............................................................................ 33

xiii
Figure 3-4. 4-Axle Front Discharge Truck, Twin Steer (1S-1L/S-2) in New York
(CommercialTruckTrader, n.d.) ............................................................................ 34
Figure 3-5. 4-Axle Front Discharge Truck with Pusher Axle [1S-1L-2] in Virginia
(CommercialTruckTrader, n.d.) ............................................................................ 34
Figure 3-6. 4-Axle Rear Discharge Truck with Tag Axle [1S-2-1L] in Arkansas’
(CommercialTruckTrader, n.d.) ............................................................................ 35
Figure 3-7. 4-Axle Rear Discharge Truck with low profile tire Pusher Axle [1S-
1L-2] in Tennessee (CommercialTruckTrader, n.d.) ............................................ 35
Figure 3-8. 4-Axle Rear Discharge truck with Booster Axle [1S-2-1B] in Texas
(CommercialTruckTrader, n.d.) ............................................................................ 36
Figure 3-9. 5-Axle Rear Discharge Truck with Pusher and Booster Axle [1S-1L-
2-1B] in Minnesota (CommercialTruckTrader, n.d.) ............................................ 36
Figure 3-10. 5-Axle Front Discharge Truck with Pusher and Tag Axle [1S-1L-2-
1L] (Terex, n.d.) .................................................................................................... 37
Figure 3-11. 6-Axle Rear Discharge Truck with Pusher Axles and Booster Axle
[1S-2L-2-1B] in Minnesota (TruckPaper, n.d.) .................................................... 37
Figure 3-12. 6-Axle Front Discharge Truck with Pusher Axles and Booster Axle
[1S-2L-2-1B] in Utah (CommercialTruckTrader, n.d.) ........................................ 38
Figure 3-13. 7-Axle Rear Discharge Truck with Three Pusher Axles and Booster
Axle [1S-3L-2-1B] (McNeilus, 2017) (used by permission – McNeilus) ............ 38
Figure 3-14. 7-Axle Front Discharge Truck with Three Pusher Axles and Tag
Axle [1S-3L-2-1L] (Courtney, n.d.) ..................................................................... 39
Figure 3-15. 5-Axle Dump Truck with Two Pusher Axles [1S-2L-2] ............................. 43
Figure 3-16. Load Xpert™ Analysis Page for 5-Axle Ready Mix Truck [1S-3-1B]
Part 1 (Walton et. al, 2016) ................................................................................... 44
Figure 3-17. Load Xpert™ Analysis Page for 5-Axle Ready Mix Truck [1S-3-1B]
Part 2 (Walton et. al, 2016) ................................................................................... 45
Figure 3-18. 4-Axle Flat Bed Truck with Knuckle Boom Pallet Fork Lift [1S-1L-
2] (CTR, 2017) ...................................................................................................... 47

xiv
Figure 3-19. Texas map with dump / ready mix / refuse truck registrations over
TxDOT District boundaries .................................................................................. 51
Figure 3-20. Proportion of SHV configurations in sales data ........................................... 56
Figure 4-1. US map showing the states analyzed for policy research .............................. 74
Figure 4-2. Question 1 on policy survey (state compliance with the FBF) ...................... 75
Figure 4-3. Question 2 on policy survey (state compliance with the FBF on non-
interstates) ............................................................................................................. 76
Figure 4-4. Question 4 on lift axle records ....................................................................... 77
Figure 4-5. Question 5 on policy survey (lift axle regulations) ........................................ 77
Figure 4-6. Question 7 on policy survey (lift axle equipment regulations) ...................... 78
Figure 4-7. Question 9 on policy survey (lift axle control regulations)............................ 79
Figure 4-8. Question 11 on policy survey (common lift axle industries) ......................... 79
Figure 5-1. NRMCA Regions ........................................................................................... 84
Figure 5-2. NRMCA Survey - Proportion of Configurations Over the Years .................. 88

1
Chapter 1: Introduction
1.1 BACKGROUND AND MOTIVATION
The ready mix concrete industry supplies a valuable construction product – ready
mixed concrete – to the transportation, building sector, residential, and other construction
markets (“About Concrete”, n.d.). A key component of ready mix is Portland cement, with
75% of the cement shipped in the United States consumed by the ready mix industry.
Portland cement is an essential construction material, critical to the building and rebuilding
of US infrastructure. The US is the third largest producer of cement, with annual production
roughly around 97 million metric tons, according to the Portland Cement Association. The
United States Geological Survey (USGS) estimates differently, with the annual production
values around 85 million metric tons (USGS, 2019). Using production trends for Portland
cement as a proxy for ready mix production, ready mix production is expected to continue
increasing in the coming years, as the Portland Cement Association forecasts cement
production to increase to 192 million metric tons by 2035 (Sullivan, 2009). The USGS data
also supports this growth, albeit with different predictions. From 2015 to 2018, cement
production saw an average growth of over 1 million metric tons per year (USGS, 2019).
Looking at sales data for the ready-mixed concrete industry, this trend of growth is already
visible, with a value of $27 billion in sales in 2005 (Syverson, 2008) and an estimated $35
billion in sales in 2019, (“About Concrete”, n.d.).
American Society for Testing and Materials International, specification, ASTM
C94, states that the maximum time from introduction of mixing water at the ready mix
plant to discharge of the ready mix is 90 minutes (ASTM International, 2019). Typically,
ready mixed concrete is transported in a drum, or transit-mixer which contains ready mixed
concrete that has been proportioned at the ready mix plant. However, a volumetric ready

2
mix truck is of a different design and can mix concrete on site using water and dry
ingredients including cement, aggregate and sand, stored in compartments in the truck
mixing unit. The concrete is mixed on site using a metering system that controls the amount
of each ingredient needed to produce the desired mix properties. A volumetric mixer is
typically used for mixing concrete for sidewalks, curbs and rip rap or other non-structural
applications. Both drum mixers and volumetric mixers can be manufactured or later
modified as SHVs. A transit ready mix truck consists of a revolving drum that either
combines cement, aggregate, and water to form ready mix, or keeps pre-mixed material
agitated while in transit to the delivery site, to prevent the batch from segregating – that is
to ensure the aggregate, sand and other materials remain thoroughly mixed. There are two
primary types of transit mixers, front- or rear-discharge and many variations in how a ready
mix truck can be configured including the number, position and types of axles.
SHVs are defined by the AASHTO Manual for Bridge Evaluation (AASHTO,
2011) as closely-spaced multi-axle single-unit trucks. More specifically, SHVs are
generally short wheelbase multi-axle trucks used in the construction, waste management,
bulk cargo, and commodities hauling industries. The Federal Highway Administration
(FHWA) also refers to the AASHTO definition when describing SHVs. The FHWA
clarifies and says “some SHVs are equipped with lift / drop axles” (Federal Highway
Administration, 2013). However, this Thesis will restrict the definition of SHVs beyond
the AASHTO and FHWA definitions, by only including multi-axle single-unit trucks
which have one or more lift / drop axles, hereafter referred to as lift axles.
A lift axle is an axle that is mechanically raised or lowered. When the axle is
lowered, tires are in contact with the pavement. The axle allows for an increase in the load
capacity of the vehicle, as it bears some of the load from the vehicle and payload and

3
changes the way these weights are distributed across the different axles. When not needed,
the axle can be retracted so the tires are not in contact with the ground surface. Depending
on the location the lift axle is placed on the truck, the methods used to lift and lower the
axle, and other factors, these axles may be referred to as liftable axles, lift axles, airlift
axles, or by specific names such as booster axles, tag axles, pusher axles, or stinger axles.
Usage of these axles presents state transportation officials with questions. For
example, law enforcement officials are concerned about the possibility of drivers lowering
lift axles on an overweight truck only when approaching a weight enforcement station
(Sivakumar, Moses, Fu & Ghosn, 2007), thus misrepresenting the true impact to the
transportation infrastructure. If this is a common occurrence, it could adversely affect the
condition of the infrastructure, since overweight axles and vehicles can cause significant
increase in consumption of pavements and bridges.
Adding to this ongoing nationwide discussion, the FHWA released a memorandum
in November 2013 requiring each state to certify that it either does not permit operation of
SHVs or conducts bridge force effects load rating analyses using standard AASHTO loads
and applicable SHV load configurations (Federal Highway Administration, 2013).
1.2 PROBLEM STATEMENT
Most of the current research regarding SHVs focuses on their effects on
infrastructure. However, this Thesis research will focus on the following:
1) What does collected data reveal about the current numbers, fleet distribution
and use of ready mix SHVs?
2) How do different states regulate SHV operations through laws, code, and
regulations?
4
3) What are factors that influence a ready mix company’s decision to operate
SHVs, or not, and what are the factors that guide this decision from company
to company?
Understanding the answers to these questions can help planners, traffic, bridge and
pavement engineers to better understand and forecast future growth in the number of SHVs
operating within their jurisdiction. Further, changes over time can be better understood in
the configurations of SHVs within a state, a region within the state, or along certain
corridors within a state.
1.3 SCOPE OF THESIS
The scope of the Thesis is limited to the above issues, and some limitations of the
research are:
1) Though lift axles can be mounted to single-unit trucks, a truck tractor, or a trailer,
this Thesis focuses on lift axles installed on single-unit trucks.
2) The Thesis will explore ready mix SHV and lift axle use, state laws, code, and
regulations in Texas and nine other states including: California, Florida, Georgia, Illinois,
Michigan, New York, North Carolina, Ohio, and Pennsylvania.
3) Although this Thesis reports findings beyond the ready mix industry – about
SHVs in general - the primary focus of this Thesis is limited to the ready mix industry.
1.4 RESEARCH OBJECTIVES
The first objective of this Thesis is to gain a thorough understanding of current
ready mix SHV operations. To inform this aim, the author performed a review of lift axle
research, as well as statistical analyses of ready mix SHV operation data. The second
5
objective of this Thesis is to compare how states vary in their truck laws, code, and
regulations regarding ready mix SHVs. To inform this aim, the author analyzed legislation
and state guidelines for Texas and nine peer states. The third and final objective of this
Thesis is to document and explain the factors that motivate ready mix companies to operate
SHVs (or not). To inform this final aim, the author performed statistical analyses on survey
data from different sources, as well as interviewed and surveyed various ready mix trucking
company representatives in the United States.
1.5 METHODOLOGY
The research approach employed by this Thesis is the following:
• Statistical analyses of SHV count data and survey data.
• Analysis of laws, codes, and regulations from Texas and nine peer states.
• Interviews and surveys of ready mix company representatives.
1.6 ORGANIZATION OF THESIS
The remainder of this Thesis is organized as follows: Chapter 2 presents a thorough
literature review, describing types of lift axles, describing lift axle mechanisms and
operations, and discussing possible advantages and disadvantages of lift axle usage.
Chapter 3 presents data on SHV usage, including current configurations seen and lift axle
laws. The chapter also discusses statistics of SHV usage in the US. Chapter 4 presents a
discussion of analyses of lift axle regulations in 10 states across the United States. Chapter
5 discusses surveys and interviews of representatives of the ready mix industry. Finally,
Chapter 6 summarizes results of the previous chapters and provides conclusions, as well as
possible directions for future research.

6
Chapter 2: SHVs: A Literature Review
2.1 SPECIALIZED HAULING VEHICLES
As stated in Chapter 1, an SHV is defined both by AASHTO (AASHTO, 2011) and
FHWA (FHWA, 2013) as single-unit trucks with multiple axles that are closely spaced. As
also mentioned before, this Thesis will restrict the definition of SHVs to only include multi-
axle single-unit trucks which have one or more lift axles. A ready mix truck typically has
three fixed axles, including a steer axle and a rear tandem axle. Lift axles are added either
in front of (pusher) or behind (tag or booster) the tandem axle.
This chapter aims to describe SHVs by discussing the types, mechanism of
operation, control mechanisms, and advantages / disadvantages of usage of lift axles. The
following descriptions are applicable to lift axles in general, not specifically those on ready
mix trucks.
2.2 TYPES OF LIFT AXLES AND HOW THEY WORK
To fully understand lift axle usage in the ready mix industry, it is imperative to
understand how lift axles function.
A lift axle is a truck axle that is designed to be raised from the ground when not in
use. This is done to save tire wear during normal operations and to make steering around
corners or sharp curves easier. Lift axles may be designed as non-steering, caster-steered
or twin-steer. Caster-steered lift axles can track the turning movements of the truck to a
limit, however trucks with multiple lift axles may scrape the tire contact areas on the
pavement surface during a turn. This occurs when the turn radius is tighter than the steering
radius of the axle and can cause uneven tire wear and may also damage the pavement
surface. A twin-steer lift axle is linked to the fixed steering axle and can be distinguished

7
from a caster steered axle since, when the driver turns the steering wheel, both the fixed
steer axle and the twin-steer lift axle will turn; regardless if the truck is moving or not.
However, a caster-steered axle is not linked to the truck steering wheel and will only turn
when the truck starts moving and makes a turn; the caster steered axle simply follows the
path of the truck.
When deployed, lift axles increase the number of tires in contact with the ground,
and can change the axle loadings of the fixed axles, thus decreasing the load carried by
each axle. Based on field tests with portable scales, even distribution of load between the
tires on an axle might not be feasible due to the axle design, the pavement cross slope, the
way in which the cargo was loaded, variations in the cargo compartment design, tare weight
symmetry, and center of gravity. As an example, a ready mix drum has flights inside the
drum for mixing or delivering the ready mix – the flights are thick metal plates, shaped in
the form of a spiral, that vary in dimension along the length of the drum and can, therefore,
vary the load on the fixed axles from side to side by 1,000 pounds or more depending on
the drum position. Furthermore, the positioning of the flights can also affect the load of
different axles (even within the same axle group) differently, such as affecting the load of
the front axle of a tandem group more than the rear axle of the tandem group.
Distributing the load among fixed and lift axles may achieve compliance with
weight-limit laws or simply increase the truck’s weight-carrying capabilities. When not
needed, such as when the truck is empty after a delivery, the lift axles can be raised.
When describing lift axles and SHV axle configurations, the following terminology
appears frequently in the literature and is important to understand:
• Pusher axle refers to a lift axle situated directly in front of a fixed axle group.
• Tag axle refers to a lift axle situated directly behind a fixed axle group.
8
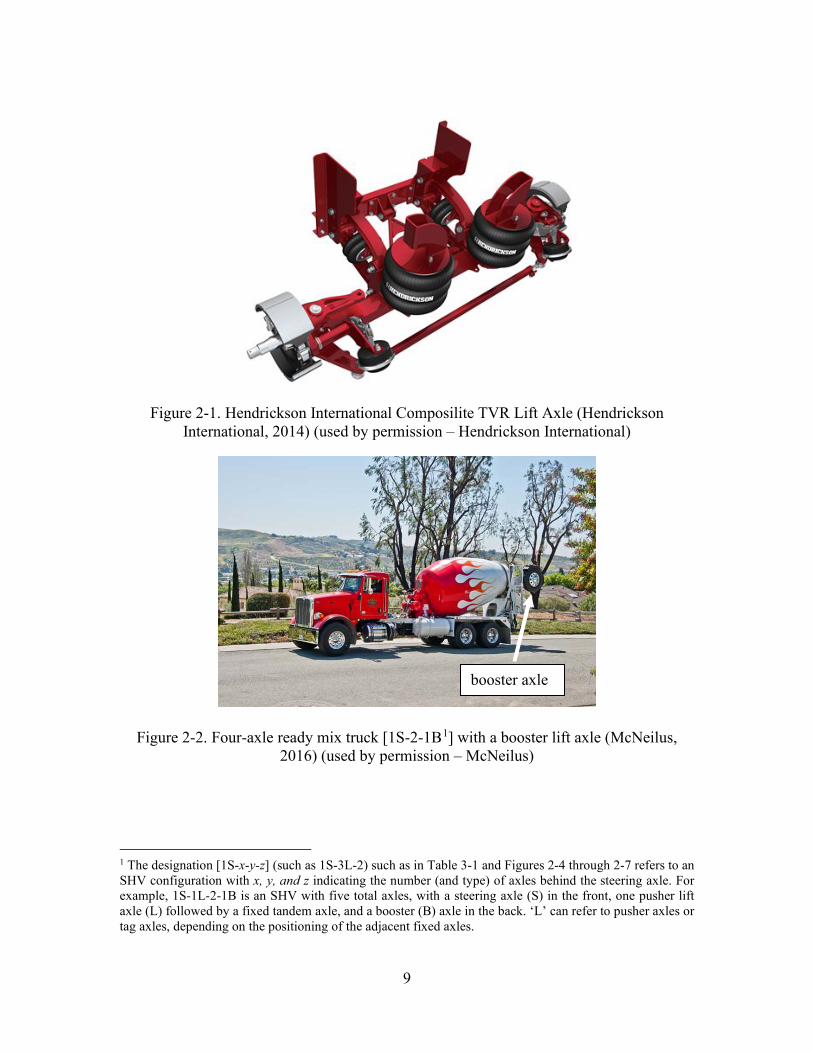
• Booster axle (also known as a stinger axle, trailing axle and flying tag axle) refers
to a lift axle that is positioned a significant distance behind the truck and lifts high
above the frame of the vehicle when raised and is stowed upright against the rear
of the truck.
The tires used on lift axles can also vary significantly in size from truck to truck.
For SHVs with 2 or more lift pusher axles, the tires are generally smaller (lower profile)
than the other tires on the truck, allowing the tires to be lifted further off the ground,
lessening the possibility of the tire hitting the ground when driving on uneven surfaces
(Smith, n.d.). However, lift axle systems on trucks with 4 or fewer total axles typically do
not have low-profile tires. Also, there is variation within industries, such that dump and
ready mix trucks typically employ low-profile tires on lift axles, while solid waste trucks
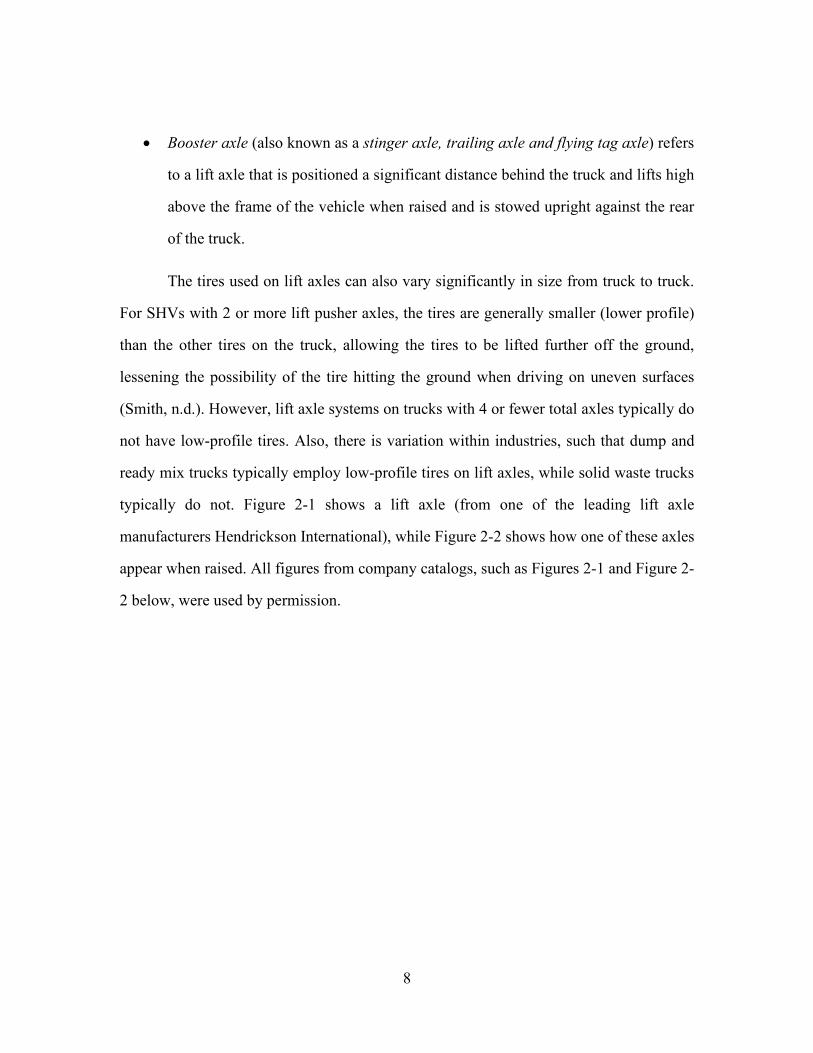
typically do not. Figure 2-1 shows a lift axle (from one of the leading lift axle
manufacturers Hendrickson International), while Figure 2-2 shows how one of these axles
appear when raised. All figures from company catalogs, such as Figures 2-1 and Figure 2-
2 below, were used by permission.
9
Figure 2-1. Hendrickson International Composilite TVR Lift Axle (Hendrickson International, 2014) (used by permission – Hendrickson International)
Figure 2-2. Four-axle ready mix truck [1S-2-1B1] with a booster lift axle (McNeilus, 2016) (used by permission – McNeilus)
1 The designation [1S-x-y-z] (such as 1S-3L-2) such as in Table 3-1 and Figures 2-4 through 2-7 refers to an SHV configuration with x, y, and z indicating the number (and type) of axles behind the steering axle. For example, 1S-1L-2-1B is an SHV with five total axles, with a steering axle (S) in the front, one pusher lift axle (L) followed by a fixed tandem axle, and a booster (B) axle in the back. ‘L’ can refer to pusher axles or tag axles, depending on the positioning of the adjacent fixed axles.
booster axle
10
Typically, the raising and lowering of these axles is done by employing either a
hydraulic or an airbag system. Generally, the driver has the ability to raise and lower the
axle (although this depends on the model of the lift axle system), as well as change the
pressure in the air / hydraulic bags, leading to a change in the amount of load exerted on
the lift axle itself. In Texas, the controls for raising / lowering axles are in the cab of the
truck, while the controls for adjusting the load on the axles are outside of the cab, beyond
the driver’s reach during driving. In addition, depending on how the control mechanism is
installed, each axle can be raised or lowered independently of other lift axles. Thus, it is
not uncommon to see a six-axle truck with one or two of the lift axles up and one remaining
down. There is also variety regarding which axle(s) are up or down as the truck travels
down the road. This raises the question of how different combinations of lift axle positions
affect braking or steering of a loaded truck. Further study is needed to document truck
behavior under these conditions.
Numerous lift axle design variations exist due to different applications. As an
example, a tie rod is part of the steering mechanism of a vehicle, which connects the idler
arms and transmits force from the steering center link to the steering knuckle, causing the
wheels to turn in unison. Lift axle manufacturers can place the tie rod in front of the axle
or behind it, which can change the way the wheels turn. Vehicle wheel turns follow a
geometric principle called the Ackermann Steering Principle, named after Rudolph
Ackermann, who patented the principle in 1818. The principle describes the geometry that
is applied to all vehicles (two- or four-wheel drive) to enable the correct turning angle of
the steering wheels to be generated when negotiating a corner or a curve (Burnhill, 2009).
The placement of the tie rod (front or back) affects the turning radii of the wheels, which
can cause scuffing during turns. Tie rods in the front of the axle may be damaged if the
truck is operating off-road and hits a large object, e.g. a large rock. Some manufacturers

11
place the tie rod behind the axle or have designed tie rods that are made of shock-absorbent
materials which can flex when it hits a rock or other debris.
Another important lift axle system consideration is ride height. Ride height is
defined differently in different contexts. In the case of lift axles, it is defined as the amount
of space between the center of a vehicle tire and the underside of the vehicle frame.
Following the procedure shown by Hendrickson International, it is calculated by taking the
loaded vehicle frame to ground measurement and subtracting the loaded tire radius of the
selected lift axle tire.
Figure 2-3. Hendrickson International Ride Height Measurement (Hendrickson International, n.d.) (used by permission – Hendrickson International)
Lowering a vehicle in any way lowers its center of gravity, and a low center of
gravity helps make the vehicle pitch and roll less. From this perspective, there is a safety

12
benefit to a low ride height. A lower ride height also provides aerodynamic benefits,
increasing the truck’s downforce without a significant increase in drag. However, a low
truck ride height may have adverse effects. For lift axle vehicles, a lower ride height results
in less physical space for raising the lift axle. This also increases the possibility of the truck
damaging chassis components when driving on uneven road conditions, especially when
off-road. Some lift axle manufacturers provide lift axle systems with adjustable ride heights
to meet a variety of truck configurations.
Lift axles may be available preinstalled on a new truck based on specifications
given to the manufacturer by the purchaser. Lift axles might also be retrofitted by an
aftermarket company to a newly purchased truck, or when modifying a used truck. While
the first type of truck is originally designed as an SHV, retrofitting lift axles to a new or
used truck converts a truck to an SHV. Retrofitting a new or used dump truck to an SHV
is more common though ready mix trucks might be retrofitted to an SHV as well. However,
a problem that sometimes occurs with truck conversions is that the original truck’s chassis
may not have been designed to carry the additional loads imposed by additional axles. An
article on Concrete Construction warned ready mix suppliers of the risks of adding a tag
axle to a ready mix truck, stating that adding a lift axle may alter the weight distribution in
unforeseen ways (Ward, 1994).
Table 2-1 shows a few of the available lift axle manufacturers currently in business
and the number of lift axle options they have for sale on their website. The options vary
based on load capacity, steerable / non-steerable, ride heights, and the other considerations
mentioned above. It should also be noted that lift axles can also be modified once
purchased, either by the manufacturer or by a third party, to fit an even more specific need.

13
Table 2-1. Lift Axle Options from Various Lift Axle Manufacturers
Lift Axle Manufacturer
# of Lift Axle Models on Sale (Website)
# of Steerable Models
# of Lightweight Models
# of Heavy-Duty Models
Hendrickson 22 11 3 8 Link Manufacturing 6 3 3 2
Reyco Granning 5 2 2 3 Ridewell 7 5 2 3
Silent Drive 23 8 6 2 Watson & Chalin 16 12 3 5
The above-mentioned options are for lift axles on the body of the truck, such as tag
or pusher axles. The different types of lift axles seen on single-unit ready mix trucks are
shown in Figures 2-4 through 2-7.
Figure 2-4. Five-axle, SU5, front discharge ready mix truck [1S-2L-2] with pusher axles (MyLittleSalesman, n.d.)
2 pusher axles

14
Figure 2-5. Four-axle truck [1S-2-1B] with one booster axle (McNeilus, 2017) (used by permission – McNeilus)
Figure 2-6. Six-axle truck [1S-2L-2-1L] with two pusher axles and tag axle (Seitz, 2004.)
booster axle
pusher axles tag axle

15
Figure 2-7. Six-axle truck [1S-2L-2-1B] with two pusher axles and retracted booster axle (McNeilus, 2017) (used by permission – McNeilus)
Lift axle options include steerable and non-steerable axles, as well as single steer
or twin steer axles. Twin steer axles allow improved turn stability compared to single steer
configurations, as the driver has control over more wheels. The main difference between
steerable and non-steerable is that the caster-steered axle tracks the same path as the
steering axle during turns. Therefore, if a turn isn’t too tight, pavement scrubbing is not an
issue. On the other hand, non-steerable axles do not turn and remain in line with the fixed
rear axles, and thus its tires “will plow asphalt and scrub concrete, and will scuff tire tread
and impose high lateral stress on wheels and chassis components” during turns (Berg,
2010). Therefore, to reduce both pavement and equipment damage, drivers raise non-
steerable lift axles before a turn. However, some states do not allow this practice, as the
truck is technically overloaded on the other axles during the turning maneuver. In such
states where lifting during turns is not allowed or lift axle controls are mandated to be
situated outside of the truck cab, steerable lift axles are the driver’s only option for lift
pusher axles
raised booster axle

16
axles. The downsides to steerable axles, from the perspective of drivers, are higher
equipment weight, costs, and maintenance needs, all due to the presence of more parts to
incorporate steering ability. be referred to by different names elsewhere in industry / law
enforcement.
2.3 LIFT AXLE CONTROLS
The control systems for lift axles also present some levels of variation and
customization. Generally, there are two types of controls which form a lift axle system: the
controls that raise and lower the axles physically, and the controls that determine how much
weight is loaded onto the axle. Many combinations are possible for the location and
configuration of these two controls, and the combination seen in practice is determined by
the laws of the state in which the trucking company operates. For example, some states
restrict either type of control from being within reach of the driver during operation, i.e.,
while the vehicle is in motion. In such states, the controls are placed outside, on the body
of the truck. Other states allow the raising / lowering control to be inside the cab (within
the driver’s reach), but do not allow the controls for regulating weight to be inside. Some
newer axle systems take all control away from the driver and are designed such that the lift
axles automatically deploy themselves when needed, setting the weight for optimal
performance, based on the total weight of the truck ("Mack targets tank fleets for new Load
Logic 6x2 liftable pusher axle", 2015).
Another variation in the control system includes the mechanism for adjusting the
weight carried by the lift axle. Some control systems regulate the weight in terms of pounds
carried, using an adjustment knob and gauge to determine how much weight the lift axle
will carry, while other mechanisms are calibrated according to other units. For example, a
ready mix company interviewed for this research sets the load according to the volume of

17
ready mix in their drums. The driver only needed to select the number of cubic yards of
material being transported, and the control mechanism adjusted the lift axle air bag pressure
accordingly.
Figure 2-8. Lift axle air bag pressure versus cubic yards in drum (Murphy, 2016)
The following figures depict lift axle control systems photographed on a seven-axle
‘superdump’ dump truck.

18
Figure 2-9. Inside-cab controls for booster axle (Hasan, 2016)
Figure 2-10. Inside-cab controls for pusher axles (Hasan, 2016)

19
Figure 2-11. Outside-cab pressure gages / controls for pusher axles (Jiang, 2016)
Figure 2-12. Close-up of outside-cab pressure gage / control for pusher axle (Jiang, 2016)

20
Figure 2-13. Outside-cab pressure gage / control for booster axle (Jiang, 2016)
2.4 LIFT AXLE ADVANTAGES AND DISADVANTAGES
Generally, lift axles allow trucks to carry more weight by adding a load-bearing
axle to the truck. Lift axles also provide truckers with more control over how weight is
distributed amongst all axles, as well as the flexibility of adjusting the truck’s configuration
to fit the need of a particular operation. Not specific to the ready mix industry, but for lift
axle trucks in general, replacing five-axle tractor-trailers with SHVs also might benefit
operator safety, as SHVs are shorter and easier to operate (Muthumani & Shi, 2015).
However, this might be offset by the fact that shorter, heavier SHVs will have a higher
center of gravity, which will increase the chance of rollover crashes. Furthermore, a study
conducted on semi-trailers with lift axles concluded that lifting axles on semi-trailers led
to some fuel savings (ranging from 1.3% to 2.8% savings), although the study did not
include single-unit trucks (Surcel & Bonsi, 2015). Some possible disadvantages identified
include the following (Sivakumar, Moses, Fu & Ghosn, 2007):

21
• Lift axles, when deployed, reduce the turning capabilities of the truck and may
cause tractor-trailers to jackknife on slippery roads. If axles are raised through the
turn, the truck’s stability is compromised, and the chance of rollover is increased.
• The proportion of the load carried by the lift axle is often controlled by the driver.
This system introduces the opportunity for operator error, in which an axle or set
of axles may carry too much or not enough of the load.
• Enforcing compliance with lift axle regulations is difficult. Lowering retractable
axles when approaching a truck weight enforcement facility and then raising the lift
axles after clearing the facility is not uncommon.
A 1991 Transportation Research Record study found that, although shippers
benefit from lower transportation costs by using lift axles, there is a “solid technical basis
for regulatory measures that would limit the application and use of liftable axles” (Billing,
Nix, Boucher & Raney, 1991), primarily due to issues regarding weight compliance,
roadway wear, bridge loading, and intrinsic truck safety issues.
One of these safety issues is braking force of a lift axle. If a lift axle is raised off
the pavement, it cannot produce a braking force and increases the truck center of gravity.
However, even when lowered, some lift axle systems have brakes that produce less braking
force than steering axles or drive axle(s). A 1990 study conducted by the Northwestern
University Traffic Institute on coefficient of friction in traffic accident reconstruction found
(Fricke & Baker, 1990):
• All other factors being equal, the axle with the lightest load will lock first during
braking. During skidding, there are no lateral friction forces available to prevent
sliding of the tires due to curve super elevation or pavement cross slope. Anti-lock

22
Braking Systems (ABS) automatically compensate for differences in wheel loads,
addressing this issue.
• All other factors being equal, the wheel with the least radius will lock first as brake
pedal pressure is increased. This is because the maximum torque (rotational
moment) of a wheel on a vehicle in motion is equal to the coefficient of friction
of the tire on the road times the weight on the tire times the leverage (moment
arm). The moment arm is the distance from the axle to the road - that is, the tire
radius. With equal road friction, weight, and brake resistance to rotation, the wheel
with the greatest moment arm can overcome brake resistance, while the wheel
with the least moment arm cannot - Thus, with increasing but equal brake effort,
the wheel with the least radius (moment arm) will be the first to start sliding.
Thus, even if the braking force for a lift axle is the same as for the fixed tandem
axles, lift axle brakes will lock first, causing the tires to skid. This results in zero lateral
force preventing the truck from sliding sideways. Thus, if all lift axles lock first, the
tendency will be for the rear of the truck to slide in the direction of downward sloping
pavement surface (due to pavement cross slope, or super elevation). However, this will
only occur if the braking force supplied by the brakes on the lift axle are equivalent to the
braking force of the fixed tandem axles.
A representative for a liftable axle manufacturer was interviewed about lift axles
and asked for details regarding liftable axle braking capacities. The representative said:
“Lift axles come in various weight capacities depending on what each state allows. Most
common weight capacities are 8k, 13k and 20k lbs. Each of these has brakes matched to
the axle’s carrying capacity. Brake capacity is determined by the size of the brake shoe,
thickness and material of the lining and stroke of the brake chamber. Timing of the brakes
23
is determined by the brake valve. So, braking capacities match the carrying capacity of the
axle, and vary from SHV to SHV”.
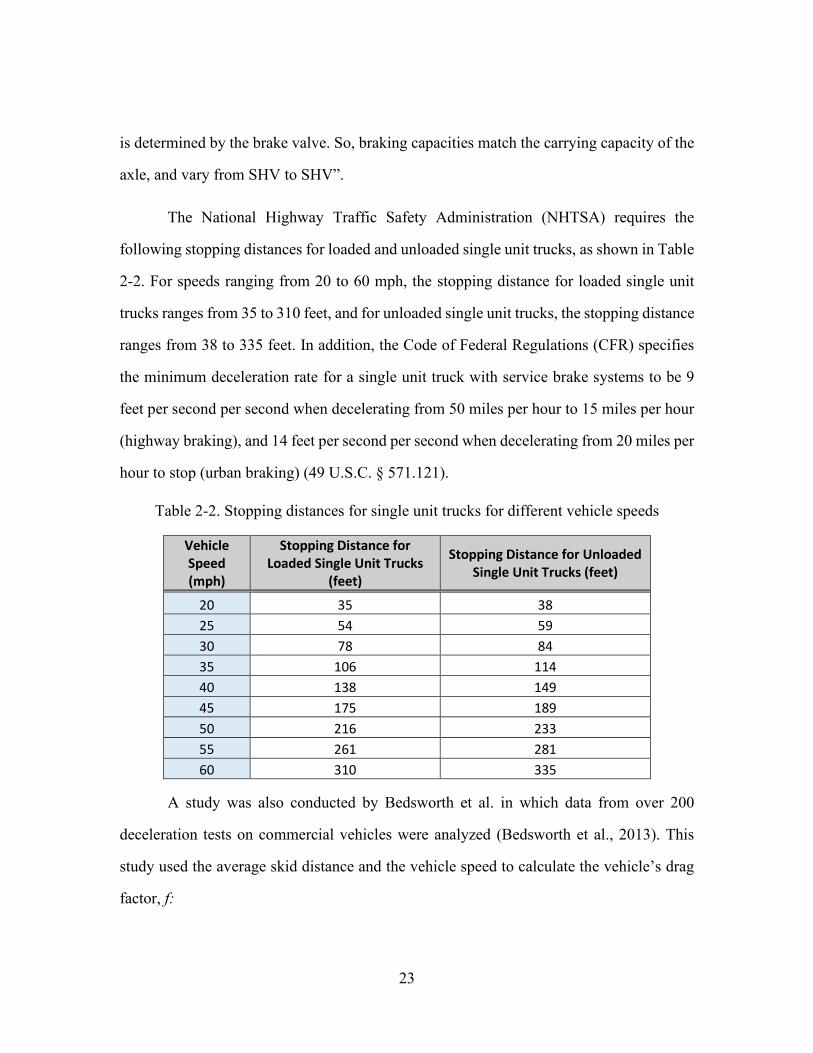
The National Highway Traffic Safety Administration (NHTSA) requires the
following stopping distances for loaded and unloaded single unit trucks, as shown in Table
2-2. For speeds ranging from 20 to 60 mph, the stopping distance for loaded single unit
trucks ranges from 35 to 310 feet, and for unloaded single unit trucks, the stopping distance
ranges from 38 to 335 feet. In addition, the Code of Federal Regulations (CFR) specifies
the minimum deceleration rate for a single unit truck with service brake systems to be 9
feet per second per second when decelerating from 50 miles per hour to 15 miles per hour
(highway braking), and 14 feet per second per second when decelerating from 20 miles per
hour to stop (urban braking) (49 U.S.C. § 571.121).
Table 2-2. Stopping distances for single unit trucks for different vehicle speeds
Vehicle Speed (mph)
Stopping Distance for Loaded Single Unit Trucks
(feet)
Stopping Distance for Unloaded Single Unit Trucks (feet)
20 35 38 25 54 59 30 78 84 35 106 114 40 138 149 45 175 189 50 216 233 55 261 281 60 310 335
A study was also conducted by Bedsworth et al. in which data from over 200
deceleration tests on commercial vehicles were analyzed (Bedsworth et al., 2013). This
study used the average skid distance and the vehicle speed to calculate the vehicle’s drag
factor, f:

24
f = s*s/(30*d)
In the above equation, s is the speed of the vehicle in mph, and d is the vehicle’s
average skid distance. The drag factor times the acceleration due to gravity is equal to the
deceleration rate of the vehicle. Of relevance to SHVs were data for ready mix trucks with
lift axles and dump trucks with lift axles.
The Bedsworth data show drag factors based on skid distance, which should not be
confused with the stopping distance in the NHTSA table. Stopping distance is the sum total
of the braking distance (skid distance) and the distance travelled while the driver is
perceiving-reacting to the braking situation. Therefore, the two values (stopping distances
in Table 2-2 and drag factors based on skid distances in Table 2-3) cannot be directly
compared.
Table 2-3 also shows the calculated deceleration rate, which can be related to the 9
ft/sec2 value from the CFR. Since the Bedsworth experiments were done from starting
speeds above 20 mph, the comparison can be made to the highway braking deceleration
rate, although other differences exist that would make a direct comparison difficult, listed
later in this section.

25
Table 2-3. Trucks in the Bedsworth study compared to regulated deceleration rate
Truck Type SHV Weight (lbs)
Test Run
Number
Speed (mph)
Calculated Drag Factor
Calculated Deceleration Rate (ft/sec2)
Concrete Mixer (1S-2L-
2-1B) Yes 51,900
1 28.6 0.32 10.3
2 26.4 0.41 13.2
Three-axle Concrete
Mixer No 27,250
1 28.7 0.51 16.4
2 35.8 0.56 18
Dump Truck (1S-3L-2) Yes 50,200
1 25.3 0.44 14.2 2 32.3 0.42 13.5 3 30.4 0.49 15.8
Dump Truck (1S-1L-2) Yes 65,900
1 27 0.6 19.3 2 29.1 0.59 19 3 26.2 0.59 19
Dump Truck with single rear axle
No - 1 25.5 0.43 13.8
2 40.1 0.68 21.9
Dump Truck (28') No 26,500
1 28.2 0.56 18 2 38 0.62 19.9
Dump Truck (25') No 25,200
1 30 0.66 21.2 2 34 0.48 15.4 3 33 0.61 19.6
Dump Truck (22') No 21,800
1 32 0.79 25.4 2 34 0.72 23.2 3 29 0.79 25.4
As can be seen above, three of the eight trucks were SHVs and all exhibited a
deceleration rate above the minimum required rate. Of the three SHV trucks, one was a
ready mix truck and two were dump trucks. These tests are of interest, but do not directly
compare to the test methods used in developing the CFR criteria. The CFR tests were
conducted to evaluate braking deceleration rates after multiple braking attempts that would
have caused high brake temperatures. The Bedsworth tests did not include this condition.

26
The CFR tests were also likely conducted with new brakes and new tires, whereas the
Bedsworth study was likely performed on trucks with brakes and tires that were worn to
varying degrees. The trucks and number of axles in the two tests were also not the same.
Further, the Bedsworth tests were performed on pavement whereas the CFR tests were in
controlled laboratory conditions on a dynamometer. However, it is noted that every truck
exhibited a deceleration rate above the 9 ft/s2 criteria established in CFR for trucks braking
from speeds above 20 mph. It is also noted that multiple tests (with the same driver) yielded
different results. These differences could be due to small differences from test to test
related to the rate at which the driver depressed the brake pedal, air pressure build up in the
braking system, slight differences in the exact test location, which might result in different
pavement texture conditions and other factors. Furthermore, factors such as the disk brakes
used also have a significant impact on brake distances. Therefore, more standardized
research into SHV braking distances should be performed to understand safety issues
further.
2.5 READY MIX TRUCK DISCHARGE TYPE
There are different variations of ready mix trucks that have been observed. One
specific distinction is in the type of discharge mechanism, which can commonly be of two
types: rear-discharge and front-discharge.
According to National Ready Mix Concrete Association’s (NRMCA) annual
surveys on fleet numbers and compositions, the proportion of rear discharge mixers (such
as in Figure 2-7) is around 75%, with the remaining being front discharging (such as in
Figure 2-6). Indeed, looking at the annual surveys over the years in Table 2-4, which is
discussed in more detail in Chapter 5, it is clear that the proportion of rear discharge mixers

27
has been significantly higher for the last decade (NRMCA, 2006, 2007, 2008, 2010, 2011,
2012, 2013, 2014, 2015, 2016, 2017).
Table 2-4 Proportion of Rear-Front Discharge Mixers in Recent History (NRMCA)
Year Front Discharge Vehicles (% of
Total)
Rear Discharge Vehicles (% of
Total)
2008 2,744 (19%) 11,835 (81%) 2010 2,383 (17%) 11,454 (83%) 2011 3,811 (25%) 11,497 (75%) 2012 2,249 (18%) 10,200 (82%) 2013 1,792 (17%) 8,797 (83%) 2014 3,946 (26%) 11,340 (74%) 2015 2,721 (17%) 13,563 (83%) 2016 2,164 (14%) 12,919 (86%) 2017 3,074 (19%) 13,472 (81%)
The main differences between the two types of trucks are the mechanisms for
discharging ready mix at the delivery site, speed of operations, and capital and operational
costs.
As the name suggests, a rear-discharge mixer truck discharges ready mix through a
chute in the back of the vehicle, while a front-discharge mixer truck discharges through a
chute located in the front of the truck, in front of the driver. For both of these types of
trucks, the ready mix material is stored (and mixed) in large drums. The drum has two sets
of one-piece, formed fins which make up the flights to both mix and elevate. The fins are
placed opposite of each other, running the entire length of the drum. To mix, the drum is
generally rotated by hydrostatic transmission power from the truck engine. The rotation of
the drum is controlled by the driver with controls inside the cab (Kimble Mixer Company,
2014). The driver can control the direction of the rotation, which in turn changes the
direction of the mix’s flow (mix or discharge). At the discharge site, for a rear-discharge

28
vehicle, the driver must back into the spot where delivery will occur. Typically, a separate
employee, solely in charge of handling the chute, positions the discharge chute to
accurately deliver the mix where needed. This employee is in charge of adding chutes to
reach further distances if needed, and of manually moving the chutes left and right to ensure
proper delivery. For a front-discharge mixer truck, the driver drives up to the delivery spot
and, using chute controls from inside the cab, positions the chutes properly. Then, typically
using a joystick trigger inside the cab, the driver can discharge the ready mix into place
(Terex, n.d.).
Given the relative ease for a front-discharge mixer truck’s maneuvering at the
delivery site – drive up to the delivery spot instead of back into it – front-discharge mixers
are generally faster to operate. Companies that sell front-discharge mixers claim that the
increased speed of operations can lead to the possibility of making an extra delivery per
day, which can lead to significant profits.
Another cost which front-discharge mixers can eliminate is an additional employee
required to handle the chutes on a rear discharge mixer. This makes it possible for front-
discharge mixer truck operators to manage with fewer employees.
However, according to an executive for a company that manufactures front-
discharge mixer trucks, the front-discharge mixer trucks are more expensive to buy, costing
roughly 15-18% more than the more common rear-discharge mixer trucks (“All about front
discharge mixers”, 2010). However, the executive states front discharge mixer trucks have
a longer life cycle, as well as the previously mentioned speedier operations – and thus profit
– so the cost difference isn’t just the comparison of two simple numbers.
According to an executive at another ready mix trucking company, Ernst Concrete,
rear-discharge mixer trucks are better-suited for higher-volume pours, such as building and

29
roadway construction in big cities, whereas front-discharge mixer trucks are more suited
to smaller, residential projects (“All about front discharge mixers”, 2010). He also says
rear-discharge mixer trucks have a higher chance of rollover, making front-discharge mixer
trucks safer to operate.
This chapter provided an in-depth understanding of what lift axles are. The section
described how their mechanism operates, some significant differences between the many
types of lift axles available, how control systems work, and advantages and disadvantages
of lift axles.
The next chapter discusses current SHV operations, with regards to types of SHVs
commonly seen and other information about their current operations. Most of this
information is focused on Texas, as a result of other research this author has been a part of,
including the UT-CTR study mentioned in this chapter. The chapter also discusses statistics
of SHV usage in the US.

30
Chapter 3: Current SHV Operations
The focus of this chapter is to evaluate SHV operations in Texas and nine peer
states. The chapter begins with a discussion of different SHV truck configurations and the
factors that influence them. Next, some results from lift axle research in Texas are
discussed. Extra-Thesis research conducted by the author is discussed, as well as two
surveys, completed by a scientific agency and an industry advocacy group.
3.1 LIFT AXLE TRUCK CONFIGURATIONS
SHVs operate with a variety of lift axle positions and types depending on the type
of truck, desired load capacity, and state / federal laws. The laws that regulate
configurations are detailed later in this chapter. The primary federal law that governs SHVs
at the federal level is the Federal Bridge Formula (FBF), with some state laws adding size
/ weight restrictions for certain areas or roadway facilities. The SHV configurations that
operate in a state are those that adhere to both federal and state regulations of that state.
Table 3-1 provides some examples of SHV truck configurations. The table, while
covering many commonly seen configurations, may not be a comprehensive list of all
possibilities.

31
Table 3-1. Example SHV Configuration Table Using Configuration Codes
Config Code Description SHV
1S-1L-2 1 Steering Axle, 1 Lift Axle (Pusher), 2 Fixed Axles (Tandem) SU4
1S-2-1L 1 Steering Axle, 2 Fixed Axles (Tandem), 1 Lift Axle (Tag) SU4
1S-2-1B 1 Steering Axle, 2 Fixed Axles (Tandem), 1 Lift Axle (Booster) SU4
1S-2L-2 1 Steering Axle, 2 Lift Axles (Pusher), 2 Fixed Axles (Tandem) SU5
1S-1L-2-1B 1 Steering Axle, 1 Lift Axle (Pusher) 2 Fixed Axles (Tandem), 1 Lift Axle (Booster) SU5
1S-1L-2-1L 1 Steering Axle, 1 Lift Axle (Pusher) 2 Fixed Axles (Tandem), 1 Lift Axle (Tag) SU5
1S-1L-2-1L-1B 1 Steering Axle, 1 Lift Axle (Pusher) 2 Fixed Axles (Tandem), 1 Lift Axle (Tag), 1 Lift Axle (Booster) SU6
1S-3L-2 1 Steering Axle, 3 Lift Axles (Pusher), 2 Fixed Axles (Tandem) SU6
1S-2L-2-1B 1 Steering Axle, 2 Lift Axles (Pusher) 2 Fixed Axles (Tandem), 1 Lift Axle (Booster) SU6
1S-3L-2-1B 1 Steering Axle, 3 Lift Axles (Pusher), 2 Fixed Axles (Tandem), 1 Lift Axle (Booster) SU7
The terms, configuration names, and configuration codes used in this Thesis may
be referred to by different names elsewhere in industry / law enforcement.
3.2 READY MIX AXLE CONFIGURATIONS
There are numerous possible variations of how the axles on a commercial truck can
be configured, and this fact remains true for ready mix trucks. These differences are based
on the differences in operations, e.g. adding a pusher axle may increase the truck’s legal
gross vehicle weight, which will allow the truck to carry more cargo overall. However, the
extra added axle will add some weight of its own, so there may or may not be an overall
benefit, purely based on weight. There are also length requirements that come into play
when determining how much a truck can carry legally, so the truck’s increase in carrying
capacity may also be determined by whether or not the truck frame is long enough to allow
it based on federal laws and state statutes (Nadolny, 1994). Adding an additional axle may

32
also change the maneuverability of the truck, especially during turns. The following photos
depict the wide variety in ready mix truck axle configurations including both non-SHV and
SHV trucks. These photos do not represent all possible configurations.
2-Axle Ready Mix Truck Configurations
A ready mix truck with only two axles does not have the option for much variability,
since one of the axles must be the steering axle, and the other fixed. An example of such a
truck is shown in Figure 3-1.
Figure 3-1. 2-Axle Rear Discharge Truck [1S-1] in Pennsylvania (CommercialTruckTrader, n.d.)
3-Axle Ready Mix Truck Configurations
One of the most common ready mix truck axle configurations are 3-Axle
configurations. Similar to 2-Axle configurations, there is not much room for variability.
However, the truck can be rear discharge or forward discharge, and examples of these are
shown in Figures 3-2 and 3-3.

33
Figure 3-2. 3-Axle Rear Discharge Truck [1S-2] (Kimble Mixer Company, n.d.) (used by permission – Kimble Mixer Company)
Figure 3-3. 3-Axle Front Discharge Truck [1S-2] in Tennessee (CommercialTruckTrader, n.d.)
4-Axle Ready Mix Truck Configurations
Another common set of axle configurations seen in industry consists of variations
of 4-Axle trucks. Beyond the rear discharge vs. front discharge variation, at least one of

34
the four axles can be a lift axle, of varying types in varying positions. Some examples of
commonly seen variations are shown in Figures 3-4 through 3-8.
Figure 3-4. 4-Axle Front Discharge Truck, Twin Steer (1S-1L/S-2) in New York (CommercialTruckTrader, n.d.)
The above figure shows a rear discharge truck, where the second steer axle may or
may not be a lift axle, hence the configuration code could be L or S.
Figure 3-5. 4-Axle Front Discharge Truck with Pusher Axle [1S-1L-2] in Virginia (CommercialTruckTrader, n.d.)

35
Figure 3-6. 4-Axle Rear Discharge Truck with Tag Axle [1S-2-1L] in Arkansas’ (CommercialTruckTrader, n.d.)
Figure 3-7. 4-Axle Rear Discharge Truck with low profile tire Pusher Axle [1S-1L-2] in Tennessee (CommercialTruckTrader, n.d.)

36
Figure 3-8. 4-Axle Rear Discharge truck with Booster Axle [1S-2-1B] in Texas (CommercialTruckTrader, n.d.)
5-Axle Ready Mix Truck Configurations
Although five axles allow for more variation than a four axle, with one more
potential fixed or lift axle in varying positions and varying types, a large share of the
configurations seen in practice are composed of two specific configurations. Both are
shown in Figures 3-9 and 3-10.
Figure 3-9. 5-Axle Rear Discharge Truck with Pusher and Booster Axle [1S-1L-2-1B] in Minnesota (CommercialTruckTrader, n.d.)

37
Figure 3-10. 5-Axle Front Discharge Truck with Pusher and Tag Axle [1S-1L-2-1L] (Terex, n.d.)
6-Axle Ready Mix Truck Configurations
Ready mix truck configurations with six axles are not very common. However, two
variations are seen, and are shown in Figures 3-11 and 3-12.
Figure 3-11. 6-Axle Rear Discharge Truck with Pusher Axles and Booster Axle [1S-2L-2-1B] in Minnesota (TruckPaper, n.d.)

38
Figure 3-12. 6-Axle Front Discharge Truck with Pusher Axles and Booster Axle [1S-2L-2-1B] in Utah (CommercialTruckTrader, n.d.)
7-Axle Ready Mix Truck Configurations
7-Axle trucks exist in the ready mix industry, with two possible configurations
shown in Figures 3-13 and 3-14.
Figure 3-13. 7-Axle Rear Discharge Truck with Three Pusher Axles and Booster Axle [1S-3L-2-1B] (McNeilus, 2017) (used by permission – McNeilus)

39
Figure 3-14. 7-Axle Front Discharge Truck with Three Pusher Axles and Tag Axle [1S-3L-2-1L] (Courtney, n.d.)
3.3 LIFT AXLE RESEARCH IN TEXAS
Texas does allow operation of SHVs, and the number and range of actual gross
vehicle weights (GVWs), axle weights, axle configurations, and spacing of SHVs in Texas
has been researched (Walton et. al, 2017; Walton et. al, 2016). The author participated in
the cited studies including collection of field data to determine where SHVs operate in
Texas; the numbers and types of SHV configurations; and axle loads, axle spacing and
Gross Vehicle Weights. Other aims were to evaluate the deterioration (consumption) rates
for SHVs on pavements and bridges, evaluate safety considerations of SHVs, and prepare
policy suggestions to manage SHV operations and load posting sign layouts for the Texas
Manual on Uniform Traffic Control Devices (TMUTCD). The project was in response to
the 2013 FHWA memo requiring each State DOT to investigate the SHV configurations
operating in their state and to confirm that the AASHTO Manual for Bridge Evaluation
contained SHV load configuration templates that represented the SHV fleet in that state.
Further, based on the evaluation, if a state operated SHV configurations not represented by

40
the AASHTO Manual on Bridge Evaluation SHV load diagrams, the state was to develop
a new loading diagram for these SHV configuration(s) for further evaluation by FHWA
and the State DOT, ensuring these loading diagrams envelope the applicable AASHTO
developed diagrams.
The data used in the 2017 study came from five different sources:
1) Truck Sales data: the research team searched through and analyzed various sales
databases in Texas to obtain counts for SHVs that were for sale. Over 1,500 trucks were
counted and analyzed.
2) Site visits: the research team determined industries that were more likely to have
SHVs in their fleets – dump trucks, ready mix trucks, etc. – and visited sites for these
industries to obtain manual counts of trucks entering and leaving the facility, categorizing
them as either SHV or non-SHV including the truck configurations. Over 3,250 trucks were
counted and documented.
3) Route data: the research team collected visual observations of trucks and truck
configurations during trips from Austin to Houston, San Antonio, Wichita Falls, Waco,
and Marble Falls. These trips included counts passing through other cities and towns
including Dallas, Ft. Worth, Mineral Wells and many others. Over 32,000 trucks were
counted using this method.
4) Video data: 24-hour video feeds obtained from TxDOT were analyzed at
different points in the state to count and categorize trucks. Over 20,000 trucks were counted
this way.
5) Repeated trips on FM 1431, IH 35, FM 973: the research team travelled 87 times
along the same route, in both directions, on different days of the week, and different times

41
of the day, over several months. During these travels, almost 21,000 trucks were counted
and described.
6) Department of Public Safety Weight Enforcement Data and Weigh-In-Motion
Data: the research team received over 292,000 records from the DPS Weight Enforcement
team, as well as over 205 million records from 36 WIM stations across Texas. For both
types of data, around 1% of the data were determined to be SHVs.
One result of this data was a synthesis of axle weight and axle spacing records for
SHVs in Texas, which uses the weight data listed in item 6) described above. Table 3-2
(DPS) and 3-3 (WIM) show examples of the weight data analysis data results. Due to a
lack of ready mix trucks in the DPS data, the example shown in Table 3-2 is for a five-axle
dump truck with two lift axles (1S-2L-2). Table 3-3 shows axle spacing data for various
SHVs seen in Texas, from Texas Department of Transportation Weigh-in-Motion (WIM)
data. The WIM data did not contain any information about the type of truck.
Table 3-2. SHV axle weight distributions for five-axle 1S-2L-2 lift axle dump trucks (TX DPS weight data)
Percentile Weight
(%) Axle-1 Axle-2 Axle-3 Axle-4 Axle-5 GVW
5 14715 6919 6828 15994 15994 60450 25 15544 7309 7213 16895 16895 63850 50 16214 7624 7524 17624 17624 66610
Average 16456 7738 7636 17887 17887 67600 75 17455 8207 8100 18972 18972 71700 95 19157 9008 8890 20823 20823 78700
In Table 3-2, the Percentile Weight column shows, for this particular SHV
configuration, the axle weights for the 5th, 25th 50th, average, 75th and 95th percentile
truck axle and GVW weights. Thus, at the 25th percentile, 25 % of the trucks had axle

42
weights and a GVW weight at or below these values. The calculated average weights are
shown in red. The lift axles, axles ‘2’ and ‘3’ above, show that the average weights on the
lift axles of this type of truck are slightly below 8,000 lbs. The average axle loads for the
1S-2L-2 configuration are shown to be 16,456 lbs for the steering axle, 7,738 lbs for lift
axle 1, 7,636 lbs for lift axle 2, 17,887 lbs for fixed tandem axle 1 and 17,887 lbs for fixed
tandem axle 2.
Table 3-3. SHV axle spacing data for various configurations in Texas (WIM weight data)
Configuration No. Axles
Sp.1-2(ft)
Sp.2-3(ft)
Sp.3-4(ft)
Sp.4-5(ft)
Sp.5-6(ft)
Sp.6-7(ft)
Spacing Total(ft)
1S-1L-2 4 12.7 4.3 4.4 0 0 0 21.4 1S-2-1B 4 12.5 4.4 10.1 0 0 0 27.0 1S-2L-2 5 11.3 4.1 4.1 4.4 0 0 23.9
1S-1L-2-1B 5 13.4 4.2 4.5 10.9 0 0 33.0 1S-3L-2 6 11.1 3.8 3.8 3.8 4.5 0 26.9
1S-2L-2-1B 6 10.4 3.9 4.2 4.4 11.8 0 34.7 1S-3L-2-1B 7 8.7 3.5 3.5 3.6 4.4 11.7 35.4
Table 3-3 indicates the average axle spacings based on WIM data. The axle
spacings are taken from center of axle to center of axle. For the configuration shown in
Table 3-2 – 1S-2L-2 – the data show that the typical distance between lift axles is around
4’. Another notable measurement based on the spacing is the outer bridge length, defined
as the distance from the center of the steer axle to the center of the rearmost tandem axle
is 23.9’ in this example. The spacing above is shown in Figure 3-15, with a sample dump
truck. It is interesting to note that as the number of lift axles increase, such as in the last
configuration of the table, the spacing reduces to about 3.5’.

43
Figure 3-15. 5-Axle Dump Truck with Two Pusher Axles [1S-2L-2]
The author participated in a study to evaluate 5 SHV ready mix truck configurations
specified in proposed legislation (Walton et. al, 2016). As part of the study, the researchers
analyzed various ready mix truck configurations and also visited a ready mix plant to weigh
and measure a ready mix truck with lift axles in loaded and unloaded conditions. The
researchers used Load Xpert™ software to analyze ready mix truck configurations based
on truck measurements and axle spacing information. An example Load Xpert™ analysis
sheet is shown in Figures 3-16 and 3-17.

44
Figure 3-16. Load Xpert™ Analysis Page for 5-Axle Ready Mix Truck [1S-3-1B] Part 1 (Walton et. al, 2016)

45
Figure 3-17. Load Xpert™ Analysis Page for 5-Axle Ready Mix Truck [1S-3-1B] Part 2 (Walton et. al, 2016)

46
This analysis provided interesting insights regarding 3-axle ready mix trucks,
which are authorized (without extra permits) under Texas Transportation Code Title 7
Section 622.011 to be operated at 23,000 lbs on the steering axle and 46,000 lbs on the
tandem axle. This is due to a state exemption, which does not apply on interstate routes.
However, the Load Xpert™ analysis showed that it was not feasible to carry 23,000 lbs on
the steering axle without exceeding the tandem axle weight limit of 46,000 lbs. A Texas
Department of Motor Vehicles Ready Mix Concrete Truck permit is available for purchase
by 3-axle ready mix truck operators that permits 10% axle weight tolerances of 25,300 lbs
on the steer axle and 50,600 lbs on the rear tandem though the allowable GVW of 69,000
lbs cannot be exceeded (TxDMV, 2019). In this way, a ready mix truck can achieve the
maximum allowable 69,000 lbs GVW under state statutes. The Ready Mix Truck 10% axle
weight tolerance permit does not authorize operation of a ready mix truck at this weight
limit on the Interstate highway system; though operation on IH frontage roads is permitted.
The research team members were invited to weigh an empty and a loaded ready
mix truck at a plant yard. Before the weighing process, the research team members were
given the opportunity to take a TxDPS Weight Enforcement Training class to observe how
HAENNI WL-101 weight scales are to be used when weighing a truck. This includes using
a set of pieces of plywood for placement under tires that were not being weighed, referred
to as blanks. During the weighing process, the research team measured an SU5 ready mix
truck both empty and loaded using two HAENNI WL-101 portable weight scales, identical
to the ones used by TxDPS, as well as using plywood blanks. The team learned that the
measured weights varied from one side of the truck to the other due to the positions of the
fins (flights) inside the ready mix drum. This was noticed in both the loaded and unloaded
conditions but raises the potential for perceived weight violations when the truck is loaded.
During the measurement process, the mixing drum was stationary, as the research team

47
was allowed to measure a truck with a ‘calibration mix’ inside, i.e. a mixture of aggregate,
sand, and water – no cement. Also, when the booster axle was lowered onto the ground and
adjusted to an axle load of 12,000 lbs, the weight on the steering axle and the pusher lift
axle increased, and weight was taken off the fixed tandem axle. This illustrates an
important point about the usage of lift axles – their use can redistribute load along the truck,
in ways that may not be readily apparent or intuitive.
3.4 SHVS IN TEXAS – UT-CTR STATISTICS
Based on data collected by UT-CTR in Texas, the most common SHV operational
types are dump trucks, ready mix trucks, and refuse trucks. It was also found that the
building materials industry also operates SHV flatbed trucks that have a small crane or
knuckle boom to load or unload shingles, lumber or other materials, such as the one shown
below in Figure 3-18.
Figure 3-18. 4-Axle Flat Bed Truck with Knuckle Boom Pallet Fork Lift [1S-1L-2] (CTR, 2017)

48
However, at this time, building materials trucks represent a small fraction of all
SHVs observed in Texas. This observation was determined from truck count data in the
cities of Austin, San Marcos, Waco, Wichita Falls, Houston and San Antonio, and on roads
connecting these cities (referred to as ‘route data’). In addition, truck route data was
obtained from TxDOT video traffic data collection sites at locations in various regions of
Texas. Route truck traffic data were collected during trips within cities and between cities
by creating a voice recording identifying types and configurations of all trucks observed
moving along the route. Truck type was described such as 5-axle flatbed loaded with
building materials, SU5 dump truck with 2 pusher axles in the up position, 6-axle unit with
3-axle tractor and twin 28-1/2’ trailers (double bottom unit) FedEx Truck. When possible,
the name of the company operating the truck was recorded for later reference. This data
collection process helped ensure that no trucks were double-counted, since it was infeasible
that the same truck would pass by the observer a second time during recording. These data
were later transcribed to a spreadsheet and to a central database. In this way, a total of
53,519 trucks were counted, which included 5,693 single-unit trucks and 968 SHVs (1.8%
of all trucks and 17% of single-unit trucks). Additional truck operation type data were
collected along a single route in Austin and Cedar Park, Texas, which included FM-1431
from Anderson Mill Rd. to IH-35, then Southbound to FM-973 and the reverse route from
FM 973 to FM 1431 at Anderson Mill Road. During each data collection trip, truck data
were collected in both directions though a greater number of trucks were observed in the
opposite direction of travel. This was due to the fact that trucks moving in the same
direction as the observer were moving at the same speed and thus were overtaken
infrequently. However, trucks passing by in the opposing lane were effectively moving at
the combined speed of the truck and the observer vehicle. Data collection was performed
on different days of the week and at different times of the day based on the Nielson Audio

49
day parts definitions of Overnight (12 AM – 6AM), Morning (6AM – 10AM), Midday
(10AM – 3PM), Afternoon (3PM – 7PM) and Evening (7PM to midnight). In this way,
data for an additional 20,924 trucks were collected, including 8,906 single-unit trucks and
2,406 SHVs (11.5% of all trucks and 27% of single-unit trucks). The author is aware that
trucks, including SHVs, could potentially be double counted using this method; however,
the information provided a means for determining the number of SHV truck trips along a
route that included two quarries, a concrete casting yard, two ready mix plants and two
large landfills. Thus, this information helped the author understand SHV operations within
a city along a route expected to have high numbers of SHVs due to the industries located
along the route.
In addition to the route and repeat trip data collection counts, a team of researchers,
including the author, collected fixed-site truck count data at quarries, ready mix plants, hot
mix plants, landfills and other locations expected to be serviced by SHVs. From this
method of data collection, a total of 58 company sites were visited across Texas, and a total
of 3,367 trucks were counted, which included 598 SHVs (17.8% of all trucks). The
researchers worked to reduce the possibility of double counting by keeping track of the
registered TxDMV / USDOT number printed on the side of the truck, but this was not
always feasible, especially when many trucks entered / left the facility within a short period
of time. Thus, when the same truck was seen a second time, it was not counted in the total
truck count for that location. Using this method, the data collection time period at a site
was fixed at 2 hours, since repeat trips by the same trucks increased at and beyond 2 hours.
Based on field data collection, industries that operate relatively few SHVs in Texas
include truck mounted cranes, petroleum industry, agricultural and farming industry, and
fuel tankers. The authors of the UT-CTR study had previously expected that the petroleum
50
industry would operate a larger number of SHVs as winch trucks, saltwater vacuum trucks,
oil field work over rigs and other specialized units. However, relatively few of these trucks
were observed to be SHVs. Oil well fracturing (fracking) operations in the various Texas
shale plays were diminished during the course of the study which may have affected the
number of oil field trucks including SHV oil field equipment that was observed.
Truck registration data from the Texas Department of Motor Vehicles – Vehicle
Titles and Registration Section were analyzed to determine the counties in Texas with the
highest number of registered dump, ready mix, and refuse trucks. These were determined
to be Bell, Bexar, Brazoria, Collin, Comal, Dallas, Denton, Ector, El Paso, Fort Bend,
Harris, Hidalgo, Lubbock, McLennan, Montgomery, Nueces, Potter, Tarrant, Travis, and
Williamson counties. ArcGIS was used to visualize the counties with highest number of
registered dump, ready mix, and refuse truck registrations with the TxDOT district
boundaries in the state. The map, shown in Figure 3-19, also shows the location of three
types of data collected.

51
Figure 3-19. Texas map with dump / ready mix / refuse truck registrations over TxDOT District boundaries
One determination from the map is that there appears to be a similarity between
metropolitan and urban boundaries, and the counties with the greatest number of industries
that use SHVs. This is consistent with the fact that garbage trucks, dump trucks and ready
mix trucks tend to operate within a maximum radius from the material plant (dump, ready
mix) or landfill (garbage) to minimize travel times / distances. In addition, as previously
mentioned, ready mix is considered a perishable product which must be delivered to the
job site within a fixed time limit – usually 60 to 90 minutes – to ensure the mix is

52
acceptable. Thus, ready mix truck operators tend to consider travel time, rather than travel
distance when planning delivery routes.
The truck operation type field data and the TxDMV registration data also provided
the means for calculating the estimated number of each configuration type for dump, ready
mix, refuse, building materials and other type trucks. It should be noted that in Texas, truck
registration data do not include the number of truck axles or types of axles. Thus, a
registered dump truck might be a tractor-dump trailer, a three-axle single-unit dump or a
type of SHV.
The truck sample sizes were sufficient for dump, ready mix, refuse, fuel tanker and
flatbed trucks to estimate the number of five-axle combination units, three-axle single-unit
and SHV configurations for these truck types with a 95% Confidence Level +/- varying
percentages of margin of error (2% for dump trucks, 4% for ready mix trucks, and 3% for
refuse trucks.
Table 3-4 shows the number of registered trucks, observed trucks and estimated
number of truck types based on statistical sampling methods. This table was created
utilizing data types 3 and 4 mentioned previously in this Thesis, i.e. Route Data and Video
Data. For clarity, the SU3 configuration shown in the following tables describe a 3-axle
truck with one lift axle between a steering axle and a rear fixed axle.

53
Table 3-4. Estimated numbers of trucks by truck type and configuration
Truck Type
Statewide Total
Number
Percentage Observed Statewide Number of Trucks - Estimated
SU3 SU4 SU5 SU6 SU7 Non-SHV SU3 SU4 SU5 SU6 SU7 Non-SHV
Dump Truck 71,172 0.1 10.4 3.5 2.6 2.5 80.9 37 7,425 2,475 1,875 1,800 57,560
Garbage / Recycle 9,275 1.6 12.2 1.4 - - 84.8 151 1,129 132 - - 7,864
Ready Mix 9,155 - 7.7 5.0 6.6 - 80.7 - 702 460 605 - 7,387 Agriculture 7,284 - - - - - 100.0 - - - - - 7,284
Other 8,907 - 12.9 0.4 - - 86.7 - 1,151 38 - - 7,718 Total 105,793 0.3 10.7 2.9 2.3 1.5 82.4 108 4,093 1,133 904 578 87,813

54
3.5 SHVS IN TEXAS – SALES DATA STATISTICS
To better understand the variations in axle configurations seen in practice, the
author analyzed ready mix truck sales data from seven popular truck resale websites,
focusing on the ten states for this Thesis. In addition, this data was compared with sales
data collected during the UT-CTR SHV analysis project (Walton et. al, 2017). The
following table summarizes the sales data analyzed, with the Texas component being from
the previously conducted study. Due to a lack of data from Michigan, that state has been
excluded from the distributional analysis.
Table 3-5. Ready mix truck sales data summary
State # of Trucks
# of SHVs
% of SHVs
California 201 147 72 Florida 276 42 14 Georgia 210 21 9 Illinois 42 24 57
North Carolina 177 114 63 New York 102 33 32
Ohio 150 72 46 Pennsylvania 96 84 88
Texas 1452 486 25 Michigan 6 6 100
Of the 2,992 ready mix truck sales records analyzed, 952 of them were varying
types of SHVs, leading to an overall proportion of SHVs of 32%, with certain states having
a higher proportion of SHVs in the sales data than other states. Also, it should be noted that
this method of data collection does allow the possibility of repeat counts, since a truck
could be registered for sale on multiple online sales portals.
To test the robustness of this SHV proportion statistic, the bootstrap method of
statistical sampling was used. In short, the bootstrap method provides a stronger indication

55
of central tendency by taking multiple samples from a sample of data, calculating a statistic,
and then determining the overall averages of the statistic over all of the different sample
runs. In the example of an arithmetic mean being calculated for a sample of data, the mean
for the one sample may be skewed one way or another. However, the bootstrap method is
used to produce multiple samples, sometimes hundreds of thousands of samples from that
sample, computing the average of each of the samples, and then taking an average of all of
the sample means. This procedure has been statistically proven to provide a better estimate
of the true statistic.
Using the bootstrap method on the sales data and calculating the statistic of SHV
proportion, after taking 10,000 samples of sample size 10,000 each, the average of SHV
proportions was calculated to be 39.8%. In the overall bootstrapped data, the distribution
of configurations was as shown in Table 3-6 and Figure 3-20.
Table 3-6. Proportion of SHV configurations in sales data
Configuration SHV Proportion (%)
1S-1 No 1.6 1S-2 No 58.6
1S-1L-2 SU4 7.3 1S-2-1B SU4 22.9 1S-2-1L SU4 3.6 1S-2L-2 SU5 0.3
1S-1L-2-1B SU5 4.2 1S-1L-2-1L SU5 0.3 1S-2L-2-1B SU6 0.5
1S-1L-2-1L-1B SU6 0.5 1S-2L-2-1L-1B SU7 0.1

56
Figure 3-20. Proportion of SHV configurations in sales data
As the table and figure show, the largest proportion of ready mix trucks in the sales
data were of the 3-axle configuration 1S-2 (59% of all trucks and over 97% of non-SHVs).
The largest SHV configuration was the 4-axle booster configuration 1S-2-1B (23% of all
trucks and 58% of SHVs), followed by the 4-axle pusher configuration 1S-1L-2 (7% of all
trucks and 18% of SHVs).
The next chapter presents a discussion of analyses on lift axle regulations in states
across the United States and analyzes an NCHRP survey that discusses, among other
things, lift axle regulations in the US.
1S-11.6%
1S-258.6%
1S-1L-27.3%
1S-2-1B22.9%
1S-2-1L3.6%
1S-2L-20.3%
1S-1L-2-1B4.2%
1S-1L-2-1L0.3%
1S-2L-2-1B0.5%
1S-1L-2-1L-1B0.5% 1S-2L-2-1L-1B
0.1%
Proportion of Configurations in Sales Data
1S-1 1S-2 1S-1L-2 1S-2-1B 1S-2-1L 1S-2L-2
1S-1L-2-1B 1S-1L-2-1L 1S-2L-2-1B 1S-1L-2-1L-1B 1S-2L-2-1L-1B

57
Chapter 4: Regulation Analysis
In this chapter, a discussion of the federal laws governing lift axle usage will be
presented followed by a comparison of Administrative or Transportation codes from Texas
and its peer states regarding SHVs and lift axles.
4.1 FEDERAL AND TEXAS LIFT AXLE REGULATIONS
The Federal Bridge Formula (FBF) was enacted by Congress in 1974 to protect
bridges from excessive loads by restricting the weight of a vehicle based on its axle
configuration (number of axles and axle spacing) and ensuring a minimum distance
between the outer most axles. The distance between the outer most axles, or the ‘outer
bridge length’ is checked in addition to the various inner bridge length requirements to
ensure every axle group complies with the bridge formula. All commercial vehicles,
including SHVs, are subject to the formula when driving on a federal interstate highway.
The formula is:
𝑊𝑊 = 500 [(𝐿𝐿𝑁𝑁𝑁𝑁 − 1
) + 12𝑁𝑁 + 36]
where:
“𝑊𝑊” is maximum allowed overall gross weight on the axle group;
“𝐿𝐿” is distance in feet between the axles of the group that are the farthest apart; and
“𝑁𝑁” is number of axles in the group
This formula applies only to trucks traveling on federal highways (interstate
commerce) or on state highways where the state has fully adopted the Federal Bridge
Formula for its state and local roads and does not distinguish between type of truck. In
addition to the FBF, federal law mandates that single axles be limited to carrying a

58
maximum weight of 20,000 pounds, and axles closer than 96 inches apart (considered
tandem axles) are limited to 34,000 pounds. In addition, two consecutive tandem axle
groups spaced 34’ apart are limited to 68,000 lbs. GVW, the total weight of the vehicle, is
limited to 80,000 pounds (23 U.S.C. § 127). Special permits for non-divisible loads or for
states that have adopted higher weight limits for sealed ocean containers can allow for the
carrying of more weight. However, this is not applicable for SHVs.
In Texas commercial vehicle operators must also adhere to the manufacturer’s
maximum tire load rating during operations. Many commercial tires have two applicable
maximum weight ratings, a rating when used as a single tire or when used as one tire in a
dual tire assembly. When used in a dual tire assembly, allowable tire loads are less than the
maximum load when operated as a single tire. The reason for this difference is to provide
a factor of safety in the event one of the dual tires has a blowout. In that case, the remaining
inflated tire will be carrying approximately one half of the total axle load.
In addition to the FBF, individual state laws also apply which can vary significantly
from state to state for different types of trucks or trucks transporting specific types of cargo.
For example, some states adopt the FBF for use on their own state highways, some adopt
the FBF with modifications, while some have unique formulae for use. The following table
shows how Texas and its peer states adopt the FBF ("Federal Bridge Laws / Vehicle Weight
Laws", n.d.; USDOT, 2015).

59
Table 4-1. State Adoption of Federal Bridge Formula
State Federal Bridge
Formula? Details Source
California Own Formula
There's no actual formula declared in California's statutes, but tables provided don't match Federal Bridge Formula. Also, a
straight truck doesn't gain any additional weight allowance by adding any axles to the truck beyond the 4th axle.
Cal. Vehicle Code
§§35001, 35550, 35780
et seq.
Florida FBF with modifications
Non-Interstate travel is governed by the state outer bridge formula. State law allows up to 40,000 lbs. on a tandem axle.
State law includes a 10 percent weight allowance for axle weight limits. Special exemption for dump trucks that allows a 4-axle
dump truck to carry 70,000, which is the maximum GVW under the exemption. Ready mix trucks are exempted from meeting
state axle spacing requirements.
Fla. Stat. Ann. §316- 500
through §316-565 et seq.
Georgia FBF with modifications
Adopted the FBF as its State bridge formula, but several provisions in state law allow exceeding of federal limits. Allows 20,340 lbs. on a single axle. Allows 40,680 lbs. on a tandem axle on non-Interstate highways. Allows 61,020 lbs. for a tridem axle on non-Interstate highways. Essentially, the FBF only applies to federal roads, and when the truck weighs between 73,280 and
80,000 lbs. Grandfathered laws allow for four-axle trucks to carry 70,000 lbs, regardless of axle spacing.
Ga. Code Ann. §§32- 6-20 et
seq.
Illinois FBF with modifications
Illinois uses a State Bridge Formula, which is adopted from the FBF, with some exceptions. Straight trucks are limited to 4 axles on the truck (any additional axles don't increase the allowable weight). Combination vehicles (trailers / pups / transfers) are
allowed up to 6 axles. Illinois State statute allows for several axle and GVW exemptions for various types of vehicles. Vehicles
registered as Special Haul Vehicles (SHV) have various axle and bridge formula exemptions except when using the National
System of Interstate and Defense Highways.
Ill. Rev. Stat. ch. 625,
§§5/15-101 et seq.
Michigan FBF with modifications
Michigan has adopted the FBF state-wide, but also allows older grandfathered state law limits for trucks exceeding 80,000 lbs
gross weight. Michigan has a grandfather provision under Federal law (23 CFR Part 658, Appendix C) to allow vehicles to operate up to 164,000 lbs. Michigan State statute allows for
several axle and GVW exemptions for various types of vehicles and commodities.
Mich. Comp. Laws Ann.
§257.722 et seq.

60
Table 4-1. (Continued)
State Federal Bridge
Formula? Details Source
New York FBF with modifications
New York's state weight laws combine the FBF with a separate state formula: If the vehicle weighs less than 71,000 lbs, the
formula W = 34,000 + (L * 1000) can be used if it allows greater GVW than the FBF. New York has a grandfather provision under Federal law (23 CFR Part 658, Appendix C) to allow vehicles to operate up to 143,000 lbs. New York allows 22,400 lbs. on a
single axle in regular operation. New York allows 36,000 lbs. on a tandem axle in regular operation. New York State statute allows
for several axle and GVW exemptions for various types of vehicles and commodities.
N.Y. Vehicle and Traffic Laws §385
and §386 et seq.
North Carolina
FBF with modifications
North Carolina's bridge table is based on the FBF, although the formula itself is not stated in the statutes. North Carolina differs
from the federal weight law in that 38,000 lbs is allowed on tandem axles. North Carolina allows 38,000 lbs. on a tandem axle
in regular operations. A 10 percent tolerance to State limits is permitted; however, the tolerance does not apply to single axle,
tandem axle, or GVW limits. North Carolina allows a variety of commodity-specific weight exemptions.
N.C. Gen. Stat. §§20-115 et
seq.
Ohio FBF with modifications
Ohio has adopted the FBF state-wide, with some modifications. Ohio State statute allows for 7.5 percent tolerances above State axle weight and / or GVW limits for various commodities. Ohio State statute allows for several axle and GVW exemptions for
various types of vehicles. For travel on non-Interstate highways, State law contains limits for single, tandem, and tridem axles in
combination with base weights, with weight increases being based on spacing.
Ohio Rev. Code Ann.
§§5577.01 et seq.
Pennsylvania FBF with modifications
The gross weight of vehicles in regular operations (operating without a special permit) is governed by the State gross weight
limits, the State axle weight limits, and the State bridge formula, which is adopted from the FBF. Regular operations limit vehicles to 22,400 lbs. for a single axle and up to 38,000 lbs. for a tandem axle. Pennsylvania State statute allows for several axle and GVW
exemptions for various types of vehicles and commodities.
Pa. Cons. Stat. Ann. tit. 75,
§§4901 et seq.

61
Table 4-1. (Continued)
State Federal Bridge
Formula? Details Source
Texas FBF with modifications
Texas has adopted the FBF state-wide, with some modifications. Texas has several commodity-specific weight exemptions that apply to axle weights and GVW. Texas State statute exempts various types of vehicles from State weight limits. Ready mix
trucks are allowed 23,000 lbs. on a single axle and 46,000 lbs. on a tandem axle on non-Interstate public highways. Vehicles may
exceed these axle weights by 10 percent if the GVW is below 69,000 lbs. and the vehicle obtained a permit.
Tex. Transportation
Code Ann. §621.001 through
§623.343 et seq.
Texas is one of the states that adopts the FBF limits for all state-maintained roads
(Luskin, Harrison, Walton, Zhang & Jamieson, 2000), with some alterations due to
grandfathered old weight limits, such as a pre-existing law that allows higher loads for 4
axle trucks with specified outer bridge lengths. Furthermore, weight restrictions are placed
on certain portions of the roadway and bridge network, based on load zone studies which
determine the maximum allowable load due to inadequate structural strength, or in the case
of bridges, structural deficiencies. Load zoned roads or bridges are clearly signed
indicating the load limits. By the authority of the executive director of the Texas
Department of Transportation, roads may be set for different maximum weight allowances
if “heavier maximum weight would rapidly deteriorate or destroy the road or a bridge or
culvert along the road” (Texas Transportation Code § 621.102). As an example, in Texas,
the majority of Farm-to-Market (FM) road mileage was designed and constructed during
the 1940s and 1950s for a maximum allowable GVW of up to 58,420 lbs for a 3-axle truck.
The 58,420 lbs GVW load limit was originally set in 1950 based on calculations using the
1946 AASHO bridge formula. While some of these FM roads have been upgraded, 40%
of the 41,000 centerline miles of FM roads in Texas still have a load limit restriction of

62
58,420 lbs. (Luskin, Harrison, Walton, Zhang & Jamieson, 2000). The 58,420 lb GVW
load limit was applied to a significant portion of FM roads in Texas when the Federal
Government announced that the national GVW load limit would be increased to 73,280 lbs
in conjunction with the 1956 Interstate Highway Bill. To protect the significant investment
that Texas had made in paving thousands of miles of FM roads, they were load zoned
through a single Commission Minute Order.
Texas Transportation Code, Sec. 621.101 puts forth the legal weight limits for
Texas, which are the same as federal regulations. However, weight or dimension
exemptions exist for trucks of particular industries. For example, Texas Transportation
Code, Sec. 622.012 states that a ready mix concrete truck may be operated on a public
highway of the state if the tandem axle weight is not heavier than 46,000 pounds and the
single axle weight is not heavier than 23,000 pounds. This results in a higher GVW
(69,000) than would be allowed by federal law. However, trucks operating at these higher
weights are not permitted on the interstate highway system if the load is divisible.
In Texas, the maximum legal weight allowed on a group of two or more axles
depends on the number and spacing of the axles in the axle group and is determined by
using the FBF and rounding the result to the nearest 500 lbs. These laws govern the SHV
configurations and axle weight limits that operate in Texas.
4.2 LIFT AXLE LAWS OUTSIDE OF TEXAS
State policies regarding SHVs and lift axles vary from state to state. Two basic
types of laws regulate lift axles: laws regarding equipment used to lift (what equipment, its
placement, and other such considerations) and laws regarding configurations / weight
carried.

63
Laws regulating lift axles were examined from different states and analyzing a
comprehensive study on lift axles conducted by the Transportation Research Board’s
National Cooperative Highway Research Program (NCHRP).
This Thesis focuses on Texas and nine peer states identified by the 2030
Committee, a committee formed in 2008 at the request of the Texas governor tasked with
providing an independent, authoritative assessment of the state's transportation
infrastructure and mobility needs from 2009 to 2030. (Texas 2030 Committee, 2011). The
peer states identified by the 2030 Committee includes: California, Florida, Georgia,
Illinois, Michigan, New York, North Carolina, Ohio, and Pennsylvania. These states were
chosen because of their similarities to Texas in terms of population, development,
economic activity, and other key demographics.
Regarding lift axles in the US, there is a lack of uniformity regarding state truck
weight laws, state statutes that allow higher load limits for trucks of a certain type or that
carry a certain commodity; either year-round or seasonally, truck configuration and lift
axle terminology. In terms of trucking jargon, it is recommended that standardized
terminology be developed to reduce confusion. The method used to denote SHV
configurations in this Thesis has been effective in describing SHVs during research and
interviews with representatives of the trucking industry, and are proposed as a potential
standard. The author suggests that slang terms such as cheater, dead, or dummy axles are
not used, since these terms have an inherent negative connotation attached.
4.3 TEXAS AND PEER STATE LAW REVIEW
State laws were examined for each of the ten states by reading state laws
(administrative codes), looking for mentions of lift axles, with a focus on laws regarding
the ready mix industry. Relevant information was generally found in each state’s Vehicle

64
Code, which is part of the larger set of statutes of the state. All were available online, with
citations provided in the table. Beyond the Vehicle Code, documents from the state’s
department of transportation, especially the Vehicle Permitting offices, and the Highway
Patrol’s Commercial Vehicle Enforcement offices were researched, to find policies more
specific than the Vehicle Code. The following tables compare Texas laws to those of the
selected peer states. Note that this table does not express laws specifically pertaining to the
ready mix industry.
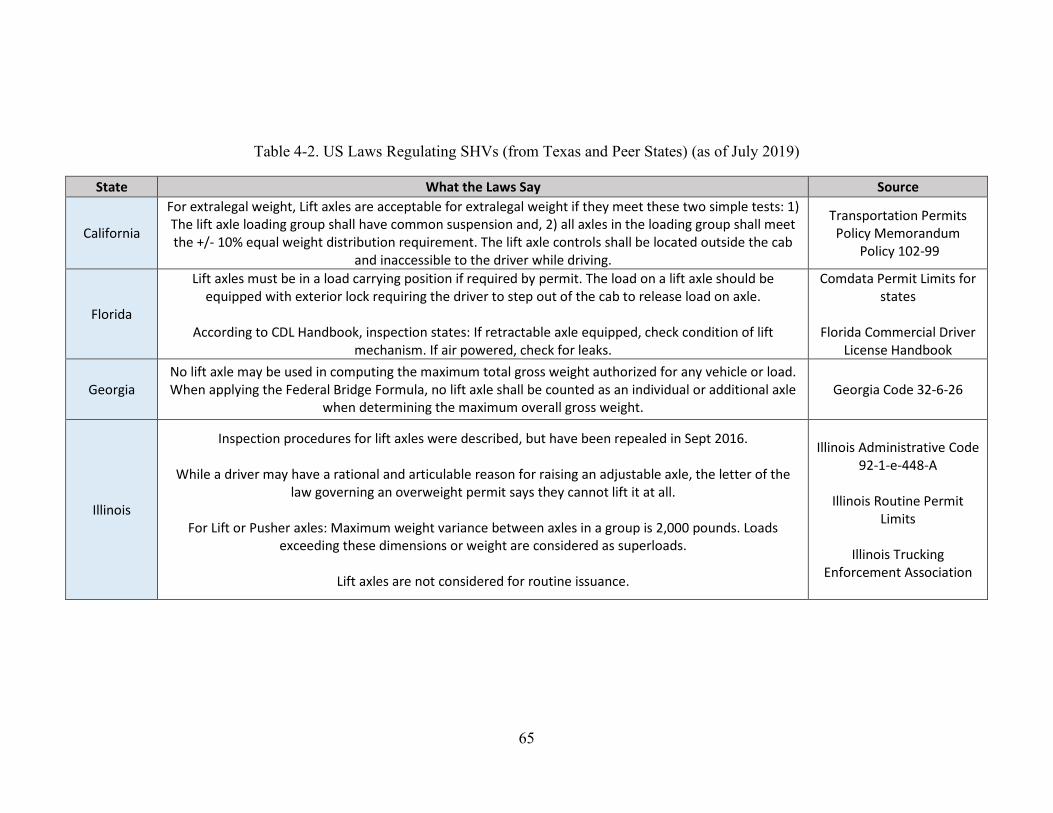
65
Table 4-2. US Laws Regulating SHVs (from Texas and Peer States) (as of July 2019)
State What the Laws Say Source
California
For extralegal weight, Lift axles are acceptable for extralegal weight if they meet these two simple tests: 1) The lift axle loading group shall have common suspension and, 2) all axles in the loading group shall meet the +/- 10% equal weight distribution requirement. The lift axle controls shall be located outside the cab
and inaccessible to the driver while driving.
Transportation Permits Policy Memorandum
Policy 102-99
Florida
Lift axles must be in a load carrying position if required by permit. The load on a lift axle should be equipped with exterior lock requiring the driver to step out of the cab to release load on axle.
According to CDL Handbook, inspection states: If retractable axle equipped, check condition of lift
mechanism. If air powered, check for leaks.
Comdata Permit Limits for states
Florida Commercial Driver
License Handbook
Georgia No lift axle may be used in computing the maximum total gross weight authorized for any vehicle or load. When applying the Federal Bridge Formula, no lift axle shall be counted as an individual or additional axle
when determining the maximum overall gross weight. Georgia Code 32-6-26
Illinois
Inspection procedures for lift axles were described, but have been repealed in Sept 2016.
While a driver may have a rational and articulable reason for raising an adjustable axle, the letter of the law governing an overweight permit says they cannot lift it at all.
For Lift or Pusher axles: Maximum weight variance between axles in a group is 2,000 pounds. Loads
exceeding these dimensions or weight are considered as superloads.
Lift axles are not considered for routine issuance.
Illinois Administrative Code 92-1-e-448-A
Illinois Routine Permit
Limits
Illinois Trucking Enforcement Association

66
Table 4-2. (Continued)
State What the Laws Say Source
Michigan
Michigan’s OW laws are all related to individual axle loading, not GVW. Laws “imply” that lift axles are mainly to be used to negotiate turns / intersections. Axle loadings for OW determinations shall only be
done with lift axles lowered.
For routine permits, lift axles must be full weight bearing axles.
For special permits, vehicles must have air or lift axles on the ground at all times for which the permit is issued.
Michigan Compiled Laws 257.724a
MDOT Special Provisions,
Conditions and Restrictions Governing Special
Transportation in Building Moving Permits on the
State Trunk Lines
New York
Lift axles must be steerable and trackable. Any air pressure controls must be located outside of the cab, beyond the reach of occupants of the cab while vehicle is in motion. All axles other than liftable axles must
have two tires on each side.
For routine issue permits, lift axles must be a full weight bearing axle. Must be down and locked at all times.
From Jan 1, 2020, vehicles with model years 2005 and older operating under Divisible Load overweight permits shall have steerable / trackable lift axles, have air pressure controls outside of the cab, and the
weight on any grouping of two or more axles has to be distributed such that no axle in the grouping carries less than 80% of any other axle in the grouping.
New York Codes, Rules, and Regulations. 154-2.4
New York State DOT
Central Permit Office: DLN 14-01 and DLN 13-02
North Carolina
No information specific to liftable axle SHVs but delineates permits for irregular weight / size vehicles. In permits, lift axles are considered as a legal axle, and must be a full weight bearing axle.
North Carolina Statutes. 20-119

67
Table 4-2. (Continued)
State What the Laws Say Source
Ohio
For determination of legal axle, axle group, and gross weights: lift axles must be load-bearing axles and weights cannot exceed the tire or axle load limit.
When operating with a Special Hauling Permit: all load bearing axles and axle groups must be designed to equalize load over all axles of the group 16’0” or less. Variable load suspension axles or groups of axles not having the same suspension type are not recognized in overweight permit allowances. However, an airlift
axle may be utilized and recognized if it is part of an air-ride suspension system and operates off of an equalizing valve common to all axles in the group, 16’ 0” or less. The lift axle controlling mechanism must
be located outside the cab of the truck and mounted out of the driver’s reach during normal vehicle operation.
In cases of carrying Superload: The Department recognizes that the use of lift axles is necessary for
overweight Superload weight distribution and these axles must be lifted during some turning maneuvers. When such axles are in use and listed as load bearing axles on an overweight superload SHP, they shall
remain in the fully lowered position except during turning maneuvers where there would be excessive tire and pavement scuffing or control of the vehicle would be hindered. Such axles shall be part of an air ride
suspension group designed to equalize the load over all axles in the group, including the retractable axles.
Ohio Department of TransportationSpecial
Hauling Permit Section - Lift Axle Policy
Pennsylvania
Except when necessary for turning a truck that is operating under normal load conditions, the lift axle shall be in full contact with the highway under full pressure.
Lift axles must be utilized any time one of the other axles would be overweight without the use of the lift
axle, and whenever the vehicle is operating under normal load conditions (more than 2/3 loaded by weight)
2010 Pennsylvania Code 49:4943
PennDOT Trucker's
Handbook
Texas
No information specific to liftable axle SHVs.
A lift axle is considered a legal weight bearing axle as long as it is on the ground and carrying its fair share of the load.
Comdata Permit Limits for states

68
Table 4-3. US Laws Regulating SHVs (from Other States) (as of July 2019)
State What the Laws Say Source
Idaho Any vehicle which is equipped with variable load suspension axles (lift axles) transporting overweight loads shall have all lift axles fully deployed.
Idaho Administrative Code 39-03-13
Kentucky A lift axle that isn't always deployed shall not be used in computing the maximum total gross weight authorized for any vehicle or load.
Kentucky Statute Chapter 177
Louisiana
When “Variable Load Suspension” axles are equipped on a vehicle and are operational, they must provide for reasonable distribution of axle weight. In addition, the regulator that controls the pressure for these axles must be outside the cab. The only control that may be in the cab is that which is necessary to activate the mechanism.
The suspension used by these axles may be either hydraulic, air or a combination thereof.
Louisiana Regulations for Trucks, Vehicles and Loads (DOT)
Maine
For all vehicles manufactured, modified or retrofitted with liftable or variable load suspension axles after October 30, 1991, liftable or variable load suspension axles are permitted only under the following conditions: only one liftable or variable load axle may be present on the truck tractor and only one liftable or variable load
axle may be present on the semitrailer; liftable or variable load axles must be located on the vehicle so that they are legally part of the tandem axle group or tri-axle group as appropriate; and the axle weight rating of liftable or
variable load axles must conform to the expected loading of the suspension and must be 20,000 pounds or more. When operating at a gross vehicle weight exceeding 88,000 pounds, all liftable axles of the vehicle are in full contact with the ground at all times. Axles 2, 5 and 6 of a six-axle singly-unit vehicle may be liftable axles.
Axles 2 and 6 must be self-steering axles of a type that has been approved by the Department of Transportation.
Maine Revised Statutes 29-21-1-2354/2364/2365
Maryland
Maryland currently only has lift axle regulations for four-axle-or-more trucks. Lift axle control shall allow only fully on or fully off. These controls may be in cab of vehicle, but air pressure adjustment control cannot be.
There are specific rules about when the lift axles can be engaged and disengaged (such as when turning sharp curves). Also, weight limits and minimum lift axle loadings are specified, in relation to GVW.
Code of Maryland
11.15.27.05 and 07
Minnesota
A vehicle or combination of vehicles equipped with one or more variable load axles shall have the pressure control preset so that the weight carried on the variable load axle may not be varied by the operator during
transport of any load. The actuating control for the axle shall function only as an on-and-off switch. This doesn't apply to old farm trucks and general rear-loading refuse-compactor vehicles.
Minnesota Statutes 169.828

69
Table 4-3. (Continued)
State What the Laws Say Source
Montana
If a motor vehicle is equipped with a retractable axle that is not fully extended and carrying its proportionate share of the load while the motor vehicle is operated upon the highways of this state, the weight penalties in
subsection (1) apply to all weight over the legal maximum allowed by the fixed axles regardless of whether the axle is extended at the time of weighing. In addition to the penalties in subsection (1), the owner or operator shall be fined $100 for failure to have the retractable axle fully extended while the gross weight of the vehicle
exceeds the legal maximum allowed by the fixed axles.
Montana Code Annotated 61-10-
145
New Hampshire SU4 vehicles shall drive on 2 rear axles, and the tridem may contain no more than one retractable axle.
New Hampshire Revised Statutes Title XXI: Chapter
266
North Dakota
On all motor vehicles manufactured after July 31, 2005, the lock or pressure regulator valve for a lift axle shall be located outside the cab and inaccessible from the driver’s compartment only if there is more than one lift axle.
The control to lift and lower a retractable or variable load suspension axle may be accessible in the driver’s compartment.
North Dakota Highway Patrol Weight / Size
Guide
Oregon
The controls for the lift axle may be mounted inside the cab of the power unit provided that it limits the axle movement to the complete up or complete down position; The control for a variable load, or lift axle, which
allows adjustment to increase or decrease loading on the vehicle must not be accessible from the cab; The lift or variable load axle must be deployed, and distribute the weight of the load, when failure to do so results in any
tire, axle, tandem axle or group of axles exceeding the weight limits allowed; All single axles of triple trailer combinations must have four tires except for the steering axle of the power unit
and lift axles which may have two tires; Raising a lift-axle is not considered a change in configuration (for tax)
Oregon Administrative Rules 734-074-
0010
South Dakota
Unless specifically authorized by permit, a variable load axle may not be raised if, when it is raised, it causes any other axle to be overloaded. The control for adjusting pressure shall be mounted outside of the driver
compartment and shall be preset so the weight carried on the variable load axle may not be varied by anyone in the vehicle. The control for raising and lowering the variable load axle may be accessible to the driver, but it may
not also function as the pressure control device. Permits can be bought that allow lifting of axle when making turns. Lift axles and belly axles are not considered load-carrying axles and will not count when determining the
vehicle’s weight limits.
South Dakota Code SDCL 32-
22-57.1 and South Dakota Motor Carrier
Handbook Chapter 5

70
Table 4-3. (Continued)
State What the Laws Say Source
Utah
Retractable or variable load suspension axles installed after January 1990 shall be self-steering on power units or when augmenting a tridem group on trailers; no axle in a group with a retractable or VLS axle shall exceed legal
or bridge formula weight requirements, or the manufacturer's tire rating; Controls for raising or lowering retractable or VLS axles may be located in the cab of the power unit. The pressure regulator valve shall be
positioned outside of the cab and be inaccessible from the driver's compartment.
Utah Admin Code R909-2
Washington
The axle must be self-steering. The simple "up / down" control may be in the driver's compartment; however, any variable control used to adjust axle loadings, by regulating air pressure or other means, must not be within
reach of the driver's compartment. The self-steering requirement does not apply when: (a) The retractable axle, equipped with four tires, is used for the purpose of weight distribution on a truck or truck-tractor and gives the appearance of, but does not function as, a tandem axle drive configuration. The
distance between the drive axle and the retractable axle must not exceed sixty inches. b) A retractable axle is used adjacent to a fixed axle on a trailing unit and distance between the two axles does not exceed sixty inches.
Washington Administrative Code WAC 468-
38-280
Wisconsin The control valve that regulates the amount of pressure shall be mounted outside of the driver's compartment; The control valve that regulates the movement of the axle or axles so as to raise or lower the axle or axles may
be in the driver's compartment. Lift axle must carry a minimum of 8% of gross load when used.
Wisconsin Administrative
Code. Trans 305.49
Wyoming
If any axle group containing a variable load suspension axle exceeds legal or allowable weight without using the variable load suspension axle, the variable load suspension axle shall be used to the extent that it assumes
sufficient weight to keep the axle group with which it is used within legal weight for a divisible load or permissible weight for a non-divisible load. Lift axle must bear at least 8% weight of axle group. Vehicles
equipped with a functional variable load suspension axle shall be required to put the axle into use if the vehicle is overweight and the use of the axle will reduce the amount of overweight on an axle group, inner bridge, or gross. In certain cases, the use of this type axle may reduce the allowable weights a vehicle may carry. If the
allowable weight is reduced due to decreased bridge between axle groups, the use of the axle is not required.
WYDOT Rules, Motor Carrier
Chapter 5
71
Some items to note in the above table include the following:
• Four states have no specific laws regarding lift axles in their statutes (Illinois, North
Carolina, Ohio, Texas).
• One state effectively ‘bans’ the use of lift axles (Georgia) by disregarding them
when computing maximum loads permitted. Meaning, in Georgia, an SHV with
four lift axles and three fixed axles will have an allowable GVW limited to what
can be carried by the three fixed axles.
• Four states have regulations controlling where the control mechanism must be
placed (California, Florida, New York, Ohio).
• Two states recognize the potential damage that can occur to tires and pavements
during turning movements and allow trucks to lift axles immediately before turning
maneuvers (Michigan, Pennsylvania).
• The author surmises that two significant motivations or influences behind why lift
axles vary from state to state are the needs of the industry. For example, in terms
of introducing new allowed configurations, industry representatives identify a
configuration that they believe would improve their operations. This configuration
is proposed to members of the legislature. Research is conducted to assess the
benefits and costs of such a configuration, and it is brought to a vote. If approved,
the law is implemented. The other direction for the development of statutes may be
from enforcement. In the example of configurations, if law enforcement notices a
problem with any particular configuration, such as an increased rate of crashes, they
can bring that up to legislature in the form of reports.

72
4.4 NCHRP 575
NCHRP 575 was published in 2007 and documented an extensive study to
determine the types of SHVs operating in the US for the development of SHV bridge load
diagrams (Sivakumar, Moses, Fu & Ghosn, 2007). Beyond providing basic information
such as how lift axles function, the report contains a survey summarizing states SHV
regulations. The report states that “criteria for lift-axle design and operation are contained
in AASHTO’s Guide for Maximum Dimensions and Weights of Motor Vehicles and for
the Operation of Non-Divisible Load Oversize and Overweight Vehicles,” and mentions
that several states have adopted the AASHTO guidelines as regulations. These AASHTO
guidelines specify the following criteria for vehicles serving in regular operations
(Sivakumar, Moses, Fu & Ghosn, 2007):
“In computation of gross vehicle or axle weight limits for highway legal vehicles
not requiring oversize / overweight permits, no allowance will be made for any retractable
or variable load suspension (VLS) meeting the following criteria:
• All controls must be located outside of and be inaccessible from the driver’s
compartment.
• The gross axle rating of the VLS devices must conform to the expected
loading of the suspension and shall in no case be less than 9000 pounds.
• Axles of all retractable or VLS devices manufactured or mounted on a
vehicle after January 1, 1990 shall be engineered to be self-steering in a
manner that will guide or direct the VLS mounted wheels through a turning
movement without the tire scrubbing or pavement scuffing.

73
• Tires in use on all such axles shall conform in load capacity with relevant
State regulations or with Federal Motor Vehicle Safety (FMVS).”
(Sivakumar, Moses, Fu & Ghosn, 2007).
The NCHRP report provides the results of a survey on lift axle regulations sent to
the states, as are shown in the table below. A total of 44 states are included in the responses.
Table 4-4. NCHRP 575 Survey Questions about Lift Axle Regulations
Survey Questions on Lift Axles DOT Responses
Yes No Not Sure
Question 4.1 Does your agency permit the use of liftable axles on heavy trucks?
41 3
Question 4.2 Do any of the state legal loads used by your agency represent trucks with liftable axles?
14 28
Question 4.3 Does your agency or state monitor the weight carried by the liftable axles to ensure compliance with state regulations?
21 5 5
Question 4.4 When performing load ratings for trucks with liftable axles, are ratings checked with the axles in the raised position under full load?
3 15
Of the peer states used in the analysis outlined in Chapter 3, eight out of ten
respondents also participated in the NCHRP survey (Michigan and Pennsylvania did not).
All answered ‘yes’ to Question 4.1, three answered ‘yes’ to Question 4.2 (New York, North
Carolina, and Ohio), Texas answered ‘no’ to Question 4.3 while Ohio was ‘unsure’, and
all states except for New York and Illinois said they ‘do not include lift axles in load
ratings’ for Question 4.4.
4.5 COMMERCIAL VEHICLE LAW ENFORCEMENT CONTACT / SURVEY
Beyond differences in regulations, the variation in the practical application of these
regulations is also important. Law enforcement personnel were contacted to gain more
insight into the practical application of these laws.

74
As mentioned, different agencies with knowledge of state regulations regarding lift
axles were contacted in Texas and in peer states. Communications were conducted through
e-mail or phone, and respondents either filled out the online anonymous survey or
answered questions over the phone. Appendix A shows the survey, while Appendix B
shows the contacts made.
Figure 4-1. US map showing the states analyzed for policy research

75
Of these ten states, seven representatives spoke over the phone or identified
themselves in the survey, while three representatives (Florida, Michigan, and New York)
filled out the survey anonymously. The major results of the survey are provided in this
section.
Figure 4-2. Question 1 on policy survey (state compliance with the FBF)
Although all states responded by saying ‘yes’ to whether or not their state complies
with FBF on interstates, a few answers had exceptions. California laws comply with the
FBF up to the fourth axle (no added weight is allowed after fourth axle, without an increase
in length to meet FBF requirements). Florida follows the FBF, but has an exemption for
dump trucks, ready mix trucks, refuse trucks, and oil trucks that exempt these trucks from
meeting state axle spacing requirements. Any of these vehicles are limited to a single axle
limit of 20,000 lbs. and 550 lbs. per inch tire width plus scale tolerances, up to a total gross
vehicle weight of 70,000 lbs. Georgia allows trucks to carry weights in accordance with
old state laws, which allow four-axle trucks to carry 70,000 pounds. Illinois follows the
FBF up to the sixth axle.

76
Figure 4-3. Question 2 on policy survey (state compliance with the FBF on non-
interstates)
Similar to the exceptions in the previous question, some states adopt the FBF, but
with modifications. For example, North Carolina follows the FBF, except its regulations
allow 38,000 pounds on tandem axles (as opposed to 34,000). Michigan, however, has a
unique set of regulations, which are not based on GVWs, but rather on individual axle
weights. The maximum number of axles allowed in Michigan is eleven, while per-axle load
regulations result in a maximum GVW of 164,000 pounds. Straight trucks are limited to
40’ in length, and there are regulations controlling individual axle loadings with regards to
axle spacing (MDOT, 2007).

77
Figure 4-4. Question 4 on lift axle records
The fourth question of the survey asked if states, at any stage of a truck’s operation,
recorded data regarding the presence / usage of lift axles, i.e. during truck registration or
during a weight enforcement stop. No state answered ‘yes’. Texas included, and the
TxDMV interview provided the author with more details. TxDMV employees explained
that, because it was not legally mandated to take axle type into account during registration,
this data was not collected.
Figure 4-5. Question 5 on policy survey (lift axle regulations)

78
The fifth question of the survey asks about any specific lift axle regulation. Three
states answered ‘yes’:
• Georgia – Lift axles are ignored when computing axle allowances (effectively
banning use). Meaning, in Georgia, an SHV could be configured with many lift
axles, but would be limited to carry a GVW calculated based on its fixed axles only.
• Michigan – Lift axles must stay on the ground when truck is loaded, unless turning
maneuver requires them to be raised.
• Pennsylvania – Lift axles must stay on the ground when truck is at least two-thirds
loaded, unless turning maneuver requires them to be raised.
• New York answered ‘unsure’, but a review of the legislation reveals laws regarding
placement of the control mechanism.
Figure 4-6. Question 7 on policy survey (lift axle equipment regulations)
Two states answered ‘yes’:
• New York: Lift axle must be steerable and trackable (similar to AASHTO
guidelines mentioned in NCHRP Report 575).

79
• Ohio: Lift axle must be a load-bearing axle.
Figure 4-7. Question 9 on policy survey (lift axle control regulations)
Georgia and New York have laws requiring the pressure control mechanism to be
placed outside of the driver’s reach when the vehicle is in motion. Texas has no regulations
for controls.
Figure 4-8. Question 11 on policy survey (common lift axle industries)

80
When asked which industries in their state use lift axles, all enforcement
representatives selected an industry that matched with the count data in Texas.
Noteworthy insights gleaned from phone interviews include the following:
• The contact from the California Highway Patrol mentioned that, at a certain
point, it isn’t feasible for trucking companies to add more axles with lift axles,
because “economies of scale” have been reached. He referred to this as the law
of diminishing returns, where trucks’ incremental gain in payload capacity
decreases with each increase in axle numbers, especially without a
corresponding gain in truck length. California is an example since allowable
weight limits do not increase after the fourth axle is added unless the outer
bridge length is increased. This leads to SHVs with fewer axles being popular,
e.g., four-axle configurations such as 1S-1L-2, 1S-2-1L, etc.
This chapter described work this author has done on a related University project, a
synthesis of a 2007 study which included a survey on lift axle regulations, the author's work
in documenting lift axle laws in several US states, and the results of the author's contact
(survey / interview) of law enforcement personnel.
The results of the law analysis previously in this chapter were echoed throughout
the survey / interview results, i.e. contacted states do not record lift axle presence / usage
as part of regular enforcement procedure. There is also great variability in the law
regulating lift axles around the country, with most of the sample set (six) of states having
no specific laws of any kind. Only one state (New York) mandates steerable lift axles, as
recommended by AASHTO in NCHRP Report 575. Further research should be done to
investigate the effect of non-steerable axles on pavement wear and safety. The next chapter

81
describes the results of industry research efforts with regards to lift axles in the ready mix
industry.
A ready mix industry trade association’s surveys of its members are analyzed in the
next chapter. Also, truckers, lift axle manufacturers, and other trucking company
representatives were contacted to gather information about the ready mix industry’s
perspective on lift axles. Truckers were asked to respond to an anonymous survey or
comment anonymously on a trucking forum. The next chapter summarizes these research
efforts, including describing the methodologies and discussing the results.

82
Chapter 5: Interviews and Survey Analyses
Data for this Thesis were gathered by conducting surveys and interviews with
separate groups of people representing the industry. Two main surveys were analyzed in
this chapter: a set of annual surveys administered by an industry trade group, the National
Ready Mix Concrete Association (NRMCA), as well as a survey administered to trucking
company representatives by the author of this Thesis. Appendix C contains the survey sent
to trucking companies based in Texas with questions regarding company operations and
motivations for using SHVs.
Ready Mix companies in Texas and peer states were identified to receive a copy of
the survey. The company names were selected by searching through the database of the
National Ready Mixed Concrete Association’s member directory, as well as the trade
associations for the concrete industry within each state. Representatives from these
associations were also contacted and asked to share the anonymous survey link with their
members.
In addition, five international online forums were used to ask ready mix truckers all
over the world to respond to the survey. The post made on the forums is in Appendix D.
Survey taker’s names were kept confidential (unless waived) and. as such, the
results of the survey / interviews do not include the names of the respondents or their
company affiliations. The author determined that the option to remain anonymous would
result in respondents being more comfortable with completing the survey.
Once these contacts were made, the results of the survey were analyzed; notable
responses are presented in this Thesis. It should be noted that this interview / survey
methodology for the industry analysis did gather results that are statistically significant.

83
Based on the total number of ready mix companies – 2,103 as of 2019 ("Ready-Mix
Concrete Manufacturing in the US", 2019) - the author determined that a sample of 239 or
more unique company responses was required for significant results for a 90% confidence
interval with a 5% margin of error. The results shown are from the analysis of 249
responses. However, the methodology behind the survey, to be explained later in this
Thesis, did account for the possibility of multiple surveys from the same company.
The survey was developed considering survey questions from the 0-6897 SHV
study conducted by UT-CTR. The survey begins with questions about the company’s truck
fleet (how many ready mix trucks, how many SHVs). For respondents with zero SHVs, the
survey asks questions to understand company motivations for not operating SHVs and
plans, if any, to operate SHVs in the future. For companies that operate SHVs, SHV truck
trends were determined to predict whether SHV numbers will be increasing or decreasing
in the future. Company representatives were asked to discuss their company’s motivation
for operating lift axles. The survey also asks all respondents about SHV safety, as well as
geographical information, to gain an understanding of possibly varying views regarding
SHVs in different parts of the country. The following sections present the results of the
NRMCA survey followed by the survey conducted for this study.
5.1 NRMCA SURVEY ANALYSIS
The NRMCA distributes several different types of surveys to its members each
year. One of these surveys is the Fleet Benchmarking and Costs Survey, which is
distributed to concrete producers to obtain information about ready mix concrete truck fleet
maintenance and utilization. The survey was developed, and responses analyzed by the
NRMCA Operations, Environmental, and Safety Committee. The author combined the
results from eleven past, annual survey reports and analyzed the data to learn about lift axle
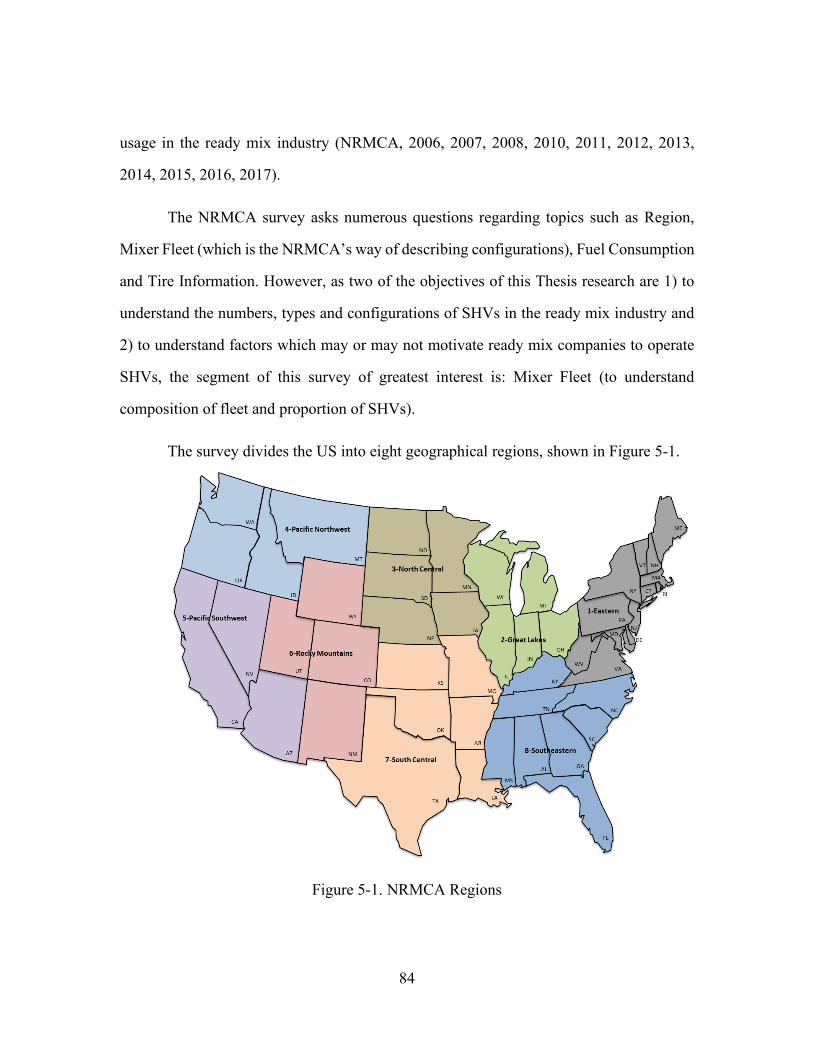
84
usage in the ready mix industry (NRMCA, 2006, 2007, 2008, 2010, 2011, 2012, 2013,
2014, 2015, 2016, 2017).
The NRMCA survey asks numerous questions regarding topics such as Region,
Mixer Fleet (which is the NRMCA’s way of describing configurations), Fuel Consumption
and Tire Information. However, as two of the objectives of this Thesis research are 1) to
understand the numbers, types and configurations of SHVs in the ready mix industry and
2) to understand factors which may or may not motivate ready mix companies to operate
SHVs, the segment of this survey of greatest interest is: Mixer Fleet (to understand
composition of fleet and proportion of SHVs).
The survey divides the US into eight geographical regions, shown in Figure 5-1.
Figure 5-1. NRMCA Regions
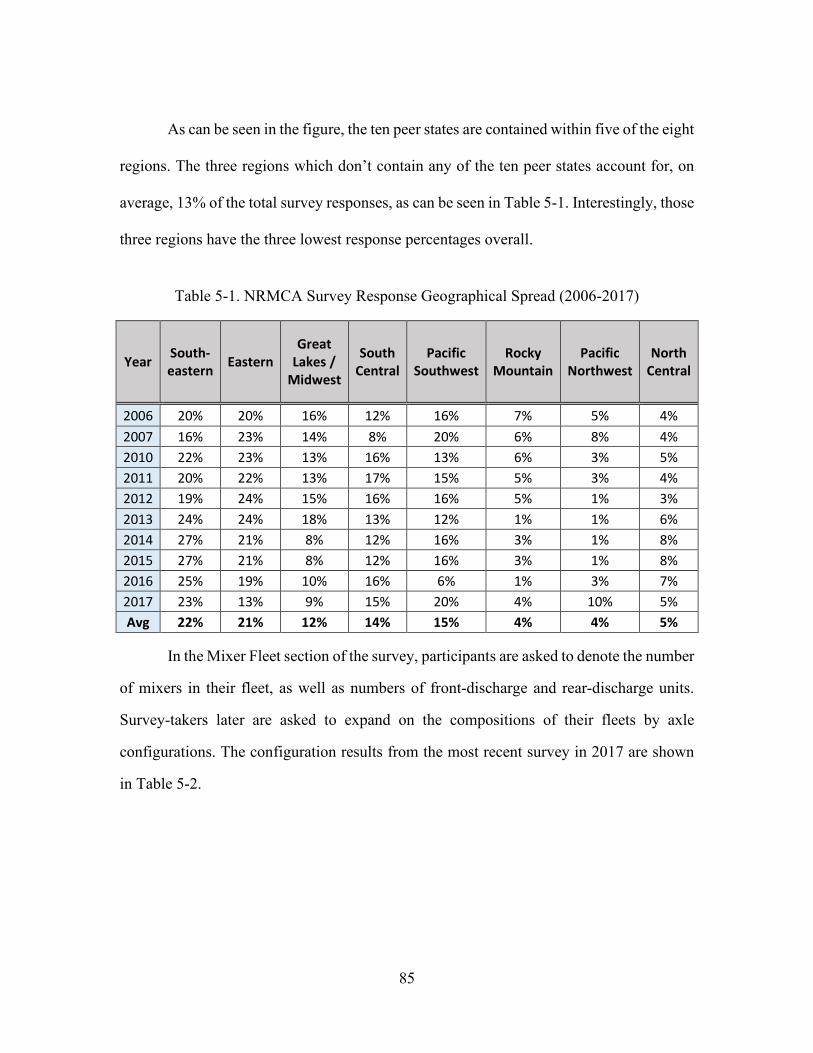
85
As can be seen in the figure, the ten peer states are contained within five of the eight
regions. The three regions which don’t contain any of the ten peer states account for, on
average, 13% of the total survey responses, as can be seen in Table 5-1. Interestingly, those
three regions have the three lowest response percentages overall.
Table 5-1. NRMCA Survey Response Geographical Spread (2006-2017)
Year South-eastern Eastern
Great Lakes /
Midwest
South Central
Pacific Southwest
Rocky Mountain
Pacific Northwest
North Central
2006 20% 20% 16% 12% 16% 7% 5% 4% 2007 16% 23% 14% 8% 20% 6% 8% 4% 2010 22% 23% 13% 16% 13% 6% 3% 5% 2011 20% 22% 13% 17% 15% 5% 3% 4% 2012 19% 24% 15% 16% 16% 5% 1% 3% 2013 24% 24% 18% 13% 12% 1% 1% 6% 2014 27% 21% 8% 12% 16% 3% 1% 8% 2015 27% 21% 8% 12% 16% 3% 1% 8% 2016 25% 19% 10% 16% 6% 1% 3% 7% 2017 23% 13% 9% 15% 20% 4% 10% 5% Avg 22% 21% 12% 14% 15% 4% 4% 5%
In the Mixer Fleet section of the survey, participants are asked to denote the number
of mixers in their fleet, as well as numbers of front-discharge and rear-discharge units.
Survey-takers later are asked to expand on the compositions of their fleets by axle
configurations. The configuration results from the most recent survey in 2017 are shown
in Table 5-2.
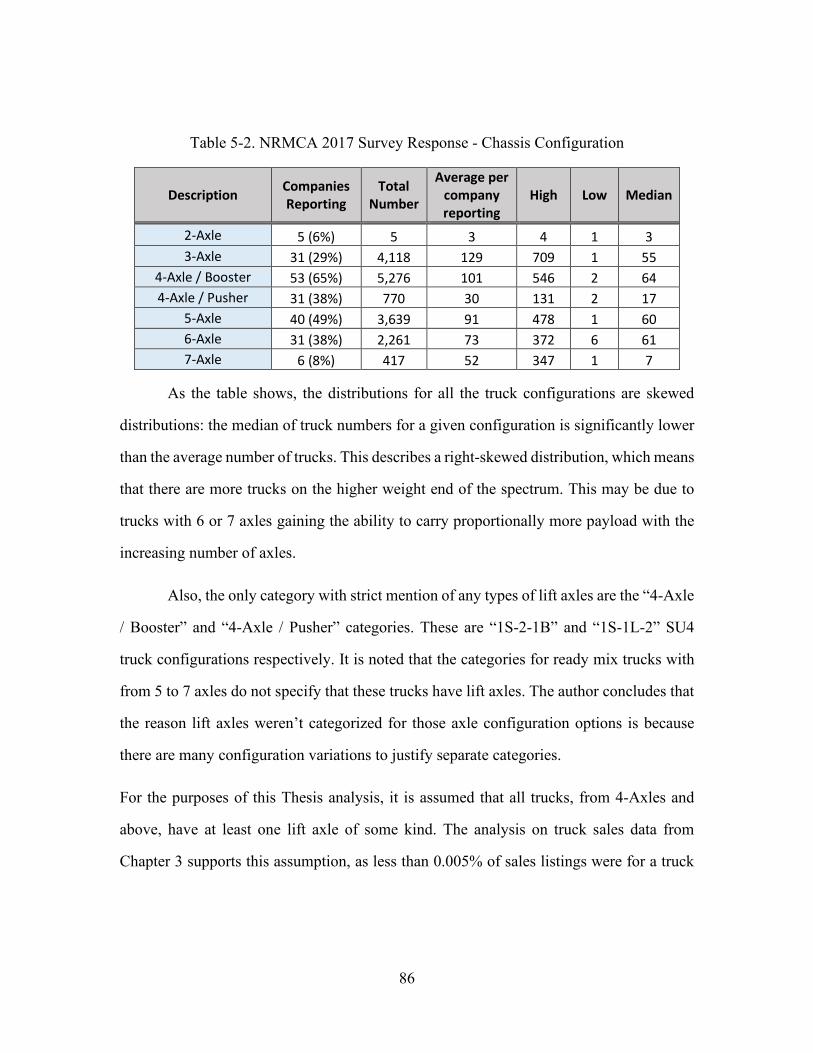
86
Table 5-2. NRMCA 2017 Survey Response - Chassis Configuration
Description Companies Reporting
Total Number
Average per company reporting
High Low Median
2-Axle 5 (6%) 5 3 4 1 3 3-Axle 31 (29%) 4,118 129 709 1 55
4-Axle / Booster 53 (65%) 5,276 101 546 2 64 4-Axle / Pusher 31 (38%) 770 30 131 2 17
5-Axle 40 (49%) 3,639 91 478 1 60 6-Axle 31 (38%) 2,261 73 372 6 61 7-Axle 6 (8%) 417 52 347 1 7
As the table shows, the distributions for all the truck configurations are skewed
distributions: the median of truck numbers for a given configuration is significantly lower
than the average number of trucks. This describes a right-skewed distribution, which means
that there are more trucks on the higher weight end of the spectrum. This may be due to
trucks with 6 or 7 axles gaining the ability to carry proportionally more payload with the
increasing number of axles.
Also, the only category with strict mention of any types of lift axles are the “4-Axle
/ Booster” and “4-Axle / Pusher” categories. These are “1S-2-1B” and “1S-1L-2” SU4
truck configurations respectively. It is noted that the categories for ready mix trucks with
from 5 to 7 axles do not specify that these trucks have lift axles. The author concludes that
the reason lift axles weren’t categorized for those axle configuration options is because
there are many configuration variations to justify separate categories.
For the purposes of this Thesis analysis, it is assumed that all trucks, from 4-Axles and
above, have at least one lift axle of some kind. The analysis on truck sales data from
Chapter 3 supports this assumption, as less than 0.005% of sales listings were for a truck
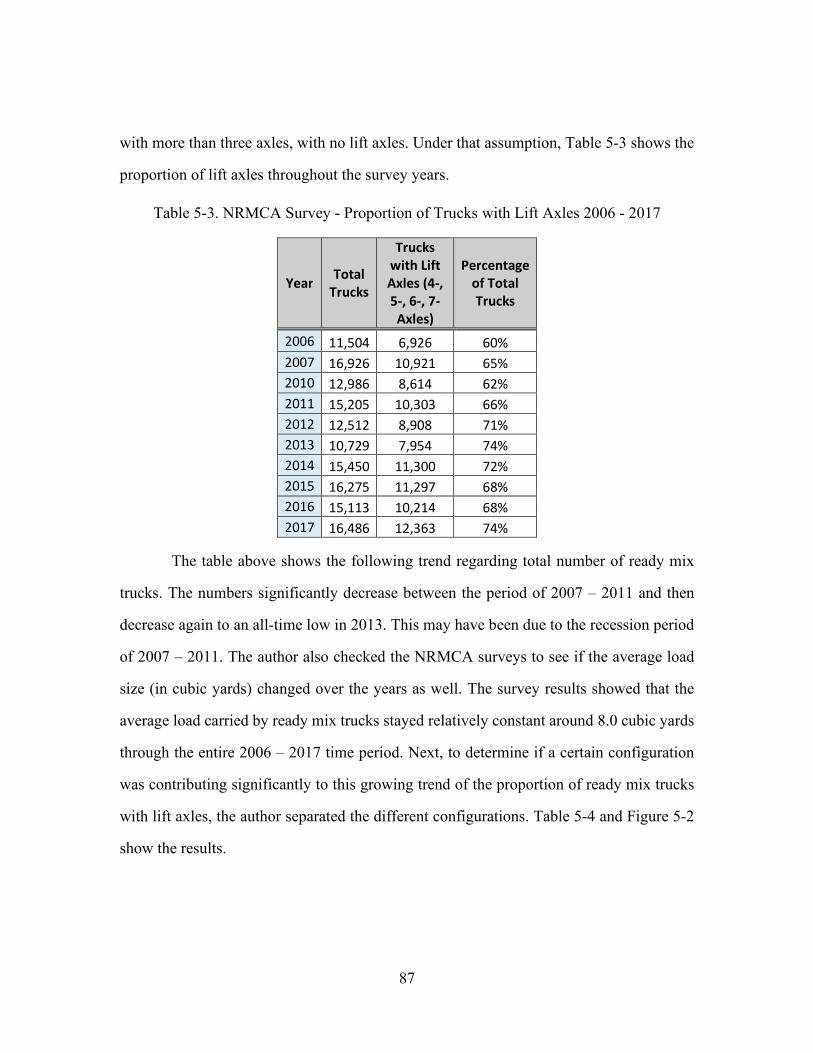
87
with more than three axles, with no lift axles. Under that assumption, Table 5-3 shows the
proportion of lift axles throughout the survey years.
Table 5-3. NRMCA Survey - Proportion of Trucks with Lift Axles 2006 - 2017
Year Total Trucks
Trucks with Lift Axles (4-, 5-, 6-, 7-Axles)
Percentage of Total Trucks
2006 11,504 6,926 60% 2007 16,926 10,921 65% 2010 12,986 8,614 62% 2011 15,205 10,303 66% 2012 12,512 8,908 71% 2013 10,729 7,954 74% 2014 15,450 11,300 72% 2015 16,275 11,297 68% 2016 15,113 10,214 68% 2017 16,486 12,363 74%
The table above shows the following trend regarding total number of ready mix
trucks. The numbers significantly decrease between the period of 2007 – 2011 and then
decrease again to an all-time low in 2013. This may have been due to the recession period
of 2007 – 2011. The author also checked the NRMCA surveys to see if the average load
size (in cubic yards) changed over the years as well. The survey results showed that the
average load carried by ready mix trucks stayed relatively constant around 8.0 cubic yards
through the entire 2006 – 2017 time period. Next, to determine if a certain configuration
was contributing significantly to this growing trend of the proportion of ready mix trucks
with lift axles, the author separated the different configurations. Table 5-4 and Figure 5-2
show the results.

88
Table 5-4. NRMCA Survey – Proportion of Axle Configurations 2006 – 2017
Year Total Trucks
4-Axle /
Booster %
4-Axle /
Pusher % 5-
Axle % 6-Axle % 7-
Axle %
2006 11,504 3,581 31% 896 8% 1,769 15% 650 6% 30 0% 2007 16,926 4,039 35% 1,398 12% 3,510 31% 1,891 16% 83 1% 2010 12,986 3,421 30% 1,996 17% 1,598 14% 1,294 11% 305 3% 2011 15,205 4,676 41% 1,847 16% 2,436 21% 1,047 9% 297 3% 2012 12,512 3,266 28% 1,851 16% 2,359 21% 1,151 10% 281 2% 2013 10,729 3,500 30% 1,691 15% 1,616 14% 1,115 10% 32 0% 2014 15,450 4,121 36% 2,335 20% 2,539 22% 1,959 17% 346 3% 2015 16,275 5,897 51% 1,853 16% 2,729 24% 1,462 13% 356 3% 2016 15,113 4,616 40% 1,070 9% 2,583 22% 1,560 14% 385 3% 2017 16,486 5,276 46% 770 7% 3,639 32% 2,261 20% 417 4%
Figure 5-2. NRMCA Survey - Proportion of Configurations Over the Years
As can be seen in the table and figure, there does appear to be an upward trend in
the proportion of all configurations of ready mix trucks except the “4-Axle / Pusher”.
Compared to the percentage near the beginning of the analysis period, the largest growths
0%
10%
20%
30%
40%
50%
2006 2008 2010 2012 2014 2016
Prop
ortio
n of
Tot
al F
leet
Year
Axle Configuration Proportions Vs. Year
4-Axle / Booster
4-Axle / Pusher
5-Axle
6-Axle
7-Axle
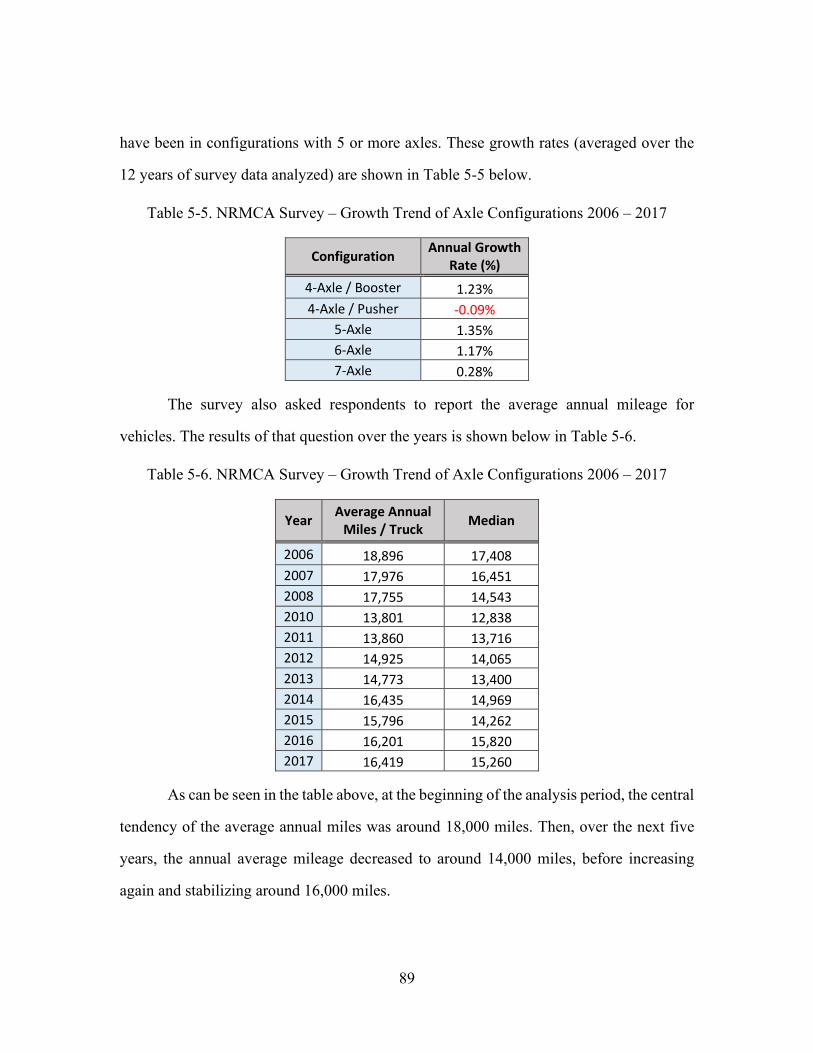
89
have been in configurations with 5 or more axles. These growth rates (averaged over the
12 years of survey data analyzed) are shown in Table 5-5 below.
Table 5-5. NRMCA Survey – Growth Trend of Axle Configurations 2006 – 2017
Configuration Annual Growth Rate (%)
4-Axle / Booster 1.23% 4-Axle / Pusher -0.09%
5-Axle 1.35% 6-Axle 1.17% 7-Axle 0.28%
The survey also asked respondents to report the average annual mileage for
vehicles. The results of that question over the years is shown below in Table 5-6.
Table 5-6. NRMCA Survey – Growth Trend of Axle Configurations 2006 – 2017
Year Average Annual Miles / Truck Median
2006 18,896 17,408 2007 17,976 16,451 2008 17,755 14,543 2010 13,801 12,838 2011 13,860 13,716 2012 14,925 14,065 2013 14,773 13,400 2014 16,435 14,969 2015 15,796 14,262 2016 16,201 15,820 2017 16,419 15,260
As can be seen in the table above, at the beginning of the analysis period, the central
tendency of the average annual miles was around 18,000 miles. Then, over the next five
years, the annual average mileage decreased to around 14,000 miles, before increasing
again and stabilizing around 16,000 miles.

90
The following section discusses an author-administered survey for the ready mix
industry and presents the results.
5.2 READY MIX INDUSTRY SURVEY ON LIFT AXLES
The author developed a survey for ready mix industry representatives, including
truck drivers or administrative employees at ready mix companies. The survey instrument
was reviewed and was given an Institutional Review Board (IRB) approval by the Office
of Research Support and Compliance at the University of Texas at Austin. This survey can
be found in Appendix C.
The survey contains 10 questions regarding lift axle usage, including the company’s
fleet composition, trucks with fixed axles only and trucks with lift axles, reasoning for
presence or absence of trucks with lift axles, geographic area of operations, SHV safety
considerations, and SHV cost inquiries. Respondents were encouraged to only share as
much information as they felt comfortable, and the survey was developed in such a way
that it could be answered fully anonymously.
The author developed a list of companies to contact by searching through the
NRMCA member directory, as well as the directories of each of Texas and its peer states’
ready mix trade associations. From this methodology, a total of 523 companies were
contacted either by email or by phone and requested to fill out the survey. Online trucking
forums were utilized to distribute the survey further, but this method may have led to
responses from outside of the ten peer states. Responses from outside the United States
were discarded. To minimize the likelihood of repeat responses, i.e. multiple responses
from the same company, the author used IP Address data and GPS data from the survey
responses (given as an output from the Qualtrics survey system), to separate responses from
one another. It is important to note that neither of these data points could identify individual
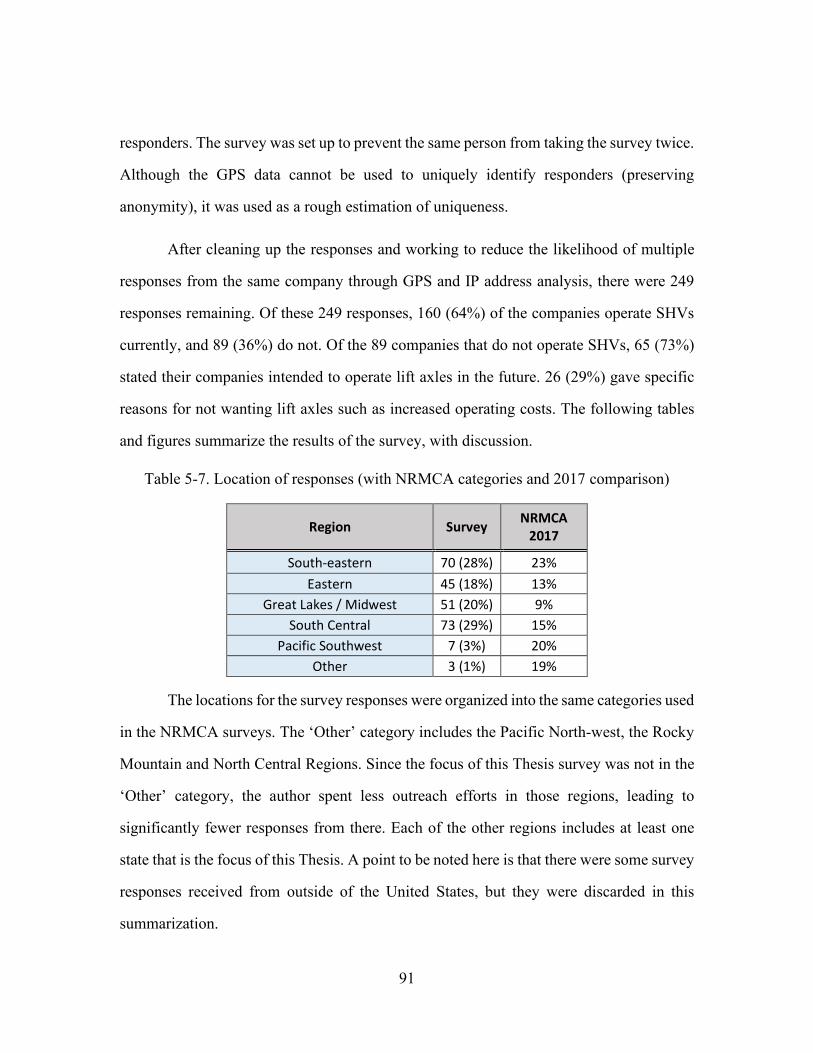
91
responders. The survey was set up to prevent the same person from taking the survey twice.
Although the GPS data cannot be used to uniquely identify responders (preserving
anonymity), it was used as a rough estimation of uniqueness.
After cleaning up the responses and working to reduce the likelihood of multiple
responses from the same company through GPS and IP address analysis, there were 249
responses remaining. Of these 249 responses, 160 (64%) of the companies operate SHVs
currently, and 89 (36%) do not. Of the 89 companies that do not operate SHVs, 65 (73%)
stated their companies intended to operate lift axles in the future. 26 (29%) gave specific
reasons for not wanting lift axles such as increased operating costs. The following tables
and figures summarize the results of the survey, with discussion.
Table 5-7. Location of responses (with NRMCA categories and 2017 comparison)
Region Survey NRMCA 2017
South-eastern 70 (28%) 23% Eastern 45 (18%) 13%
Great Lakes / Midwest 51 (20%) 9% South Central 73 (29%) 15%
Pacific Southwest 7 (3%) 20% Other 3 (1%) 19%
The locations for the survey responses were organized into the same categories used
in the NRMCA surveys. The ‘Other’ category includes the Pacific North-west, the Rocky
Mountain and North Central Regions. Since the focus of this Thesis survey was not in the
‘Other’ category, the author spent less outreach efforts in those regions, leading to
significantly fewer responses from there. Each of the other regions includes at least one
state that is the focus of this Thesis. A point to be noted here is that there were some survey
responses received from outside of the United States, but they were discarded in this
summarization.

92
Table 5-8. For companies with no SHVs, reasons why not
Reasons to Not Operate SHVs (multiple selections allowed) Survey
Increased Capital Costs 9 (35%) Increased Operation / Maintenance 10 (38%)
Does Not Fit Company Plans Now 5 (19%) Other 2 (8%)
The table above shows responses from companies who stated they do not currently
implement SHVs, for the reasons selected above. Not all companies who do not implement
SHVs elected to provide a reason, or state their intent to implement SHVs in the future (see
Table 5-9). However, of the responses received, the highest proportion of responses stated
that the reason for not operating SHVs was increased operation / maintenance costs. This
agrees with comments from truckers, who said SHVs cost more to maintain, as they have
the additional components including lift controls, air bags, the lift axle and tires. However,
this increase in cost may be offset by increased financial gains from using lift axles.
Table 5-9. For companies with no SHVs but intent to implement, reasons why
Reasons to Intend SHV Operations (multiple selections allowed) Survey
Flexibility in Operations 17 (30%) Lower Operation Costs 20 (35%)
Maneuverability 9 (16%) Increased Payload 30 (53%)
Interstate Allowance 20 (35%)
The table above shows responses from companies who stated they do not currently
implement SHVs, but intend to implement them in the future, for the reasons selected
above. As this was an optional question, not all companies intending to operate SHVs
elected to provide reasons. However, of the responses received, the highest proportion

93
stated that SHVs provide increased the payload. In addition, SHVs provide the ability to
operate on interstate highways.
Table 5-10. Survey Responses about SHV safety
Are SHVs Safer? Survey
No, Safety is largely driver dependent 142 (57%)
No, same level of safety 61 (24%)
Yes, due to more axles on the ground 25 (10%)
Yes, due to better braking 13 (5%) Other 8 (3%)
The table above shows responses from all companies, regarding SHV safety, i.e.
are SHVs comparatively more or less safe than trucks without lift axles. Of all the
responses, the two answers which constituted roughly 80% of the answers were either a
similar level of safety between lift and non-lift axle trucks, or that the safety of a truck
largely depended on the operator.
Table 5-11. Survey Responses about SHV costs
Are SHVs Costlier? Survey
Not Necessarily: Depends on Brand, Year, Condition 83 (33%)
Not Necessarily: Depends on Configuration 76 (31%)
Don't know 64 (26%) No, we add lift axles after-purchase 5 (2%) Yes, I have specific cost information 21 (8%)
The table above shows responses from all companies, regarding SHV costs, i.e. are
SHVs comparatively more or less costly compared to trucks without lift axles. Most
responses did not provide actionable data, including answers of “it depends” or “I don’t
know”. However, some responders offered detailed information in a separate note on the

94
survey. Although these costs varied, and the anonymous nature of the responses makes it
hard to determine precisely which area of the US the response was regarding, the average
percentage increase offered by responders was ready mix trucks with lift axles cost roughly
10% more to purchase and maintain than their non-lift axle counterparts.
Table 5-12. For companies with SHVs, trend of SHV numbers over three years
SHV growth trends over 3 years Survey
0 - 15% growth 72 (45%) 15 - 30% growth 44 (28%) Over 30% growth 33 (21%)
Negative (i.e. decline) 11 (7%)
Companies with SHVs were asked about their fleet numbers (SHV and total trucks)
for the past three years, to develop a trend line for whether SHV numbers are generally
increasing or decreasing. The table above shows the growth trends determined from the
responses. The rates stated above are total growth rates over a period of three years of
growth (2016-2019), not annual rates. 93% of the responders had increasing SHV growth
rates, with the majority being under 15%. This result seems to indicate an overall growing
trend for SHVs in the ready mix industry in the US.
Table 5-13. For companies with SHVs, average mileage of SHV trucks
SHV average annual truck mileage Survey
5,000 to 9,999 miles 46 (29%) 10,000 to 14,999 miles 65 (41%) 15,000 to 19,999 miles 18 (11%) 20,000 to 29,999 miles 26 (16%)
Over 30,000 miles 5 (3%)

95
For companies operating SHVs, the survey requested average annual mileage for
the SHV vehicles. The results are shown above, and the data from 160 responses had a
mean of 12,688 miles and a median of 10,000 miles.
Table 5-14. Number of Companies stating reasons for choosing to operate SHVs
Reasons for SHV Operations (multiple selections allowed) Survey
Flexibility in Operations 62 (39%) Lower Operation Costs 68 (43%)
Maneuverability 38 (24%) Increased Payload 78 (49%)
Interstate Allowance 50 (31%) Safer 25 (16%)
The table above shows responses from companies with SHVs. Not all companies
provided a reason why they elected to operate SHVs. However, the responses received
provided a similar picture to that from companies without SHVs, i.e. the highest proportion
of responses stated the benefits they’d receive with SHVs is the ability to increase the
payload carried. Interestingly, although increased safety was an option for this question to
all responders, only those from SHV-operating companies selected it as a reason. This may
imply the presence of perceivable safety benefits to users. Otherwise, the results were
similar to those from non-SHV-operating companies.
Table 5-15. For companies with SHVs, survey responses about SHV training
Does your company provide SHV training to drivers? Survey
Yes 129 (81%) No 16 (10%)
Other 15 (9%)

96
Of the companies that operate SHVs, an overwhelming majority of them provide
SHV training to drivers. Some of the ‘Other’ responses provided details, most of which
said their companies do not have a separate training for SHVs, but drivers are constantly
reminded to remain alert to the fact that they are driving significantly longer trucks (the
author interpreted responses like these to refer to the additional length that is provided
when a booster axle is deployed, and to the fact that the truck chassis would also need to
be longer to accommodate lift axles, especially for SU 5, SU 6 and SU 7 units.
Overall, the survey responses seem to agree with the results of the NRMCA survey
analysis, with some differences. For example, the 2017 average for annual mileage was
16,419 miles from the NRMCA survey, but 12,688 miles from this survey. It should be
noted here that the NRMCA results include all ready mix trucks, not separated by SHV
operating companies. Therefore, the average annual mileage for ready mix trucks from the
NRMCA survey and this survey are not drawn from the same sample. Also, there was a
two-year time gap between the NRMCA survey and this one, 2017 and 2019.
5.3 INDUSTRY INSIGHTS FROM ONLINE FORUM
One significant avenue of survey distribution was an online forum for truckers that
has over 20,000 active members as of July 2019 (Reddit, 2019). Forum members were
asked to take the survey, but some responders on the forum also volunteered helpful
insights. However, many of these responders discussed lift axles in general, not necessarily
in the ready mix industry. Some noteworthy observations and opinions are provided in the
following summary from forum interactions with fifteen truckers:
• When asked for the main advantage of using lift axles, the majority (four)
mentioned the increased weight-carrying capacity allowed by lift axles. The
next most commonly cited reason (three responses) was to avoid being ticketed

97
on highways, i.e., remaining in compliance with the law. Two individuals
responded that lift axles reduce tire wear because of the ability to raise axles
when not in use. One responder mentioned how raising these axles when empty
also allowed him / her to save on toll charges (in an area where charges are per
axle), while another response mentioned the possibility of reducing fuel
consumption, due to having less rolling resistance when the axle is raised.
• Following from the conversation about reduced fuel consumption or tire wear,
one commenter expanded on the topic: “Every time the truck is turning, even
only on a slight curve, those axles are put into a bind creating more friction and
tire wear. Lifting one of those axles eliminates that bind. Since trucks are driven
tens of thousands of miles yearly the savings from utilizing drop or lift axles
adds up pretty quick”. Another commenter added that, in his experience,
improvements to fuel mileage are considered worthwhile if they make
differences of even a tenth of a mpg. The NRMCA survey results showed that
ready mix trucks only get about 3 to 3.5 miles per gallon compared to long haul
trucks which range from 6 to 8 mpg depending on the age of the truck and
configuration, further adding to the importance of improvements in fuel
efficiency.
• One responder working in the ready mix industry mentioned how his / her
company is in the process of slowly replacing the fleet with trucks that all have
pusher and booster axle trucks. When asked how long the replacement process
will take, the responder said: “I couldn't tell you exactly how long it will take.
I just know they get a few trucks a year. Example: last year we got about 15
five-axle lift axle trucks and retired 7 three-axle trucks (without lift axles).” The
truck configuration for these new trucks is 1S-1L-2-1B.

98
• That responder also mentioned that training specific to lift axle usage was brief,
and mainly covered how to operate the lift mechanism. Drivers were also taught
to be aware of obstructions within the area 10 feet behind the truck (in instances
of the presence of a booster axle).
5.4 INSIGHTS FROM UT-CTR SHV PROJECT
As part of the UT-CTR project, the author’s team interviewed personnel from the
Texas Department of Motor Vehicles (TxDMV) and Texas Department of Public Safety
(DPS), to gain insight on those two departments’ views on SHVs.
From an interview with the Director of DPS Commercial Vehicle Enforcement
Division, the research team learned more about the organization’s views on SHVs. More
specifically, at the time of the interview in late 2015, the DPS was not specifically
concerned about problems with SHV safety or overweight issues, and procedurally treated
them similar to any other commercial vehicle. After this interview, the Director provided
the team with DPS roadside weight enforcement data.
From two interviews with Texas DMV personnel, the team learned that TxDMV
does not record lift axle data during truck registration and registers trucks based on truck
operational type and GVW. The number of axles is not recorded since there is no
requirement in state laws to include number of axles in registration data. After these
interviews, the Director of the Vehicle Titles and Registration department of TxDMV
provided the team with truck registration data.
The next chapter provides a discussion of the results presented here, including
highlights of the Thesis research, possible interpretations, and perspectives learned. It
finishes with concluding remarks, as well as some recommendations for future research.

99
Chapter 6: Conclusion
The main objective of this research was to document current ready mix SHV
operations and laws and to research the reasons that ready mix companies might choose to
operate SHVs. This was accomplished through a literature review, surveys with State
Officials regarding truck size and weight laws that affect SHVs, ready mix truck sales data,
a survey with 249 ready mix truck companies and additional information learned through
an online trucking industry forum. This information was used to evaluate perceived
benefits including safety considerations, reductions in equipment wear and maintenance
costs, ability to operate on the Interstate Highway system and increased payload capacity.
Overall, all methods of study indicated an upward trend in lift axle usage on ready
mix trucks. The NRMCA data showed an SHV proportion in the ready mix industry of
approximately 60-70% from 2006. The survey administered by the author also
corroborated this, with 64% of the responses from companies that operate SHVs. However,
SHVs in general are relatively rare, e.g. in UT-CTR’s SHV study, percentage of SHVs
among certain industries in Texas was around 17%, while percentage of SHVs among all
trucks was around 2%. These percentages varied by location, industry, and data collection
method. The large difference between the survey results and the UT-CTR SHV study could
be due to the fact that the UT-CTR study focused only on Texas, whereas the NRMCA
surveys included the entire United States as well as the fact that the UT-CTR study included
non-ready mix industries. The author’s Thesis considered 6 of the 8 regions contained in
the NRMCA study. However, the author believes specifically analyzing the proportion of
SHVs in the ready mix industry in Texas is worthwhile.
Potential future research in this area were identified during the study and includes
observations by truckers the author interacted with. One possible study relates to the claim

100
that SHVs help with fuel economy, which has been studied previously for lift axles on
combination trucks (Surcel & Bonsi, 2015). Further research about ready mix truck safety
based on steering and braking efficiency. This could be explored using the Texas Crash
Record Information System (CRIS) and the Fatality and Analysis Reporting System
(FARS). This proposed study would evaluate crash data, including numbers of SHVs and
non-SHVs involved in crashes, crash contributing factors, crash severity, and relationships
between crash locations and road geometry. Another potential avenue of research in the
area of safety was determined after analyzing stopping distances and criteria in Chapter 2
of this Thesis. The author found that there was a disparity in the way braking parameters
were defined and measured between NHTSA, CFR, transportation crash analysts,
transportation agencies, and transportation researchers. A possible avenue of research is to
create a framework to bridge the differences and develop a common language between
these groups, to allow deeper understanding of issues concerning truck braking and safety.
Additional research topics include estimating the potential cost savings realized by
operating SHVs including reduced fines for overloaded axles and reduced tolls on per-axle
toll roads.
Overall, the objectives set out at the beginning of this Thesis were to collect data
on and interpret trends in ready mix fleet distributions and SHV numbers in the ready mix
industry (Chapter 3, Chapter 5); analyze differences in state regulations regarding SHVs
(Chapter 4); and determine factors that influence a ready mix company’s decision to
operate SHVs (Chapter 5). The different chapters of this thesis stated the results of research
efforts aimed at achieving the objectives, while this concluding chapter set some areas for
future research.
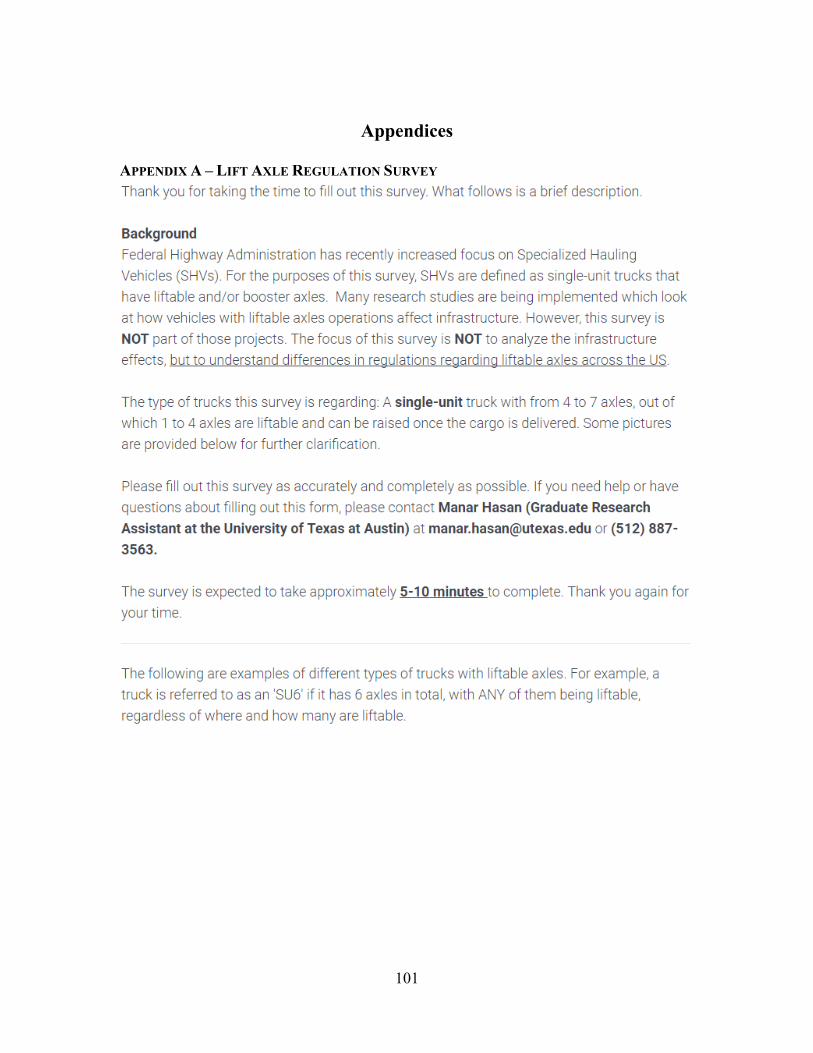
101
Appendices
APPENDIX A – LIFT AXLE REGULATION SURVEY

102

103

104

105

106

107

108

109

110

111

112
APPENDIX B – CONTACTS FOR LIFT AXLE REGULATION SURVEY State Person Name Position Entity California Mike Hamilton Officer California Highway Patrol Florida Anonymous Florida Highway Patrol Georgia Johnny Jones Major Georgia Department of Public Safety Illinois Brian Cluever Executive Director Illinois Truck Enforcement Association Michigan Anonymous Michigan State Police New York Anonymous New York State Police North Carolina Kenneth Snead Sergeant North Carolina State Highway Patrol
Ohio Tom (Unknown Last Name) Public Utilities Commission of Ohio
Compliance Division
Pennsylvania Greg Fischer Motor Carrier Enforcement Specialist
Highway Patrol CVSD
Texas Joshua Alcala Sergeant Texas Department of Public Safety CVE
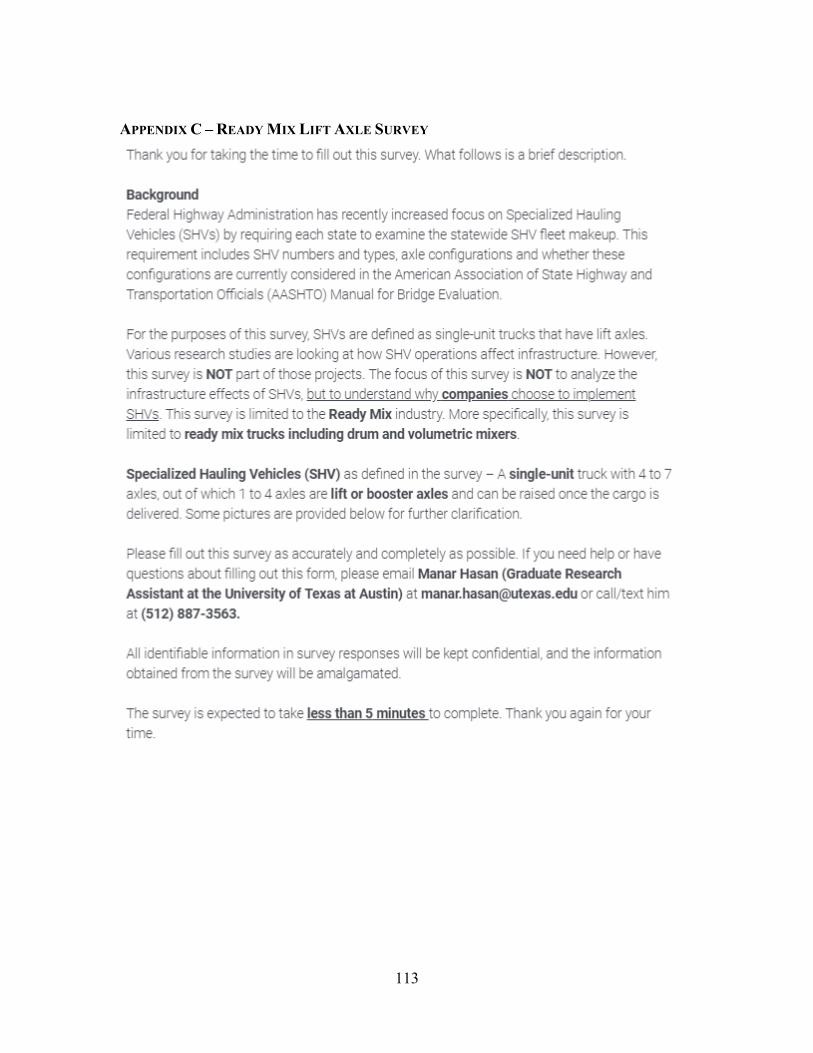
113
APPENDIX C – READY MIX LIFT AXLE SURVEY

114

115
If # of SHV answer is 0, the following questions are shown:

116
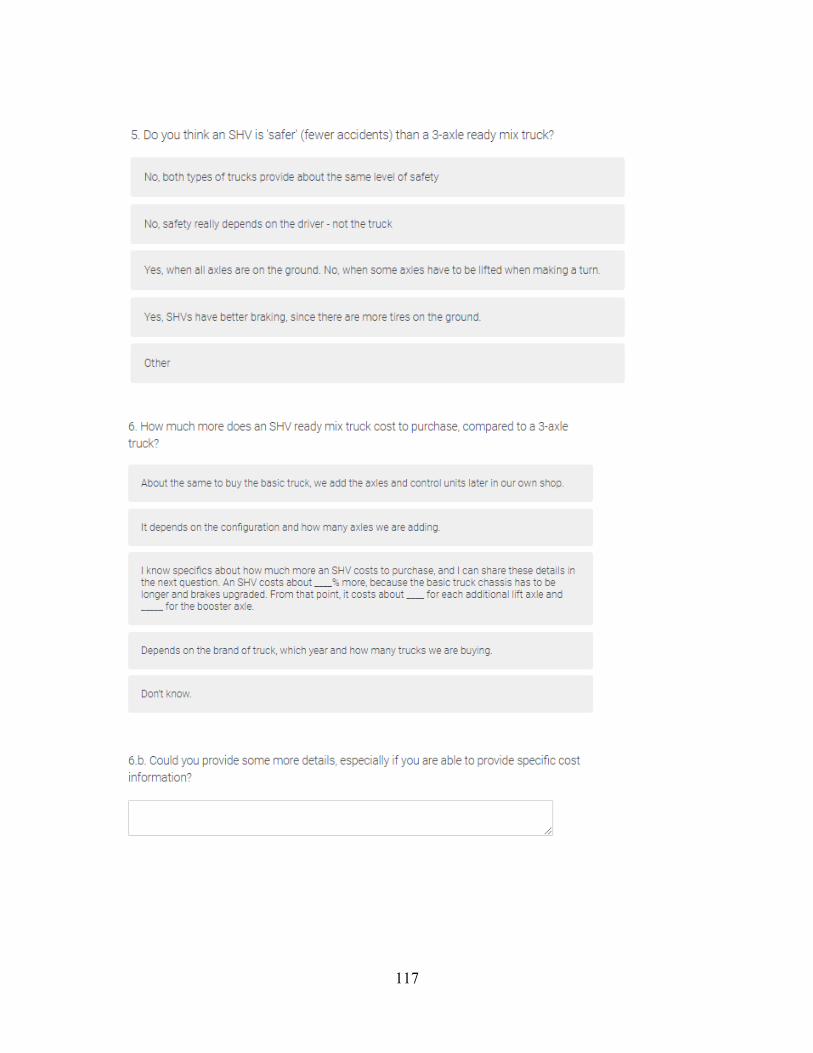
117

118
If # of SHV answer is a number not equal to 0, the following questions are shown:

119

120

121

122

123
APPENDIX D – POST ON ONLINE TRUCKING FORUMS REQUESTING PARTICIPATION IN THESIS RESEARCH
I'm a Transportation Engineering student researcher at the University of Texas at
Austin, and I wanted to see if you could assist me in some research I’m doing. I posted
about this a couple of years ago (see post here), but I’m starting this research back up
(after a significant pause) with some changes. The one-liner for my research (which has a
more refined scope now) is that I’m researching how / why companies in the ready mix
industry use lift axles (or not).
There’s a lot of recent research being done about trucks like with lift axles, but
few, if any, focus on learning from the actual end-user of these trucks: the truckers /
trucking companies. My master's thesis focus is on asking questions directly to truckers /
trucking companies to learn from their perspective.
For this research, I'm trying to understand things like how a ready mix company
might benefit from lift axles, what are the primary motivations, how drivers are
specifically trained to use them (if they are), do they cost more than regular trucks, etc.
Please consider helping out even if you drive a truck without lift axles, since it's
important for me to learn about why not. I’m looking to learn as much as I can about
ready mix operations with / without lift axles. For easy distribution, I have a survey
made, and it takes less than 5 minutes to complete. Here is the link to the survey, which
can be answered completely anonymously (if you wish):
http://bit.ly/ReadyMixLiftSurvey
If you'd also be willing to connect with me in depth about this, comment and I can
ask specific questions (or private message). I'd also be happy to answer questions you
may have about my research. Or just any general helpful comments about lift axles in
ready mix trucking would be greatly appreciated.

124
References
1. AASHTO. (2011). The Manual for Bridge Evaluation (2nd ed.). Washington: American Association of State Highway and Transportation Officials.
2. About Concrete. Retrieved 15 November 2019, from https://www.nrmca.org/concrete/data.asp
3. All about front discharge mixers. (2013). Retrieved 15 November 2019, from https://www.aggregateresearch.com/news/all-about-front-discharge-mixers/
4. ASTM International. (2019). ASTM C94 / C94M-19a, Standard Specification for Ready-Mixed Concrete. West Conshohocken, PA. Retrieved from https://doi.org/10.1520/C0094_C0094M-19A
5. Bedsworth, K., Butler, R., Rogers, G., Breen, K., & Fischer, W. (2013). Commercial Vehicle Skid Distance Testing and Analysis. SAE Technical Paper Series. doi: 10.4271/2013-01-0771
6. Berg, T. (2010). Lift Axle Considerations. Retrieved 15 November 2019, from http://www.truckinginfo.com/channel/equipment/article/story/2010/04/lift-axle-considerations.aspx
7. Billing, J., Nix, F., Boucher, M., & Raney, B. (1991). On the Use of Liftable Axles by Heavy Trucks. Transportation Research Record, No. 1313. Retrieved from https://trid.trb.org/view/364915
8. Burnhill, D. (2009). Ackerman Steering Principle. Retrieved 15 November 2019, from http://pedalcarracing.info/download/Information/construction/ackerman_steering_princ.pdf
9. Federal Bridge Laws / Vehicle Weight Laws. Retrieved 15 November 2019, from http://www.superdumps.com/bridge_laws/
10. Federal Highway Administration. (2013). Memorandum on Load Rating of Specialized Hauling Vehicles. Washington, D.C.
11. Fricke, L., & Baker, J. (1990). Drag Factor and Coefficient of Friction in Traffic Accident Reconstruction: Topic 862. Evanston, IL: Northwestern University Traffic Institute. Retrieved from https://pdfs.semanticscholar.org/ac3b/63aed2cbc66845c2a079b9c4b0e045ed51b2.pdf
12. Kimble Mixer Company. (2014). Rear Discharge Mixer Operation & Safety Manual. Kimble Mixer Company. Retrieved from http://www.kimblemixer.com/kimblewp/wp-content/uploads/2014/05/990001-066_B_K2200C_Safety.pdf

125
13. Luskin, D., Harrison, R., Walton, C., Zhang, Z., & Jamieson, J. (2000). Alternatives to Weight Tolerance Permits. Austin, Texas: University of Texas at Austin. Aviation Research Center (ARC). Retrieved from https://ctr.utexas.edu/wp-content/uploads/pubs/4036_1.pdf
14. Mack targets tank fleets for new Load Logic 6x2 liftable pusher axle. (2015). Retrieved 15 November 2019, from https://www.bulktransporter.com/trucks/mack-targets-tank-fleets-new-load-logic-6x2-liftable-pusher-axle-0
15. MDOT. (2007). Maximum Legal Truck Loadings and Dimensions. Lansing, MI: Michigan Department Of Transportation. Retrieved from https://www.michigan.gov/documents/Loads_dim_87014_7.pdf
16. Muthumani, A., & Shi, X. (2015). Impacts of Specialized Hauling Vehicles on Highway Infrastructure, the Economy, and Safety: Renewed Perspective. Retrieved 15 November 2019, from http://dx.doi.org/10.1061/9780784479285.020
17. Nadolny, R. (1994). How federal bridge laws influence mixer payload size selection. Concrete Construction. Retrieved from https://www.concreteconstruction.net/_view-object?id=00000154-1ce1-db06-a1fe-7fe9a90c0000
18. NRMCA. (2006). Fleet Benchmarking and Costs Survey. National Ready Mixed Concrete Association.
19. NRMCA. (2007). Fleet Benchmarking and Costs Survey. National Ready Mixed Concrete Association. Retrieved from https://www.nrmca.org/news/connections/Fall_2007.pdf
20. NRMCA. (2008). Fleet Benchmarking and Costs Survey. National Ready Mixed Concrete Association.
21. NRMCA. (2010). Fleet Benchmarking and Costs Survey. National Ready Mixed Concrete Association. Retrieved from http://www.nrmca.org/operations/documents/2010%20fleet%20survey%20final%20report%20052710%20.pdf
22. NRMCA. (2011). Fleet Benchmarking and Costs Survey. National Ready Mixed Concrete Association. Retrieved from http://www.nrmca.org/operations/documents/2011fleetsurveyfinalreport.pdf
23. NRMCA. (2012). Fleet Benchmarking and Costs Survey. National Ready Mixed Concrete Association. Retrieved from https://www.nrmca.org/operations/Documents/2012FleetSurveyFinalRepot.pdf
24. NRMCA. (2013). Fleet Benchmarking and Costs Survey. National Ready Mixed Concrete Association. Retrieved from https://www.nrmca.org/operations/Documents/2013FleetSurveyFinalReport.pdf

126
25. NRMCA. (2014). Fleet Benchmarking and Costs Survey. National Ready Mixed Concrete Association. Retrieved from https://www.nrmca.org/operations/Documents/2014FleetSurveyFinalReport.pdf
26. NRMCA. (2015). Fleet Benchmarking and Costs Survey. National Ready Mixed Concrete Association. Retrieved from http://www.nxtbook.com/naylor/NRCQ/NRCQ0315/index.php?startid=20#/22
27. NRMCA. (2016). Fleet Benchmarking and Costs Survey. National Ready Mixed Concrete Association. Retrieved from http://www.nxtbook.com/naylor/NRCQ/NRCQ0416/index.php?startid=25
28. NRMCA. (2017). Fleet Benchmarking and Costs Survey. National Ready Mixed Concrete Association. Retrieved from http://www.nxtbook.com/naylor/NRCQ/NRCQ0317/index.php?startid=18
29. Ready-Mix Concrete Manufacturing in the US. (2019). Retrieved 15 November 2019, from https://www.ibisworld.com/industry-statistics/number-of-businesses/ready-mix-concrete-manufacturing-united-states
30. Reddit (2019). /r/Trucker subreddit forum. https://www.reddit.com/r/Truckers/
31. Sivakumar, B., Moses, F., & Fu, G. (2007). Legal Truck Loads and AASHTO Legal Loads for Posting. Retrieved 15 November 2019, from https://www.nap.edu/catalog/23191/legal-truck-loads-and-aashto-legal-loads-for-posting
32. Smith, T. What is a lift axle and flip axle. Retrieved 15 November 2019, from http://www.heavyhaul.net/lift-axle-flip-axle/
33. Sullivan, E. (2009). Long-Term Cement Consumption Outlook. Portland Cement Association. Retrieved from https://www.cement.org/docs/default-source/market-economics-pdfs/forecasts/long-term-outlook-sample.pdf?sfvrsn=2&sfvrsn=2
34. Surcel, M., & Bonsi, A. (2015). The Impact of Lift Axles on Fuel Economy and GHG Emissions Reduction. Retrieved 15 November 2019, from http://dx.doi.org/10.4271/2015-01-2874
35. Syverson, C. (2008). Markets: Ready-Mixed Concrete. University of Chicago. Retrieved from http://home.uchicago.edu/~syverson/marketsrmc.pdf
36. Terex. Mixer Operator Manual Front-Discharge. Terex. Retrieved from https://cdn.mpparts.com/pdfs/Terex%20Front%20Discharge%20Operator%20Manual.pdf
37. Texas 2030 Committee. (2011). It's About Time : Investing in Transportation to Keep Texas Economically Competitive. Executive Summary. Austin, Texas: Texas 2030

127
Committee. Retrieved from https://texas2030committee.tamu.edu/documents/final_03-2011_summary.pdf
38. TxDMV. (2019). Annual Ready-Mixed Concrete Truck Permit. Texas Department of Motor Vehicles. Retrieved from https://www.txdmv.gov/reports-and-data/doc_download/3351-mcd-1755-annual-ready-mixed-concrete-permit-application
39. USDOT. (2015). Report to Congress on the Compilation of Size and Weight Laws. Washington, D.C.: United States Department of Transportation. Retrieved from https://www.trucking.org/ATA%20Docs/What%20We%20Do/Trucking%20Issues/Documents/Highway%20Infrastructure%20and%20Funding/Report%20to%20Congress%20on%20the%20Compilation%20of%20Size%20and%20Weight%20Laws.pdf
40. USGS. (2019). Cement. United States Geological Survey. Retrieved from http://prd-wret.s3-us-west-2.amazonaws.com/assets/palladium/production/atoms/files/mcs2019_all.pdf
41. Walton, C., Murphy, M., Prozzi, J., Weissmann, J., Wu, H., & Jiang, N. et al. (2016). SLA Truck Configuration Library Final Report. Austin, Texas: University of Texas at Austin. Center for Transportation Research (CTR). Retrieved from https://library.ctr.utexas.edu/ctr-publications/iac/truck-config-library-final.pdf
42. Walton, C., Murphy, M., Wu, H., Jiang, N., Hasan, M., & Xu, H. et al. (2017). The Impact of Specialized Hauling Vehicles on Pavement and Bridge Deterioration. Austin, Texas: University of Texas at Austin. Center for Transportation Research (CTR). Retrieved from https://library.ctr.utexas.edu/ctr-publications/0-6897-2.pdf
43. Ward, D. (1994). Getting more boost for the axle. The Aberdeen Group. Retrieved from https://www.concreteconstruction.net/_view-object?id=00000154-1cdf-db06-a1fe-7fdfbba40000

128
Figure References
1. CommercialTruckTrader. 1998 FORD LT9513 Mixer Truck [Image]. Retrieved from https://www.commercialtrucktrader.com/listing/1998-Ford-LT9513-5009229020
2. CommercialTruckTrader. 2000 PETERBILT 357 Mixer Truck [Image]. Retrieved from https://www.commercialtrucktrader.com/listing/2000-PETERBILT-357-5009126749
3. CommercialTruckTrader. 2005 Sterling Truck Mixer Truck [Image]. Retrieved from https://www.commercialtrucktrader.com/listing/2005-Sterling-TRUCK-5009586057
4. CommercialTruckTrader. 2007 INTERNATIONAL 5500I Mixer Truck [Image]. Retrieved from https://www.commercialtrucktrader.com/listing/2007-INTERNATIONAL-5500I-5006232867
5. CommercialTruckTrader. 2007 TEREX FDB6000 Mixer Truck [Image]. Retrieved from https://www.commercialtrucktrader.com/listing/2007-TEREX-FDB6000-5009127170
6. CommercialTruckTrader. 2009 OSHKOSH S Series Mixer Truck [Image]. Retrieved from https://www.commercialtrucktrader.com/listing/2009-Oshkosh-S+SERIES-5009846961
7. CommercialTruckTrader. 2019 PETERBILT 567 Mixer Truck [Image]. Retrieved from https://www.commercialtrucktrader.com/listing/2019-PETERBILT-567-5004411276
8. CommercialTruckTrader. 2009 OSHKOSH S-Glider Mixer Truck [Image]. Retrieved from https://www.commercialtrucktrader.com/listing/2009-OSHKOSH-S-GLIDER-5007942252
9. Courtney, W. A 7 axle Phoenix Concrete Mixer [Image]. Retrieved from https://www.pinterest.com/pin/488851734525042561/
10. Hasan, M. (2016). Inside-cab controls for booster axle [Image].
11. Hasan, M. (2016). Inside-cab controls for pusher axles [Image].
12. Hendrickson International. (2014). lift axle [Image]. Retrieved from https://www.hendrickson-intl.com/Auxiliary/Truck-Steerable-Lift-Axle
13. Hendrickson International. Auxiliary Axle Ride Height [Image]. Retrieved from https://www.hendrickson-intl.com/getattachment/Auxiliary/FAQs/How-does-the-CTR-work-/rideheight.jpg
14. Jiang, N. (2016). Close-up of outside-cab pressure gage / control for pusher axle [Image].
15. Jiang, N. (2016). Outside-cab pressure gage / control for booster axle [Image].
129
16. Jiang, N. (2016). Outside-cab pressure gages / controls for pusher axles [Image].
17. Kimble Mixer Company. Kimble 3-Axle Rear Discharge Mixer [Image]. Retrieved from https://www.kimblemixer.com/mixers/k2200c/
18. McNeilus. (2016). McNeilus Bridgemaster Concrete Truck [Image]. Retrieved from https://www.mcneiluscompanies.com/concrete-mixers/bridgemaster-mixer/
19. McNeilus. (2017). McNeilus Bridgemaster Concrete Truck [Image]. Retrieved from https://www.mcneiluscompanies.com/concrete-mixers/bridgemaster-mixer/
20. Murphy, M. (2016). Lift axle air bag pressure versus cubic yards in drum [Image].
21. MyLittleSalesman. 2007 Advance C13335APPT61211 Quad Axle Mixer [Image]. Retrieved from https://www.mylittlesalesman.com/2007-advance-c13335appt61211-quad-axle-mixer-ready-mix-concrete-truck-caterpillar-c13-9729100
22. Seitz, S. (2004). Ready Mix Concrete Truck [Image]. Retrieved from https://commons.wikimedia.org/wiki/File:Ready_Mix_Concrete_Truck.jpg
23. Terex. FD5000 "Great Lakes" [Image]. Retrieved from https://www.terex.com/advance/en/product/commander-series/fd5000-great-lakes
24. TruckPaper. 2004 STERLING 9511 For Sale In Dodge Center, Minnesota [Image]. Retrieved from https://www.truckpaper.com/listings/trucks/for-sale/26090469/2004-sterling-9511’

130
Vita
Manar Hasan was born in College Station, Texas in 1992. He moved to Dhaka,
Bangladesh in 1995, then to Oxford, Mississippi in 2001, then back to Dhaka, Bangladesh
in 2004, and finally to Austin, Texas in 2009. After finishing high school in Austin, he
started his pursuit of a Bachelor’s in Civil Engineering at the Cockrell School of
Engineering at The University of Texas at Austin. He graduated in 2015, and immediately
returned to pursue a Master’s degree in Transportation Engineering under Dr. C. Michael
Walton.
Permanent email: [email protected]
This thesis was typed by Manar Hasan.


