189
Copyright By Matthew Daleon Pahnke 2010

Copyright
By
Matthew Daleon Pahnke
2010

The Dissertation Committee for Matthew Daleon Pahnke certifies that this is the approved version of the following dissertation:
Effect of Sodium Chloride Supplementation on Serum and Sweat Sodium Concentration, Cardiovascular Function, and Physical and
Cognitive Performance
Committee:
___________________________ Edward Coyle, Supervisor
_____________________________ Roger Farrar
___________________________ Steven Kornguth
___________________________ Jan Machart ______________________________Hirofumi Tanaka

Effect of Sodium Chloride Supplementation on Serum Sodium
Concentration, Cardiovascular Function, and Physical and Cognitive
Performance
by
Matthew Daleon Pahnke, B.A., M.A.
Dissertation
Presented to the Faculty of the Graduate School of
The University of Texas at Austin
in Partial Fulfillment
of the Requirements
for the Degree of
Doctor of Philosophy
The University of Texas at Austin
August 2010

Dedication
I dedicate this dissertation to my family. For my fiancée, Lauren, who has given me
encouragement, support, diversion, and patience throughout this endeavor. And to my
parents for always encouraging me to do my best and for instilling the work ethic learned
from my late grandparents who also inspired me.

v
Acknowledgements
I am grateful to my research and educational mentor, Dr. Ed Coyle, for he has given me
the insight, inspiration, and motivation to follow my research path. I am also thankful to
Dr. Jan Machart for her co-inspiration on both my research topic, as well as my teaching
ethic. Special thanks to the rest of my committee; Dr. Roger Farrar, Dr. Steven
Kornguth, and Dr. Hirofumi Tanaka. I would also to thank Dr. Joel Trinity and Justin
Trombold for their assistance in and out of the lab and also to all of my many other
colleagues and former members of the Human Performance Laboratory that have assisted
me throughout my time at the University of Texas at Austin. Lastly, I would like to
thank Patty Coffman for her assistance and support during my years at the University of
Texas.

vi
Effect of Sodium Chloride Supplementation on Serum and Sweat
Sodium Concentration, Cardiovascular Function, and Physical and
Cognitive Performance
Matthew Daleon Pahnke, Ph.D.
The University of Texas at Austin, 2010
Supervisor: Edward F. Coyle
These studies determined the effects of sodium chloride supplementation on
serum and sweat sodium concentration, cardiovascular function, and physical and
cognitive performance. Sweat sodium losses, alone, caused a significant decline in serum
sodium concentration (-6.4±1.6 mEq/L, p=0.001) during 3h cycling in the heat in
endurance-trained athletes with high sweat sodium losses. However, sodium chloride
supplementation matching sweat sodium losses (NA; 5.9±1.5g NaCl/h) maintained serum
sodium concentration. Post-exercise maximal cycling power declined and was
significantly lower than pre-exercise in placebo (PL; p=0.012), but power was not
significantly different in NA (p=0.057). Pre- to post-exercise response time during a
Stroop Test improved in NA (p=0.009), while there was no change in PL (p=0.597).
Post-exercise postural sway was less in NA vs. PL (p=0.044).
Three days of sodium chloride supplementation (~15 g NaCl/d) resulted in a
significant increase in plasma volume in healthy untrained males at rest (5.9±7.6 %) and

vii
during exercise at 60%VO2peak (8.6±5.2 %) compared to PL. During NA, stroke
volume was 10% higher during exercise vs. PL (139±27 vs. 126±24 ml/beat, respectively,
p=0.004). Cardiac output was 8% higher in NA during exercise vs. PL (21.0±3.1 vs.
19.4±2.6 L/min, respectively, p=0.013). Mean arterial pressure during exercise was not
different in NA vs. PL (p=0.548) as total peripheral resistance decreased (p=0.027) with
the increased cardiac output. Sweat sodium concentration was 9% higher in NA vs. PL
during exercise in the heat (70.4±19.5 vs. 64.5±21.7 mEq/L, p=0.044).
In summary, serum sodium concentration declines when high sweat sodium losses
are not replaced while hydration status is maintained. Acute sodium chloride
supplementation during exercise which matches sodium losses maintains serum sodium
concentration. This maintenance of serum sodium concentration results in both physical
and cognitive benefits compared to when serum sodium concentration declines. Chronic
intake of sodium chloride for 3 days increases plasma volume in healthy untrained men
and improves cardiovascular function, as both stroke volume and cardiac output are
increased, while oxygen consumption and blood pressure are unchanged. Therefore,
acute and chronic sodium supplementation positively alters fluid and sodium balance
which results in beneficial effects on physical and cognitive performance and
cardiovascular function during exercise.

viii
TABLE OF CONTENTS
List of Tables………………………………………………………………………. xi List of Figures……………………………………………………………………… xii Chapter I: General Introduction…………………………………………………… 1 Chapter II: Statement of the Problem……………………………………………... 3 Chapter III: Experimental Design…………………………………………………. 5 Chapter IV: Study 1……………………………………………………………….. 7
Effects of Oral Sodium Chloride Supplementation on Serum Sodium Concentration and Physical and Cognitive Performance………………………………………………………………………... 7
Abstract…………………………………………………………………………. 8
Introduction……………………………………………………………………... 9
Methods………………………………………………………………………… 11
Results…………………………………………………………………………... 19
Discussion………………………………………………………………………. 24
Figure Legends…………………………………………………………………..33
Chapter V: Study 2…………………………………………………………………47
Effects of Oral Sodium Chloride Supplementation on Blood Volume, Stroke Volume, and Sweat Sodium Concentration During Exercise in Untrained Males……………………………………………………..… 47
Abstract…………………………………………………………………………. 48
Introduction…………………………………………………………………….. 49
Methods………………………………………………………………………… 51
Results…………………………………………………………………………... 56
Discussion………………………………………………………………………. 59

ix
Figure Legends…………………………………………………………………..64
Chapter VI: Review of Literature………………………………………………….. 78 1 – Determinants of Fluid and Sodium Balance………………………………... 79
2 - Effects of Daily Sodium Ingestion on Sweat Sodium Concentration…………………………………………………………………… 82
3 - Altered Fluid and Sodium Balance…………………………………………. 85
4 - Effects of Decreased Serum Sodium Concentration on Performance…………………………………………………………………….. 87
5 - Effects of Plasma Volume Expansion on Cardiovascular Function………………………………………………………………………… 90 Chapter VII: General Discussion………………………………………………….. 96
Appendix A……………………………………………………………………….... 101
General Exercise and Performance Tests………………………………………….. 101
Steady state oxygen consumption and lactate threshold determination………… 101
Peak oxygen consumption and breath by breath oxygen consumption………… 101
Cognitive testing………………………………………………………...……… 102
Balance testing………………………………………………………………….. 102
Maximal neuromuscular power………………………………………………… 103
Time trial task…………………………………………………………………... 103
Appendix B………………………………………………………………………… 104
Instrumentation and Analysis……………………………………………………… 104
Measurement of gas exchange………………………………………………….. 104
Breath by breath gas measurement……………………………………………... 104
Open circuit acetylene wash-in…………………………………………………. 104

x
Core and skin temperature……………………………………………………… 105
Blood measures…………………………………………………………………. 105
Serum, sweat, and urine electrolyte analysis…………………………………… 106
Sweating rate and sweat sodium concentration analysis……………………….. 106
Serum and sweat osmolality……………………………………………………. 107
Urine specific gravity…………………………………………………………… 107
Maximal neuromuscular power………………………………………………… 107
Time trial performance…………………………………………………………. 108
Appendix C……………………………………………………………………….... 109
Individual Data……………………………………………………………………...109
Study 1………………………………………………………………………….. 109
Study 2………………………………………………………………………….. 139
References………………………………………………………………………….. 167
Vita…………………………………………………………………………………. 174

xi
LIST OF TABLES
Table 1-1. Sweating Characteristics for Males during Exercise in the Heat………41
Table 1-2. Body Mass Measurements…………………………………………….. 42
Table 1-3. Blood Measurements………………………………………………….. 43
Table 1-4. Sweating Characteristics……………………………………………… 44
Table 1-5. Power Cycle Measurements……………………………………………45
Table 1-6. Stroop Color-Word Interference Task Response Time……………….. 46
Table 2-1. Blood Measurements………………………………………………….. 77

xii
LIST OF FIGURES
Figure 1-1: Testing Protocol………………………………………………………. 35
Figure 1-2: Sweat and Serum Sodium Concentration…………………………….. 36
Figure 1-3: Sweat Sodium Loss and Serum Sodium Concentration……………….37
Figure 1-4: Sweat and Serum Sodium Concentration during Sodium Chloride Supplementation…………………………………… 38
Figure 1-5: Time Trial Performance………………………………………………. 39
Figure 1-6A/6B: Center of Pressure Tracings…………………………………….. 40
Figure 2-1: Oxygen Consumption Measurements………………………………… 67
Figure 2-2: Stroke Volume Measurements………………………………………... 68
Figure 2-3: Heart Rate Measurements…………………………………………….. 69
Figure 2-4: Stroke Volume vs. Heart Rate Relationship………………………….. 70
Figure 2-5: Cardiac Output Measurements………………………………………... 71
Figure 2-6: Changes in Cardiovascular Measures………………………………… 72
Figure 2-7: Blood Pressure Measurements………………………………………... 73
Figure 2-8: Total Peripheral Resistance Measurements…………………………... 74
Figure 2-9: Changes in Blood Pressure Measurements…………………………… 75
Figure 2-10: Sweat Sodium Concentration………………………………………... 76

1
Chapter I: General Introduction
Approximately 50-60 % of human body mass is composed of water. Total body
water is divided between the intracellular and extracellular compartments. The
extracellular space is further divided between interstitial and intravascular compartments.
Fluid balance between compartments is largely determined by the non-penetrating
solutes, intracellular potassium and extracellular sodium. Fluid or solute additions or
losses may result in alterations in the content or volume of the compartments. Nutritional
intake or metabolic processes may add to the content or volume while sweating,
urination, and respiration may decrease it. One potentially severe body fluid and
electrolyte imbalance is hyponatremia. Hyponatremia is considered to be mild to
moderate with serum sodium concentration of < 135 mEq/L and severe when < 125
mEq/L. Mild cases of decreased serum sodium concentration result in nausea, confusion,
or headaches, while severe cases may result in seizures or death. Cases of hyponatremia
have been reported in military personnel, laborers, or ultra-endurance athletes during
exercise (5, 8, 13, 31, 44, 51, 55, 59, 73, 74, 76, 94). While the effects of large
reductions in serum sodium concentration can be quite severe, the effects of small
declines (~5-10 mEq/L) in serum sodium concentration on physical and cognitive
performance are not well understood.
One of the many adaptations to endurance training is increased stroke volume
during exercise (97, 112). The higher stroke volume in trained vs. untrained individuals
is partially due to expanded plasma and blood volume (57, 63). The extracellular body
water compartment is expanded in endurance trained athletes (57). The increase in blood

2
volume results in improvements in cardiovascular function, specifically increased stroke
volume, which may result in increased cardiac output and/or a lower heart rate at rest
and/or during exercise. As extracellular sodium content is partially responsible for the
fluid volume of the intravascular compartment (90), an increase in sodium chloride
ingestion results in an increased blood volume (28, 29, 50, 107). This increased blood
volume may afford some of the same vascular benefits of endurance training to untrained
people. One such benefit would be an increase in stroke volume at rest and during
exercise. While stroke volume has been shown to increase at rest with sodium chloride
supplementation, no data exists on the effects of sodium chloride supplementation on
increasing exercising stroke volume in young (20-35 y) healthy males (28, 29, 50, 107).
These studies will investigate the effect of sweat sodium losses on serum sodium
concentration and performance, as well as the potential benefits of sodium chloride
supplementation on cardiovascular function and physical and cognitive performance.

3
Chapter II: Statement of the Problem
The overall purpose of these studies was to determine the effects of alterations in
body sodium stores on serum sodium concentration, blood volume, cardiovascular
function, and physical and cognitive performance. The purpose of Study 1 was to
determine if sweat sodium losses, alone, in individuals with high sweat sodium losses
would result in significant reductions in serum sodium concentration during exercise in
the heat. Additionally, we investigated the effects of sodium supplementation on
maintaining serum sodium concentration and physical and cognitive performance. The
specific research questions for Study 1 were:
1. Will 3h of exercise in the heat, while maintaining body mass through fluid intake,
decrease serum sodium concentration in individuals with high sweat sodium
losses?
2. Will sodium chloride supplementation matching sweat sodium losses maintain
serum sodium concentration while exercising with large sweat sodium losses?
3. Will a decline in serum sodium concentration result in a decreased physical and
cognitive performance?
The purpose of Study 2 was to determine the effects of increased sodium chloride
intake over 3 days on blood and stroke volume during rest and upright exercise.
Additionally, we investigated the effects of increased sodium chloride intake on sweat
sodium concentration in the heat. The specific research questions were:

4
1. Will an increase in daily sodium chloride intake (3.5 mEq Na/kg body mass/d) for
3 days increase blood volume in untrained males at rest and during exercise?
2. Will an increase in daily sodium chloride intake for 3 days result in an increase in
stroke volume during exercise in untrained, healthy males?
3. Will an increase in daily sodium intake result in an increase in sweat sodium
concentration during exercise in the heat in non-heat acclimatized untrained
males?

5
Chapter III: Experimental Design
Study 1. This first experiment determined the effects of prolonged sweating,
during exercise in the heat, in athletes with high sweat sodium losses on serum sodium
concentration and physical and cognitive performance. Furthermore, it determined the
resulting effects of sodium chloride supplementation matching sweat sodium losses. To
accomplish this, 36 male endurance-trained athletes performed sweating analysis testing
in order to identify a subject pool with sweat sodium losses greater than 90 mEq/L. In
order to familiarize the participants with the physical and cognitive tasks and to ensure
heat acclimatization, the participants performed 3 preliminary trials, separated by 48-96
hours. In addition to the familiarization tasks, participants cycled for 1 hour in the heat at
60% VO2peak in order to determine whole body sweating rate and regional sweat sodium
concentration. Approximately 1 week following the preliminary sessions, participants
completed 2 experimental trials, separated by approximately 7 days, consisting of 3 hours
of cycling at 60% VO2peak in a warm environment and several performance tasks in a
thermoneutral environment. During these trials, the participants received either sodium
chloride capsules matching their individual sweat sodium losses or a placebo. A fluid
replacement drink with carbohydrate was also provided to maintain body mass, thus
preventing dehydration.
Study 2. This experiment determined the effects of increased sodium chloride
intake on blood volume and stroke volume during rest and exercise in untrained males.
Nine untrained male subjects consumed pills containing sodium chloride (3.5 mEq Na/kg

6
body mass/day) or placebo, in addition to their normal diet. Following 3 days of sodium
chloride supplementation they performed 15 min of upright cycling at 60 % VO2peak in a
temperate environment (22 °C). During and after exericse, cardiac output, blood
pressure, and heart rate were measured and blood samples were taken for the
determination of hematocrit and hemoglobin, in order to calculate changes in blood
volume.
The second part of Study 2 was completed to determine the effects of increased
sodium chloride intake on sweat sodium concentration. Immediately following the
cardiovascular function task, participants cycled for 30 minutes at 50 % VO2peak in a
warm environment (~34 °C, 50 % RH), following a 15 min warm-up. Sweat samples
were collected from 4 regional sites and whole body sweating rate was measured. Whole
body sweat sodium concentration was calculated and compared between treatments.

7
Chapter IV: Study 1
Effects of Oral Sodium Chloride Supplementation on Serum Sodium Concentration
and Physical and Cognitive Performance

8
ABSTRACT
Large declines in serum sodium concentration can result in seizures and death, but
the effects of modest declines of serum sodium concentration on physical and cognitive
performance are not well understood. It is also not clear if sweat sodium losses alone can
result in significant declines in serum sodium concentration and whether sodium chloride
supplementation can prevent potential declines. The purpose of this study was to
determine the effects of prolonged sweating during exercise in the heat in individuals
with high sweat sodium losses on serum sodium concentration and physical and cognitive
performance. Eleven endurance-trained athletes cycled for 3h at 60% VO2peak while
ingesting sodium chloride matching sweat sodium losses (NA) or a placebo (PL), while
maintaining hydration status. Serum sodium concentration significantly declined in PL (-
6.4±1.6mEq/L, p=0.001) and was maintained in NA (-1.0±2.4mEq/L) with sodium
chloride supplements (5.89±1.48g/h) matching sweat sodium losses. The 4% decline in
maximal cycling power during PL was significant (p=0.012) while the 3% decline in NA
was not significant (p=0.057). Twenty-minute time trial performance was 4% higher in
NA vs. PL, yet this difference was not significant (p=0.307). Response time during a
Stroop test improved in NA (p=0.009) and was unchanged in PL (p=0.597). Post-test
balance was better in NA vs. PL (p=0.044). In conclusion, serum sodium concentration
declines in athletes with high sweat sodium losses while exercising in the heat for 3h.
When serum sodium concentration is maintained by matching losses with sodium
chloride supplementation; balance and Stroop Test response time are significantly
improved.
9
INTRODUCTION
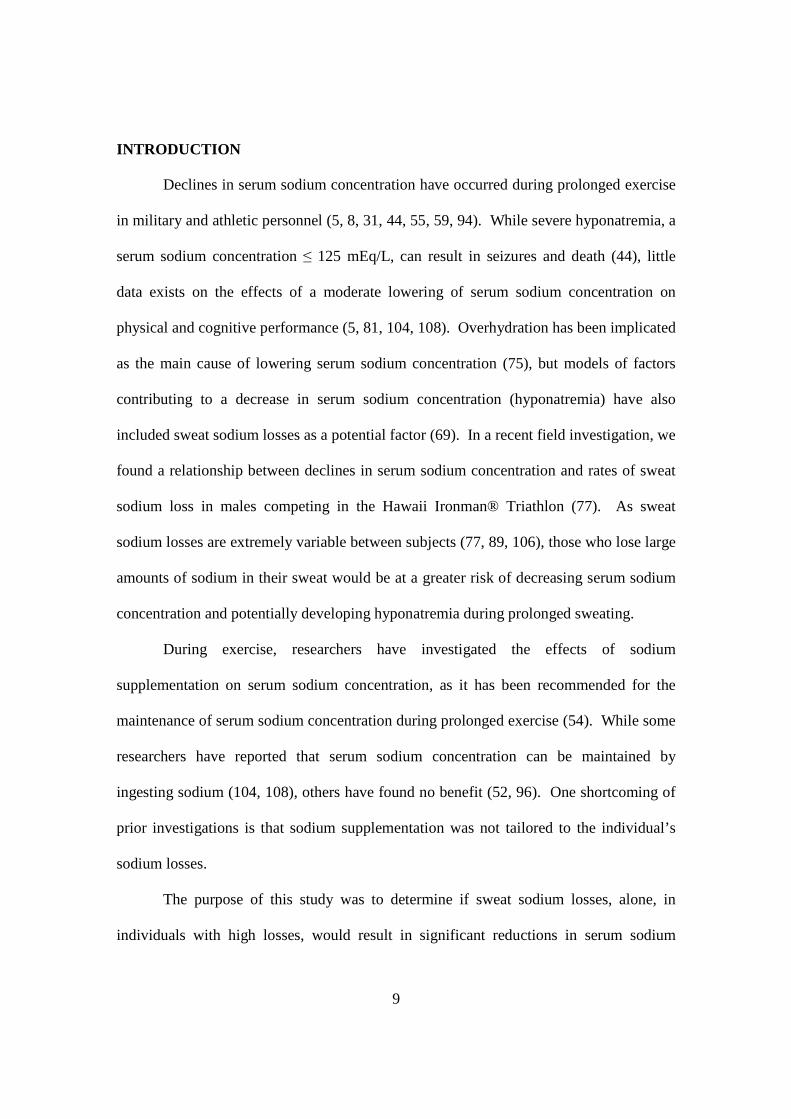
Declines in serum sodium concentration have occurred during prolonged exercise
in military and athletic personnel (5, 8, 31, 44, 55, 59, 94). While severe hyponatremia, a
serum sodium concentration ≤ 125 mEq/L, can result in seizures and death (44), little
data exists on the effects of a moderate lowering of serum sodium concentration on
physical and cognitive performance (5, 81, 104, 108). Overhydration has been implicated
as the main cause of lowering serum sodium concentration (75), but models of factors
contributing to a decrease in serum sodium concentration (hyponatremia) have also
included sweat sodium losses as a potential factor (69). In a recent field investigation, we
found a relationship between declines in serum sodium concentration and rates of sweat
sodium loss in males competing in the Hawaii Ironman® Triathlon (77). As sweat
sodium losses are extremely variable between subjects (77, 89, 106), those who lose large
amounts of sodium in their sweat would be at a greater risk of decreasing serum sodium
concentration and potentially developing hyponatremia during prolonged sweating.
During exercise, researchers have investigated the effects of sodium
supplementation on serum sodium concentration, as it has been recommended for the
maintenance of serum sodium concentration during prolonged exercise (54). While some
researchers have reported that serum sodium concentration can be maintained by
ingesting sodium (104, 108), others have found no benefit (52, 96). One shortcoming of
prior investigations is that sodium supplementation was not tailored to the individual’s
sodium losses.
The purpose of this study was to determine if sweat sodium losses, alone, in
individuals with high losses, would result in significant reductions in serum sodium

10
concentration during exercise in the heat. Additionally, we investigated the effects of
sodium chloride supplementation on maintaining serum sodium concentration as well as
the effects on physical and cognitive performance. We hypothesized that serum sodium
concentration would significantly decline during exercise in the heat and it would be
maintained with sodium chloride supplementation matching sweat sodium losses.
Furthermore, we hypothesized that physical and cognitive performance would decline
without sodium chloride supplementation and would be maintained or improved with
sodium chloride supplementation matching individual sweat sodium losses.
11
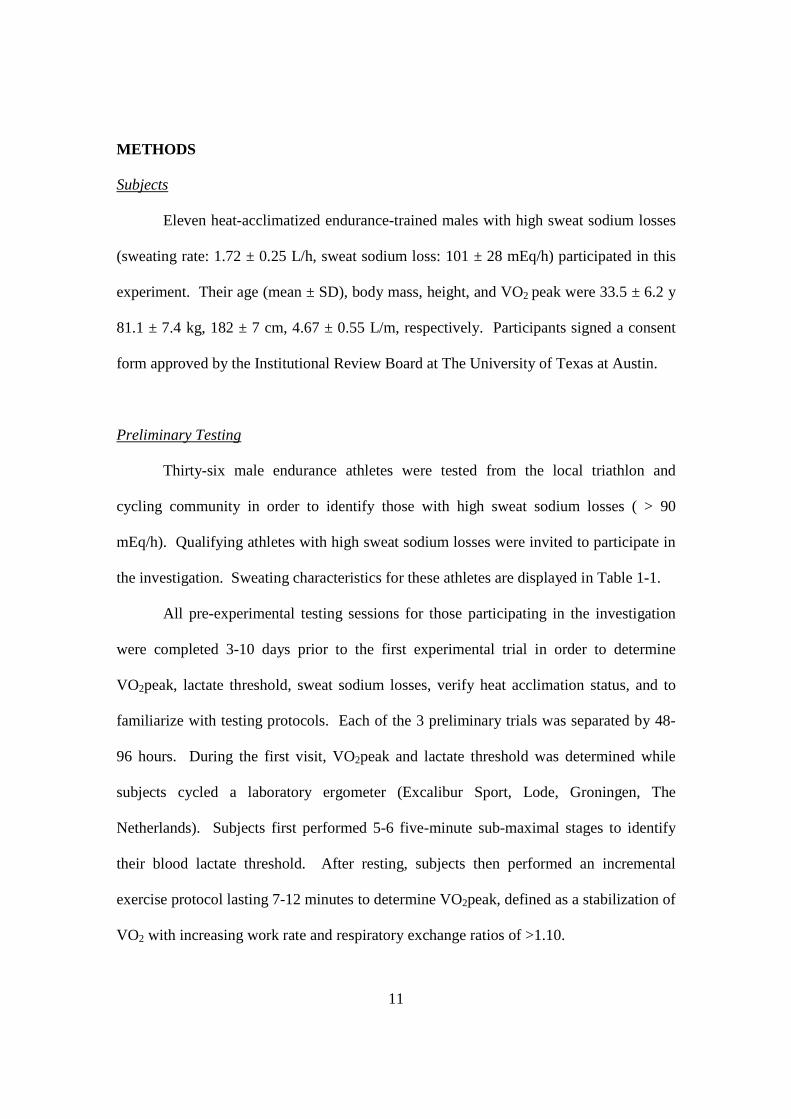
METHODS Subjects
Eleven heat-acclimatized endurance-trained males with high sweat sodium losses
(sweating rate: 1.72 ± 0.25 L/h, sweat sodium loss: 101 ± 28 mEq/h) participated in this
experiment. Their age (mean ± SD), body mass, height, and VO2 peak were 33.5 ± 6.2 y
81.1 ± 7.4 kg, 182 ± 7 cm, 4.67 ± 0.55 L/m, respectively. Participants signed a consent
form approved by the Institutional Review Board at The University of Texas at Austin.
Preliminary Testing
Thirty-six male endurance athletes were tested from the local triathlon and
cycling community in order to identify those with high sweat sodium losses ( > 90
mEq/h). Qualifying athletes with high sweat sodium losses were invited to participate in
the investigation. Sweating characteristics for these athletes are displayed in Table 1-1.
All pre-experimental testing sessions for those participating in the investigation
were completed 3-10 days prior to the first experimental trial in order to determine
VO2peak, lactate threshold, sweat sodium losses, verify heat acclimation status, and to
familiarize with testing protocols. Each of the 3 preliminary trials was separated by 48-
96 hours. During the first visit, VO2peak and lactate threshold was determined while
subjects cycled a laboratory ergometer (Excalibur Sport, Lode, Groningen, The
Netherlands). Subjects first performed 5-6 five-minute sub-maximal stages to identify
their blood lactate threshold. After resting, subjects then performed an incremental
exercise protocol lasting 7-12 minutes to determine VO2peak, defined as a stabilization of
VO2 with increasing work rate and respiratory exchange ratios of >1.10.

12
During each preliminary testing session, subjects completed a sweat measurement
exercise test in a temperature and humidity controlled environmental chamber (32 °C,
50 % RH) to ensure heat acclimation, and to measure sweating rate and sweat sodium
concentration. The test consisted of a 10-minute warm-up and then participants cycled
for 60 min (2 x 30 min) at 60 % of VO2peak. Body mass was measured following the
warm-up (Ohaus Champ, Model CQ250W, Pinebrook, NJ), at 30 min, and after the 60
min exercise bout for the determination of sweating rate. Regional sweat sodium
concentration was measured during both 30 min exercise periods by applying a 'sweat
patch', composed of 7.6 x 7.6 cm gauze sponge (Johnson & Johnson Medical, Arlington,
TX) and 10 x 12 cm Tegaderm® bandage (3M Health Care, St Paul, MN). It was applied
to the mid-posterior right forearm, right scapula, right mid-anterior thigh, and calf. These
regional sites were chosen as they are highly correlated with whole body sweat sodium
concentration (r = 0.82, 0.88, 0.89, and 0.93, respectively) (78). Prior to patch
application, the area was cleaned with 70 % isopropyl alcohol, rinsed with de-ionized
water, and dried with a contaminant-free cloth. When necessary, these areas were gently
shaved to allow for secure placement of the patches. The patches were applied after the
initial warm-up and again at 30 minutes of exercise, following towel drying and nude
body mass measurements. During the patch application the subjects remained seated on
the bicycle ergometer and the patches were removed immediately after 30 min, prior to
body mass measurement. This duration was chosen so that the patches would not
become saturated, which may alter the sweat sodium concentration (111). A subject’s
heat acclimatization was confirmed by <0.2 °C change in core temperature at the end of
the exercise bouts between preliminary tests. In addition to the sweat testing and heat

13
acclimation verification protocols, subjects completed neuromuscular maximal cycling
power, time trial, and cognitive testing protocols in order to become familiarized with the
testing procedures.
Experimental Trials
Approximately one week after the final pre-experimental session, each participant
participated in 2 randomized double-blind crossover trials, separated by 7-10 d. During
the experimental trials, subjects cycled for 3h on a stationary ergometer (Velotron,
Racermate, Inc, Seattle, WA) at 60 % of VO2peak in a warm environment (33.3 ± 0.2 °C
DB, 27.9 ± 1.8 °C WB, 54.0 ± 2.8 % RH, fan speed = 4.1 ± 0.6 m/s). A sucrose placebo
(PL) or sodium chloride (NA; 5.89 ± 1.48 g NaCl/h) was ingested via capsule to match
individual whole body sweat sodium losses measured during the preliminary testing.
Nutritional intake and exercise was recorded and repeated for 3 days prior to both
experimental trials. No activity was undertaken the day prior to the trial and only
moderate exercise was allowed 2-3 days prior. Sixteen ounces of water and a
standardized meal (474 ml, Vanilla Boost, Nestle) were consumed 2 hours prior to each
experimental trial. Body mass was maintained during the experimental trials by drinking
water (6.9 ± 0.7 L) with carbohydrate (0.8 g sucrose/kg/hr). A standard dose of
potassium chloride (0.85 g/h) was given to all subjects. Carbohydrate intake was equal
during both trials. Body mass was measured (Ohaus Champ, Model CQ25W, Pinebrook,
NJ) at 30-60 minute intervals to determine sweating rate. Four-site regional sweat
sodium concentration was measured from 30-60 and 120-150 min of exercise. Blood
samples (5 ml each) were taken via venipuncture in an antecubital vein, while subjects

14
were seated, prior to exercise, and after 60 min, 120 min, and 180 min of exercise. All
urine was collected during the trial for volume determination and sodium concentration
analysis. Core temperature was measured via a rectal thermistor (YSI 401) inserted 12cm
past the anal sphincter and heart rate was measured via telemetry (Polar, Finland) every
15 minutes during the exercise bout.
Immediately prior to and after the 3 h cycling bout, participants completed the
Stroop Color-Word Interference Task to assess cognitive function. It was performed in a
thermoneutral environment. A subset of subjects (n = 6) also completed a balance
assessment task by standing on a force plate for 7 minutes (9 – 30 second task intervals,
15 second rest interval) prior to the cognitive task. Participants also performed a
maximal neuromuscular cycling power test (Pmax) on an inertial load ergometer prior to
exercise, and after 60 min, 120 min, and 180 min of exercise. A 20 min cycling time trial
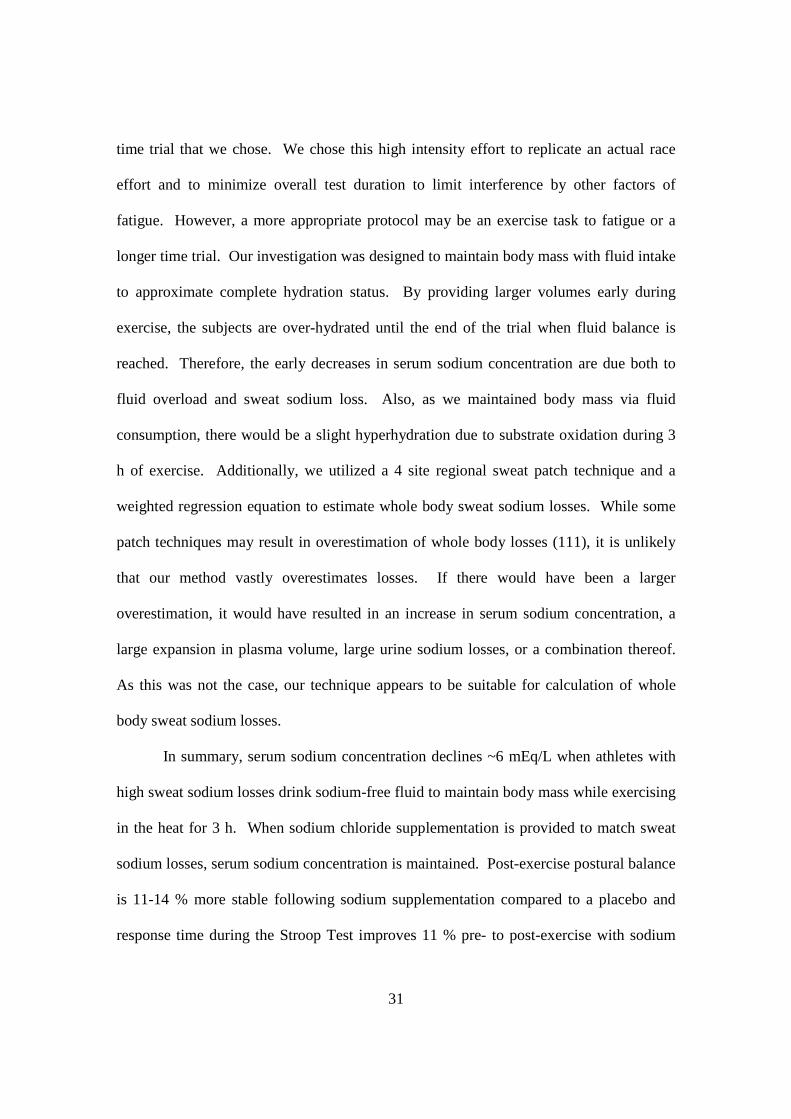
was also performed at the end of the testing session. Figure 1-1 displays the complete
protocol.
Experimental fluid/sodium chloride intake protocol
Fluid was consumed immediately prior to and during the first 2.5 hours of the
experimental exercise bout. A tapered drinking and sodium chloride intake protocol was
utilized to allow time for absorption by the end of the 3h exercise bout. A large bolus of
fluid (11.7 % of total) was consumed 15 min prior to exercise. Fluid was provided at 15
min intervals (8.7 % of total per 15 min) during exercise through 105 min. From 120-150
min of exercise smaller volumes were consumed (7.3, 6.7, and 5 % at 120, 135, and 150
min, respectively). No fluid or sodium was consumed during the final 30 min. The

15
identical fluid and sodium consumption protocol was followed during both experimental
trials.
Performance Testing
Cognitive testing
A modified computerized Stroop Color-Word Interference Test (LSA Stroop, FL)
consisted of five 45-second modules. The test difficulty level progressively increased
during each module. In short, the subjects were presented with a word (red, green, or
blue) on a screen. The color of the word either matched the meaning or was incongruent.
Subjects were prompted to select the color or the meaning depending on the module. In
the final module, the subjects selected the color or meaning based on if the word was
framed by a box. Accuracy and response time were recorded.
Balance Testing
The balance assessment task consisted of 3 trials of 3 stances while standing
barefoot on a 6 degree of freedom force plate (Bertec, Columbus, OH) which was
interfaced with a computer (Dell, Austin, TX). The stances included 2-leg stance with
feet together and eyes open, single leg stance with eyes open, and single leg stance with
eyes closed. During stances with eyes open, subjects (n = 6) looked at a spot at head
level. Each trial lasted 30 seconds and there was a 15 second break between each
repetition. The order of stance conditions was a randomized crossover design between
subjects and each subject completed the same order for both of their trials. The center-of-
pressure amplitude (ACOP) was measured in the anteroposterior (COPap) and

16
mediolateral (COPml) planes with custom software (Matlab, The Mathworks, Inc.,
Natick, MA).
Maximal neuromuscular cycling power (Pmax)
Maximal neuromuscular cycling power per pedal revolution, torque, and
revolutions per minute were measured on the PowerCycle prior to the 3 h ride and at 60
min, 120 min, and following the 3 h ride. Participants complete 4 all-out efforts lasting
3-4 seconds each during each testing session. Subjects remained seated on the ergometer
for a 1 min rest period between each effort. In short, flywheel angular velocity and
acceleration were determined by an optical sensor and micro-controller based computer
interface which measured time (± 1 µsec) and allowed power to be calculated
instantaneously every 3 degrees of crank revolution or averaged over one complete
revolution of the cranks (65). All powers expressed in this paper are average values over
one complete pedal cycle. As described in Martin et al. (65), maximal power was
calculated as the product of moment of inertia, velocity and angular acceleration of the
flywheel.
Cycling Time Trial
Subjects (n = 9) completed a 20 min time trial in a thermoneutral environment.
The workrate was fixed for the first 5 min at a power output that would elicit an oxygen
consumption that was 10 % above lactate threshold. After the first 5 min of the time trial,
subjects were free to alter the workrate at 30 sec intervals for the remaining 15 min. The

17
same researcher gave verbal encouragement during both time trials. Total work
completed during the 20 min time trial was calculated following the trial.
Measurements of gas exchange
During the VO2peak test, inspired air volume was measured with a pneumotach
(model 4813, Hans Rudolph, Shawnee, KS) and expired gasses were continuously
sampled from a 4 L mixing chamber (Vacumed, Ventura, CA) and were analyzed for
oxygen (S-3A/I, Ametek, Pittsburgh, PA) and carbon dioxide (CD-3A, Ametek,
Pittsburgh, PA). The analyzers were interfaced to a computer for calculation of the rate
of oxygen consumption and rate of carbon dioxide production (Max II, AEI
Technologies, Pittsburgh, PA).
Blood and urine measures
Hematocrit was measured in duplicate following microcentrifugation for 15
minutes. Hemoglobin was measured in duplicate using the cyanmethemoglobin method
(35). Plasma volume change was determined via the method of Dill and Costill (33).
Whole blood was stored at room temperature until clotting occurred and then was
centrifuged for 15 min. Serum and urine sodium concentration and osmolality were
measured via electrochemistry (NOVA 5, Waltham, MA) and freezing point depression
methods (3MO, Advanced Instruments, Needham Heights, MA), respectively. Urine
specific gravity was measured to ensure hydration status pre-exercise and throughout the
experimental trials.

18
Sweating rate and sweat sodium concentration analysis
Sweating rate (L/h) was calculated as the change in body mass, accounting for
fluid consumption and urine loss. Upon removal of the sweat patches, the gauze sponge
was immediately separated from each Tegaderm® bandage and placed into a plastic
syringe. The sweat content of the sponges in the syringes was “squeeze plunged” into
four 5 ml plastic test tubes and capped. Sweat electrolyte concentration was measured
with a Nova 5 Analyzer (Waltham, MA) with a CV of 2 % for sodium analysis. A
modified weighted equation was utilized to calculate whole body sweat sodium
concentration (sweat sodium concentration = 0.11([Arm]) + 0.276([Back]) +
0.299([Thigh]) + 0.315([Calf])) (8). Whole body sweat sodium loss was calculated as
whole body sweating rate x weighted sweat sodium concentration.
Statistical Analysis
Data are reported as mean and standard deviation. A paired student’s t-test and a
two way repeated measures analysis of variance was performed to analyze differences in
blood and sweating characteristics. The Bonferroni correction was utilized to adjust for
comparisons. Pearson product moment of correlation was used for relationships of
sweating characteristics. Significance was set at an alpha level of 0.05.

19
RESULTS
Body mass from pre- to post-exercise was successfully maintained in both trials
via fluid consumption (Table 1-2). Core temperature was similar between treatments
before (37.4 ± 0.4 vs. 37.3 ± 0.3 °C) and following 3 h of exercise in the heat (38.0 ± 0.2
vs. 38.1 ± 0.2 °C), PL vs. NA, respectively. Heart rate after 3 h of steady state exercise
was not significantly different between treatments (134 ± 8.3 vs. 137 ± 11.1 bpm, PL vs.
NA, respectively, p = 0.186).
Serum sodium concentration significantly declined from pre- to post-exercise in
PL (-6.4 ± 1.6 mEq/L, p = 0.001), but was maintained in NA when consuming sodium
to match sweat sodium losses (-1.0 ± 2.4 mEq/L), (Table 1-3). There were no differences
in pre-exercise serum sodium concentrations between treatments (p = 0.833). Serum
sodium concentration in PL was significantly lower than NA following 3 h of exercise
(137 ± 1.3 vs. 142 ± 2.5, PL vs. NA, respectively, p = 0.001). As serum sodium is a
major contributor to serum osmolality, osmolality also significantly declined in PL (290
± 3.0 vs. 276 ± 2.4, pre- vs. post-exercise, respectively, p = 0.001), but was maintained in
NA (289 ± 2.7 vs. 286 ± 5.2, pre- vs. post-exercise, respectively, p = 0.284; Table 1-3).
Furthermore, hematocrit significantly increased in PL, but was maintained in NA.
There was a significant difference in hematocrit between treatments at 180 min (p =
0.004; Table 1-3). Hemoglobin concentration was not significantly different between
treatments (Table 1-3). There was a significant difference in mean corpuscular
hemoglobin concentration (MCHC) between treatments at 180 min (p = 0.007; Table 1-3)
which would indicate cell swelling in PL vs. NA. Plasma volume change from pre to
20
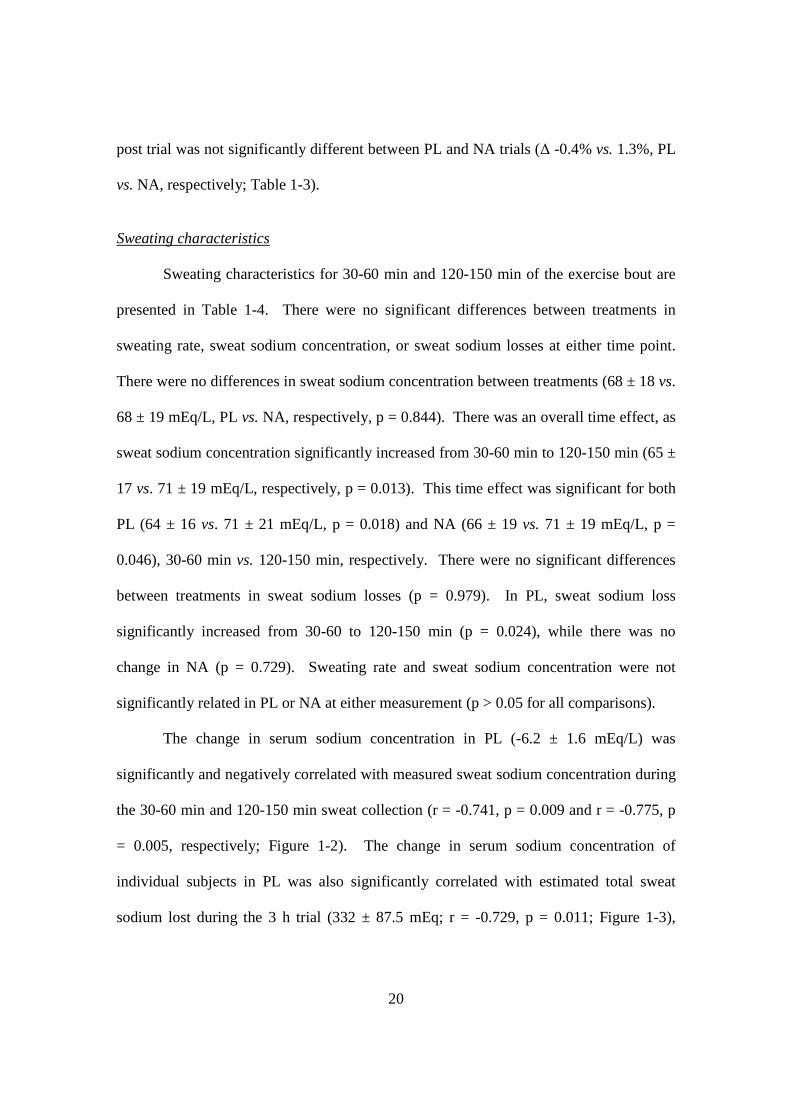
post trial was not significantly different between PL and NA trials (∆ -0.4% vs. 1.3%, PL
vs. NA, respectively; Table 1-3).
Sweating characteristics
Sweating characteristics for 30-60 min and 120-150 min of the exercise bout are
presented in Table 1-4. There were no significant differences between treatments in
sweating rate, sweat sodium concentration, or sweat sodium losses at either time point.
There were no differences in sweat sodium concentration between treatments (68 ± 18 vs.
68 ± 19 mEq/L, PL vs. NA, respectively, p = 0.844). There was an overall time effect, as
sweat sodium concentration significantly increased from 30-60 min to 120-150 min (65 ±
17 vs. 71 ± 19 mEq/L, respectively, p = 0.013). This time effect was significant for both
PL (64 ± 16 vs. 71 ± 21 mEq/L, p = 0.018) and NA (66 ± 19 vs. 71 ± 19 mEq/L, p =
0.046), 30-60 min vs. 120-150 min, respectively. There were no significant differences
between treatments in sweat sodium losses (p = 0.979). In PL, sweat sodium loss
significantly increased from 30-60 to 120-150 min (p = 0.024), while there was no
change in NA (p = 0.729). Sweating rate and sweat sodium concentration were not
significantly related in PL or NA at either measurement (p > 0.05 for all comparisons).
The change in serum sodium concentration in PL (-6.2 ± 1.6 mEq/L) was
significantly and negatively correlated with measured sweat sodium concentration during
the 30-60 min and 120-150 min sweat collection (r = -0.741, p = 0.009 and r = -0.775, p
= 0.005, respectively; Figure 1-2). The change in serum sodium concentration of
individual subjects in PL was also significantly correlated with estimated total sweat
sodium lost during the 3 h trial (332 ± 87.5 mEq; r = -0.729, p = 0.011; Figure 1-3),

21
which was calculated as actual sweating rate and regional sweat sodium concentrations
from the 2 sweating analysis tests (30-60 min and 120-150min). As expected, sweat
sodium concentration was not significantly correlated with change in serum sodium
concentration when supplementing with sodium to match sweat sodium losses (r = 0.007,
p = 0.984 and r = 0.277, p = 0.410, 30-60 and 120-150 min tests, respectively) (Figure 1-
4).
Urine volume/Urine sodium loss
Total urine volume was not significantly different between treatments (1617 ±
791 vs. 2018 ± 697 ml, PL vs. NA respectively, p = 0.092). There were also no
significant differences between treatments in total urinary sodium loss during the 3 h trial
(22.3 ± 17.6 vs. 38.2 ± 6.5 mEq, PL vs. NA respectively, p = 0.083). However, at the 180
minute void, urinary sodium loss was significantly lower in PL (0.8 ± 1.58 vs. 3.5 ± 3.1
mEq, PL vs. NA, p = 0.016, n = 10).
Performance Tests Maximal Power
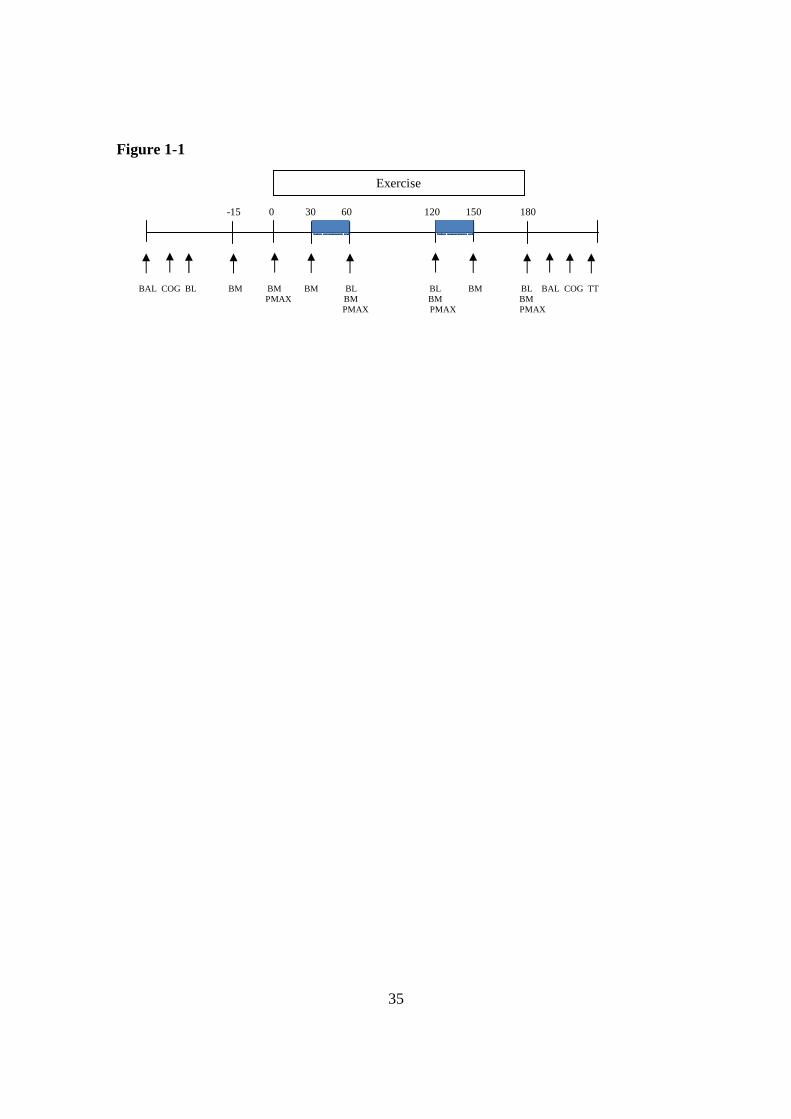
Maximal power (Pmax) significantly declined from pre- to post-exercise. Pmax
significantly declined during PL (p = 0.012), but the change was not significantly lower
during NA (p = 0.057; Table 1-5). Torque at Pmax also significantly declined from pre-
to post-exercise in PL (p = 0.045), but not in NA (p = 0.166). There were no significant
differences in velocity (revolutions per minute) at Pmax during either treatment.

22
Time Trial
Total work completed following the initial fixed 5 min effort was ~4 % higher
during NA vs. PL (27.17 ± 4.93 vs. 26.21 ± 3.48 kJ, respectively). However, this
difference in work was not statistically significant (p = 0.307). Average power output
during the self-selected 15 min effort was 11 watts higher during NA vs. PL (302 ± 55 vs.
291 ± 39 watts, p = 0.307, respectively). The pattern of work output during the
performance task is displayed in Figure 1-5.
Cognitive data
Comparing before and after the 3 h exercise bout, subjects significantly improved
response time performance on the Stroop Color-Word Interference Test in NA (p =
0.009) but not in PL (p = 0.597) (Table 1-6). Pre- and post-tests between trials were not
significantly different between treatments (p = 0.189, p = 0.305, pre and post tests,
respectively), nor was error rate between treatments (p = 0.752)
Balance Data
The center of pressure displacement, in the mediolateral direction (ACOPml)
post-trial for the 1 foot, eyes open stance was significantly greater in PL vs. NA (36.20 ±
14.90 vs. 30.94 ± 13.71 mm, p = 0.044) which indicates more postural sway in the
mediolateral direction. Post-exercise mean anterior-posterior displacement (ACOPap)
was also higher for PL vs. NA, but the increased displacement was not stastically
different (45.9 ± 18.50 vs. 41.5 ± 16.4 mm, respectively, p = 0.092). A representative
sample of COP tracings is presented in Figures 1-6A and 1-6B which exhibits the
23
displacement (sway) of the COP measured in meters traverses further along the x-axis
(mediolateral) direction in the PL vs. NA.

24
DISCUSSION
Serum sodium concentration declines during prolonged exercise
While exercising in the heat for 3 h and maintaining body mass via sodium-free
fluid consumption, serum sodium concentration significantly decreased by ~6 mEq/L in
men that lose high amounts of sodium in their sweat. To our knowledge this is the first
experimental reporting of a moderate decline in serum sodium concentration solely due to
measured sweat sodium losses. It also provides support to the models proposed by
Montain and colleagues (69, 70) which includes excessive sweat sodium losses as a
contributing factor to reductions in serum sodium concentration. Our protocol was
designed to maintain body mass via fluid replacement without replacing sodium lost in
the sweat in order to elicit a decrease in serum sodium concentration. As serum sodium
concentration is a balance of sodium content and fluid volume, serum sodium
concentration declined as sodium content was lost via sweat while fluid status was
maintained. This is also in agreement with previous reports of prolonged exercise in the
heat while supplementing with low sodium or sodium-free fluid. In an investigation by
Vrijens and Rehrer, males cycling for 3 h in the heat decreased serum sodium
concentration by ~4 mEq/L, while drinking water (108). In another investigation of
prolonged cycling with very low sodium ingestion (5 mEq/L), serum sodium
concentration declined 3 mEq/L (85). Potential reasons for a larger decline in serum
sodium concentration is our subjects were pre-selected based on their high sweat sodium
losses. While this cannot be confirmed as sweat sodium concentration was not measured
in the investigation by Vrijens and Rehrer (108), our subjects had twice as high total
sweat sodium losses than in the study by Sanders et al (85). However, comparisons

25
should be made with caution, as sweat sodium concentration was only measured at 1 site
in their study, instead of 4 sites, as in the present investigation. Another potential reason
for a larger decline in serum sodium concentration in our study compared to the studies
of Vrijens and Sanders may be due to a slightly different hydration status, as our subjects
maintained body mass. In the other studies, the subjects slightly decreased body mass by
~ 1%. The decreased fluid volume would result in a higher serum sodium concentration.
Sodium chloride supplementation maintains serum sodium concentration
An important finding is that serum sodium concentration was prevented from
falling by oral sodium chloride supplementation in these “high salt sweaters”. This
finding is significant, as this is the first investigation to our knowledge that matched
sodium chloride ingestion to sweat sodium loss, thus preventing the decline in serum
sodium concentration. In previous investigations, researchers supplemented subjects
with different amounts of sodium with varying degrees of success in altering serum
sodium concentration. In a field study by Speedy et al., subjects ingested an additional 6
grams of oral sodium supplementation distributed over 12.5 hours which resulted in a
significant increase of 1.5 mEq in serum sodium concentration (96). Non-supplemented
athletes with similar changes in body mass did not have any change in serum sodium
concentration. In another field study during an ultra-distance triathlon, athletes were
provided with sodium chloride or placebo pills (52). The investigators reported a non-
significant, 1 mEq/L increase in the supplementation group and no change in the control
group. However, only a small amount of additional sodium chloride was ingested by the
supplementation group, 3.6 grams sodium over 12.6 hours. Food and fluid consumption

26
during the race was not controlled in either of these field experiments, thus total sodium
consumption cannot be determined. Additionally, no measurements were made of sweat
sodium losses. As sweat sodium losses are highly variable (77, 89, 106), fluid and
sodium balance cannot be estimated with accuracy. In the previously mentioned study by
Sanders et al. (85), serum sodium concentration only slightly declined with
supplementation of 5 mEq/L and was slightly better maintained with 100 mEq/L, which
may be due to the small sweat losses in the temperate environment (20C) or fluid
compartment shifts. In support of our findings, Twerenbold et al. also found a better
maintenance of serum sodium concentration with high vs. low sodium intake during
exercise (104), as did Vrijens and Rehrer (108). However, there was still a small decline
in serum sodium concentration while supplementing with sodium (~2 mEq/L) (104). A
potential reason for our protocol successfully maintaining serum sodium concentration is
that we provided a tapered fluid and sodium ingestion protocol by providing larger
volumes early during exercise, smaller volumes as exercise progressed, and no fluid
during the final 30 minutes of exercise to allow for fluid and sodium equilibration.
Sweat sodium concentration and extracellular sodium content
Despite losing ~13 % of estimated ECF sodium content (~300 mEq; ECF sodium
content ~2350 mEq for 81kg male) or matching sweat sodium losses, sweat sodium
concentration was not different between treatments (p = 0.844). The effects of daily
sodium intake on sweat sodium concentration in salt depleted versus high intake have
been previously investigated during heat acclimation (9, 66), but an acute effect on sweat
sodium losses has not been thoroughly investigated. In an investigation by Sanders et al

27
(85), sweat sodium losses tended to decline (~20 %) during exercise as sodium
supplementation increased during exercise. However, sweating rate similarly declined,
thus comparisons cannot be made between investigations, as our sweating rate was not
different between treatments.
An interesting finding was that sweat sodium concentration increased ~7-10 %
from 30-60 minutes to 120-150 minutes with both treatments, which cannot be explained
by our investigation. The alterations in sweat sodium are not due to a change in whole
body sweating rate, as sweating rate was not significantly different between time points
and sweat sodium concentration was not correlated with whole body sweating rate. An
unlikely possibility is that the local sweating rate increased while the whole body
sweating rate did not, as glandular sweating rate and sweat sodium concentration have a
positive correlation (87). Another possibility is that the sweat glands fatigued resulting in
a decreased reabsorption capability (103). Lastly, while the process of cleaning and
drying the area where sweat was sampled from was the same for both measurements, it is
possible a saturated stratum corneum resulted in a decreased glandular reabsorption.
However, a wet stratum corneum has been shown to decrease sweating rate (18), which
may result in a lower sweat sodium concentration, which was not the case.
While ingesting a placebo, the change in serum sodium concentration was
significantly negatively correlated with sweat sodium concentration (p = 0.005, Figure 1-
2) and total sweat sodium lost among the individual subjects (p = 0 .011, Figure 1-3). In
a previous field study we conducted during an ultra-endurance triathlon, changes in
serum sodium concentration were partially accounted for by rates of sweat sodium losses
in males (77). Together both of our studies provide support for sweat sodium losses as a

28
factor in altering serum sodium concentration during exercise in the heat in males. While
this finding has been included in hypothetical models of factors which may decrease
serum sodium concentration, and potentially result in hyponatremia (69, 70), our
investigations are the first to our knowledge that have directly found this relationship
during prolonged exercise. Interestingly, in our previous field investigation, this
relationship was not present in the female athletes. We postulated that it was due to the
females more closely matching their sweat sodium losses with sodium ingestion. The
current investigation also provides support for that hypothesis, as there is no relationship
between sweat sodium losses and serum sodium concentration while supplementing with
sodium matching sweat sodium losses (r = 0.007, p = 0.984 and r = 0.277, p = 0.410, at
30-60 and 120-150 min, respectively; Figure 1-4).
Sodium chloride supplementation and performance
Our findings of improved cognition and postural balance following exercise with
sodium chloride supplementation vs. a placebo are similar to previous reports of elderly
patients with large declines in serum sodium concentration who were admitted to
emergency departments (81). Of 122 chronic hyponatremic elderly patients, 21 % were
admitted with falls, indicating decreased balance. When compared to 244 matched
controls also admitted to the emergency department, the hyponatremic patients had 4-fold
more falls than the controls. Sixteen of the hyponatremic patients participated in
cognitive testing and 12 participated in postural examination prior to and after treatment.
In a small subset of patients, mean response times in cognitive tests were significantly
slower (~9 %) when presented with asymptomatic hyponatremia compared to after

29
treatment. Balance, measured as center of pressure displacement during 3 steps in
tandem, was also significantly worse, as the subjects had a 28 % greater displacement in
the center of pressure. While our 10-17 % difference in post-exercise displacement
between treatments was not as large as the hospital patients, our subjects only had a
difference in post-test serum sodium concentration of ~5 mEq/L compared to the elderly
patients who had a change of ~10 mEq/L. Additionally, our balance assessment was of
young athletes in a static stance compared to the walking gait assessment in the elderly
patients.
In our investigation response time during the Stroop Test was unchanged pre- to
post-exercise when serum sodium declined in the PL group. However, response time
significantly improved from pre- to post-exercise when sodium was given to maintain
serum sodium concentration. An improvement in response time is similar to prior reports
of athletes before and after a time trial lasting ~1 h (56). The authors concluded the
improvement following strenuous exercise was either due to an increase in activation or
possibly a placebo effect of exercise. As our investigation was double-blind, an
increased arousal state may be a more likely cause for the 10% improvement in response
time. This increased arousal may have been negated by the decline in serum sodium
concentration during the placebo treatment.
Sodium supplementation resulted in a non-significant decline in maximal
sprinting power and torque while power and torque declined significantly when serum
sodium concentration was allowed to fall. However, time trial performance was not
statistically significantly different between treatments, although subjects completed 4 %
more work during the time trial. To our knowledge this is the only study undertaken that

30
matched sweat sodium losses with sodium intake, but others researchers have
investigated performance with high and low amounts of sodium chloride intake during
endurance exercise. Vrijens and Rehrer found a significant relationship between serum
sodium concentration and exercise duration while cycling in the heat but the beverages
were not isocaloric which could confound the interpretation and time to fatigue was not
significantly different (108). Twerenbold et al found no difference in 4 h time trial
performance in female runners when consuming 4 L of fluid with no, moderate, or high
sodium content. However, the field study occurred in drastically different environmental
conditions and ambient temperature had more of an effect on running performance than
serum sodium concentration (104).
Our investigation is not without limitations. With only 3 h of exercise in the heat
serum sodium concentration declined by ~6 mEq/L and resulted in decrements in balance
and cognitive performance and small decrements in maximal sprint cycling power
compared to when serum sodium concentration was maintained. It is possible that even
further declines in performance would occur during longer duration exercise if prolonged
sweat sodium losses are not replaced resulting in a further decrease in serum sodium
concentration. As it is not ethical to induce hyponatremia, our experiment could not fully
investigate the effects of large declines in serum sodium concentration on performance.
While we did find small differences in physical performance between treatments, it is
plausible that we would find larger differences with a larger decline in serum sodium
concentration or possibly with a different endurance task. As declines in serum sodium
concentration altered cognitive function, it is also possible that motivation may be
altered, which may be more prevalent over a longer exercise task, instead of the 20 min
31
time trial that we chose. We chose this high intensity effort to replicate an actual race
effort and to minimize overall test duration to limit interference by other factors of
fatigue. However, a more appropriate protocol may be an exercise task to fatigue or a
longer time trial. Our investigation was designed to maintain body mass with fluid intake
to approximate complete hydration status. By providing larger volumes early during
exercise, the subjects are over-hydrated until the end of the trial when fluid balance is
reached. Therefore, the early decreases in serum sodium concentration are due both to
fluid overload and sweat sodium loss. Also, as we maintained body mass via fluid
consumption, there would be a slight hyperhydration due to substrate oxidation during 3
h of exercise. Additionally, we utilized a 4 site regional sweat patch technique and a
weighted regression equation to estimate whole body sweat sodium losses. While some
patch techniques may result in overestimation of whole body losses (111), it is unlikely
that our method vastly overestimates losses. If there would have been a larger
overestimation, it would have resulted in an increase in serum sodium concentration, a
large expansion in plasma volume, large urine sodium losses, or a combination thereof.
As this was not the case, our technique appears to be suitable for calculation of whole
body sweat sodium losses.
In summary, serum sodium concentration declines ~6 mEq/L when athletes with
high sweat sodium losses drink sodium-free fluid to maintain body mass while exercising
in the heat for 3 h. When sodium chloride supplementation is provided to match sweat
sodium losses, serum sodium concentration is maintained. Post-exercise postural balance
is 11-14 % more stable following sodium supplementation compared to a placebo and
response time during the Stroop Test improves 11 % pre- to post-exercise with sodium

32
chloride supplementation while there is no change when serum sodium concentration
declines. Additionally, the declines in maximal cycling power are not significant while
supplementing with sodium chloride, but maximal power is significantly lower when
serum concentration decreases. Furthermore, acute sodium chloride supplementation and
rapid changes in serum sodium concentration over 3 h do not alter sweat sodium
concentration or sweat sodium losses during exercise. Therefore, serum sodium
concentration significantly declines during prolonged exercise in males with high sweat
sodium losses, but sodium supplementation matching sweat sodium losses will maintain
serum sodium concentration and provide beneficial effects on physical and cognitive
performance.

33
FIGURE LEGENDS
Figure 1-1. Testing protocol including preliminary, 3h exercise at 60% VO2peak, and
post tests. BAL – balance, COG – cognitive, BL – blood sample, Pmax – maximal power
test, BM – body mass, sweat testing
Figure 1-2. Relationship between sweat sodium concentration (mEq/L) and change in
serum sodium concentration (mEq/L) at 30-60 min (y = -0.0706x-1.6478; r2=0.55, p =
0.009) and 120-150 min (y = -0.0571x-2.1351; r2 = 0.60, p = 0.005) sweat loss
measurements while ingesting a placebo (n = 11).
Figure 1-3. Relationship (y = -0.0129x - 1.8879; r2= 0.53, p = 0.011) between total
sweat sodium (mEq) lost during 3 h of exercise at 60% VO2peak and change in serum
sodium concentration (mEq/L) while ingesting a placebo (n = 11).
Figure 1-4. Relationship between sweat sodium concentration (mEq/L) and change in
serum sodium concentration (mEq/L) at 30-60 min (y = 0.0009x-1.1033; r2=0.00, p =
0.984) and 120-150 (y = 0.0352x-3.5322; r2 = 0.08, p = 0.410) sweat loss measurements
while supplementing with sodium chloride matching sweat sodium losses (n = 11).
Figure 1-5. Pattern of power output (watts) during 20 min time trial performance
starting at 10% above lactate threshold following 3 h of exercise at 60% VO2peak in the
heat with (NA) and without (PL) sodium chloride supplementation matching sweat

34
sodium losses (n = 9). Subjects were free to change the workrate following 5 minutes of
cycling.
Figures 1-6A and 1-6B. Representative force plate tracings of the center of pressure
(COP) for subject 2 following 3h of exercise in the heat at 60% VO2peak with (NA; 1-
6A) and without (PL; 1-6B) sodium chloride supplementation matching sweat sodium
losses (n = 6).
35
Figure 1-1
-15 0 30 60 120 150 180
Exercise
BAL COG BL BM BM BM BL BL BM BL BAL COG TT PMAX BM BM BM PMAX PMAX PMAX

36
Figure 1-2
R2 = 0.55
R2 = 0.60

37
Figure 1-3

38
Figure 1-4

39
Figure 1-5

40
Figure 1-6A
Figure 1-6B

41
Table 1-1. Sweating characteristics for male endurance athletes (n = 36) cycling in the heat (31.8 ± 2.8 °C DB, 55.3 ± 8.2 % RH) at 70-80% HRmax. Values are mean ± SD.
Sweating Rate (L/h) 1.61 ± 0.55 Sweat Sodium Concentration (mEq/L) 51.4 ± 20.8 Sweat Sodium Loss (mEq/h) 87.4 ± 53.8

42
Table 1-2. Pre and post body mass during 3h cycling in the heat at 60% VO2peak with (NA) and without (PL) sodium supplementation matching sweat sodium losses (n = 11). Values are mean ± SD.
PL NA
Pre Body Mass (kg) 81.1 ± 7.5 81.3 ± 7.7 Post Body Mass (kg) 81.4 ± 7.5 81.3 ± 7.7

43
Table 1-3. Blood markers measured before and after 3h cycling at 60% VO2peak in the heat with (NA) and without (PL) sodium supplementation matching sweat sodium losses (n = 11). Values are mean ± SD.
Pre-exercise Post-exercise p value
Serum Sodium (mEq/L) PL 143.5 ± 1.79 137.1 ± 1.29* 0.001 NA 143.4 ± 1.41 142.4 ± 2.54† 1.000 Serum Osmolality PL 290 ± 3.0 276 ± 2.4* 0.001 (mOsm/L) NA 289 ± 2.7 286 ± 5.2† 0.284 Hematocrit (%) PL 45.7 ± 2.2 47.1 ± 2.5* 0.040 NA 45.7 ± 3.5 44.8 ± 3.0† 0.348 Hemoglobin (mg/dL) PL 14.9 ± 1.4 15.0 ± 0.8 1.000
NA 14.8 ± 1.4 14.9 ± 1.2 1.000 MCHC (g Hb/dL) PL 32.9 ± 2.8 31.9 ± 1.4 1.000 NA 32.6 ± 2.1 33.2 ± 2.1† 0.561
* Significantly different from 30-60 min, p < 0.05. † Significantly
different from PL.

44
Table 1-4. Sweating characteristics from 30-60 min and 120-150 min of the 3h exercise bout at 60% VO2peak in the heat (n = 11). Values are mean ± SD
30-60 min 120-150 min
Sweating Rate (L/h) PL 1.68 ± 0.26 1.74 ± 0.24 NA 1.76 ± 0.21 1.67 ± 0.11
Sweat Sodium Concentration (mEq/L) PL 64.2 ± 16.3 70.8 ± 21.1*
NA 65.8 ± 19.0 70.6 ± 18.9*
Sweat Sodium Loss (mEq/h) PL 109.0 ± 36.7 123.2 ± 39.8* NA 115.5 ± 35.6 117.1 ± 30.2
* Significantly different from 30-60 min, p < 0.05.
45
Table 1-5. Maximal power per revolution, and torque and velocity at maximal power before and after 3h cycling at 60% VO2peak in the heat with (NA) and without (PL) sodium chloride supplementation matching sweat sodium losses (n = 11). Values are mean ± SD. Pre-Exercise Post-Exercise
Pmax (watts) PL 1253 ± 142 1201 ± 164* NA 1242 ± 142 1207 ± 149 Torque (Nm) PL 98.4 ± 10.8 94.6 ± 12.4* NA 98.8 ± 10.5 95.4 ± 9.7 Velocity (rev/min) PL 121.1 ± 7.2 120.5 ± 5.1 NA 121.0 ± 6.2 120.5 ± 5.5
*Significantly different from pre-exercise, p < 0.05.

46
Table 1-6. Mean response time for a correct response during Stroop Color-Word Interference Task before and after 3h cycling at 60% VO2peak (n = 11). Values are mean ± SD.
NA PL
Pre-exercise Response Time (sec) 1.22 ± 0.22 1.14 ± 0.14
Post-exercise Response Time (sec) 1.09 ± 0.21* 1.16 ± 0.25
p value 0.009 0.597 *Significantly different from pre-exercise, p < 0.05.

47
Chapter IV: Study 2
Effects of Oral Sodium Chloride Supplementation on Blood Volume, Stroke
Volume, and Sweat Sodium Concentration During Exercise in Untrained Males

48
ABSTRACT
Plasma volume expansion via intravenous infusion increases stroke volume in
untrained men by 10-15%. Oral sodium supplementation is a plausible alternative for
increasing plasma volume. The purpose of this investigation was to determine the effects
of sodium chloride supplementation on plasma, blood, and stroke volume at rest and
during exercise in young healthy untrained/recreationally active males. We also
investigated the effects of sodium chloride supplementation on sweat sodium
concentration during exercise in the heat. Following 3 d of supplementation with sodium
chloride (NA; 3.5 mEq sodium/kg body mass/d) or a placebo (PL) subjects exercised at
60% VO2peak for 15min. Plasma volume (PV) and blood volume (BV) increased with
NA compared to PL at rest (5.9±7.6% and 3.2±4.4%, PV and BV respectively), during
exercise at 60% VO2peak (8.6±5.2% and 4.3±3.1%, PV and BV, respectively), and post-
exercise (5.0±4.1% and 2.9±2.8%, PV and BV, respectively) vs. PL. Stroke volume
increased ~10% during exercise with NA vs. PL (139±27.2 ml/beat vs. 126±23.7ml/beat,
respectively, p=0.004). Cardiac output increased ~8% during exercise with NA
(21.0±3.1 vs. 19.4±2.6, NA vs. PL, respectively, p=0.013). Mean arterial pressure was
not different in NA vs. PL during exercise (p=0.548). Sweat sodium concentration was
significantly higher during exercise in the heat in NA vs. PL (70.4±19.5 vs. 64.5±21.7
mEq/L, p=0.044, respectively). In conclusion, sodium chloride supplementation
increases plasma, blood, and stroke volume during exercise in healthy untrained males.
Sweat sodium concentration is higher during exercise in the heat following sodium
supplementation compared to a placebo.

49
INTRODUCTION
One of the many adaptations to endurance training is increased stroke volume
during exercise (97, 112). The higher stroke volume in trained versus untrained
individuals is partially due to an expanded plasma and blood volume (57, 63). The
contribution of plasma volume on stroke volume in trained and untrained subjects has
been investigated by intravenous infusion (57, 63). However, intravenous infusion is an
invasive technique. Oral sodium chloride ingestion has also been used to increase plasma
volume resulting in an increased stroke volume at rest in young healthy adults (28, 29,
50, 107). When comparing a high vs. low sodium diet, healthy older males (~57 y)
increased plasma and stroke volume during rest and also during a ramp exercise protocol
(29). However, to our knowledge, this method of raising blood volume and stroke
volume via sodium ingestion has not been investigated during steady state exercise in
young healthy individuals.
Sweat sodium concentration and sweat sodium losses in the heat are highly
variable between individuals (77, 89). In our prior investigation of 71 male and female
subjects, we found a coefficient of variation (standard deviation/mean) of ~31 % in sweat
sodium concentration and ~54 % in sweat sodium losses (77). While the reasons for the
variability are not entirely clear, daily sodium intake has been implicated as a potential
factor (23). The effects of daily sodium chloride ingestion on altering sweat sodium
concentration have been investigated during the heat acclimatization process (4, 7, 23,
66). However, as sweat sodium concentration is also reduced with heat acclimatization,
the effects of sodium chloride intake on sweat sodium concentration alone cannot be
determined from these investigations.

50
The purpose of this investigation was to determine if 3 days of increased oral
sodium chloride ingestion would increase blood volume and stroke volume at rest and
during exercise in young healthy untrained/recreationally active males. We also
investigated the effects of sodium chloride ingestion on sweat sodium concentration
during exercise in non-acclimatized males.

51
METHODS
Subjects
The nine participants for this investigation were young, untrained or
recreationally active males. Their age (mean ± SD), body mass, height, and VO2peak
were 27 ± 6 y, 76.0 ± 7.9 kg, 175.4 ± 9.6 cm, 3.85 ± 0.35 L/m, respectively. Testing was
undertaken in early spring so that the participants were not heat acclimatized which is
known to increase plasma volume (7, 9, 109). Participants signed a consent form
approved by the Institutional Review Board at The University of Texas at Austin.
Preliminary and Familiarization Testing
In order to obtain baseline measures and ensure that participants were adequately
prepared and familiarized with the experimental trials, preliminary testing was
undertaken 3 to 7 days prior to the first experimental trial. During the preliminary
session VO2peak and the sub-maximal VO2 to workload relationships were determined.
Volume and gas measurements were made during 3 5-minute sub-maximal stages
followed by an incremental exercise protocol lasting 7-12 minutes to determine VO2peak.
Peak oxygen consumption was defined as a stabilization of VO2 with increasing work
rate and respiratory exchange ratios of >1.10. Participants were also familiarized with
the acetylene wash-in technique for the determination of cardiac output.
Dietary Protocol
Participants maintained a dietary intake record for 3 days prior to the first
experimental session and repeated it for the second session. Participants were also

52
instructed to refrain from eating high sodium containing foods during this time.
Participants drank 30 ml of fluid per kilogram body per day for the 3 days leading up to
the experimental trials. Subjects also performed an overnight fast ( ≥ 12 h) and
consumed an additional 500 ml of water 2 h prior to each experimental session.
Experimental Protocol
Participants ingested either a sodium chloride supplement (NA, 3.5 mEq
sodium/kg body mass per day, ~ 15 g sodium chloride per day) or a placebo (PL, sucrose)
via capsule in addition to their normal diet for 3 d prior to experimental sessions.
Approximately 7 to 11 days separated the randomized, double-blind treatments to serve
as a washout period. Following the supplementation period and the overnight fast,
participants performed a bout of upright cycling exercise for 15 min at 60 % of VO2peak
in a thermoneutral environment (22 ˚C, no fan) in order to evaluate cardiovascular
function. Core temperature via rectal thermistor (YSI 401) and skin temperature via
surface thermistor (YSI 409A) were continuously recorded during the trial and averaged
over 1 min at 5 min intervals. Cardiac output via acetylene wash-in (60) was measured at
5, 8, 11, and 14 minutes during exercise, and 5 and 8 minutes post-exercise. Stroke
volume was calculated from cardiac output and actual heart rate (Suunto, Finland) during
measurement (SV = CO/HR). Blood pressure (Tango+) was measured at 7 and 13 min of
exercise, and 6 min post-exercise. Blood samples were taken via an indwelling venous
catheter prior to beginning exercise, at 5, 10 and 15 min of exercise and 7 min post-
exercise in order to measure hematocrit and hemoglobin, and thus calculate changes in

53
blood volume. Pre-exercise urine specific gravity was measured to ensure hydration
status (USG < 1.020).
Sweating Analysis Protocol
Following the cardiovascular testing in thermoneutral conditions, participants
completed a sweating analysis protocol in the heat to measure sweat sodium
concentration. Participants exercised for a total of 45 min in warm conditions (35 ˚C dry
bulb, 50 % relative humidity). Subjects cycled for 15 min at 50% of VO2peak without
fan cooling to elicit sweating. Following the 15 min warm-up subjects cycled a
stationary ergometer for 30 minutes at 50% of VO2peak with fan cooling from the front
and back (1.5 ± 0.2 m/s and 2.1 ± 0.2 m/s, respectively). Whole body sweating rate,
calculated via nude body mass changes, and regional sweat sodium concentration of the
forearm, upper back, mid-anterior thigh, and calf, utilizing a regional sweat patch
technique (77, 89), were measured during the 30 min testing period. Participants
consumed 400 mL of water during the exercise bout to prevent excessive dehydration.
Core (YSI 401) and skin (YSI 409A) temperature was recorded at 0, 15, and 30 min and
blood pressure (Tango+) was measured at 20 min of exercise.
Measurements of gas exchange
Subjects breathed through a pneumotachometer (Hans Rudoloph, Kansas City,
MO) and two-way non rebreathing valve (2700 Series, Hans Rudolph, Shawnee, KS).
Oxygen and carbon dioxide gases were continuously sampled at the mouthpiece via a 6 ft
capillary tube. Gas concentrations were measured by a mass spectrometer (Perkin Elmer

54
MGA 1100, St. Louis, MO) interfaced with a computer for calculation of breath by
breath oxygen consumption and carbon dioxide production (Beck Integrated
Physiological Testing System).
Open circuit acetylene wash-in for the determination of cardiac output was
performed as described by Johnson et al (60). Briefly, at the end of a full expiration, the
participants breathed for a minimum of 8 breaths through a mouthpiece connected to a
bag filled with mixed gases, including 0.7% acetylene, 9.0% helium, 21% oxygen, and
balance nitrogen. The concentrations of acetylene and helium were monitored by
continuous sampling at the mouthpiece using a mass spectrometer (Perkin Elmer MGA
1100, St. Louis, MO) interfaced to a computer for the calculation of cardiac output (Beck
Integrated Physiological Testing System).
Blood analysis
Hematocrit was measured in triplicate following microcentrifugation for 15
minutes. Hemoglobin was measured in triplicate using the cyanmethemoglobin method
(35). Plasma and blood volume changes were determined via the method of Dill and
Costill (33). Whole blood was stored at room temperature until clotting occurred and
then was centrifuged for 20 min prior to the removal of serum. Serum sodium
concentration was measured via electrochemistry (NOVA 5, Waltham, MA).
Sweating rate and sweat sodium concentration analysis
Sweating rate (L/h) was calculated as the change in nude body mass, accounting
for fluid consumption. Upon removal of the sweat patches, the gauze sponge was

55
immediately separated from each Tegaderm® bandage and placed into a filterless
separation tube. The sweat content of the sponges was obtained via centrifugation and
transferred into four 5 ml plastic test tubes and capped. Sweat electrolyte concentration
was measured with a Nova 5 Analyzer (Waltham, MA) with a manufacturer reported CV
of 2% for sodium analysis. A modified weighted equation was utilized to calculate
whole body sweat sodium concentration (sweat sodium concentration = 0.11([Arm]) +
0.276([Back]) + 0.299([Thigh]) + 0.315([Calf])) (8).
Statistical Analysis
Data are reported as mean and standard deviation. Multiple measures taken
during or post-exercise were averaged and reported as mean values. A paired student’s t-
test and a two way repeated measures analysis of variance was performed to analyze
differences. Significance was set at an alpha level of 0.05.
.

56
RESULTS
Three days of oral sodium chloride ingestion (15.7 ± 1.7 g NaCl/day) in addition
to participants’ normal diet slightly but significantly increased resting serum sodium
concentration above the placebo treatment (146.8 ± 1.0 mEq/L vs. 146.1 ± 1.1 mEq/L,
NA vs. PL, respectively, p = 0.002). Hemoglobin and hematocrit were significantly
lower in NA vs. PL pre-exercise, during exercise, and post-exercise (16.0 ± 1.1 mg/dL vs.
15.4 ± 1.1 mg/dL, PL vs. NA, respectively, p = 0.008; 48.6 ± 3.0 % vs. 47.0 ± 3.3 %, PL
vs. NA, respectively, p = 0.006) (Table 2-1). Compared to placebo, plasma and blood
volume were increased during exercise at 60 % VO2peak (8.6 ± 5.2 % and 4.3 ± 3.1 %,
PV and BV, respectively). Plasma and blood volume also increased at rest before (5.9 ±
7.6 % and 3.2 ± 4.4 %, PV and BV, respectively), and after exercise (5.0 ± 4.1 % and 2.9
± 2.8 %, PV and BV, respectively).
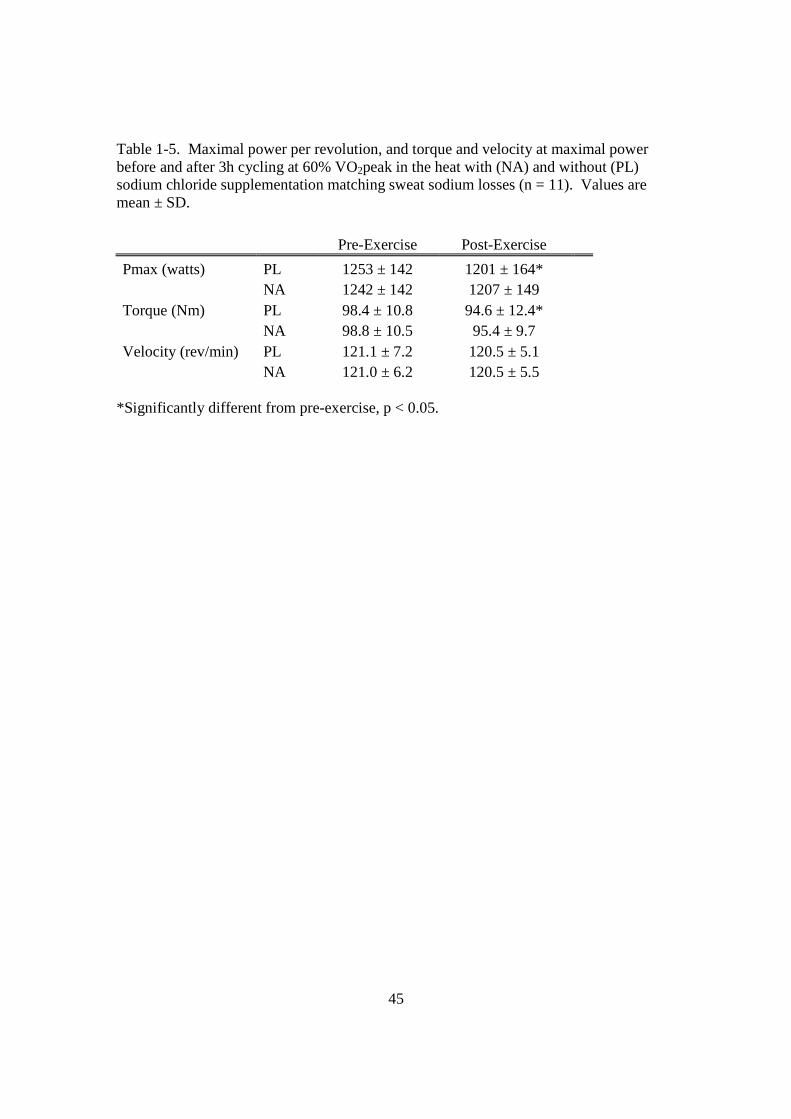
There were no significant differences in oxygen consumption between treatments
during exercise (2.31 ± 0.23 L/min vs. 2.35 ± 0.31 L/min, PL vs. NA, respectively, p =
0.625) (Figure 2-1). Stroke volume was significantly higher with sodium chloride
supplementation compared to placebo during exercise (126.3 ± 23.7 ml/beat vs. 139.0 ±
27.2 ml/beat, PL vs. NA, p = 0.004; Figure 2-2) and post-exercise (102.8 ± 23.7 ml/beat
vs.124.0 ± 27.9 ml/beat, PL vs. NA, respectively, p = 0.003).
There was an overall time effect on heart rate as it drifted from 5 to 15 minutes of
exercise (145.5 ± 13.4 beats/min vs. 161.7 ± 16.1 beats/min, 5 min vs. 15 min,
respectively, p = 0.001, Figure 2-3). Heart rate was ~2 % lower during exercise and
~4 % lower post-exercise in NA compared to PL, but this difference was not statistically
different (p = 0.123 and p = 0.060, exercise and post-exercise, respectively). As heart

57
rate tended to be lower and stroke volume was significantly higher, there was a left-
upward shift in the stroke volume vs. heart rate response during exercise in NA compared
to PL (Figure 2-4).
Cardiac output was significantly higher during sodium chloride supplementation
vs. placebo during exercise (21.0 ± 3.1 L/min vs. 19.4 ± 2.6 L/min, NA vs. PL,
respectively, p = 0.013) and post-exercise (12.2 ± 2.4 L/min vs. 10.4 ± 2.1 L/min, NA vs.
PL, respectively, p = 0.004) (Figure 2-5). A summary of the percent changes in
cardiovascular measures between treatments is presented in Figure 2-6.
Mean arterial pressure was not significantly different between treatments during
exercise (110 ± 8.7 mmHg vs. 108 ± 6.9 mmHg, PL vs. NA, respectively, p = 0.548) or
post-exercise (95 ± 6.1 mmHg vs. 96 ± 5.2 mmHg, PL vs. NA, respectively, p = 0.817)
(Figure 2-7). Systolic blood pressure was also not significantly different during exercise
(178.8 ± 14.3 mmHg vs. 173.4 ± 11.7 mmHg, PL vs. NA, respectively, p = 0.089) or
post-exercise (125.7 ± 9.2 vs. 125.9 ± 9.8 mmHg, PL vs. NA, respectively, p = 0.960)
(Figure 2-7). Diastolic blood pressure was similar in both treatments during exercise
(75.1 ± 10.7 mmHg vs. 75.9 ± 11.0 mmHg, PL vs. NA, respectively, p = 0.808) and post-
exercise (79.7 ± 7.9 mmHg vs. 80.6 ± 7.7 mmHg, PL vs. NA, respectively, p = 0.755)
(Figure 2-7).
There was a significant treatment effect on total peripheral resistance as NA was
significantly lower than PL during exercise (470.5 ± 122.4 dyne/sec/cm5 vs. 425.2 ± 95.9
dyne/sec/cm5, PL vs. NA, respectively, p = 0.027) and post-exercise (750.6 ± 191.4
dyne/sec/cm5 vs. 610.2 ± 98.2 dyne/sec/cm5, PL vs. NA, respectively, p = 0.014) (Figure
2-8). A summary of percent changes in hemodynamic variables is presented in Figure 2-

58
9. There were no significant differences in core temperature (37.0 ± 0.6 °C vs. 37.0 ± 0.7
°C, p = 0.757) or skin temperature (30.1 ± 0.4 °C vs. 30.1 ± 1.0 °C, p = 0.906) between
treatments.
Sweating Analysis Results
Dry bulb (DB) and wet bulb (WB) temperature and relative humidity (RH) were
not different between sweating analysis trials (35.4 ± 0.7 °C vs. 35.4 ± 0.5 °C DB, p =
0.938; 28.8 ± 0.8 °C ± vs. 29.0 ± 0.8 °C WB, p = 0.687; 50.1 ± 6.8 % vs. 53.3 ± 2.8 %
RH, p = 0.128). Sweat sodium concentration was ~9 % higher during sodium chloride
supplementation compared to placebo (64.5 ± 21.7 vs. 70.4 ± 19.5 mEq/L, PL vs. NA,
respectively, p = 0.044) (Figure 2-10) and displayed a similar coefficient of variation to
prior investigations (77). Sweating rate was not different between treatments (1.15 ±
0.25 L/h vs. 1.29 ± 0.20 L/h, PL vs. NA, respectively, p = 0.078). Sweating rate and
sweat sodium concentration were significantly related during NA (r = 0.698, p = 0.036),
but not during PL (r = 0.261, p = 0.498). Core temperature (38.1 ± 0.2 °C vs. 38.0 ± 0.3
°C, PL vs. NA, respectively, p = 0.159) and skin temperature (34.1 ± 0.6 °C vs. 34.3 ± 0.7
°C, PL vs. NA, respectively, p = 0.117) were also not different between trials.
Mean arterial pressure was not significantly different between treatments at 20
min while exercising in the heat during the sweating analysis trial (98 ± 9.6 mmHg vs. 96
± 8.5 mmHg, PL vs. NA, respectively, p = 0.555). Systolic and diastolic blood pressure
were also similar between treatments, respectively (159 ± 18.0 mmHg vs. 160 ± 15.7
mmHg, PL vs. NA, respectively, p = 0.718; 67.4 ± 9.9 mmHg vs. 64.3 ± 9.3 mmHg, PL
vs. NA, respectively, p = 0.230).

59
DISCUSSION
Three days of increased sodium chloride intake resulted in a very small, yet
statistically significant increase in serum sodium concentration at rest and during
exercise. Sodium chloride supplementation also resulted in an increase in plasma and
blood volume at rest (5.9 and 3.2 %, respectively) and during exercise (8.6 and 4.3 %,
respectively). Based on an average blood volume of 70 ml/kg body mass in untrained
males (27, 63) plasma and blood volume would have increased ~ 170 and 210 ml, at rest
and during exercise, respectively, compared to a placebo.
While we didn’t measure extracellular sodium content, we did measure serum
sodium concentration and plasma and blood volume changes. As serum sodium
concentration is a calculation of sodium content and extracellular intravascular volume,
and both serum sodium concentration and extracellular vascular volume increased,
sodium content also increased. Based on an average blood volume of 70 ml/kg body
mass in untrained males (27, 63) and the presently measured serum sodium concentration
and plasma volume changes, estimated intravascular and ECF sodium content increased
~26 and 105 mEq, respectively, at rest, an estimated retention of ~13%. While these
values are estimates, they are similar to calculated sodium balance increases of ~17-33%
at rest in previous studies with longer sodium supplementation protocols using lower
levels of supplementation (58.5-215 mEq Na/d) (50, 107).
Stroke volume also increased ~10 % during exercise and ~20 % during recovery
at rest following sodium chloride supplementation. Stroke volume was also better
maintained during exercise in NA compared to PL. While during NA, SV was
maintained at the higher level in NA from 5 to 14 min of exercise, stroke volume during

60
PL significantly declined. The percent difference in stroke volume between treatments
almost doubled from 5 to 14 minutes during exercise (7.7 % and 13.2 %, 5 and 15 min,
respectively). The higher exercising stroke volume due to the increase in plasma volume
from sodium supplementation was similar to the effects of plasma volume expansion via
intravenous infusion in untrained males (57, 63). Hopper et al. infused 400 ml of
dextran, a plasma volume expander, in untrained males which resulted in an increase of
11 % in stroke volume during exercise at ~56 % of VO2peak (57). Krip et al. also
increased stroke volume by ~10 % in untrained males with 550 mL of infusate (63). To
our knowledge, only 1 other investigation has compared the effects of varying levels of
chronic daily sodium chloride ingestion on stroke volume during exercise. Both older
heart failure patients and healthy age matched (~57y) male controls increased sodium
intake for 7 days (29). Both groups increased stroke volume index during exercise from
day 1 to day 7. The age-matched controls increased exercising stroke volume ~5-7 %
compared to pre supplementation measurements. Their investigation was different from
the current one as the subjects ingested a very low (70 mmol/d) or very high sodium diet
(250 mmol/d) over the course of 7 days. Furthermore, the exercise task was a ramp
cycling protocol to exhaustion, not steady state. While our supplementation period was
less than half as long, and we compared a normal vs. high sodium chloride ingestion, our
crossover design investigation yielded a larger increase in exercising stroke volume (10
% vs. ~6 %) and plasma volume (9 % vs. 7 %) during the NA compared to PL trials.
Possible differences include adaptation to increased sodium ingestion over 7 days, subject
age, or different exercise protocols.

61
In our investigation, cardiac output also increased during exercise (~8 %) and
during recovery at rest (~17 %) compared to PL. The increases in stroke volume and
cardiac output occurred during a small insignificant change in heart rate (~2-4 %) and
without a change in oxygen consumption. While the young healthy untrained males in
our study responded to sodium chloride supplementation with an increase in blood
volume, there was no change in mean arterial pressure. This result was due to a decrease
in total peripheral resistance during exercise (~11 %) and at rest following exercise (~23
%). This decrease in TPR is similar to prior reports of TPR at rest during increased
sodium chloride ingestion (29, 107).
Sweat sodium concentration increased ~9 % while exercising in the heat at 50 %
VO2peak as a result of sodium chloride supplementation. To our knowledge this is the
first investigation using a crossover design which compared the effects of normal vs. high
daily sodium chloride ingestion on sweat sodium losses during exercise in the heat in non
heat-acclimatized males. Prior investigations which found a relationship between sodium
ingestion and sweat sodium loss either used sodium depletion protocols (66, 82) or
measured sweat sodium changes during a heat acclimation protocol, which results in
sodium conservation effects (7). Costa et al. did find a relationship between sodium
intake and loss during normal or high sodium ingestion, but they did not use a cross-over
design (23). As sweat sodium loss is extremely variable between individuals (77, 78, 89,
106), interpretation of sodium ingestion or individual differences in their investigation
cannot be made. In contrast to the previous studies, Allsopp et al. found no relationship
between sodium chloride ingestion and sweat sodium concentration during an 8 day

62
supplementation period, which may due to the very long, 12 h, collection period or
adaptation to the increased sodium intake (4).
Interestingly, during PL, there was no relationship between sweating rate and
sweat sodium concentration (p = 0.498) while there was a relationship during NA (p =
0.036). Sweating rate was not significantly different between treatments, although it was
~12 % higher in NA. As sweating rate was correlated with sweat sodium concentration
in NA, similar to prior investigations (3, 87), the trend for a higher sweating rate may
have partially contributed to the increased sweat sodium concentration between
treatments. Another potential reason for the increase in sweat sodium may be due to a
decrease in aldosterone which is known to occur during high sodium ingestion (29, 107).
As aldosterone decreases, the sodium conserving effects it exhibits on sweat glands
would be diminished (86), resulting in a higher sweat sodium concentration. In a study
of low, moderate, and high sodium intake, Allsopp et al. (4) found a significantly lower
aldosterone response to heat exposure during heat acclimation in high vs. moderate
sodium intake. This coincided with a large, yet non-significant, 24 % increase in sweat
sodium concentration during increased sodium ingestion (4). While the small increase in
sweat sodium concentration (~6 mEq/L) in the current investigation is likely partially due
to a decrease in aldosterone, this is unclear, as we did not measure plasma aldosterone
levels.
As all of our exercising measures of cardiac output were made during moderate
intensity exercise, it is unclear whether increases in blood volume and stroke volume
would also occur at higher exercise intensities in young untrained males. It is also
unclear whether maximal cardiac output or maximal oxygen consumption would be

63
increased via sodium chloride supplementation. However, as the effects of sodium
chloride supplementation are similar to plasma volume expansion via intravenous
infusion, maximal oxygen consumption may also increase as it does with intravenous
infusion of a plasma volume expander (27).
Our participants included untrained/recreationally active, non heat-acclimatized
males. We chose this population, as they are known to have sub-optimal exercising
blood volumes compared to endurance trained athletes (57, 63). Thus, it is not clear
whether sodium chloride supplementation would be beneficial to endurance trained
athletes, assuming that blood volume expansion is the reason for the increase in stroke
volume and cardiac output.
In summary, plasma and blood volume increased ~4-9 % during exercise
following 3 days of increased sodium intake (~15 g NaCl/d) in untrained males. Stroke
volume and cardiac output also significantly increased (10 and 8 %, respectively)
following sodium chloride supplementation while oxygen consumption and mean arterial
pressure was unchanged. Thus, oral sodium chloride supplementation afforded similar
cardiovascular benefits of an invasive intravenous infusion of plasma volume expander.
Furthermore, the large daily increase of sodium chloride resulted in a 9 % higher sweat
sodium concentration during exercise in the heat.

64
FIGURE LEGENDS
Figure 2-1. Oxygen consumption (L/min) during exercise at 60% VO2peak and at rest
following 3 days of sodium chloride supplementation (3.5 mEq/kg/d; NA) or placebo
(PL) (n = 9).
Figure 2-2. Stroke volume (ml/beat) during exercise at 60% VO2peak and post-exercise
following 3 days of sodium chloride supplementation (3.5 mEq Na/kg/d; NA) or placebo
(PL) (n = 9). ‘*’ indicates significantly different from PL, p < 0.05. ‘†’ indicates
significantly different from 5 minutes of exercise, p < 0.05. ‘ * ’ indicates significant
treatment effect, p < 0.05.
Figure 2-3. Heart rate (beats/min) during exercise at 60% VO2peak and post-exercise
following 3 days of sodium chloride supplementation (3.5 mEq Na/kg/d; NA) or placebo
(PL) (n = 9).
Figure 2-4. Stroke volume (ml/beat) vs. heart rate (beats/min) relationship during
exercise at 60% VO2peak following 3 days of sodium chloride supplementation (3.5 mEq
Na/kg/d; NA) or placebo (PL) (n = 9).
Figure 2-5. Cardiac output (L/min) during exercise at 60% VO2peak and post-exercise
following 3 days of sodium chloride supplementation (3.5 mEq Na/kg/d; NA) or placebo

65
(PL) (n = 9). ‘*’ indicates significantly different between treatments, p < 0.05. ‘ * ’
indicates significant treatment effect, p < 0.05.
Figure 2-6. Percent difference, compared to when ingesting a placebo, in heart rate (HR,
beats/min), stroke volume (SV, ml/beat), and cardiac output (CO, L/min) during exercise
at 60% VO2peak following 3 days of sodium chloride supplementation (3.5 mEq
Na/kg/d) (n = 9). ‘*’ indicates significantly different between treatments, p < 0.05.
Figure 2-7. Systolic blood pressure (SBP, mmHg), mean arterial pressure (MAP,
mmHg), and diastolic blood pressure (DBP, mmHg) during exercise at 60% VO2peak and
post-exercise following 3 days of sodium chloride supplementation (3.5 mEq Na/kg/d;
NA) or placebo (PL) (n = 9).
Figure 2-8. Total peripheral resistance (dyne/sec/cm5) during exercise at 60% VO2peak
and post-exercise following 3 days of sodium chloride supplementation (3.5 mEq
Na/kg/d; NA) or placebo (PL) (n = 9). ‘ * ’ indicates significant treatment effect, p <
0.05.
Figure 2-9. Percent change in systolic blood pressure (SBP, mmHg), diastolic blood
pressure (DBP, mmHg), mean arterial pressure (MAP, mmHg), and total peripheral
resistance (TPR, dyne/sec/cm5) during exercise at 60% VO2peak following 3 days of
sodium chloride supplementation (3.5 mEq Na/kg/d) compared to when ingesting a
placebo (n = 9). ‘*’ indicates significantly different between treatments, p < 0.05.

66
Figure 2-10. Sweat sodium concentration in individual subjects during exercise at 50%
VO2peak in the heat (35 °C, 50% RH) following 3 days of sodium chloride
supplementation (3.5 mEq Na/kg/d) or placebo (n = 9). The dark bar displays the mean
response.
67
Figure 2-1

68
Figure 2-2
* * *
* *
† †
† †
†
*
*

69
Figure 2-3

70
Figure 2-4
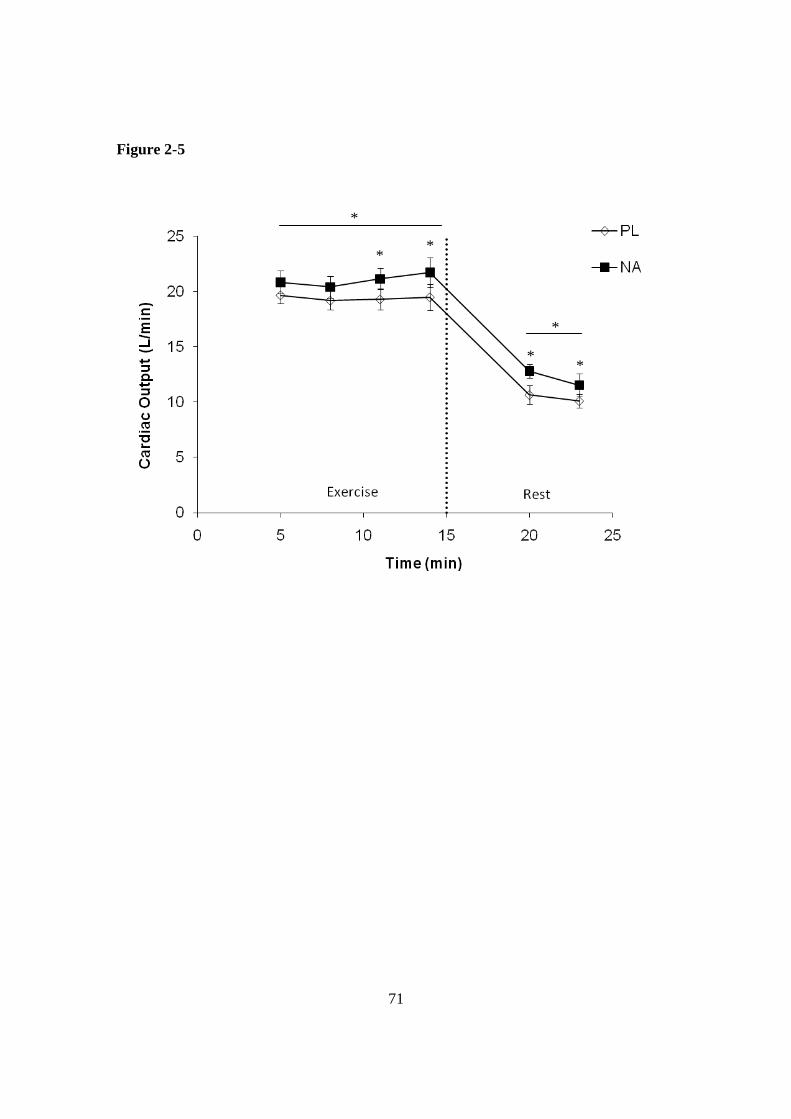
71
Figure 2-5
* *
* *
*
*

72
Figure 2-6
HR
SVCO
-4.0%
-2.0%
0.0%
2.0%
4.0%
6.0%
8.0%
10.0%
12.0%
Per
cen
t Ch
ang
e
* *

73
Figure 2-7

74
Figure 2-8
*
*
*

75
Figure 2-9
SBP
DBP
MAP
TPR-12.0%
-10.0%
-8.0%
-6.0%
-4.0%
-2.0%
0.0%
2.0%
4.0%
6.0%
Per
cen
t Ch
ang
e
*

76
Figure 2-10

77
Table 2-1. Blood markers measured at rest and during exercise at 60% VO2peak during placebo (PL) and sodium chloride supplementation (NA) (n = 9).
Rest Exercise Post-
Exercise Serum Sodium PL 144.4 ± 1.4 147.2 ± 1.0 144.8 ± 0.7 (mEq/L) NA 145.0 ± 1.5 148.0 ± 1.0† 145.5 ± 0.6† Hematocrit PL 46.8 ± 2.6 49.3 ± 3.2 48.3 ± 3.2 (%) NA 45.5 ± 3.0 47.4 ± 3.3† 47.1± 3.4† Hemoglobin PL 15.1 ± 1.0 16.3 ± 1.2 15.8 ± 1.2 (mg/dL) NA 14.6 ± 0.9 15.6 ± 1.1† 15.4 ± 1.1*
† significantly different vs. placebo at p < 0.01, * significantly different vs. placebo at p < 0.05.

78
Chapter VI - Review of Literature
Introduction
Body mass is composed of approximately 50-60 % water which is sub-divided
between the extracellular and intracellular fluid compartments (34). Fluid and sodium
balance can be altered during conditions of physical stress when sweating is prolonged
and replenishment strategies are inappropriate (43, 53, 54). While declines in sodium to
130 mEq/L (mild hyponatremia) are typically asymptomatic, large declines in serum
sodium to levels <125 mEq/L (severe hyponatremia) are generally symptomatic. A large
decline in serum sodium concentration mainly occurs by an excessive consumption of
water which dilutes the sodium stores. However, excessive sodium losses in sweat
during prolonged exercise have also been included in models as a possible contributor to
decreasing serum sodium levels and the development of hyponatremia (69, 70). While
the incidence of clinical hyponatremia appears to be more common during ultra-
endurance exercise events (31, 53, 59, 94) compared to shorter distance exercise, it is
also present in workers undertaking manual labor tasks under heat stress (2), as well as in
military personnel (8). As sweat sodium losses are highly variable between individuals
(77), those individuals with higher losses would be at a greater risk for decreasing serum
sodium concentration according to hypothetical models (69, 70). While the effects of
clinical hyponatremia are clear, very little is known about the effects of smaller declines
in serum sodium concentration on physical and cognitive performance. Clinically, small
changes in serum sodium are typically asymptomatic, but there have been clinical cases
where smaller declines in serum sodium concentration (~128 mEq/L) have shown
79
decrements in cognitive and postural performance (32). Furthermore, the effects of
sodium chloride supplementation on maintaining serum sodium concentration and
physical performance are not well studied.
Blood volume is a determinant of stroke volume. In untrained individuals plasma
volume is suboptimal during exercise compared to trained athletes (57). This lower
plasma volume is partially responsible for the higher exercising stroke volume in trained
versus untrained individuals. Invasive methods, such as intravenous infusion, have been
used to exogenously increase plasma volume in untrained people (57, 63). These efforts
have resulted in an increase in stroke volume during rest (61) and during exercise (27,
57). As fluid follows tonicity (90), increasing extracellular osmolality via sodium
chloride ingestion also results in an increase in plasma volume. Sodium ingestion has
successfully been utilized to increase plasma and stroke volume at rest (28), but it has not
been evaluated during exercise in young healthy individuals. Furthermore, the effects of
dietary sodium ingestion on sweat sodium concentration have not been evaluated during
exercise in the heat in non heat-acclimatized individuals.
1 – Determinants of Fluid and Sodium Balance
1a. Total body water and fluid compartments
Over half of a human’s body mass (~61 % in males) is composed of water (34).
The intracellular fluid (ICF) accounts for approximately two-thirds of total body water
and extracellular fluid (ECF) accounts for the remainder (34). The ECF is further
subdivided into interstitial fluid (ISF, ~75% of ECF) and plasma volume (~25% of ECF).
Water distribution is due to tonicity and water moves freely when tonicity is altered.

80
Tonicity is primarily determined by sodium in the ECF (~140 mmol/L) and potassium in
the ICF (~150 mmol/L). Alterations in the total body water, ECF, and ICF occur when
fluid, sodium, or a combination of the two are gained by or lost from the body.
1b. Increases in Fluid and Sodium Content
As sodium stores in the body are minimal outside of the ECF, ECF sodium
content is increased via external sources, such as food, fluid, or supplements. The
average daily intake of sodium in the Western world is approximately 100-200 mmol
Na/day (6-12 grams NaCl) (110).
There is currently controversy as to the efficacy of sodium chloride
supplementation on altering serum sodium concentration during endurance exercise.
Some researchers have reported that sodium chloride supplementation has no significant
effect on lessening the decline or on increasing serum concentration during prolonged
exercise (14, 52, 85, 96). Others have suggested that sodium chloride supplementation
will attenuate the decline in serum sodium concentration during endurance exercise (104,
108). Reasons for the discrepancies may be due to experimental methodology. The
investigators who reported that sodium chloride supplementation was not a factor on
altering serum sodium concentration provided small amounts of sodium (22-30 mEq/h)
(14, 96) or did not record other means of sodium intake (96) or loss. As sweat sodium
losses were not measured, it is possible that significantly more than 20-30 mEq/h of
sodium could have been lost via sweating and urination (78, 89, 106), or 29 mEq/h from
ingesting a saline solution may not have been sufficient to attenuate the decline in serum
sodium concentration versus water alone (14). A major shortcoming in the field studies

81
during ultra-distance triathlons is that sodium ingestion from food or fluid was not
measured, thus it is challenging to interpret the data (52, 96). It should be noted that the
studies which reported the maintenance or less of a decline in serum sodium
concentration with supplementation also have confounding factors. One study which
reported an attenuated decline in serum sodium concentration and a trend for a longer
time to exhaustion while consuming an 18 mEq/L drink versus water was confounded by
the use of a sports drink containing carbohydrate. In addition, there was no mention of
level of heat acclimatization which may have affected sweating rates and sweat sodium
concentration. In a field investigation which reported a benefit of sodium
supplementation on maintaining serum sodium concentration the environmental
conditions ranged from 5.3 ˚C and snow to 19.0 ˚C and sun. Had the environmental
conditions been controlled (104) or a more concentrated sodium and energy matched
beverage given (108), the results might have been more valid.
1c. Decreases in Fluid and Sodium Content
The primary means for fluid loss include respiration, urination and sweating.
During exercise, fluid loss due to respiration is primarily dependant on ventilation and
exercise intensity. At approximately 65% of maximal oxygen consumption, respiration
losses are approximately 0.075L/hr (68, 79). This value is comparable to the fluid gains
from metabolism and it is quite small in comparison to potential urinary and sweat losses.
Urine volume and sweat losses can be affected by many factors, including: exercise
intensity, degree of heat acclimation, environmental conditions, and hydration status (12,
22, 38, 39, 45, 64, 102). Urine volume losses during exercise are variable between

82
subjects, but have been reported at approximately 0.02L/hr at 60% of maximal aerobic
capacity at 30 ˚C, 50 % RH (25). Normal urine sodium has been reported from 100 – 140
mEq/L in cool weather to as low as 10 mEq/L in hot weather when sodium conservation
mechanisms are near maximal (21, 64, 85).
Sweating accounts for not only the largest fluid loss during exercise, but it is also
the major means for sodium loss during exercise. Sweating rates can range from under
0.5 L/hr to almost 4 L/hr (10, 24, 49). Sweat is hypotonic in nature and its principal ions,
sodium and chloride, are derived from the ECF (24). A wide range of sweat sodium
concentrations (less than 20 to over 70 mEq/L) have been reported (30, 77, 78, 83, 89,
106). Sweating rate and composition appear to be quite variable, not only due to
changing external conditions, but also inter-individual variability under similar conditions
(14, 24, 77, 78, 89, 106). The reasons for inter-individual variability are not entirely
clear, but sweating rate and sweat sodium concentration are influenced in part by core
and skin temperatures, heat-acclimatization status, training status, aerobic capacity, and
hydration level (1, 3, 11, 30, 40, 41, 67, 71).
2 - The Effects of Daily Sodium Ingestion on Sweat Sodium Concentration
Dietary sodium ingestion has been implicated as having a potential effect on
sweat sodium losses, but there are mixed results. The conflicting results may be due to
comparing sodium deficiency vs. high dietary intake, introducing heat acclimation,
sample size, environment, exercise vs. passive heating, and/or sweat testing
methodology.

83
McCance et al. (66) studied the effect of salt deficiency on sweat electrolyte
losses during heat acclimation with passive heating in two men over 5 to 8 days. Salt
deficiency resulted in a large decline in sweat sodium concentration from 65 mEq/L to 25
mEq/L in one individual while the other man saw smaller declines. When sodium intake
exceeded losses, there was an increase in sweat sodium losses while at rest. Robinson et
al., (82) also studied chloride loss in men during heat acclimation and found when salt
deficient, the chloride concentration in the sweat declined. They also found some
evidence for a small increase in chloride loss when salt intake exceeded urinary and
sweat losses for 3 days in 2 subjects. Similarly, Armstrong et al., (7) showed that during
heat acclimation, high vs. low sodium chloride intake (399 vs. 98 mEq NaCl/day)
resulted in a higher sweat sodium loss in the high group at 5 and 8 days of acclimation.
While on the high sodium diet, sweat sodium losses progressively increased from 41
mEq/L to 58 mEq/L. During the low sodium diet, sweat sodium losses declined during
the heat acclimation protocol. However, these results should be reviewed with caution,
as the sweating rate was quite low. These very small sweat samples would be
challenging to measure, as the researchers used the whole body and clothing washdown
technique (7).
Costa et al. (23) fed men either a “space diet”, with moderate-high sodium, or a
normal sodium diet (243 mEq Na/d vs. 150 mEq Na/d, respectively) in a parallel study
design which did not have a heat acclimatization component. Subjects then completed an
interval cycling task in a temperate environment (25 °C) for 30 minutes. On average, the
sweating rate was 0.7 L/h and sweat sodium losses measured via patch, arm-bag, and
bath were higher while consuming the higher sodium “space diet”. While this study

84
lends the strongest support for an implication of dietary sodium intake on altering sweat
sodium loss, it does have limitations. The investigators did not use a crossover design.
As sweat sodium losses are extremely variable (77, 89), and only 6 subjects were in each
group, the intra-subject variability could have resulted in a difference in sweat sodium
losses. Additionally, subjects only lost ~350 ml of total sweat during the trial. A larger
sweat volume would result in a more accurate determination in sweat sodium
concentration.
While sweat sodium concentration may decline due to an increase in aldosterone
during periods of low sodium intake and negative sodium balance (20, 92), investigators
have also found no relationship between sweat sodium excretion and sodium intake (4,
30). Davies et al. (30) found no effect of daily saline loading (0.75L 1% saline per day
for 11 days) pre and post heat acclimatization. However, during this study dietary food
intake was not controlled, thus it is not possible to distinguish the actual sodium intake of
the participants (30). In another study where sweat sodium excretion was not affected by
sodium intake, participants ingested a moderate or high sodium intake diet (174 vs. 348
mEq/d, respectively). However, when participants were switched to a very low sodium
diet (66 mEq sodium/d) sweat sodium excretion declined, similar to previous studies.
Thus a possible conclusion from this study is that a sodium deficiency is required for
sodium intake to alter sweat sodium loss. It should be noted that one major potential
source of error in this study was the method of sweat sodium determination. As the
investigators utilized a 12h wash-down, it is possible that a large sampling error was
introduced in the sodium loss calculations (4). As mentioned previously, limitations exist

85
in the studies presented above, thus it is not possible to discern the effects of an increased
sodium intake on sweat sodium concentration.
3 - Altered Fluid and Sodium Balance
Fluid turnover occurs during prolonged exercise as water and sodium are lost in
the sweat and partial or complete fluid is restored. Low serum sodium concentration can
result when fluid and sodium balance is mismatched. Normal serum sodium levels
typically range from 140-145 mEq/L (110). While the term “asymptomatic”
hyponatremia is currently being questioned (32), when serum sodium concentration
levels are more than 130mEq/L it is considered asymptomatic and symptomatic when
less than 130 mEq/L (94). Mild symptoms of decreased serum sodium concentration
include confusion, nausea and fatigue. As these symptoms can also result from
hypoglycemia or dehydration induced by prolonged or intense exercise, the condition can
be misdiagnosed. In more severe cases, low serum sodium concentration can result in
seizures, coma, and death. The severe medical complications are generally caused by
pulmonary or cerebral edema as water shifts from the extracellular compartment to the
intracellular compartment due to a decline in extracellular sodium concentration (51, 58).
Cerebral edema is of particular concern as intracerebral swelling results in an increase in
intracranial pressure due to the confinement of the cranium (13). Clinical hyponatremia
is more common during ultra-endurance exercise (31, 53, 59, 93), but it is also present in
workers undertaking manual labor tasks under heat stress (2), as well as in the military
(8). Typically, serum sodium concentration is lowered by an excessive consumption of
fluid which is greater than sweat and urinary fluid losses. The result is an increase in

86
body mass, total body water, and a dilution of first the ECF and then both the ECF and
ICF as the excess fluid redistributes throughout the body (94).
Models of factors which alter serum sodium concentration also include excessive
sweat sodium loss as a potential contributor (69). In a field study investigating the sweat
sodium losses and changes in serum sodium concentration during an ultra-distance
triathlon, we found that declines in serum sodium concentration were significantly and
negatively correlated with sweat sodium losses in males (77). While overhydration can
lead to a decline in serum sodium concentration, lowering serum sodium concentration
via sweat sodium losses while maintaining hydration levels has also been proposed.
When fluid is consumed to match fluid losses during prolonged sweating, but sodium is
not completely replaced, fluid balance is maintained, but serum sodium concentration
declines (e.g. euvolemic hyponatremia). As fluid follows tonicity, and sodium content
has declined, fluid shifts from the extracellular to intracellular compartment which results
in cell swelling. As this means of lowering serum sodium concentration requires losing
large amounts of sodium in sweat those with high sweat sodium losses will be at a greater
risk. As mentioned previously, sweat sodium losses are quite variable. In a group of
endurance athletes (n=71) we reported a very large coefficient of variation (54%) in the
rate of sweat sodium loss with a mean value of 62 mEq/h (77). Eighteen percent of the
subjects had a very high rate of sweat sodium losses (>90 mEq/h; >2000 milligrams/h)
which would account for roughly 4.5% of estimated extracellular sodium content lost
each hour. These subjects would be the ones most at risk for decreasing serum sodium
concentration should they not replace their sweat sodium losses.

87
One of the most common fluid disturbances, dehydration, occurs when fluid
consumption does not sufficiently match fluid lost. While sweat contains both water and
sodium, it is hypotonic, thus the concentration of sodium in the sweat is lower than blood
sodium levels which results in a contraction of total body water. Upon equilibration of
fluid spaces, total body water will decline from both compartments, but depending on
sodium losses in the sweat, there will be a disproportionate amount of fluid decline in the
ECF which results in an increase in serum sodium concentration. However, it is also
possible to have a decreased serum sodium concentration and also be hypovolemic. This
could occur during very prolonged sweating with high sweat sodium losses with only
partial fluid replacement with sodium free fluid or very low sodium fluid which would
result in dehydration. However, the sodium losses would have to be substantial enough
to overcome the resultant increase in serum sodium concentration due to ECF contraction
from dehydration.
4 - Effects of Decreased Serum Sodium Concentration on Performance
4a. Endurance Performance
As mentioned previously, excessive declines in serum sodium concentration result
in mental confusion, nausea, weakness, seizures and possibly death. However, very little
is known about the effects of small declines in serum sodium concentration on
performance. In one study where cyclists were given sodium-free fluid or fluid with
sodium there was a negative correlation between serum sodium levels and cycling
performance, but it is difficult to interpret the data (108). Subjects were given the fluid

88
replacement beverages to match sweating rate, but the sodium beverage also included
carbohydrate. Therefore, it is not possible to determine if the effects were due to the
carbohydrate ingestion or to sodium supplementation. Twerenbold et al conducted the
only study to date to investigate the effects of several levels of sodium chloride content in
beverages on changes in serum sodium concentration and endurance performance (104).
The authors altered serum sodium concentration by providing beverages with high (680
mg/L), moderate (410 mg/L), or no sodium during a 4 hour run. They concluded that the
3 levels of serum sodium concentration in the athletes during a 4 hour endurance run did
not affect performance, but sodium supplementation would be beneficial to maintain
serum sodium concentration when overhydrated. The major flaw with the study is that
the tests were performed in three vastly different environmental conditions on an outdoor
track. During one trial, the temperature was 5 ˚C and it was snowing, in another trial, it
was 19 ˚C degrees and sunny, and in the third trial it was 13.9 ˚C degrees and raining.
While the trials were randomized, the environmental effects may have affected the
sweating data. Furthermore, sweat sodium losses were not measured. As sweat sodium
concentration and losses are quite variable, the results may have been affected as each
subject was given the same amount of electrolyte replacement even though there losses
may have been dramatically different.
4b. Maximal Neuromuscular Power
The effects of gradual declines in serum sodium concentration on maximal
neuromuscular power, motor function, and muscle activation have not been investigated
in humans. In animal models, skinned muscle fibers have shown a decline in excitability

89
with a large decline in extracellular sodium (16, 19, 72). This may be due to the
alterations in t–tubule sodium concentration which is necessary for the normal
development of twitch, tetanus (15), and force (42) during exercise. However, it appears
that smaller changes in ECF sodium have no effect on excitability. It is possible that
ECF sodium and ICF potassium together may be important for these alterations to occur
(17). It should also be noted that fatigued and non-fatigued muscle may also confound
results (19). Therefore performance declines accompanied by small changes in serum
sodium concentration in humans, may be more likely to occur via other factors, as
substantial loss of extracellular sodium would be necessary to decrease power based on
animal models. Furthermore, a skinned muscle animal model is not appropriate to draw
conclusions to human intact muscle fibers. One additional possibility is that nerve
conduction velocity has been shown to slow in a hyponatremic patient (6), but once
again, serum sodium concentration was quite low.
4c. Cognition and Balance
While small decreases in serum sodium concentration can result in nausea,
fatigue, and confusion, very little laboratory data exists on the effects on cognition and
balance. Cognitive function and postural balance were evaluated in clinical patients
admitted to emergency departments with a moderate lowering of serum sodium
concentration (mean 126 mEq/L) (81). Of the 122 patients admitted, 21 % were admitted
with falls indicating decreased balance. When compared to 244 matched controls also
admitted to the emergency department, the patients with decreased serum sodium levels
had 4-fold more falls than the controls. Sixteen of these patients participated in cognitive

90
testing and 12 participated in postural examination prior to and after treatment. Mean
response times were significantly slower (~9 %) when presented with decreased serum
sodium concentration compared to after treatment. Balance, measured as center of
pressure displacement during 3 steps in tandem, was also significantly worse, as the
subjects had a 28% greater displacement in the center of pressure. The larger sway in
center of pressure may have accounted for the greater incidence in falling. Based on
these findings, there is a questioning of the term “asymptomatic” hyponatremia, as it
appears that a systematic investigation of these patients resulted in the detection of
physical and mental decrements in performance (32).
5 – Effects of Plasma Volume Expansion on Cardiovascular Function
5a. Training status and PV
Cardiac output is important as it is responsible for delivering oxygen and
nutrients, as well as removing heat and waste during exercise. An increased blood
volume is partially responsible for increased cardiac preload which in turn results in
increasing stroke volume and potentially cardiac output. An increase in plasma volume is
one of the early adaptations to endurance training (26, 46). In untrained males blood and
plasma volume (PV) are sub-optimal for achieving maximal stroke volume (SV) during
exercise. Plasma volume expansion via intravenous infusion increases SV by ~10-15 %
in untrained males (57).

91
5b. Plasma volume expansion – Intravenous infusion
Moderate PV expansion (~14 %) via intravenous infusion of dextran and saline
during upright sub-maximal exercise in untrained males results in an increase in
exercising BV (~8 %). An expansion of PV results in an increase in SV (~11 %) during
sub-maximal exercise in untrained males (57). Cardiac improvements from the infusion
also include increased diastolic filling rate, left ventricular ejection time increases, and
enhanced emptying due to Frank Starling mechanisms due to the enhanced diastolic
filling rate (63). Not only does SV increase with infusion, but heart rate decreases at the
same absolute intensity, and small increases in VO2max can also occur (27) in untrained
males. The effects of PV expansion on SV at rest are mixed as some have found no
differences in SV (63, 84) and others have found increased SV at rest, in recreationally
trained individuals (61). While plasma volume expansion via intravenous infusion is an
effective means to increase SV during exercise, intravenous infusions are invasive, thus
their use is not practical. As sodium chloride ingestion may also raise PV, it may also be
possible to utilize this non-invasive means to increase SV.
5c. Acute sodium supplementation
Acute sodium supplementation via ingesting a hypertonic beverage at rest minutes
to hours prior to exercise has also been investigated as an aid to cardiovascular (e.g. PV,
SV, HR) and exercise performance (47, 48, 62, 80, 91). As described above, alterations
in extracellular sodium content will result in alterations in ECF volume. As the
intravascular space, plasma volume, is part of the ECF, this fluid compartment is also
affected. Varying amounts, concentrations, and volumes of sodium citrate, sodium

92
bicarbonate, and sodium chloride pills and solutions have mainly been used to provide
acute sodium supplementation in an attempt to hyper-hydrate or re-hydrate untrained and
trained males and females (80, 91). Some researchers have shown benefits to PV and
exercise performance in supine and upright positions (47, 91), while others have shown
no effect (62). One limitation to acute supplementation of sodium prior to exercise is that
some people experience gastric upset.
5d. Dietary sodium intake
Dietary or chronic sodium chloride intake has been investigated for its effects on
heat acclimatization, fluid retention, and hypertension (7, 9, 37, 88, 99-101, 109). While
much data exists on daily sodium chloride intake on resting cardiovascular variables,
mostly in relation to hypertension, little data exists on its effects during exercise. Normal
sodium intake in the United States is ~170 mEq sodium/d (~3.9 g sodium/d), however the
recommended daily intake is 100 mEq sodium/day (~2.3 g sodium/d) (105). However,
additional sodium may be warranted for an athletic population (36). Varying levels of
daily sodium intake have been studied from nearly no sodium intake to over 660 mEq
NaCl/d (29, 50).
When ingesting low vs. high dietary sodium (70 vs. 250 mEq NaCl/d,
respectively), PV increases in the seated (~10%) and supine positions (~8%) at rest (28).
Cardiac output (CO) and SV are also higher in the seated position (10% and 19%,
respectively) and resting heart rate is lower (6%) while on a higher sodium diet (28). In a
study by Heer et. al (50), 6 healthy males consumed a diet which included 220 mEq
NaCl/d for 8 days, then 440 mEq/d, and then 600 mEq/d for 8 days. Resting PV

93
increased by 8% while on the 440 mEq/d diet and 11 % on the 660 mEq/d diet vs. the 220
mEq/d diet. BV also increased by ~ 11 % on the 660 mEq/d diet. In a follow-up study by
the same group, 4 groups of males were assigned to a 50, 200, 400, and 550 mEq/d diet
for 7 days. PV was related to sodium intake, while PV at rest increased by 4 %, 8.7 %,
and 13.8 % from day 1 to day 7 in the 200, 400, and 550 mEq/d diets vs. the low 50
mEq/d diet (50).
The cardiovascular adaptations in middle age normal men and heart failure
patients consuming normal and high sodium diets were investigated while in resting
conditions. They consumed a diet of 100 mEq sodium/d for 5 days and then
supplemented for 6 days with an additional 150 mEq sodium/d while fluid was restricted
to 1.5-1.8 L/d. By the 3rd day of supplementation, left ventricular end-diastolic volume,
ejection fraction, CO, and SV were significantly higher (~15 %, 5 %, 24 %, and 2 %,
respectively), total peripheral resistance was ~15 % lower in the normal males, and heart
rate was not significantly different from baseline. By day 6, total peripheral resistance
continued to decline an additional 9 % while there were small increases in left ventricular
end-diastolic diameter, ejection fraction, CO, and SV due to the peripheral compensation
(107).
Cardiovascular and exercise performance in older heart failure patients and age-
matched male controls (57 y) were also investigated while consuming varying amounts of
sodium in their diet (29). Seven days of low vs. moderate-high sodium ingestion (70 vs.
250 mEq sodium/d) resulted in an increase in PV of 7 % at rest in a seated position.
Cardiac index and stroke volume index increased, while total peripheral resistance
decreased while at rest. During an incremental exercise test to fatigue (30 watts increase

94
every 3 min), cardiac index and stroke volume index were also higher during the
moderate-high sodium diet at both low (<70 % VO2max) and high intensity (>70 %
VO2max) exercise (~7 % and 5 %, respectively). Heart rate was not significantly
different and total peripheral resistance was ~6-7 % lower than baseline levels. Time to
fatigue during the incremental test was not significantly different. While a short term
increase in sodium intake alters cardiovascular function by increasing plasma volume and
stroke volume at rest and in older individuals during exercise, the effects on young,
healthy, untrained males during exercise have not been investigated.
5e. Homeostatic Responses
In healthy humans, mean arterial pressure is the primary variable that is regulated
during exercise. Thus an excess fluid load in the extracellular compartment will result in
compensation, such as decrease in total peripheral resistance to prevent an increase in
mean arterial pressure during exercise (28, 88). Ultimately, the extra fluid and sodium
load will be excreted via the kidneys to maintain homeostasis in healthy humans and the
fluid volume and sodium content will return to normal.
The attempt to maintain mean arterial pressure during increased sodium chloride
intake to offset increases in PV, SV, and CO by decreasing total peripheral resistance
occurs in healthy sodium resistant individuals (28, 88). However in sodium sensitive,
hypertensive, individuals, total peripheral resistance does not decline, thus mean arterial
pressure increases (88, 99). In addition to the alterations in total peripheral resistance,
additional homeostatic responses include an increase in daily urinary sodium excretion in
order to return the body fluid balance to normal levels. Typically, daily urinary sodium

95
excretion doubles within 48 hours of increasing sodium ingestion (28, 107). Thus, an
increase in plasma volume would most likely be maintained for shorter periods of time,
unless the renal system could not compensate for them.

96
Chapter VII: General Discussion
These studies determined the effects of sodium chloride supplementation on
serum sodium concentration, cardiovascular function and cognitive and physical
performance. Additionally, we investigated the effects of chronic sodium chloride
supplementation on sweat sodium concentration.
Study 1 determined that sweat sodium losses, alone, decreased serum sodium
concentration ~6 mEq/L in euhydrated endurance athletes with high sweat sodium losses
while exercising in the heat. This finding is in agreement with previously published
models of factors altering serum sodium concentration (69, 70). While prior
investigations have found varying degrees of success altering serum sodium
concentration with sodium chloride supplementation (52, 96, 104), ours is the first to find
that sodium chloride supplementation matching individual sweat sodium losses maintains
serum sodium concentration. Our methodology of first identifying those athletes most at
risk of decreasing serum sodium levels via sweat, those with high sweat sodium losses,
and then supplementing to match losses, was critical in determining this relationship as
sweat sodium losses are extremely variable (77).
While supplementing with sodium chloride matching sweat sodium losses, serum
sodium concentration was maintained. The maintenance of serum sodium concentration
resulted in an improved response time during the Stroop Test from pre- to post-exercise
while response time did not change when serum sodium concentration declined. Post-
exercise balance was also more stable while supplementing with sodium chloride
compared to when a placebo was ingested. While cognitive and postural tests have not

97
been made in athletes with low serum sodium levels, decrements have been seen in
patients hospitalized with hyponatremia (56). Additionally, we found small benefits to
physical performance compared to when serum sodium concentration declined during 3
hours of profuse sweating. Possible reasons for finding only small changes in physical
performance may be due to either fatigue of the 3 h exercise bout masking differences
due to decreased serum sodium concentration, only a moderate difference in serum
sodium concentration, or possibly the choice of performance task.
Study 2 determined that 3d of sodium chloride supplementation (~15 g NaCl/d)
compared to a placebo resulted in a higher plasma and blood volume at rest and during
exercise in healthy untrained males. Furthermore, stroke volume and cardiac output were
also higher during moderate intensity exercise with an increased sodium chloride
ingestion compared to a normal dietary intake. These results are similar to those found
following intravenous infusion of a plasma volume expander (57, 63). Prior
investigations of very low vs. high daily sodium chloride intake have also resulted in
plasma and blood volume expansion at rest (28, 29, 50, 107). The effects of increased
dietary sodium chloride supplementation on exercising stroke volume have only been
investigated in 1 study of older men (~57 y) (29). Our results in young healthy males (20
- 35y) were similar as we found an expansion of plasma volume (~8 %), blood volume
(~4 %), and stroke volume (~10 %) during steady state exercise. However, our
supplementation period was half as long (3 vs. 7 d), we used a steady state vs. ramp
protocol, and we compared normal vs. high daily intake, not a very low vs. moderate-high
intake.

98
Three days of sodium chloride supplementation also resulted in a 9 % increase in
sweat sodium concentration during exercise in the heat. The effect of daily sodium
intake on sweat sodium concentration has been mixed in previous studies (4, 7, 23, 66).
Prior investigations have compared very low vs. very high intake, investigated during a
heat acclimation protocol, or the sweat collection periods were very long and sweat losses
were small. All of these variables may also result in independent effects on sweat sodium
concentration, large sampling errors, or unrealistic dietary conditions. Our protocol
investigated normal vs. high intake in non heat-acclimatized males so that we could
determine the contributions of 3d of sodium chloride ingestion on sweat sodium losses.
While we did not measure aldosterone, prior studies have shown that large increases in
dietary sodium intake results in a decrease in plasma aldosterone (50). As aldosterone
has a sodium conservation effect, a decrease in aldosterone may have been responsible
for the increases in sweat sodium concentration in our study. This may seem to
contradict our 1st investigation of acute sodium supplementation as there were no
differences in sweat sodium concentration when serum sodium concentration declined by
6 mEq/L vs. when serum sodium was maintained via sodium supplementation. However,
in prior studies of acute changes in serum sodium concentration during exercise there
were no significant differences in plasma aldosterone compared to when serum sodium
concentration was maintained (95, 108). Therefore, sweat sodium concentration would
likely not be altered by an acute lowering of serum sodium concentration, as occurred in
our investigation.
There are several areas of further investigation which could be undertaken. One
avenue of exploration could be to further investigate physical performance with a larger

99
decline in serum sodium concentration, as our investigation only had a decline of ~ 6
mEq/L. Women could also be studied, as they typically have less total body water as a
percent of total body mass. Thus, lower sodium content would exist in the smaller ECF
compared to males with the same serum sodium concentration and similar sweat sodium
losses would result in greater declines in similar sodium concentration. In terms of
chronic sodium loading, a time course and dose response could be undertaken in order to
determine the optimal supplementation protocol. Additionally, performance tasks could
be studied such as a time trial, or possibly the measurement of VO2max, as this has been
known to increase in untrained males with intravenous infusion of plasma volume
expander (27). Lastly, while trained subjects already have an expanded blood volume,
this subject population could be investigated as acute sodium supplementation may have
an effect on performance (91).
In summary, these studies determined that when hydration status is maintained,
sodium chloride supplementation matching sweat sodium losses is necessary to maintain
serum sodium concentration during prolonged exercise when sweat sodium losses are
high. Without sodium supplementation, serum sodium concentration declines ~ 6 mEq/L
in subjects with high sweat sodium losses exercising in the heat for 3 hours. Maintaining
serum sodium levels by matching sweat sodium losses with sodium chloride
supplementation results in an improved cognitive function from pre- to post-exercise, as
response time improves ~11 %, while there is no change when serum sodium declines.
Post-exercise balance is improved 11-17 % while maintaining serum sodium
concentration compared to when serum sodium concentration declines. Additionally,
maximal power non-significantly declines by 3 % from pre- to post-exercise when

100
supplementing with sodium chloride to maintain serum sodium concentration, but the 4
% decrease in power is significant when serum sodium concentration falls. Furthermore,
in healthy males with a suboptimal exercising blood volume (e.g. non-endurance trained,
non heat-acclimated), 3d of sodium chloride supplementation results in an expanded
plasma volume (8 %). Stroke volume, cardiac output, and sweat sodium concentration
are also 8-10 % higher during exercise compared to a normal dietary intake. Therefore,
acute and chronic sodium supplementation positively alters fluid and sodium balance
which results in beneficial effects on physical and cognitive performance and
cardiovascular function during exercise.

101
APPENDIX A: General Exercise and Performance Tests
Steady state oxygen consumption and lactate threshold determination (Study 1)
Subjects cycled continuously for 5 stages, 5 minutes in length on an
electromagnetically braked ergometer (Excalibur Sport, Lode, Groningen, The
Netherlands). Each successive stage increased approximately 20 to 50 watts depending
on the training status and characteristics of the subject. Oxygen consumption was
collected throughout the 25 minute exercise period and averaged during the final minute
of each stage. Blood samples were taken at the end of edge stage from a finger stick for
the determination of lactate (Lactate Pro, Arkray, Japan). Lactate threshold was
determined as a 1 mmol increase in lactate above baseline levels.
Peak oxygen consumption
Following the steady state test and a 10 minute rest, peak oxygen consumption
(VO2peak) was determined using an incremental protocol to exhaustion lasting
approximately 8 to 12 minutes. The protocol began with a 2 min stage at approximately
75 % of HRmax. Three successive 2 min stages with an increase of 30 to 50 watts
followed (depending on subject characteristics and the submaximal test), and then an
increase of 20 to 30 watts per minute to exhaustion followed. Oxygen consumption and
carbon dioxide production were measured throughout the test. VO2peak was determined
as a plateau in oxygen consumption with increasing work rate, and a RER > 1.10.

102
Cognitive testing (Study 1)
The modified Stroop Color-Word Interference Test (LSA Stroop, FL) consisted of
five 45 second modules. The test difficulty level progressively increased during each
module. In short, the subjects were presented with a word (red, green, or blue) on a
screen. The color of the word either matched the meaning or was incongruent. Subjects
selected the color or the meaning depending on the module. In the final module, the
subjects selected the color or meaning based on if the word was framed by a box.
Accuracy and response time were recorded.
Balance Testing (Study 1)
The balance assessment task consisted of 3 trials of 3 stances while standing
barefoot on a 6 degree of freedom force plate (Bertec, Columbus, OH) which was
interfaced with a computer (Dell, Austin, TX). The stances included a 2 leg stance with
feet together and eyes open, single leg stance with eyes open, and single leg stance with
eyes closed. During stances with eyes open, subjects looked at a spot at head level. Each
trial lasted 30 seconds and there was a 15 second break between each repetition. The
order of stance conditions were a randomized crossover design between subjects and each
subject completed the same order for both of their trials. The center-of-pressure
amplitude (ACOP) were calculated in the anteroposterior (COPap) and mediolateral
(COPml) planes with custom software (Matlab, The Mathworks, Inc., Natick, MA).

103
Maximal neuromuscular power (Study 1)
Maximal neuromuscular power per pedal revolution, torque, and revolutions per
minute were measured on the PowerCycle prior to the 3 h ride and at 60, 120 min, and
following the 3 h ride. Subjects completed 4 all out efforts lasting 3-4 seconds each
during each testing session. Subjects remained seated on the ergometer for a 1 min rest
period between each trial.
Time Trial Task (Study 1)
Subjects completed a 20 min time trial in a thermoneutral environment. The
workrate was fixed for the first 5 min at a power output that elicited an oxygen
consumption that was 10 % above lactate threshold. After the first 5 min of the time trial,
subjects were free to alter the workrate at 30 sec intervals for the remaining 15min. The
same researcher provided verbal encouragement during both time trials.

104
APPENDIX B: Instrumentation & Analysis
Measurement of gas exchange (Study 1)
Inspired air volume was measured with a pneumotach (model 4813, Hans
Rudolph, Shawnee, KS) and expired gases were continuously sampled from a 4 L
mixing chamber (Vacumed, Ventura, CA) and analyzed for oxygen (S-3A/I, Ametek,
Pittsburgh, PA) and carbon dioxide (CD-3A, Ametek, Pittsburgh, PA). The analyzers
were interfaced to a computer for calculation of the rate of oxygen consumption and rate
of carbon dioxide production (Max II, AEI Technologies, Pittsburgh, PA).
Breath by breath gas measurement (Study 2)
Subjects breathed through a pneumotachometer (Hans Rudoloph, Kansas City,
MO) and two-way non rebreathing valve (2700 Series, Hans Rudolph, Shawnee, KS).
Oxygen and carbon dioxide gases were continuously sampled at the mouthpiece via a 6 ft
capillary tube. Gas concentrations were determined by a mass spectrometer (Perkin
Elmer MGA 1100, St. Louis, MO) interfaced with a computer for calculation of breath by
breath oxygen consumption and carbon dioxide production (Beck Integrated
Physiological Testing System).
Open circuit acetylene wash-in (Study 2)
Open circuit acetylene wash-in for the determination of cardiac output was
performed as described by Johnson et al (60). Briefly, at the end of a full expiration, the
participants breathed for a minimum of 8 breaths through a mouthpiece connected to a

105
bag filled with mixed gases, including 0.7% acetylene, 9.0% helium, 21% oxygen, and
balance nitrogen (all gases are medical grade and are safe for use with human
participants). The concentrations of acetylene and helium were monitored by continuous
sampling at the mouthpiece using a mass spectrometer. As the helium curve served as an
indication of the complete mixture of the gases in the system, no sooner was the
equilibrium of the helium reached than the region of the acetylene curve was made to
calculate cardiac output. From the wash-in curve of acetylene, the cardiac output was
calculated according to a single alveolar one-compartment lung model.
Core and Skin Temperatures
Rectal temperature was measured using a thermistor (YSI 401, Yellow Springs
Instruments, OH) inserted 12 cm past the anal sphincter. Skin temperature was measured
with surface thermistors (YSI 409A, Yellow Springs Instruments, OH) attached to the
skin at six sites (upper arm, forearm, chest, back, thigh, and calf) via an elastic strap or
athletic tape.
Blood measures
Hematocrit was measured in duplicate (Study 1) or triplicate (Study 2) following
microcentrifugation for 15 minutes. Hemoglobin was measured in duplicate (Study 1) or
triplicate (Study 2) using the cyanmethemoglobin method (35). Plasma volume change
was determined via the method of Dill and Costill (33). Whole blood was stored at room
temperature until clotting occurred and then centrifuged for 15 min.

106
Serum, sweat, and urine electrolyte analysis
Serum, sweat, and urine sodium were measured via electrochemistry (NOVA 5,
Waltham, MA). This system uses ion selective electrodes, calibration solutions, and a
reference electrode in order to determine the concentration of electrolytes in solution.
Sweating rate and sweat sodium concentration analysis
Sweating rate (L/h) was calculated as the change in nude body mass (Ohaus
Champ, ModelCQ250XL11W, Pinebrook, NJ) immediately prior to and after the
sweating analysis period (30-60 minute), accounting for fluid consumption and urine
loss. A waterproof “sweat patch”, composed of 7.6 x 7.6 cm gauze sponge (Johnson &
Johnson Medical, Arlington, TX) and 10 x 12 cm Tegaderm® bandage (3M Health Care,
St Paul, MN), was applied to the mid-posterior right forearm, right scapula, right mid-
anterior thigh, and calf for regional sweat collection. Prior to patch application, the area
was cleaned with 70 % isopropyl alcohol and rinsed with de-ionized water. When
necessary, these areas were gently shaved prior to cleaning and patch application. Upon
removal of the sweat patches, the gauze sponge was immediately separated from each
Tegaderm® bandage and placed into a plastic syringe (Study 1) or into a centrifuge filter-
less separation tube (Study 2). The sweat content of the sponges in the syringes was
“squeeze plunged” or obtained via centrifugation and pipette into four 5 ml plastic test
tubes and capped. Sweat electrolyte concentration was measured with a Nova 5 Analyzer
(Waltham, MA) with a manufacturer reported CV of 2 % for sodium analysis. A
modified weighted equation was used to calculate whole body sweat sodium
concentration (sweat sodium concentration = 0.11([Arm]) + 0.276([Back]) +

107
0.299([Thigh]) + 0.315([Calf])) (98). Whole body sweat sodium loss is the product of
whole body sweating rate and weighted sweat sodium concentration.
Serum and sweat osmolality (Study 1)
Serum and sweat osmolality was measured via freezing point depression methods
(3MO, Advanced Instruments, Needham Heights, MA).
Urine specific gravity
Urine specific gravity was measured via refractometry to ensure euhydration
status pre-exercise. All subjects were required to have a urine specific gravity of less than
1.020 in order to commence the trial.
Maximal Power (Study 1)
The inertial load ergometer uses the resistance created by the moment of inertia of
the flywheel to represent the force that the subject must accelerate during the test. Power
was calculated as the product of inertia, angular velocity and angular acceleration.
Flywheel angular velocity and acceleration were determined by an optical sensor and
micro-controller based computer interface which measures time (± 1 microsecond) and
allows power to be calculated instantaneously (IP) every 3 degrees of pedal crank
revolution or averaged over one complete revolution of the pedal cranks (Pmax). The
inertial load of the ergometer used in this study was 7.52 kgm². Inertial load is equal to
one-half the product of the moment of inertia (0.94 kgm²) and the gear ratio (4.00:1)
squared. The information that was collected by the optical sensor was converted from

108
analog to digital data prior to the transfer to the computer where it is stored as an ASCII
file. This file was then converted and analyzed using Microsoft Excel. This procedure
was developed by Martin et al. (65). Pmax values are calculated as the mean of the trials
with the highest Pmax of 4 efforts.
Time Trial Performance (Study 1)
Work was calculated every 30 seconds (J = Watts * 30). Total work completed
during the 20 minute time trial was calculated as the sum of 30 second intervals.

109
APPENDIX C: INDIVIDUAL DATA
Body Mass (kg) Study 1 PL Time (min) Pre 0 30 60 90 120 150 180 AG 84.17 85.11 85.75 85.35 85.80 85.70 84.65 BA 84.45 84.70 84.90 84.90 85.50 86.00 85.70 84.95 CC 73.88 74.65 74.90 75.05 75.20 75.50 75.25 74.30 EH 86.35 86.80 87.15 87.25 87.35 87.45 87.50 86.85 JC 82.65 83.10 83.50 83.75 84.00 84.25 84.15 83.60 JS 83.75 84.50 84.75 85.10 85.25 85.50 84.70 84.00 JT 62.52 63.25 63.45 63.50 63.40 63.55 63.20 62.60 KK 82.35 83.00 83.30 83.00 82.95 82.85 82.75 82.45 KS 83.25 83.60 84.25 84.05 84.15 84.30 83.15 82.20 RF 90.60 91.25 91.35 91.05 90.95 91.00 91.40 90.95 ZF 77.75 78.65 78.80 78.65 78.60 79.40 79.18 78.80 MEAN 81.07 81.69 82.01 81.97 81.74 82.33 82.06 81.40 SE 2.3 2.2 2.3 2.2 2.5 2.2 2.3 2.3
NA Time (min) Pre 0 30 60 90 120 150 180 AG 85.85 86.70 86.90 86.75 86.60 86.50 86.15 85.30 BA 84.25 84.40 84.50 84.20 84.80 85.40 85.00 84.10 CC 73.76 74.20 74.55 74.60 74.60 74.70 74.40 73.50 EH 87.25 87.90 88.30 88.35 88.50 88.60 88.60 88.00 JC 84.00 84.72 85.00 84.95 85.00 85.00 84.55 83.90 JS 85.40 85.85 86.50 86.20 86.30 86.30 85.30 84.50 JT 62.62 63.25 63.35 63.40 63.40 63.50 63.15 62.50 KK 80.70 81.48 81.90 81.80 81.80 81.60 81.65 81.20 KS 81.42 82.35 82.75 83.25 83.20 83.50 82.35 81.40 RF 90.65 91.20 91.10 90.70 90.60 90.70 91.35 90.70 ZF 78.18 79.05 79.10 79.35 79.50 79.80 79.63 79.20 MEAN 81.28 81.92 82.18 82.14 82.21 82.33 82.01 81.30 SE 2.3 2.3 2.3 2.3 2.3 2.3 2.3 2.3

110
Serum Sodium Concentration (mEq/L) Study 1 PL Time (min) 0 60 120 180 AG 144.5 141.5 138.0 137.5 BA 147.0 143.0 139.0 139.0 CC 142.5 137.0 135.5 137.0 EH 142.0 139.0 136.0 136.0 JC 145.5 142.0 140.5 137.5 JS 145.0 141.5 139.0 138.0 JT 142.0 140.0 140.0 139.0 KK 144.0 139.0 135.5 135.5 KS 142.0 139.0 136.0 137.0 RF 142.0 140.7 140.0 137.0 ZF 142.0 139.0 134.0 135.0 MEAN 143.5 140.2 137.6 137.1 SE 0.5 0.5 0.7 0.4
NA Time (min) 0 60 120 180 AG 143.0 142.0 141.0 145.0 BA 146.0 143.0 140.0 144.0 CC 142.0 140.0 138.0 141.0 EH 143.0 142.0 141.0 138.0 JC 144.0 139.0 140.0 143.0 JS 144.0 142.0 142.0 147.0 JT 143.0 140.0 138.0 142.0 KK 144.0 142.0 138.0 144.0 KS 140.5 137.0 137.0 141.0 RF 143.5 142.0 143.0 140.0 ZF 144.5 143.0 140.0 141.0 MEAN 143.4 141.1 139.8 142.4 SE 0.4 0.6 0.6 0.8

111
Serum Potassium (mEq/L) Study 1 PL Time (min) 0 60 120 180 KS 4.1 4.4 4.7 4.8 JS 4.3 5.3 5.4 5.6 BA 4.2 4.8 4.7 AG 4.0 4.8 4.9 4.9 CC 3.8 4.3 4.7 4.4 KK 4.1 5.4 5.9 5.6 JC 3.9 4.4 4.6 4.7 RF 4.2 4.9 4.9 4.9 ZF 3.9 5.3 4.9 4.5 EH 4.7 4.8 4.7 4.4 JT 4.1 4.1 4.4 5.8 MEAN 4.1 4.8 4.9 4.9 SE 0.1 0.1 0.1 0.2
NA Time (min) 0 60 120 180 KS 3.9 4.9 4.7 5.0 JS 4.7 5.3 5.8 5.3 BA 4.3 4.9 4.8 4.1 AG 4.2 4.5 4.8 4.7 CC 3.7 4.4 4.6 4.5 KK 4.2 5.2 5.1 5.2 JC 4.0 4.7 4.7 4.7 RF 4.2 5.1 5.1 4.5 ZF 4.6 5.3 5.1 5.3 EH 4.2 5.0 4.7 4.9 JT 3.6 4.3 4.3 4.3 MEAN 4.1 4.9 4.9 4.8 SE 0.1 0.1 0.1 0.1

112
Serum Chloride (mEq/L) Study 1 PL Time (min) 0 60 120 180 KS 104.0 102.0 98.0 98.0 JS 104.0 105.5 102.0 102.0 BA 105.5 104.0 96.5 AG 104.0 103.5 97.0 100.5 CC 103.0 99.0 97.0 95.0 KK 118.0 114.5 110.0 109.0 JC 107.0 104.0 101.5 100.0 RF 119.0 117.0 117.0 115.0 ZF 119.0 116.0 112.0 112.0 EH 115.0 113.0 110.0 107.0 JT 107.0 105.0 103.0 120.0 MEAN 109.6 107.6 104.8 105.0 SE 2.0 1.9 2.2 2.5
NA Time (min) 0 60 120 180 KS 102.0 99.5 98.0 101.0 JS 110.0 107.0 120.0 112.0 BA 107.0 106.0 106.0 105.0 AG 103.0 102.0 105.0 107.0 CC 102.0 101.0 100.0 103.0 KK 123.0 119.0 119.0 123.0 JC 118.0 115.0 116.0 119.0 RF 117.0 117.0 119.0 121.0 ZF 119.0 118.0 117.0 115.0 EH 117.0 114.0 113.0 114.0 JT 103.0 102.0 100.0 104.0 MEAN 111.0 109.1 110.3 111.3 SE 2.4 2.3 2.6 2.3

113
Serum Osmolality (mOsm/L) Study 1 PL Time (min) 0 60 120 180 AG 292 284 277 274 BA 295 284 279 275 CC 287 277 277 278 EH 292 283 280 277 JC 288 277 274 270 JS 292 284 279 277 JT 285 276 277 274 KK 290 281 276 277 KS 293 286 276 277 RF 290 287 285 278 ZF 293 287 278 278 MEAN 290.4 282.3 277.8 275.7 SE 0.9 1.2 0.9 0.7
NA Time (min) 0 60 120 180 AG 290 285 287 292 BA 293 288 280 289 CC 289 286 281 278 EH 290 288 284 279 JC 288 283 283 289 JS 289 287 286 293 JT 285 280 278 284 KK 292 288 289 289 KS 285 277 276 281 RF 289 287 292 287 ZF 293 290 284 282 MEAN 289.4 285.4 283.6 285.7 SE 0.8 1.2 1.4 1.6

114
Hematocrit (%) Study 1 PL Time (min) 0 60 120 180 AG 48.4 51.1 50.9 49.8 BA 46.0 46.1 46.0 45.9 CC 46.0 47.6 47.4 48.0 EH 43.0 44.4 45.1 45.7 JC 46.4 47.7 47.7 46.2 JS 42.3 42.5 42.6 43.4 JT 43.7 44.3 43.1 43.0 KK 46.7 46.7 48.5 49.0 KS 47.6 47.3 49.8 50.6 RF 48.4 50.2 50.1 49.1 ZF 43.8 46.2 46.6 47.1 MEAN 45.7 46.7 47.1 47.1 SE 0.7 0.8 0.8 0.8
NA Time (min) 0 60 120 180 AG 48.6 49.3 48.0 45.5 BA 44.9 45.5 43.7 43.7 CC 45.1 46.1 45.2 42.5 EH 44.1 46.5 46.4 43.9 JC 43.8 46.0 45.6 45.4 JS 39.3 39.6 39.8 39.5 JT 44.7 43.5 42.9 43.1 KK 43.7 46.1 43.8 44.1 KS 50.3 51.3 49.7 50.2 RF 51.9 50.4 50.9 49.2 ZF 46.8 48.1 46.9 45.3 MEAN 45.7 46.6 45.7 44.8 SE 1.1 1.0 1.0 0.9

115
Hemoglobin (g/dL) Study 1 PL Time (min) 0 60 120 180 AG 15.3 16.4 16.4 16.4 BA 17.9 18.2 15.8 15.0 CC 14.3 14.5 14.2 14.7 EH 13.2 14.6 14.1 14.9 JC 14.2 14.5 14.9 14.8 JS 12.6 12.8 12.9 13.1 JT 15.7 16.2 15.9 15.2 KK 14.8 14.7 14.7 14.7 KS 15.3 15.7 15.7 15.8 RF 14.9 15.3 15.6 15.3 ZF 16.0 14.6 14.5 15.0 MEAN 14.9 15.2 15.0 15.0 SE 0.4 0.4 0.3 0.2
NA Time (min) 0 60 120 180 AG 15.8 15.8 15.1 15.5 BA 13.9 14.0 13.7 13.7 CC 14.3 14.1 13.9 13.7 EH 13.2 14.9 14.6 15.0 JC 14.4 15.2 15.1 15.0 JS 12.7 12.4 12.8 12.8 JT 17.1 16.5 16.4 16.8 KK 14.2 14.6 14.3 14.4 KS 16.4 16.5 15.8 15.8 RF 16.1 15.7 16.3 16.3 ZF 14.8 15.5 14.9 14.9 MEAN 14.8 15.0 14.8 14.9 SE 0.4 0.4 0.3 0.4

116
Mean Corpuscular Hemoglobin Concentration (g/dL) Study 1 PL Time (min) 0 60 120 180 AG 31.5 32.1 32.3 32.8 BA 38.8 39.6 34.2 32.6 CC 31.0 30.6 29.9 30.7 EH 30.7 32.9 31.3 32.5 JC 30.6 30.4 31.2 31.9 JS 32.1 33.1 31.5 31.2 JT 36.0 36.6 36.8 35.2 KK 31.6 31.4 30.3 30.0 KS 32.1 33.1 31.5 31.2 RF 30.8 30.4 31.2 31.1 ZF 36.5 31.6 31.2 31.7 MEAN 32.9 32.9 31.9 31.9 SE 0.9 0.9 0.6 0.4
NA Time (min) 0 60 120 180 AG 32.5 32.1 31.5 34.0 BA 30.9 30.8 31.3 31.4 CC 30.1 30.5 30.8 32.1 EH 33.1 32.1 31.4 34.1 JC 32.8 32.9 33.0 33.0 JS 32.7 32.2 32.6 31.4 JT 38.3 37.9 38.1 38.9 KK 32.6 31.7 32.6 32.7 KS 32.7 32.2 31.9 31.6 RF 31.0 31.1 32.0 33.0 ZF 31.6 32.2 31.8 32.9 MEAN 32.6 32.3 32.5 33.2 SE 0.6 0.6 0.6 0.6

117
Urine Volume (ml) Study 1 PL Time (min) 0 30 60 90 120 150 180 Total KS 475 665 432 400 449 303 2724 JS 230 185 125 540 BA 271 270 342 375 470 445 400 2573 AG 478 500 268 211 1457 CC 212 195 240 352 107 1106 KK 150 380 380 360 360 285 1915 JC 140 90 130 128 110 190 120 908 RF 308 532 510 342 447 340 2479 ZF 210 190 307 240 240 200 1387 EH 50 90 121 162 80 50 40 593 JT 312 247 305 442 290 408 100 2104 MEAN 249.6 200.8 333.8 316.1 310.2 303.1 210.6 1616.9 SE 73.1 25.4 57.7 41.7 48.8 41.8 37.6 238.5
NA Time (min) 0 30 60 90 120 150 180 Total KS 305 533 337 520 400 2095 JS 185 162 395 387 355 387 240 2111 BA 371 395 415 450 465 455 430 2981 AG 425 600 638 590 595 219 3067 CC 332 172 260 310 275 325 205 1879 KK 160 400 420 405 420 100 1905 JC 150 230 270 290 520 230 1690 RF 470 562 445 355 135 525 2492 ZF 230 318 325 330 228 1431 EH 25 30 220 172 120 0 0 567 JT 330 285 416 265 429 255 1980 MEAN 228.3 257.2 368.5 404.1 343.8 374.2 257.5 2018.0 SE 78.7 41.5 41.8 41.7 36.1 52.6 44.6 210.2

118
Urine Sodium Loss (mEq) Study 1 PL Time (min) 0 30 60 90 120 150 180 Total AG 12.4 12.4 BA 16.7 4.1 5.1 7.1 9.4 6.7 4.0 53.0 CC 17.7 1.6 0.0 19.3 EH 4.3 1.0 1.0 1.6 7.9 JC 1.3 1.3 JS 6.9 3.2 1.8 11.9 JT 6.9 3.2 4.3 6.4 4.2 6.7 1.0 32.7 KK 7.5 7.5 KS 19.2 8.3 4.3 5.0 5.4 3.0 45.3 RF 18.3 10.6 6.1 2.7 3.1 41.0 ZF 10.3 2.3 12.6 MEAN 9.7 8.6 5.7 4.1 5.3 4.7 2.7 22.3 SE 3.5 2.3 1.5 1.0 1.4 1.0 0.9 5.3
NA Time (min) 0 30 60 90 120 150 180 Total AG 8.1 5.4 5.7 7.7 10.7 8.1 45.7 BA 5.9 5.5 7.9 8.6 9.3 8.2 6.9 52.3 CC 25.2 3.5 3.3 4.3 3.3 2.9 42.6 EH 3.2 1.8 2.4 1.9 9.3 JC 5.0 3.7 3.8 4.6 9.1 3.5 29.6 JS 28.1 8.4 11.1 9.7 8.9 9.7 8.9 84.7 JT 10.4 3.6 6.0 3.3 6.4 2.7 32.4 KK 15.3 9.8 5.9 6.1 8.4 1.8 47.2 KS 5.0 5.4 4.8 15.2 RF 19.7 7.3 6.0 3.9 2.8 6.8 46.6 ZF 8.3 3.5 3.3 15.0 MEAN 15.6 8.6 5.8 5.8 5.5 7.1 5.4 38.2 SE 6.4 1.7 1.0 0.8 0.7 1.0 0.9 6.5

119
Urine Sodium Concentration (mEq/L) Study 1 PL Time (min) 0 30 60 90 120 150 180 AG 26 0 0 0 BA 62 15 15 19 20 15 10 CC 84 8 0 0 0 EH 85 11 8 10 0 0 0 JC 9 0 0 0 0 0 0 JS 30 18 14 JT 22 13 14 15 15 17 10 KK 50 0 0 0 0 0 KS 41 13 10 13 12 10 RF 60 20 12 8 7 0 ZF 49 12 0 0 0 0 MEAN 43.7 34.6 11.6 8.3 6.1 5.9 3.0 SE 13.7 9.2 2.6 2.4 2.6 2.1 1.5
NA Time (min) 0 30 60 90 120 150 180 AG 19 9 9 13 18 37 BA 16 14 19 19 20 18 16 CC 76 21 13 14 12 9 0 EH 127 60 11 11 0 16 0 JC 33 16 14 16 18 15 JS 152 52 28 25 25 25 37 JT 32 13 15 13 15 11 KK 96 25 14 15 20 18 KS 0 0 0 11 12 12 RF 42 13 14 11 21 13 ZF 36 11 10 0 0 MEAN 92.8 36.7 14.2 13.4 13.2 15.5 14.4 SE 30.1 7.8 2.3 2.0 1.9 2.0 3.9

120
Urine Potassium Concentration (mEq/L) Study 1 PL Time (min) 0 30 60 90 120 150 180 AG 37 20 18 20 BA 17 9 8 0 10 11 11 CC 27 10 0 14 18 EH 94 30 24 23 30 33 34 JC 15 21 18 19 20 20 17 JS 25 26 36 JT 9 10 0 8 8 14 17 KK 50 19 18 21 20 19 KS 0 0 0 0 0 9 RF 36 17 15 16 15 16 ZF 47 30 23 28 21 24 MEAN 27.1 28.2 16.3 13.2 17.0 18.4 18.4 SE 17.0 4.8 3.8 3.3 3.2 3.0 2.2
NA Time (min) 0 30 60 90 120 150 180 AG 47 22 19 20 22 41 BA 10 10 11 10 11 11 11 CC 12 12 9 9 14 14 16 EH 79 68 19 20 25 68 0 JC 28 17 17 17 16 19 JS 41 31 17 15 14 14 37 JT 19 10 8 12 20 16 KK 49 19 0 0 17 16 KS 0 0 9 10 11 13 RF 39 10 20 22 41 23 ZF 39 22 22 27 31 MEAN 35.9 31.0 14.0 12.7 15.1 23.6 20.2 SE 16.2 6.0 2.0 2.1 2.1 5.2 3.6

121
Urine Chloride Concentration (mEq/L) Study 1 PL Time (min) 0 30 60 90 120 150 180 AG 51 21 20 19 BA 59 0 0 0 20 0 0 CC 128 0 9 0 0 EH 173 32 23 0 0 0 0 JC 0 20 0 0 0 0 20 JS 46 31 31 JT 21 0 0 16 18 0 0 KK 92 0 0 0 0 0 KS 38 0 0 0 0 0 RF 86 26 19 0 0 0 ZF 77 26 0 0 0 0 MEAN 58.1 53.3 12.6 7.5 6.6 4.6 3.9 SE 30.3 14.9 5.7 3.5 3.3 3.2 2.6
NA Time (min) 0 30 60 90 120 150 180 AG 53 22 20 27 30 61 BA 0 0 0 23 23 21 23 CC 82 27 0 0 18 0 0 EH 220 156 0 20 21 68 0 JC 51 22 19 21 19 20 JS 188 69 34 29 28 28 44 JT 42 0 18 20 20 21 KK 147 30 12 14 25 21 KS 0 0 0 0 0 0 RF 64 19 19 0 37 0 ZF 64 0 18 18 26 MEAN 122.4 60.9 11.5 15.9 17.2 24.0 19.5 SE 50.4 15.2 4.1 3.0 2.8 5.5 5.9

122
Urine Osmolality (mOsm/L) Study 1 PL Time (min) 0 30 60 90 120 150 180 AG 218 107 112 BA 123 100 107 105 102 88 CC 539 122 97 112 141 EH 621 227 199 151 208 216 242 JC 144 184 153 164 149 141 149 JS 331 249 294 JT 89 88 81 81 84 94 KK 555 140 112 113 114 107 KS 86 74 78 76 83 RF 351 135 116 123 115 114 ZF 707 227 181 193 194 213 MEAN 284.3 344.9 146.0 133.0 128.6 151.4 134.0 SE 168.8 71.5 16.7 17.0 15.2 23.3 17.0
NA Time (min) 0 30 60 90 120 150 180 AG 231 107 96 99 116 217 BA 89 123 99 107 109 106 107 CC 346 172 101 94 103 95 110 EH 705 572 148 144 173 386 JC 226 115 108 114 106 117 JS 571 301 166 149 142 148 192 JT 167 83 78 83 80 89 KK 691 190 110 108 140 126 KS 77 0 83 81 78 83 RF 274 110 129 146 220 129 ZF 414 185 167 164 169 MEAN 427.6 295.1 118.3 109.5 120.2 125.1 156.7 SE 135.0 57.7 16.2 7.6 9.6 13.8 26.2

123
Heart Rate (beats/min) Study 1 PL Time(min) 0 30 45 60 75 90 105 120 135 150 165 180
AG 109 116 115 115 115 123 121 116 120 130 133
BA 117 119 124 117 122 124 123 124 124 124 122 124
CC 120 129 130 165 130 130 134 130 134 137 136 139
EH 130 141 135 149 150 150 145 146 147 150 158
JC 126 132 135 139 142 135 135 131 138 142 140 141
JS 115 117 120 123 124 123 116 122 126 127 126 125
JT 141 136 136 140 141 138 139 142 150 144 151 147
KK 127 135 132 132 127 135 133 129 136 132 132
KS 115 115 114 115 111 114 114 118 116 122 121 122
RF 123 128 127 130 130 137 132 131 137 137 164 136
ZF 119 119 137 139 143 139 139 138 142 142 140 140
MEAN 121.2 125.1 128.3 131.8 130.4 131.6 130.5 129.6 133.5 135.4 137.5 136.5
SE 2.8 2.4 2.7 4.4 3.7 3.0 3.3 2.8 3.3 2.8 4.0 3.5
NA Time(min) 0 30 45 60 75 90 105 120 135 150 165 180
AG 115 121 120 120 118 121 118 123 128 128 127
BA 111 130 120 125 128 123 126 131 127 130 132
CC 124 129 130 160 124 130 132 128 127 131 136 138
EH 133 145 139 140 146 146 144 148 152 151 153
JC 101 130 127 131 129 134 136 139 143 144
JS 115 120 118 117 114 119 121 121 118 119 124 126
JT 147 147 147 139 142 141 142 142 150 146 151 154
KK 140 144 137 144 145 143 143 147 142 148 147
KS 108 108 110 114 112 113 114 114 114 113 116 118
RF 127 127 131 132 139 138 140 140 150 141 145
ZF 127 130 131 126 132 131 134 132 132 138 135 138
MEAN 122.5 130.1 127.1 131.6 129.5 130.4 131.8 132.5 134.1 134.6 137.9 137.4
SE 4.2 3.5 3.3 4.5 3.5 3.2 3.3 3.1 3.8 4.0 4.5 3.7

121
Core Temperature(°C) Study 1 PL Time (min) 0 15 30 45 60 75 90 105 120 135 150 165 180 AG 36.9 37.5 37.3 37.5 37.5 37.4 37.5 37.4 37.4 37.4 37.6 37.7 37.8 BA 37.0 37.7 37.6 37.5 37.6 37.7 37.8 37.9 37.9 37.8 37.9 37.9 37.9 CC 37.0 37.6 37.6 37.6 37.6 37.7 37.7 37.7 37.7 37.7 37.7 37.7 37.8 EH 38.1 38.4 38.6 38.6 38.6 38.5 38.6 38.4 38.5 38.4 38.5 38.5 38.6 JC 37.3 37.7 37.9 38.0 38.1 38.4 38.3 38.3 38.3 38.2 38.3 38.3 38.2 JS 37.5 37.4 37.9 38.1 38.1 38.0 38.1 38.1 38.1 37.7 38.0 38.1 38.1 JT 38.0 38.0 38.0 38.1 37.6 38.1 37.8 38.2 37.6 38.1 37.9 38.1 38.2 KK 37.4 37.7 37.8 37.9 37.9 37.8 38.0 38.0 38.0 37.9 38.1 37.9 37.9 KS 37.9 27.7 37.9 37.7 37.8 37.8 37.8 38.0 38.0 37.8 37.9 38.0 38.0 RF 37.3 38.1 37.7 37.8 37.7 37.8 37.8 37.7 37.8 37.8 37.9 72.0 37.8 ZF 37.3 38.0 37.7 37.8 37.7 37.8 37.8 37.8 37.9 37.7 37.5 37.9 37.9 MEAN 37.4 36.9 37.8 37.9 37.8 37.9 37.9 38.0 37.9 37.9 37.9 41.1 38.0 SE 0.1 0.9 0.1 0.1 0.1 0.1 0.1 0.1 0.1 0.1 0.1 3.1 0.1
NA Time (min) 0 15 30 45 60 75 90 105 120 135 150 165 180 AG 36.8 37.4 37.5 37.5 37.5 37.5 37.5 37.6 37.7 37.6 37.7 37.8 37.8 BA 37.2 37.4 37.8 37.8 37.9 38.0 37.9 37.8 37.9 37.9 37.7 37.8 37.9 CC 37.0 37.8 37.9 37.8 37.9 37.7 37.8 37.9 37.9 37.9 38.1 37.9 38.1 EH 37.6 38.2 38.4 38.3 38.4 38.4 38.5 38.4 38.5 38.4 38.6 38.5 38.6 JC 37.1 37.6 37.8 37.9 38.1 38.1 38.2 38.1 38.2 38.2 38.4 38.3 38.3 JS 37.4 37.5 37.8 37.9 37.9 38.1 38.0 38.0 37.9 38.0 38.0 38.0 38.0 JT 37.6 37.9 38.0 38.1 37.6 38.0 38.0 38.1 37.6 38.0 38.0 38.1 38.2 KK 37.8 37.7 37.9 37.9 37.8 37.8 37.8 37.8 37.9 38.1 38.1 38.1 38.1 KS 37.4 37.9 37.9 37.9 37.9 37.9 38.0 38.0 38.0 37.9 37.9 38.0 38.0 RF 37.5 37.5 37.8 37.8 37.8 37.7 37.8 37.8 37.9 37.9 37.8 37.8 37.9 ZF 37.3 38.4 37.8 37.9 37.9 37.8 37.9 37.9 37.9 37.8 37.5 37.7 37.8 MEAN 37.3 37.8 37.9 37.9 37.9 37.9 37.9 37.9 37.9 38.0 38.0 38.0 38.1 SE 0.1 0.1 0.1 0.1 0.1 0.1 0.1 0.1 0.1 0.1 0.1 0.1 0.1

122
Mean Arterial Pressure (mmHg) Study 1 PL Time (min) 45 105 165 AG 118.7 111.7 BA 114.7 99.3 96.0 CC 68.7 100.0 103.3 EH 98.7 104.7 99.3 JC 106.7 104.7 102.0 JS 89.3 95.3 94.7 JT 103.3 86.7 83.3 KK 105.0 KS 106.3 102.7 104.0 RF 100.0 107.3 70.9 ZF 117.3 169.3 109.3 MEAN 102.6 108.2 95.9 SE 4.3 7.1 4.0
NA Time (min) 45 105 165 AG 111.3 110.7 110.0 BA 90.0 99.3 95.3 CC 67.6 92.0 94.0 EH 92.0 91.3 88.0 JC 117.3 108.0 94.7 JS 96.0 95.3 98.0 JT 86.7 83.3 80.0 KK 109.3 110.7 114.7 KS 105.3 102.0 102.0 RF 107.3 72.5 ZF 119.3 128.0 123.3 MEAN 99.5 102.5 97.5 SE 5.1 3.7 4.5

123
Rating of Perceived Exertion Study 1 PL Time (min) 0 75 120 150 180 AG 11 11 13 12 13 BA 9 11 12 13 14 CC 13 12 12 12 13 EH 11 12 12 12 13 JC 12 12 13 13 14 JS 12 11 12 12 13 JT 10 12 13 15 15 KK 11 12 12 13 14 KS 9 10 11 12 12 RF 13 13 14 14 15 ZF 9 11 12 12 13 MEAN 10.9 11.5 12.4 12.7 13.5 SE 0.5 0.2 0.2 0.3 0.3
NA Time (min) 0 75 120 150 180 AG 12 12 13 13 15 BA 7 10 11 15 16 CC 12 12 12 12 13 EH 11 12 13 12 13 JC 12 12 13 13 14 JS 11 11 11 11 13 JT 11 12 13 15 15 KK 13 13 13 13 14 KS 8 10 12 13 13 RF 14 15 15 15 16 ZF 9 11 12 12 13 MEAN 10.9 11.8 12.5 13.1 14.1 SE 0.6 0.4 0.3 0.4 0.4

124
Sweating Rate (L/h) Study 1 PL Time (min) 0-30 30-60 60-90 90-120 120-150 150-180 AG 1.47 1.87 1.82 1.82 1.90 1.88 BA 1.21 1.46 1.40 1.41 1.45 1.32 CC 1.36 1.60 1.51 1.59 1.42 1.90 EH 1.33 1.78 1.70 1.86 1.59 1.86 JC 1.17 1.39 1.39 1.43 1.56 1.59 JS 1.40 1.66 1.69 1.86 1.71 1.70 JT 1.36 1.54 1.57 1.37 1.70 1.85 KK 1.42 2.16 1.66 1.80 1.86 0.60 KS 1.47 1.84 1.71 1.67 2.10 1.80 RF 1.59 1.94 1.59 2.02 1.68 1.52 ZF 1.98 1.27 2.18 1.96 2.17 2.36 MEAN 1.43 1.68 1.66 1.71 1.74 1.67 SE 0.1 0.1 0.1 0.1 0.1 0.1
NA Time (min) 0-30 30-60 60-90 90-120 120-150 150-180 AG 1.52 1.87 1.80 1.79 1.75 1.48 BA 1.36 1.52 1.35 1.22 1.53 1.56 CC 1.24 1.77 1.67 1.64 1.48 1.59 EH 1.36 1.68 1.58 1.88 1.69 1.84 JC 1.29 1.59 1.51 1.57 1.60 1.67 JS 0.74 2.17 1.39 1.65 1.59 1.52 JT 1.56 1.58 1.62 1.52 1.66 1.44 KK 1.16 1.72 1.48 1.65 1.70 1.30 KS 1.36 1.77 1.81 1.50 1.77 1.80 RF 1.67 2.08 1.82 1.80 1.80 1.55 ZF 2.14 1.56 1.76 1.55 1.79 1.31 MEAN 1.40 1.76 1.62 1.61 1.67 1.55 SE 0.1 0.1 0.1 0.1 0.0 0.1

125
Sweat Sodium Concentration (mEq/L) Study 1 PL Time (min) 30-60 120-150 AG 65.4 69.9 BA 78.2 91.6 CC 46.0 51.5 EH 80.5 81.2 JC 61.5 72.8 JS 85.0 89.1 JT 42.4 42.2 KK 83.2 107.7 KS 65.6 74.8 RF 40.7 43.7 ZF 58.0 54.8 MEAN 64.2 70.8 SE 4.9 6.4
NA Time (min) 30-60 120-150 AG 55.4 61.0 BA 66.3 71.2 CC 63.7 68.4 EH 100.8 87.6 JC 72.0 80.9 JS 77.4 91.6 JT 47.2 47.9 KK 93.0 104.1 KS 59.9 67.0 RF 45.0 48.1 ZF 42.7 48.7 MEAN 65.8 70.6 SE 5.7 5.7

126
Sweat Sodium Loss (mEq/h) Study 1 PL Time (min) 30-60 120-150 AG 122.3 133.0 BA 114.2 132.8 CC 73.6 73.3 EH 143.1 129.2 JC 85.4 113.5 JS 141.0 152.4 JT 65.3 71.9 KK 180.1 199.9 KS 120.9 157.2 RF 79.0 73.3 ZF 73.7 119.0 MEAN 109.0 123.2 SE 11.1 12.0
NA Time (min) 30-60 120-150 AG 103.6 106.7 BA 100.8 108.9 CC 112.7 101.1 EH 169.3 148.0 JC 114.3 129.1 JS 168.1 145.6 JT 74.6 79.6 KK 160.4 176.5 KS 106.1 118.4 RF 93.8 86.8 ZF 66.5 87.3 MEAN 115.5 117.1 SE 10.7 9.1

127
Sweat Sodium Concentration (mEq/L) Study 1 PL Time (min) 30-60 30-60 30-60 30-60 120-150 120-150 120-150 120-150 Arm Back Thigh Calf Arm Back Thigh Calf AG 62 80 60 60 64 89 51 74 BA 75 88 70 79 81 90 83 105 CC 43 74 36 32 49 80 36 43 EH 76 113 70 64 85 108 72 66 JC 61 83 54 50 65 76 85 61 JS 72 99 72 90 83 95 80 95 JT 31 60 39 35 34 58 40 35 KK 90 101 82 67 93 104 84 139 KS 62 88 59 54 66 87 64 78 RF 40 55 34 36 41 54 42 38 ZF 58 58 56 60 54 57 51 58 MEAN 60.7 81.5 57.4 56.9 64.8 81.4 62.4 71.8 SE 5.3 5.7 4.8 5.5 5.8 5.6 5.8 9.5
NA Time (min) 30-60 30-60 30-60 30-60 120-150 120-150 120-150 120-150 Arm Back Thigh Calf Arm Back Thigh Calf AG 54 76 47 46 61 82 49 55 BA 64 78 63 61 83 75 60 75 CC 67 97 52 45 74 101 53 53 EH 139 137 80 76 95 120 76 68 JC 79 87 71 58 94 89 76 75 JS 51 89 59 95 67 93 73 117 JT 41 73 39 35 43 71 41 36 KK 98 106 92 82 108 110 101 102 KS 59 78 53 52 57 76 53 76 RF 40 61 38 41 48 59 43 44 ZF 39 54 40 37 45 56 43 50 MEAN 66.2 84.8 57.4 56.9 70.3 84.4 60.6 68.1 SE 9.0 6.9 5.3 5.9 6.6 6.1 5.6 7.4

128
Sweat Chloride Concentration (mEq/L) Study 1 PL Time (min) 30-60 30-60 30-60 30-60 120-150 120-150 120-150 120-150 Arm Back Thigh Calf Arm Back Thigh Calf AG 55 72 54 52 58 84 45 67 BA 58 72 52 55 71 82 73 93 CC 39 69 31 28 44 76 34 38 EH 66 106 58 50 73 99 60 52 JC 44 66 37 25 66 60 75 45 JS 67 94 67 87 78 89 75 92 JT 22 46 26 23 30 52 33 28 KK 86 97 76 60 85 95 74 143 KS 56 82 52 46 67 82 58 73 RF 35 48 28 30 37 48 36 33 ZF 53 50 48 51 48 50 44 51 MEAN 52.7 72.8 48.0 46.0 59.5 74.0 54.9 64.8 SE 5.3 6.1 4.8 5.7 5.4 5.6 5.2 10.2
NA Time (min) 30-60 30-60 30-60 30-60 120-150 120-150 120-150 120-150 Arm Back Thigh Calf Arm Back Thigh Calf AG 51 73 43 42 54 76 43 46 BA 57 69 53 50 77 69 53 65 CC 61 92 44 37 66 94 44 44 EH 74 128 63 57 66 94 64 55 JC 73 79 62 48 88 80 67 65 JS 48 89 60 102 66 91 72 127 JT 35 66 32 28 KK 93 100 83 71 103 106 98 97 KS 53 73 47 44 0 0 0 0 RF 35 57 31 34 35 44 30 34 ZF 34 48 33 30 37 45 33 40 MEAN 55.5 79.2 49.9 49.2 59.2 69.8 50.2 57.2 SE 5.6 6.7 4.8 6.4 9.3 10.1 8.5 11.0
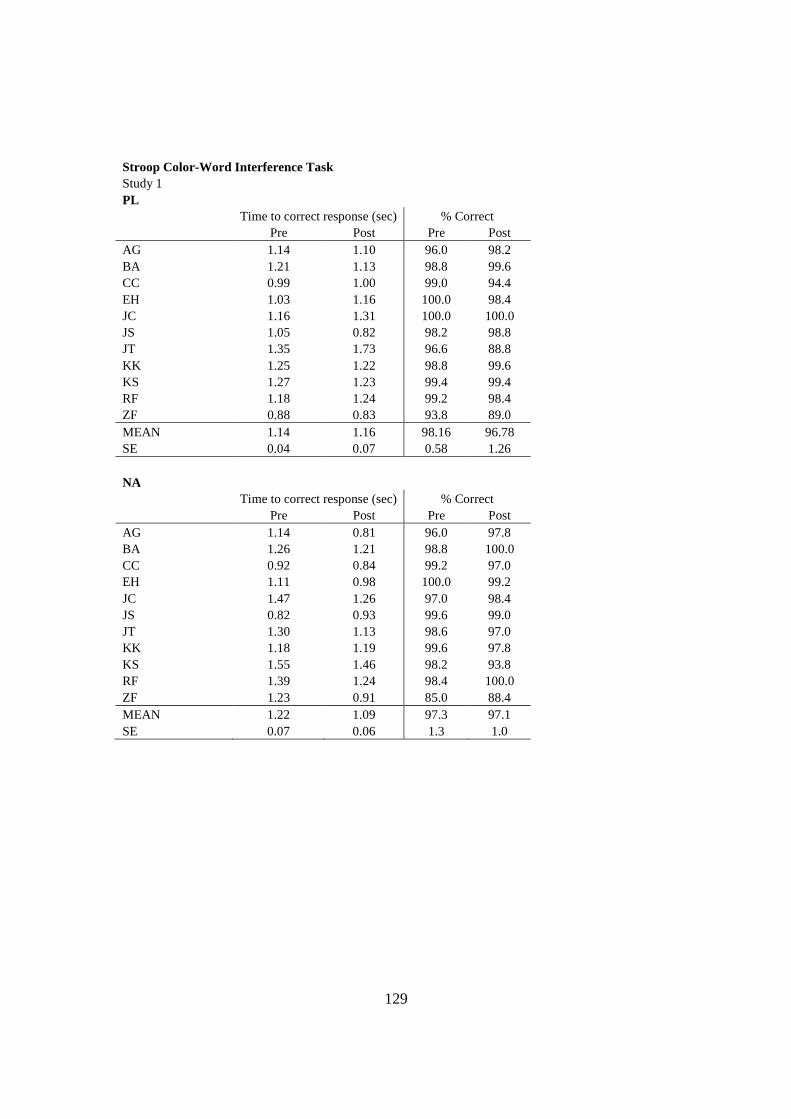
129
Stroop Color-Word Interference Task Study 1 PL
Time to correct response (sec) % Correct Pre Post Pre Post AG 1.14 1.10 96.0 98.2 BA 1.21 1.13 98.8 99.6 CC 0.99 1.00 99.0 94.4 EH 1.03 1.16 100.0 98.4 JC 1.16 1.31 100.0 100.0 JS 1.05 0.82 98.2 98.8 JT 1.35 1.73 96.6 88.8 KK 1.25 1.22 98.8 99.6 KS 1.27 1.23 99.4 99.4 RF 1.18 1.24 99.2 98.4 ZF 0.88 0.83 93.8 89.0 MEAN 1.14 1.16 98.16 96.78 SE 0.04 0.07 0.58 1.26
NA Time to correct response (sec) % Correct
Pre Post Pre Post AG 1.14 0.81 96.0 97.8 BA 1.26 1.21 98.8 100.0 CC 0.92 0.84 99.2 97.0 EH 1.11 0.98 100.0 99.2 JC 1.47 1.26 97.0 98.4 JS 0.82 0.93 99.6 99.0 JT 1.30 1.13 98.6 97.0 KK 1.18 1.19 99.6 97.8 KS 1.55 1.46 98.2 93.8 RF 1.39 1.24 98.4 100.0 ZF 1.23 0.91 85.0 88.4 MEAN 1.22 1.09 97.3 97.1 SE 0.07 0.06 1.3 1.0

130
Center of Pressure Amplitude in the Anteroposterior (ap) Direction (m) Study 1 PL
Stance 1 Stance 1 Stance 2 Stance 2 Stance 3 Stance 3 Pre Post Pre Post Pre Post BA 0.030 0.028 0.086 0.083 0.111 0.077 EH 0.034 0.029 0.063 0.043 0.112 0.087 JC 0.029 0.027 0.043 0.040 0.123 0.088 JS 0.034 0.031 0.042 0.033 0.056 0.059 RF 0.021 0.017 0.040 0.036 0.124 0.097 ZF 0.020 0.025 0.048 0.039 0.109 0.088 MEAN 0.028 0.026 0.054 0.046 0.106 0.082 SE 0.002 0.002 0.007 0.008 0.010 0.005
NA Stance 1 Stance 1 Stance 2 Stance 2 Stance 3 Stance 3
Pre Post Pre Post Pre Post BA 0.035 0.029 0.149 0.074 0.127 0.060 EH 0.024 0.024 0.040 0.036 0.060 0.100 JC 0.024 0.022 0.044 0.032 0.134 JS 0.026 0.032 0.044 0.039 0.068 0.084 RF 0.016 0.016 0.033 0.031 0.085 0.062 ZF 0.016 0.031 0.039 0.037 0.115 0.094 MEAN 0.023 0.026 0.058 0.041 0.091 0.089 SE 0.003 0.002 0.018 0.007 0.013 0.011

131
Center of Pressure Amplitude in the Mediolateral (ml) Direction (m) Study 1 PL
Stance 1 Stance 1 Stance 2 Stance 2 Stance 3 Stance 3 Pre Post Pre Post Pre Post BA 0.020 0.023 0.064 0.065 0.076 0.075 EH 0.024 0.025 0.028 0.038 0.057 0.056 JC 0.019 0.021 0.028 0.032 0.043 0.046 JS 0.023 0.027 0.033 0.027 0.046 0.048 RF 0.014 0.014 0.028 0.026 0.202 0.112 ZF 0.015 0.018 0.024 0.028 0.056 0.067 MEAN 0.019 0.021 0.034 0.036 0.080 0.067 SE 0.002 0.002 0.006 0.006 0.025 0.010
NA Stance 1 Stance 1 Stance 2 Stance 2 Stance 3 Stance 3
Pre Post Pre Post Pre Post BA 0.020 0.026 0.088 0.058 0.088 0.065 EH 0.022 0.022 0.028 0.028 0.053 0.057 JC 0.022 0.017 0.026 0.023 6.387 0.049 JS 0.024 0.023 0.026 0.031 0.053 0.051 RF 0.015 0.018 0.024 0.023 0.073 0.051 ZF 0.017 0.020 0.027 0.022 0.089 0.087 MEAN 0.020 0.021 0.037 0.031 1.124 0.060 SE 0.002 0.001 0.010 0.006 1.053 0.006

132
Work completed during final 15 min of Time Trial (J) Study 1 PL Time (min) 5-10 10-15 15-20 Total Mean Watts AG 102900 91500 107850 292200 325 BA 66000 73200 77100 212200 236 CC 78000 78000 85800 234000 260 EH 79200 74400 84240 229200 255 JC 93450 91500 93600 285300 317 JS 88800 84000 84000 256800 285 KK 85800 85800 106680 267600 297 RF 108000 108000 118800 324000 360 ZF 89100 84000 94200 257700 286 MEAN 87917 85600 94697 262111 291 SE 4281 3562 4582 11616 13
NA Time (min) 5-10 10-15 15-20 Total Mean Watts AG 117300 119400 116850 355050 395 BA 63000 63000 73500 195400 217 CC 81000 81000 93300 238500 265 EH 82800 82200 98940 254400 283 JC 95400 94500 95400 278550 310 JS 83400 79200 75600 238200 265 KK 85800 85800 101580 263100 292 RF 108000 112200 121200 333000 370 ZF 96000 96000 107100 288900 321 MEAN 90300 90367 98163 271678 302 SE 5345 5794 5427 16443 18

133
Maximal Power (watts) Study 1 PL Time (min) 0 60 120 180 AG 1205 1179 1211 1252 BA 1149 1096 CC 1002 1026 1042 964 EH 1205 1148 1060 1047 JC 1285 1313 1228 1169 JS 1312 1337 1357 1247 JT 1163 1157 1132 1094 KK 1255 1219 1152 1231 KS 1235 1256 1231 1153 RF 1486 1463 1477 1487 ZF 1490 1525 1485 1474 MEAN 1253.4 1262.3 1237.5 1201.3 SE 42.8 47.9 49.7 49.3
NA Time (min) 0 60 120 180 AG 1263 1228 1225 1252 BA 1119 1080 1069 1054 CC 1002 997 1029 956 EH 1113 1139 1118 1055 JC 1282 1289 1303 1294 JS 1335 1258 1301 1247 JT 1203 1094 1054 1097 KK 1220 1295 1232 1295 KS 1194 1293 1262 1211 RF 1474 1456 1388 1399 ZF 1452 1425 1435 1416 MEAN 1241.5 1232.2 1219.6 1206.9 SE 42.9 43.2 41.2 44.8
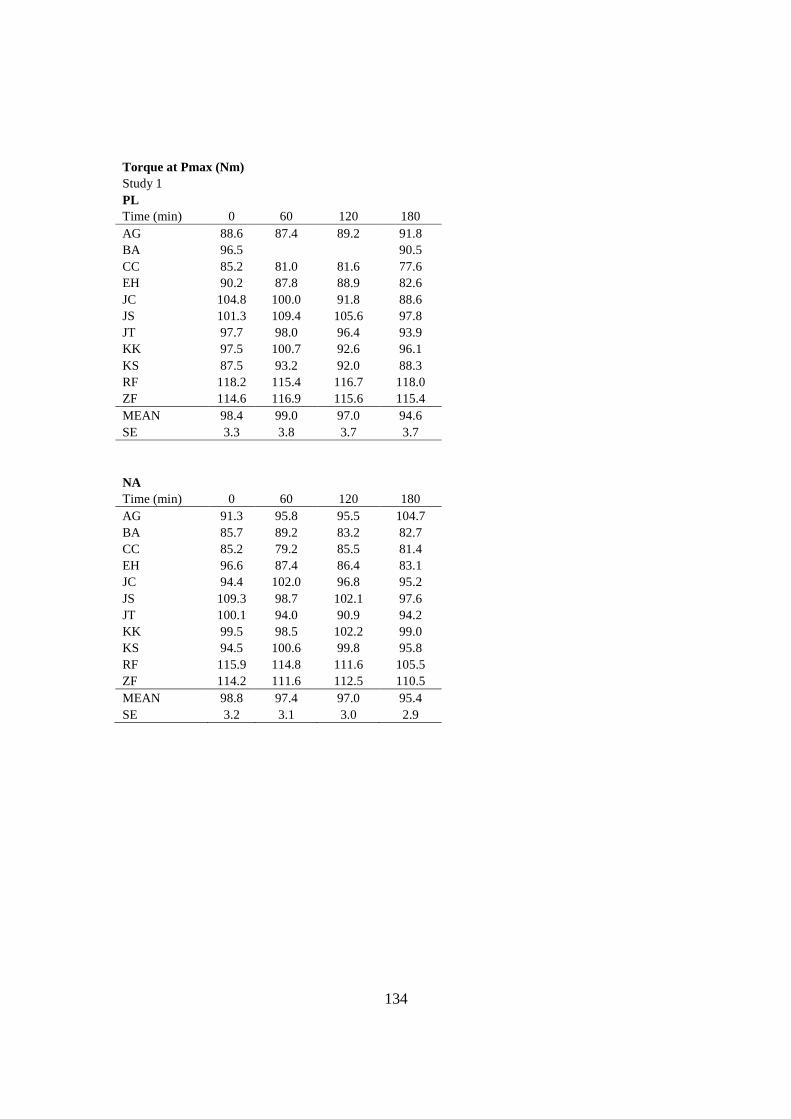
134
Torque at Pmax (Nm) Study 1 PL Time (min) 0 60 120 180 AG 88.6 87.4 89.2 91.8 BA 96.5 90.5 CC 85.2 81.0 81.6 77.6 EH 90.2 87.8 88.9 82.6 JC 104.8 100.0 91.8 88.6 JS 101.3 109.4 105.6 97.8 JT 97.7 98.0 96.4 93.9 KK 97.5 100.7 92.6 96.1 KS 87.5 93.2 92.0 88.3 RF 118.2 115.4 116.7 118.0 ZF 114.6 116.9 115.6 115.4 MEAN 98.4 99.0 97.0 94.6 SE 3.3 3.8 3.7 3.7
NA Time (min) 0 60 120 180 AG 91.3 95.8 95.5 104.7 BA 85.7 89.2 83.2 82.7 CC 85.2 79.2 85.5 81.4 EH 96.6 87.4 86.4 83.1 JC 94.4 102.0 96.8 95.2 JS 109.3 98.7 102.1 97.6 JT 100.1 94.0 90.9 94.2 KK 99.5 98.5 102.2 99.0 KS 94.5 100.6 99.8 95.8 RF 115.9 114.8 111.6 105.5 ZF 114.2 111.6 112.5 110.5 MEAN 98.8 97.4 97.0 95.4 SE 3.2 3.1 3.0 2.9

135
Velocity at Pmax (revolutions/minute) Study 1 PL Time (min) 0 60 120 180 AG 129 128 129 130 BA 113 115 CC 112 120 121 118 EH 127 124 113 120 JC 116 125 127 125 JS 123 116 122 121 JT 113 112 112 111 KK 122 115 118 122 KS 134 128 127 124 RF 119 120 120 120 ZF 123 124 122 121 MEAN 121.0 121.2 121.1 120.6 SE 2.2 1.7 1.8 1.5
NA Time (min) 0 60 120 180 AG 131 122 122 116 BA 124 115 122 121 CC 112 119 114 112 EH 127 124 123 121 JC 129 120 128 129 JS 116 121 121 123 JT 114 111 110 111 KK 116 125 114 124 KS 120 122 102 120 RF 121 120 118 126 ZF 121 121 121 122 MEAN 121.0 120.0 117.7 120.5 SE 1.9 1.2 2.2 1.7

136
Study 2: Raw Data Body Mass (kg) Study 2 PL CV - Pre Sweat - Pre Sweat - Post CL 61.05 60.55 60.40 JM 86.55 85.70 85.35 JW 83.50 82.50 82.50 LH 76.45 74.15 73.90 MD 71.15 70.60 70.60 NY 79.85 79.45 79.30 PT 80.35 79.55 79.20 SP 72.20 70.40 70.25 TS 77.75 77.20 77.05 MEAN 76.54 75.57 75.39 SE 2.5 2.5 2.5
NA CV - Pre Sweat - Pre Sweat - Post CL 61.95 61.25 61.10 JM 86.75 86.15 85.80 JW 86.60 85.90 85.60 LH 75.70 74.05 73.70 MD 70.95 70.35 70.15 NY 80.30 79.90 79.80 PT 81.00 80.05 79.65 SP 70.76 71.75 71.55 TS 77.50 76.95 76.75 MEAN 76.83 76.26 76.01 SE 2.7 2.6 2.6

137
Serum Sodium Concentration (mEq/L) Study 2 PL Time (min) 0 5 10 15 20 CL 144.0 146.5 149.0 149.0 145.0 JM 144.5 145.0 148.0 148.0 145.0 JW 147.0 148.5 148.0 148.0 146.0 LH 146.0 148.0 148.0 149.0 145.0 MD 143.0 144.0 146.0 146.0 144.0 NY 143.0 146.0 146.0 146.5 144.0 PT 144.5 146.0 147.0 148.0 145.0 SP 143.0 145.5 147.0 147.0 144.0 TS 145.0 146.0 149.0 148.5 145.0 MEAN 144.4 146.2 147.6 147.8 144.8 SE 0.5 0.5 0.4 0.4 0.2
NA Time (min) 0 5 10 15 20 CL 144.0 147.0 149.0 149.0 146.0 JM 144.5 146.0 149.0 149.0 146.0 JW 148.0 148.0 149.0 149.0 146.0 LH 147.0 149.0 150.0 150.0 146.0 MD 144.0 145.0 146.5 147.0 145.0 NY 144.5 148.0 148.0 148.0 145.0 PT 145.0 146.5 147.5 148.0 146.0 SP 144.0 146.5 148.0 146.5 145.0 TS 144.0 147.0 149.0 149.0 144.5 MEAN 145.0 147.0 148.4 148.4 145.5 SE 0.5 0.4 0.3 0.4 0.2

138
Serum Potassium (mEq/L) Study 2 PL Time (min) 0 5 10 15 20 CL 4.2 4.3 4.5 5.0 3.9 JM 3.9 4.4 4.7 5.0 4.2 JW 3.8 4.5 4.6 4.7 4.3 LH 4.0 4.5 4.6 4.6 4.2 MD 4.1 4.6 4.9 5.0 4.5 NY 4.2 4.8 4.8 4.9 4.4 PT 4.2 4.6 5.0 5.1 4.3 SP 4.0 4.9 5.1 5.3 4.3 TS 3.6 4.2 4.5 4.6 4.0 MEAN 4.0 4.5 4.7 4.9 4.2 SE 0.1 0.1 0.1 0.1 0.1
NA Time (min) 0 5 10 15 20 CL 3.8 5.0 5.0 5.2 3.9 JM 3.7 4.0 4.3 4.8 4.1 JW 4.1 4.5 4.7 4.8 4.2 LH 3.8 4.0 4.3 4.3 3.8 MD 4.3 4.7 5.1 5.2 4.8 NY 4.4 4.6 4.6 4.6 4.2 PT 4.0 4.3 4.6 4.7 4.2 SP 4.2 5.0 5.2 5.3 4.3 TS 3.9 4.3 4.9 4.9 4.1 MEAN 4.0 4.5 4.7 4.8 4.2 SE 0.1 0.1 0.1 0.1 0.1

139
Serum Chloride (mEq/L) Study 2 PL Time (min) 0 5 10 15 20 CL 105.5 108.0 106.0 108.0 105.0 JM 106.0 104.0 107.0 108.0 105.0 JW 109.5 111.0 111.0 112.0 111.0 LH 108.0 108.0 109.0 110.0 108.5 MD 106.0 104.0 106.0 106.5 104.5 NY 106.0 107.0 107.5 108.0 108.0 PT 107.0 108.0 110.0 110.0 108.0 SP 106.0 105.0 108.0 108.0 106.0 TS 109.5 106.5 109.5 108.5 107.0 MEAN 107.1 106.8 108.2 108.8 107.0 SE 0.5 0.8 0.6 0.5 0.7
NA Time (min) 0 5 10 15 20 CL 107.0 108.0 110.0 109.5 107.0 JM 105.5 105.5 108.0 108.5 107.0 JW 112.0 112.0 113.0 114.0 112.0 LH 110.0 111.0 111.0 111.0 110.0 MD 105.0 105.0 107.0 107.0 105.0 NY 109.5 110.0 111.0 110.0 109.0 PT 108.5 109.0 110.0 111.0 109.0 SP 108.0 108.0 111.0 110.0 108.0 TS 105.5 106.0 108.0 107.5 105.5 MEAN 107.9 108.3 109.9 109.8 108.1 SE 0.8 0.8 0.6 0.7 0.7

140
Hematocrit (%) Study 2 PL Time (min) 0 5 10 15 20 CL 48.0 51.0 52.1 52.7 51.1 JM 50.3 53.0 53.1 53.6 52.0 JW 42.2 44.6 44.3 44.1 42.3 LH 45.7 46.7 47.8 48.2 46.6 MD 49.4 53.2 52.8 53.2 51.4 NY 47.0 48.4 47.5 48.5 48.3 PT 45.2 46.6 46.6 46.2 44.8 SP 48.3 50.8 51.1 51.6 49.3 TS 44.6 45.1 48.7 49.8 48.8 MEAN 46.7 48.8 49.3 49.8 48.3 SE 0.9 1.1 1.0 1.1 1.1
NA Time (min) 0 5 10 15 20 CL 45.5 49.6 50.5 49.7 49.8 JM 48.9 50.7 52.3 51.6 51.2 JW 41.3 42.3 43.0 42.4 41.2 LH 42.1 44.2 43.1 45.3 44.2 MD 49.5 49.6 51.0 50.6 50.5 NY 46.0 46.7 47.3 46.9 46.2 PT 42.7 44.0 43.5 43.9 44.4 SP 45.7 46.3 48.1 48.4 47.1 TS 47.8 49.0 50.0 49.7 49.3 MEAN 45.5 46.9 47.6 47.6 47.1 SE 1.0 1.0 1.2 1.1 1.1

141
Hemoglobin (g/dL) Study 2 PL Time (min) 0 5 10 15 20 CL 16.1 17.3 17.7 18.3 17.3 JM 16.5 17.5 18.1 18.2 17.5 JW 14.0 14.9 15.1 15.2 14.2 LH 14.8 14.8 15.7 16.0 15.1 MD 15.9 16.8 17.3 17.2 16.7 NY 14.3 15.5 15.5 15.3 15.1 PT 14.1 14.7 14.9 14.9 14.3 SP 15.6 16.4 16.8 16.9 16.0 TS 14.5 16.0 16.4 16.9 16.1 MEAN 15.1 16.0 16.4 16.5 15.8 SE 0.3 0.4 0.4 0.4 0.4
NA Time (min) 0 5 10 15 20 CL 15.0 16.8 17.1 17.1 16.5 JM 16.0 16.6 17.2 17.1 16.7 JW 13.2 14.1 14.3 14.2 13.8 LH 14.0 14.5 14.7 15.2 14.6 MD 15.4 16.1 16.4 16.5 15.9 NY 14.7 15.0 15.3 15.2 14.9 PT 13.5 14.2 14.3 14.4 14.1 SP 14.5 14.7 15.8 15.5 15.2 TS 15.3 16.3 17.0 17.0 16.7 MEAN 14.6 15.4 15.8 15.8 15.4 SE 0.3 0.4 0.4 0.4 0.4
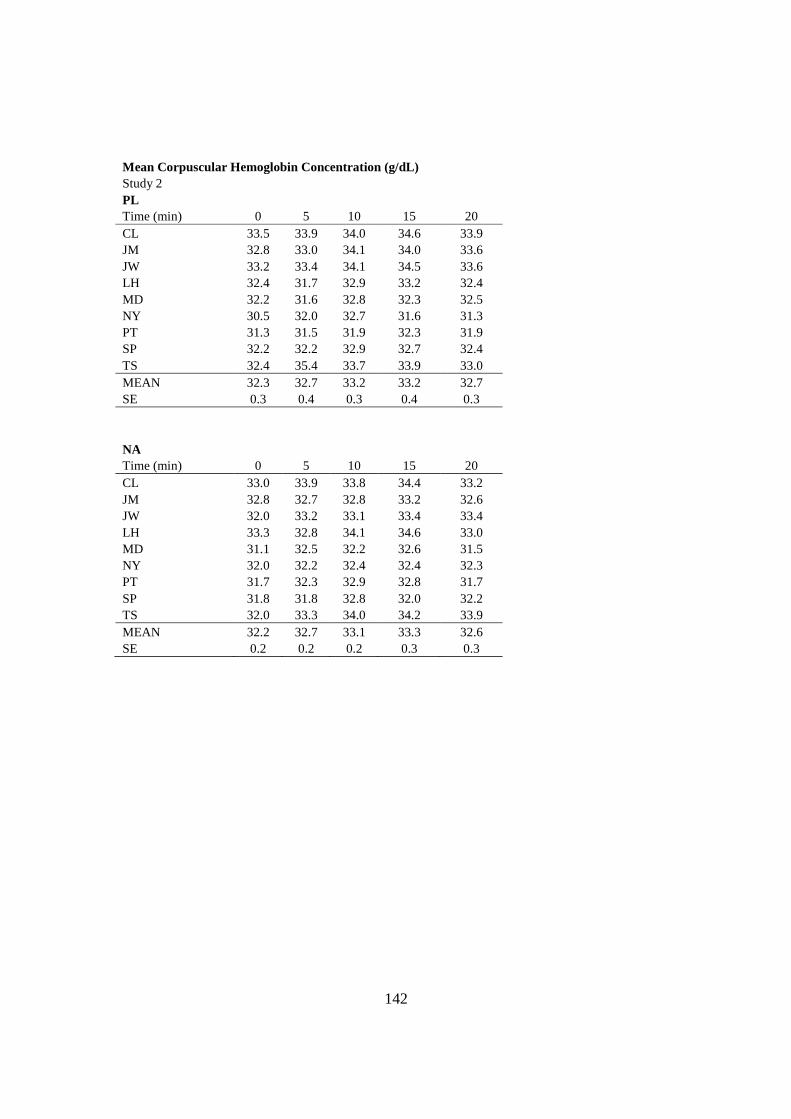
142
Mean Corpuscular Hemoglobin Concentration (g/dL) Study 2 PL Time (min) 0 5 10 15 20 CL 33.5 33.9 34.0 34.6 33.9 JM 32.8 33.0 34.1 34.0 33.6 JW 33.2 33.4 34.1 34.5 33.6 LH 32.4 31.7 32.9 33.2 32.4 MD 32.2 31.6 32.8 32.3 32.5 NY 30.5 32.0 32.7 31.6 31.3 PT 31.3 31.5 31.9 32.3 31.9 SP 32.2 32.2 32.9 32.7 32.4 TS 32.4 35.4 33.7 33.9 33.0 MEAN 32.3 32.7 33.2 33.2 32.7 SE 0.3 0.4 0.3 0.4 0.3
NA Time (min) 0 5 10 15 20 CL 33.0 33.9 33.8 34.4 33.2 JM 32.8 32.7 32.8 33.2 32.6 JW 32.0 33.2 33.1 33.4 33.4 LH 33.3 32.8 34.1 34.6 33.0 MD 31.1 32.5 32.2 32.6 31.5 NY 32.0 32.2 32.4 32.4 32.3 PT 31.7 32.3 32.9 32.8 31.7 SP 31.8 31.8 32.8 32.0 32.2 TS 32.0 33.3 34.0 34.2 33.9 MEAN 32.2 32.7 33.1 33.3 32.6 SE 0.2 0.2 0.2 0.3 0.3

143
Plasma Volume Change (%) Study 2
Time (min) 0 5 10 15 20 CL 12.5 5.9 7.0 13.8 7.6 JM 6.2 10.7 7.6 10.9 6.7 JW 7.4 10.6 7.9 10.1 4.6 LH 12.7 7.5 16.1 10.7 6.1 MD 3.1 12.8 9.8 10.2 6.8 NY 0.0 6.4 1.6 4.0 5.5 PT 9.5 8.7 9.9 8.3 2.3 SP 12.3 21.8 10.2 15.9 9.9 TS -10.8 -0.9 -5.9 -0.4 -4.3 MEAN 5.9 9.3 7.1 9.3 5.0 SE 2.5 2.0 2.1 1.6 1.4
Blood Volume Change (%) Study 2
Time (min) 0 5 10 15 20 CL 7.3 3.0 3.5 7.0 4.9 JM 3.2 5.5 5.6 6.4 4.8 JW 5.7 6.1 5.5 6.9 2.7 LH 5.7 2.6 6.5 4.9 3.5 MD 3.2 4.7 5.6 4.6 4.9 NY -2.6 3.0 1.2 0.9 1.4 PT 4.7 3.5 3.9 3.8 1.6 SP 7.0 11.4 3.9 8.8 5.3 TS -5.4 -2.1 -3.5 -0.6 -3.4 MEAN 3.2 4.2 3.6 4.8 2.8 SE 1.5 1.2 1.0 1.0 0.9

144
Urine Electrolyte Concentration (mEq/L) Study 2 PL Na K Cl CL 73.0 38.4 69.5 JM 111.0 47.9 130.5 JW 100.5 34.7 107.0 LH 89.0 16.1 93.0 MD 67.0 52.5 110.5 NY 44.5 36.3 81.0 PT 68.5 23.1 81.5 SP 0.0 32.5 23.0 TS 69.5 37.3 97.0 MEAN 69.2 35.4 88.1 SE 10.9 3.7 10.2
NA Na K Cl CL 52.0 46.0 JM 39.0 32.0 JW 112.0 126.5 LH 107.5 28.3 155.0 MD 76.5 25.0 87.0 NY 44.0 18.5 58.0 PT 82.5 24.0 103.0 SP 31.5 12.6 35.0 TS 109.0 27.0 114.5 MEAN 72.7 22.6 84.1 SE 10.7 2.4 14.6

145
Heart Rate (beats/min) Study 2 PL Time (min) -5 5 8 11 14 20 23 CL 62 160 166 173 178 106 104 JM 70 169 175 178 183 118 117 JW 76 138 145 145 148 92 87 LH 74 129 137 137 145 98 95 MD 69 147 160 167 170 103 102 NY 78 131 137 140 145 95 97 PT 75 143 148 155 156 94 103 SP 69 149 155 160 164 88 87 TS 76 156 170 176 179 126 127 MEAN 72.1 146.9 154.8 158.9 163.1 102.2 102.1 SE 1.7 4.4 4.7 5.3 5.1 4.2 4.4
NA Time (min) -5 5 8 11 14 20 23 CL 64 147 154 162 168 96 100 JM 71 166 174 176 180 109 113 JW 76 138 141 143 146 91 92 LH 67 132 135 138 143 95 89 MD 69 142 156 165 165 96 99 NY 75 133 143 147 150 95 95 PT 68 138 145 152 155 98 97 SP 54 143 147 150 153 82 82 TS 73 158 167 176 183 131 129 MEAN 68.6 144.1 151.3 156.6 160.3 99.2 99.6 SE 2.2 3.8 4.2 4.6 4.8 4.6 4.6

146
Cardiac Output (L/min) Study 2 PL Time (min) -5 5 8 11 14 20 23 CL 7.1 14.8 13.2 12.9 13.3 7.3 7.8 JM 13.0 19.4 18.2 18.2 18.5 10.7 10.9 JW 8.5 21.7 20.0 20.0 21.6 10.2 9.3 LH 6.4 20.6 21.1 21.1 24.5 10.0 11.2 MD 7.8 17.8 19.0 18.1 17.8 7.8 7.3 NY 6.2 19.7 19.4 18.7 19.7 9.8 9.2 PT 11.1 20.3 19.3 21.5 21.6 11.0 11.6 SP 13.4 19.7 20.6 20.5 15.8 14.0 12.5 TS 9.6 23.0 21.9 22.7 22.7 15.1 11.3 MEAN 9.2 19.7 19.2 19.3 19.5 10.7 10.1 SE 0.9 0.8 0.8 1.0 1.2 0.8 0.6
NA Time (min) -5 5 8 11 14 20 23 CL 7.1 15.0 14.1 14.7 15.0 10.2 7.8 JM 9.2 20.9 20.5 20.4 22.1 12.7 11.8 JW 10.9 23.6 24.2 22.7 23.2 12.6 10.9 LH 7.4 25.1 22.4 23.2 28.7 14.7 14.9 MD 8.9 17.5 19.3 21.9 19.2 11.2 7.8 NY 8.2 19.8 19.4 19.8 18.3 10.9 7.8 PT 10.6 22.2 23.1 24.8 26.2 14.7 14.2 SP 11.7 21.3 20.5 21.8 21.7 12.4 14.5 TS 9.9 22.3 20.3 21.1 21.2 15.8 14.1 MEAN 9.3 20.8 20.4 21.1 21.7 12.8 11.5 SE 0.5 1.0 1.0 1.0 1.4 0.6 1.0

147
Stroke Volume (ml/beat) Study 2 PL Time (min) -5 5 8 11 14 20 23 CL 114.4 92.8 79.7 74.6 74.9 69.3 75.3 JM 185.9 115.0 104.1 102.1 101.1 90.8 92.8 JW 111.6 157.0 137.9 138.0 145.9 110.5 106.4 LH 87.1 159.8 153.7 153.9 168.8 102.0 117.6 MD 113.4 121.4 118.6 108.6 104.6 75.6 71.7 NY 79.8 150.0 141.8 133.8 135.7 103.2 94.6 PT 147.3 142.0 130.7 138.9 138.1 117.4 112.6 SP 194.2 132.5 132.8 128.1 96.3 159.0 143.6 TS 126.5 147.2 129.0 129.1 126.9 119.7 89.0 MEAN 128.9 135.3 125.4 123.0 121.4 105.3 100.4 SE 13.3 7.4 7.4 8.0 9.8 8.9 7.5
NA Time (min) -5 5 8 11 14 20 23 CL 110.8 101.8 91.5 90.4 89.4 106.7 77.7 JM 129.3 126.1 117.6 116.0 122.9 116.2 104.8 JW 143.0 170.9 171.7 158.7 159.0 138.5 118.0 LH 111.1 190.0 165.6 167.9 200.3 154.6 167.8 MD 129.1 123.5 123.8 132.5 116.6 116.8 79.0 NY 109.1 148.5 135.5 134.6 121.7 114.2 82.0 PT 155.3 160.5 159.5 163.2 169.3 150.0 146.3 SP 216.9 148.7 139.5 145.2 141.5 151.5 177.1 TS 135.8 141.3 121.7 120.1 115.8 120.8 109.3 MEAN 137.8 145.7 136.3 136.5 137.4 129.9 118.0 SE 11.2 8.9 8.7 8.4 11.3 6.2 12.6

148
Oxygen Consumption (L/min) Study 2 PL Time (min) -5 5 8 11 14 20 23 CL 0.25 1.75 1.86 1.89 1.99 0.37 0.24 JM 0.35 2.31 2.50 2.49 2.58 0.43 0.39 JW 0.36 2.49 2.61 2.63 2.72 0.53 0.45 LH 0.31 2.07 2.19 2.29 2.46 0.52 0.40 MD 0.29 2.01 2.20 2.35 2.37 0.46 0.44 NY 0.26 1.99 2.08 2.11 2.27 0.45 0.38 PT 0.41 2.24 2.28 2.38 2.44 0.38 0.39 SP 0.28 2.46 2.58 2.61 2.66 0.31 0.26 TS 0.26 2.16 2.33 2.45 2.45 0.49 0.40 MEAN 0.31 2.16 2.29 2.36 2.44 0.44 0.37 SE 0.02 0.08 0.08 0.08 0.07 0.02 0.02
NA Time (min) -5 5 8 11 14 20 23 CL 0.23 1.69 1.85 1.90 1.92 0.41 0.35 JM 0.37 2.63 2.86 2.87 2.88 0.56 0.51 JW 0.41 2.49 2.60 2.63 2.65 0.46 0.43 LH 0.33 2.00 2.18 2.31 2.31 0.56 0.32 MD 0.24 1.70 1.90 2.08 2.22 0.49 0.29 NY 0.35 2.04 2.23 2.28 2.33 0.52 0.41 PT 0.32 2.29 2.50 2.59 2.71 0.39 0.41 SP 0.24 2.28 2.39 2.46 2.48 0.30 0.28 TS 0.33 2.34 2.51 2.56 2.76 0.60 0.55 MEAN 0.31 2.16 2.34 2.41 2.47 0.47 0.39 SE 0.02 0.11 0.11 0.10 0.10 0.03 0.03

149
Arterial Venous Oxygen Difference (ml O2/L) Study 2 PL Time (min) -5 5 8 11 14 20 23 CL 3.5 11.8 14.0 14.7 14.9 5.1 3.1 JM 2.7 11.9 13.7 13.7 13.9 4.0 3.6 JW 4.3 11.5 13.0 13.1 12.6 5.2 4.9 LH 2.7 9.4 10.6 10.8 10.8 3.2 3.5 MD 4.2 10.1 10.7 11.3 11.6 4.6 4.1 NY 4.8 10.0 10.4 10.8 10.1 5.2 3.6 PT 3.7 11.0 11.8 11.0 11.3 3.5 3.3 SP 2.1 12.5 12.5 12.8 16.8 2.2 2.1 TS 3.7 11.2 11.6 12.9 13.3 5.9 6.0 MEAN 3.51 11.06 12.05 12.36 12.81 4.33 3.80 SE 0.29 0.33 0.46 0.47 0.72 0.39 0.37
NA Time (min) -5 5 8 11 14 20 23 CL 3.2 11.3 13.1 13.0 12.8 4.0 4.5 JM 4.0 12.5 14.0 14.1 13.0 4.4 4.3 JW 3.7 10.6 10.7 11.6 11.4 3.6 4.0 LH 3.3 10.5 12.3 12.1 13.0 3.8 3.9 MD 4.2 10.3 11.5 11.5 12.8 4.7 5.3 NY 4.4 8.0 9.8 9.9 8.1 3.8 2.1 PT 3.0 10.3 10.8 10.4 10.3 2.7 2.9 SP 2.0 10.7 11.7 11.3 11.5 2.4 1.9 TS 2.7 9.7 9.8 9.5 11.5 4.3 3.7 MEAN 3.40 10.43 11.53 11.49 11.60 3.75 3.62 SE 0.26 0.41 0.48 0.48 0.54 0.26 0.37

150
Mean Arterial Pressure (mmHg) Study 2 PL Time (min) -8 8 14 20 CL 97.3 130.7 120.7 96.3 JM 94.3 117.3 114.0 98.7 JW 85.3 103.0 102.3 101.3 LH 78.7 103.3 100.0 81.3 MD 92.7 119.0 114.7 100.0 NY 90.7 110.3 111.0 95.7 PT 95.7 108.7 107.3 93.7 SP 89.7 108.7 107.3 90.7 TS 93.7 103.7 91.3 97.3 MEAN 90.9 111.6 107.6 95.0 SE 1.9 3.1 2.9 2.0
NA Time (min) -8 8 14 20 CL 91.0 114.7 118.7 94.3 JM 95.3 117.0 113.0 105.7 JW 86.0 98.0 99.0 86.3 LH 91.7 104.7 112.0 97.0 MD 101.3 103.7 108.3 98.3 NY 92.7 111.3 118.7 97.3 PT 98.0 108.3 112.3 96.7 SP 88.3 108.7 107.7 92.7 TS 94.0 97.0 98.3 92.7 MEAN 93.1 107.0 109.8 95.7 SE 1.6 2.3 2.5 1.7

151
Systolic Blood Pressure (mmHg) Study 2 PL Time (min) -8 8 14 20 CL 116 208 186 131 JM 115 184 168 120 JW 122 175 173 144 LH 126 204 180 122 MD 124 205 194 134 NY 112 167 177 115 PT 119 162 158 119 SP 111 176 176 120 TS 121 165 160 126 MEAN 118.4 182.9 174.7 125.7 SE 1.8 6.1 3.9 3.1
NA Time (min) -8 8 14 20 CL 113 180 178 115 JM 116 179 173 129 JW 124 164 173 121 LH 129 176 166 141 MD 140 189 211 139 NY 112 168 172 122 PT 124 155 163 118 SP 111 172 177 116 TS 124 165 161 132 MEAN 121.4 172.0 174.9 125.9 SE 3.2 3.4 4.9 3.3
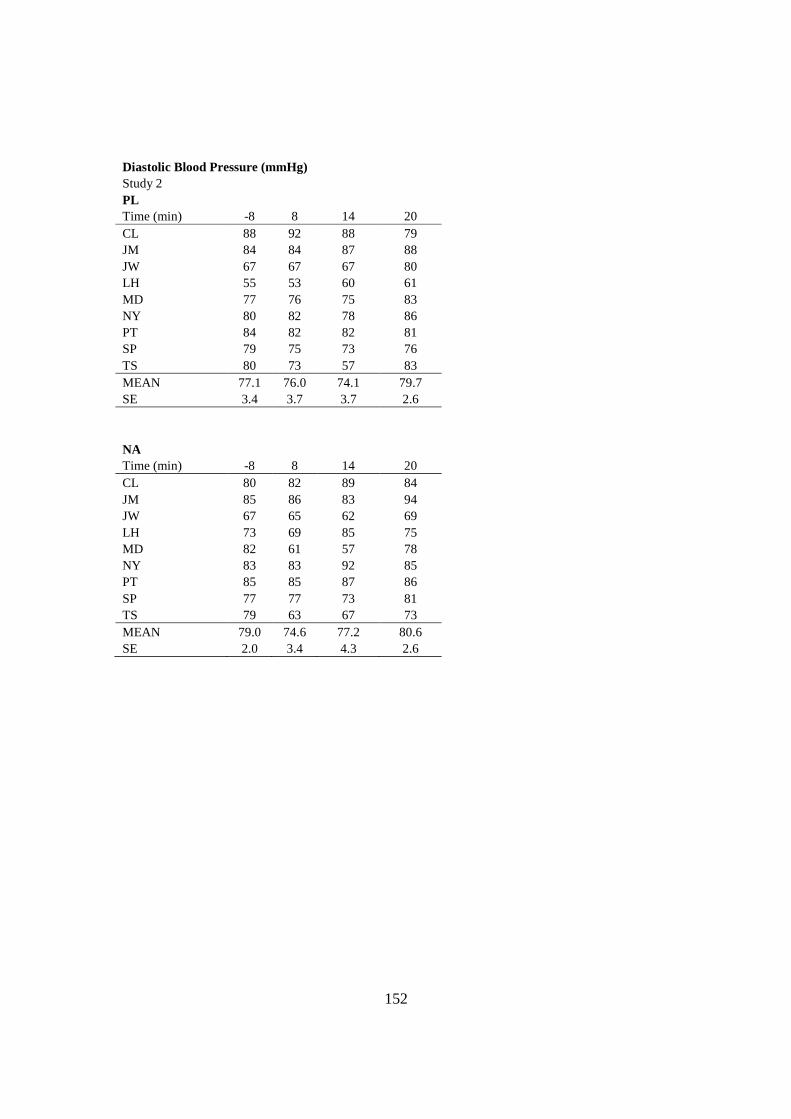
152
Diastolic Blood Pressure (mmHg) Study 2 PL Time (min) -8 8 14 20 CL 88 92 88 79 JM 84 84 87 88 JW 67 67 67 80 LH 55 53 60 61 MD 77 76 75 83 NY 80 82 78 86 PT 84 82 82 81 SP 79 75 73 76 TS 80 73 57 83 MEAN 77.1 76.0 74.1 79.7 SE 3.4 3.7 3.7 2.6
NA Time (min) -8 8 14 20 CL 80 82 89 84 JM 85 86 83 94 JW 67 65 62 69 LH 73 69 85 75 MD 82 61 57 78 NY 83 83 92 85 PT 85 85 87 86 SP 77 77 73 81 TS 79 63 67 73 MEAN 79.0 74.6 77.2 80.6 SE 2.0 3.4 4.3 2.6

153
Total Peripheral Resistance (dyne/sec/cm5) Study 2 PL Time (min) -8 8 14 20 CL 1098 790 724 1049 JM 580 515 493 737 JW 805 412 379 797 LH 977 393 327 651 MD 948 502 516 1027 NY 1166 455 451 781 PT 693 450 398 679 SP 535 422 543 518 TS 779 378 322 516 MEAN 842.2 479.6 461.5 750.6 SE 73.6 41.7 42.2 63.8
NA Time (min) -8 8 14 20 CL 1200 651 632 737 JM 831 457 408 667 JW 633 324 341 548 LH 985 375 313 528 MD 910 430 451 702 NY 906 460 520 718 PT 742 375 342 526 SP 603 424 398 597 TS 758 382 371 469 MEAN 840.9 430.8 419.6 610.2 SE 61.8 31.2 33.9 32.7

154
Core Temperature (°C) Study 2 - Sweat Analysis PL Time (min) 0 15 30 CL 38.1 38.3 38.6 JM 37.5 37.9 38.4 JW 38.0 38.3 38.7 LH 37.9 38.1 38.2 MD 37.7 37.8 38.0 NY 37.8 38.1 38.3 PT 38.0 38.3 38.5 SP 37.8 38.2 38.3 TS 38.0 38.3 38.5 MEAN 37.9 38.1 38.4 SE 0.1 0.1 0.1
NA Time (min) 0 15 30 CL 37.7 38.0 38.2 JM 37.4 37.8 38.1 JW 37.7 37.8 38.1 LH 37.8 38.0 38.3 MD 37.7 37.9 38.0 NY 37.9 38.1 38.3 PT 37.9 38.3 38.5 SP 37.6 37.7 37.8 TS 38.3 38.5 38.8 MEAN 37.8 38.0 38.2 SE 0.1 0.1 0.1

155
Forearm Skin Temperature (°C) Study 2 - Sweat Analysis PL Time (min) 0 15 30 CL 34.7 34.6 34.4 JM 34.7 33.5 34.0 JW 34.4 34.3 33.6 LH 35.5 34.0 33.1 MD 35.0 32.7 32.8 NY 35.0 34.3 33.9 PT 34.8 34.8 34.1 SP 34.9 34.8 34.7 TS 35.4 35.2 34.9 MEAN 34.9 34.2 33.9 SE 0.1 0.3 0.2
NA Time (min) 0 15 30 CL 35.1 34.7 34.2 JM 35.3 34.7 34.6 JW 35.8 34.9 34.1 LH 35.2 33.9 34.7 MD 35.5 33.5 33.6 NY 35.1 34.3 34.8 PT 33.9 33.3 34.4 SP 34.0 34.0 34.5 TS 36.5 35.0 35.8 MEAN 35.2 34.3 34.5 SE 0.3 0.2 0.2

156
Upperarm Skin Temperature (°C) Study 2 - Sweat Analysis PL Time (min) 0 15 30 CL 33.7 34.1 33.5 JM 34.9 32.9 33.4 JW 34.7 34.4 34.9 LH 35.9 33.7 33.3 MD 34.3 34.4 33.9 NY 32.6 34.4 33.3 PT 35.0 34.8 33.6 SP 34.5 34.2 34.0 TS 34.9 35.4 34.9 MEAN 34.5 34.3 33.9 SE 0.3 0.2 0.2
NA Time (min) 0 15 30 CL 34.6 33.5 33.7 JM 34.4 34.1 32.8 JW 37.7 34.4 34.5 LH 35.3 34.1 34.8 MD 35.4 34.3 34.5 NY 33.5 32.9 32.8 PT 35.4 33.7 34.5 SP 34.7 34.4 34.6 TS 35.9 35.4 35.1 MEAN 35.2 34.1 34.1 SE 0.4 0.2 0.3

157
Chest Skin Temperature (°C) Study 2 - Sweat Analysis PL Time (min) 0 15 30 CL 32.0 31.8 32.3 JM 34.4 33.2 33.3 JW 35.7 35.0 35.5 LH 35.1 32.6 33.6 MD 35.1 33.0 33.3 NY 33.3 33.7 31.6 PT 33.7 34.4 32.9 SP 32.2 32.9 32.2 TS 35.7 34.6 34.1 MEAN 34.1 33.5 33.2 SE 0.5 0.3 0.4
NA Time (min) 0 15 30 CL 32.4 29.5 31.2 JM 34.7 34.9 33.8 JW 35.6 35.5 35.3 LH 34.2 32.7 32.8 MD 34.1 33.8 33.8 NY 34.3 33.0 33.5 PT 34.6 32.2 32.2 SP 32.2 33.6 33.6 TS 35.8 34.0 34.3 MEAN 34.2 33.2 33.4 SE 0.4 0.6 0.4

158
Back Skin Temperature (°C) Study 2 - Sweat Analysis PL Time (min) 0 15 30 CL 33.0 31.4 31.6 JM 32.7 30.9 31.3 JW 35.0 35.2 35.4 LH 34.3 31.5 31.6 MD 34.2 33.2 34.0 NY 33.7 34.1 33.6 PT 33.7 33.7 32.1 SP 33.9 33.6 32.8 TS 35.0 34.7 34.3 MEAN 33.9 33.1 33.0 SE 0.3 0.5 0.5
NA Time (min) 0 15 30 CL 33.0 31.3 32.2 JM 33.5 32.2 32.2 JW 35.5 34.7 34.8 LH 35.4 32.6 33.3 MD 35.3 33.4 33.4 NY 35.7 34.4 34.6 PT 34.1 31.6 32.3 SP 33.2 32.5 32.5 TS 35.6 34.7 35.0 MEAN 34.6 33.0 33.4 SE 0.4 0.4 0.4

159
Thigh Skin Temperature (°C) Study 2 - Sweat Analysis PL Time (min) 0 15 30 CL 35.1 34.6 34.8 JM 33.7 34.9 34.9 JW 35.7 35.4 34.1 LH 35.3 35.1 35.4 MD 34.2 32.9 32.8 NY 34.7 35.2 35.5 PT 34.6 34.6 34.3 SP 34.3 35.2 35.0 TS 35.4 36.0 35.7 MEAN 34.8 34.9 34.7 SE 0.2 0.3 0.3
NA Time (min) 0 15 30 CL 35.3 35.3 34.6 JM 35.4 35.2 35.3 JW 35.4 35.2 34.6 LH 35.5 34.7 34.4 MD 35.0 34.5 35.0 NY 35.2 35.5 35.4 PT 34.4 34.6 34.9 SP 33.9 34.3 34.3 TS 36.2 35.4 36.1 MEAN 35.1 35.0 35.0 SE 0.2 0.1 0.2

160
Calf Skin Temperature (°C) Study 2 - Sweat Analysis PL Time (min) 0 15 30 CL 34.0 34.9 35.1 JM 33.7 34.4 34.9 JW 34.5 34.0 33.7 LH 35.2 35.4 35.6 MD 34.3 33.6 33.6 NY 34.7 34.6 34.3 PT 34.0 34.9 33.6 SP 34.8 34.3 34.7 TS 35.6 35.7 35.0 MEAN 34.5 34.6 34.5 SE 0.2 0.2 0.2
NA Time (min) 0 15 30 CL 33.9 34.2 34.6 JM 34.0 34.1 34.2 JW 35.6 35.0 34.7 LH 35.8 35.0 35.3 MD 34.5 34.3 34.8 NY 35.1 34.7 35.1 PT 34.9 33.8 34.6 SP 34.1 34.0 34.6 TS 36.0 36.1 36.4 MEAN 34.9 34.6 34.9 SE 0.3 0.2 0.2

161
Mean Weighted Skin Temperature (°C) Study 2 - Sweat Analysis PL Time (min) 0 15 30 CL 33.6 33.3 33.5 JM 33.8 33.3 33.6 JW 35.2 34.9 34.6 LH 35.1 33.6 33.8 MD 34.5 33.2 33.4 NY 34.0 34.4 33.7 PT 34.2 34.4 33.3 SP 33.9 34.1 33.8 TS 35.4 35.2 34.8 MEAN 34.4 34.1 33.8 SE 0.2 0.2 0.2
NA Time (min) 0 15 30 CL 33.9 32.8 33.2 JM 34.5 34.2 33.9 JW 35.7 35.0 34.8 LH 35.2 33.7 34.0 MD 34.9 34.0 34.2 NY 34.9 34.3 34.5 PT 34.5 33.1 33.6 SP 33.5 33.7 33.9 TS 36.0 35.0 35.4 MEAN 34.8 34.0 34.2 SE 0.3 0.3 0.2

162
Sweating Rate (L/h) Study 2 - Sweat Analysis PL Time (min) 0-30 CL 1.10 JM 1.50 JW 0.85 LH 1.30 MD 0.80 NY 1.10 PT 1.50 SP 1.10 TS 1.10 MEAN 1.15 SE 0.1
NA Time (min) 0-30 CL 1.10 JM 1.50 JW 1.40 LH 1.40 MD 1.20 NY 1.00 PT 1.60 SP 1.20 TS 1.20 MEAN 1.29 SE 0.1

163
Sweat Sodium Concentration (mEq/L) Study 2 - Sweat Analysis PL Arm Back Thigh Calf Weighted Mean CL 44.0 89.0 37.0 35.5 51.6 JM 97.0 100.0 78.0 74.0 84.9 JW 77.5 98.5 68.5 84.5 82.8 LH 63.5 89.0 52.5 46.5 61.9 MD 51.5 69.0 24.0 27.5 40.5 NY 42.5 63.5 28.0 30.0 40.0 PT 77.5 78.5 57.0 62.5 66.9 SP 48.5 88.0 33.5 31.5 49.6 TS 108.5 120.0 93.5 93.5 102.5 MEAN 67.8 88.4 52.4 53.9 64.5 SE 8.0 5.7 8.0 8.5 7.2
NA Arm Back Thigh Calf Weighted Mean CL 46.0 79.5 42.5 39.0 52.0 JM 95.0 108.0 83.0 81.0 90.6 JW 83.0 105.0 75.0 70.0 82.6 LH 69.5 100.5 63.5 57.5 72.5 MD 35.5 82.5 40.0 56.5 56.4 NY 46.5 66.0 35.0 34.5 44.7 PT 76.0 108.0 63.0 85.5 83.9 SP 53.5 82.0 39.0 39.0 52.5 TS 100.5 122.0 82.0 91.5 98.1 MEAN 67.3 94.8 58.1 61.6 70.4 SE 7.7 6.0 6.5 7.2 6.5

164
Sweat Chloride Concentration (mEq/L) Study 2 - Sweat Analysis PL Arm Back Thigh Calf CL 33.0 75.0 27.0 24.5 JM 80.5 85.0 62.5 57.0 JW 62.0 84.5 55.0 69.0 LH 48.0 71.5 37.0 30.0 MD 45.0 62.0 21.5 24.0 NY 36.5 52.5 23.0 25.0 PT 57.0 58.0 40.0 42.0 SP 35.5 71.5 22.0 19.0 TS 98.0 110.0 81.5 81.0 MEAN 55.1 74.4 41.1 41.3 SE 7.4 5.8 7.0 7.5
NA Arm Back Thigh Calf CL 34.0 66.0 31.5 27.0 JM 79.0 93.5 68.0 64.5 JW 78.0 98.0 66.0 60.5 LH 54.0 86.0 49.0 42.0 MD 29.0 71.0 31.5 45.0 NY 39.0 56.5 28.0 27.0 PT 65.0 98.5 55.0 74.5 SP 42.0 68.5 28.5 27.0 TS 90.5 114.0 72.0 79.0 MEAN 56.7 83.6 47.7 49.6 SE 7.4 6.3 6.1 6.9

165
Sweat Sodium Loss (mEq/h) Study 2 - Sweat Analysis PL Time (min) 0-30 CL 57 JM 127 JW 70 LH 80 MD 32 NY 44 PT 100 SP 55 TS 113 MEAN 75.5 SE 10.8
NA Time (min) 0-30 CL 57 JM 136 JW 116 LH 101 MD 68 NY 45 PT 134 SP 63 TS 118 MEAN 93.1 SE 11.7
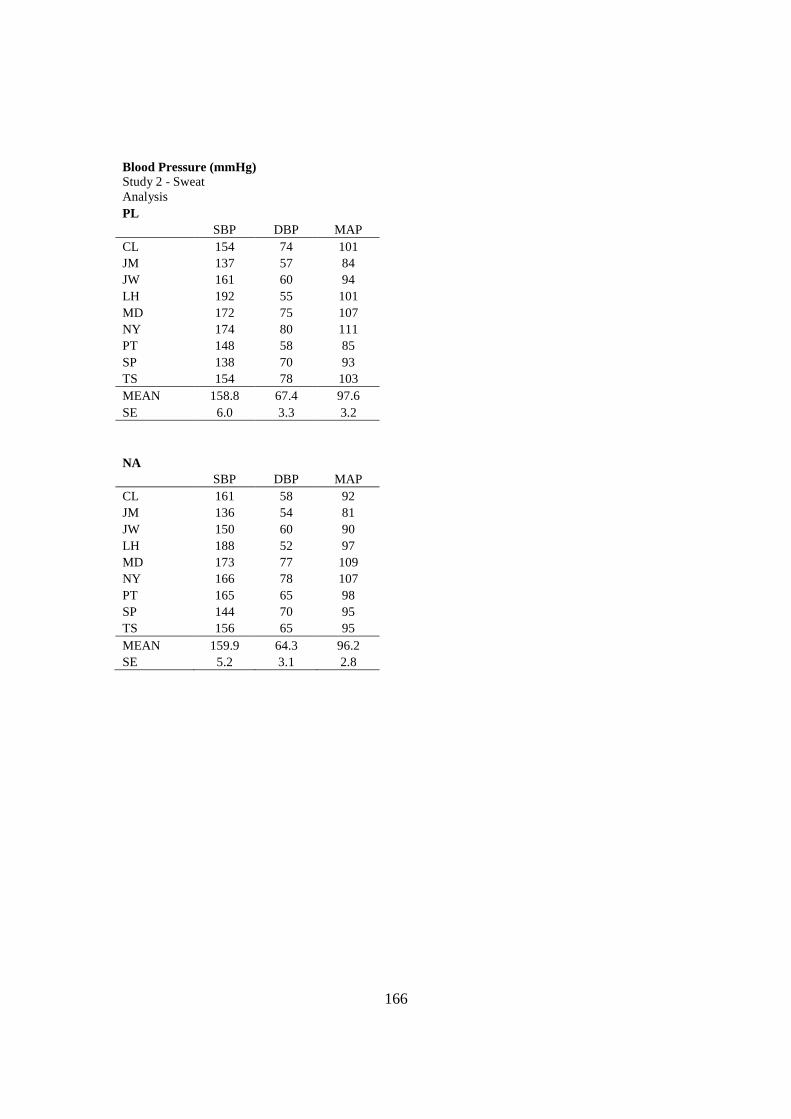
166
Blood Pressure (mmHg) Study 2 - Sweat Analysis PL SBP DBP MAP CL 154 74 101 JM 137 57 84 JW 161 60 94 LH 192 55 101 MD 172 75 107 NY 174 80 111 PT 148 58 85 SP 138 70 93 TS 154 78 103 MEAN 158.8 67.4 97.6 SE 6.0 3.3 3.2
NA SBP DBP MAP CL 161 58 92 JM 136 54 81 JW 150 60 90 LH 188 52 97 MD 173 77 109 NY 166 78 107 PT 165 65 98 SP 144 70 95 TS 156 65 95 MEAN 159.9 64.3 96.2 SE 5.2 3.1 2.8

167
REFERENCES
1. Adams WC. Influence of exercise mode and selected ambient conditions on skin temperature. Ann N Y Acad Sci 301: 110-127, 1977.
2. Adolph EF. Physiology of man in the desert. New York: Interscience Publishers, 1947.
3. Allan JR, and Wilson CG. Influence of acclimatization on sweat sodium concentration. J Appl Physiol 30: 708-712, 1971.
4. Allsopp A, Sutherland R, Wood P, and Wootton S. The effect of sodium balance on sweat sodium secretion and plasma aldosterone concentration. Eur J Appl Physiol Occup Physiol 78: 516-521, 1998.
5. Almond CSD, Shin AY, Fortescue EB, Mannix RC, Wypij D, Binstadt BA, Duncan CN, Olson DP, Salerno AE, Newburger JW, and Greenes DS. Hyponatremia among runners in the Boston Marathon. N Engl J Med 352: 1550-1556, 2005.
6. Aranyi Z, Kovacs T, Szirmai I, and Vastagh I. Reversible nerve conduction slowing in hyponatremia. J Neurol 251: 1532-1533, 2004.
7. Armstrong LE, Costill DL, Fink WJ, Bassett D, Hargreaves M, Nishibata I, and King DS. Effects of dietary sodium on body and muscle potassium content during heat acclimation. Eur J Appl Physiol Occup Physiol 54: 391-397, 1985.
8. Armstrong LE, Curtis WC, Hubbard RW, Francesconi RP, Moore R, and Askew EW. Symptomatic hyponatremia during prolonged exercise in heat. Med Sci Sports Exerc 25: 543-549, 1993.
9. Armstrong LE, Hubbard RW, Askew EW, De Luca JP, O'Brien C, Pasqualicchio A, and Francesconi RP. Responses to moderate and low sodium diets during exercise-heat acclimation. Int J Sport Nutr 3: 207-221, 1993.
10. Armstrong LE, Hubbard RW, Jones BH, and Daniels JT. Preparing Alberto Salazar for the heat of the 1984 Olympic Marathon. Phys Sportsmed 14: 73-81, 1986.
11. Armstrong LE, and Maresh CM. Effects of training, environment, and host factors on the sweating response to exercise. Int J Sports Med 19 Suppl 2: S103-105, 1998.
12. Armstrong LE, and Maresh CM. The induction and decay of heat acclimatisation in trained athletes. Sports Med 12: 302-312, 1991.
13. Ayus JC, Varon J, and Arieff AI . Hyponatremia, cerebral edema, and noncardiogenic pulmonary edema in marathon runners. Ann Intern Med 132: 711-714, 2000.
14. Barr SI, Costill DL, and Fink WJ . Fluid replacement during prolonged exercise: effects of water, saline, or no fluid. Med Sci Sports Exerc 23: 811-817, 1991.
15. Bastian J, and Nakajima S. Action potential in the transverse tubules and its role in the activation of skeletal muscle. J Gen Physiol 63: 257-278, 1974.
16. Bezanilla F, Caputo C, Gonzalez-Serratos H, and Venosa RA. Sodium dependence of the inward spread of activation in isolated twitch muscle fibres of the frog. J Physiol 223: 507-523, 1972.

168
17. Bouclin R, Charbonneau E, and Renaud JM. Na+ and K+ effect on contractility of frog sartorius muscle: implication for the mechanism of fatigue. Am J Physiol 268: C1528-1536, 1995.
18. Brown WK, and Sargent F, 2nd. Hidromeiosis. Arch Environ Health 11: 442-453, 1965.
19. Cairns SP, Buller SJ, Loiselle DS, and Renaud J-M. Changes of action potentials and force at lowered [Na+]o in mouse skeletal muscle: implications for fatigue. Am J Physiol Cell Physiol 285: C1131-1141, 2003.
20. Collins KJ, and Weiner JS. Endocrinological aspects of exposure to high environmental temperatures. Physiol Rev 48: 785-839, 1968.
21. Collins RD. Illustrated Manual of Fluid and Electrolyte Disorders. Philadelphia, Toronto: J. B. Lippincott Company, 1976.
22. Convertino VA, Keil LC, and Greenleaf JE. Plasma volume, renin, and vasopressin responses to graded exercise after training. J Appl Physiol 54: 508-514, 1983.
23. Costa F, Galloway DH, and Margen S. Regional and total body sweat composition of men fed controlled diets. Am J Clinical Nutrition 22: 52-58, 1969.
24. Costill DL . Sweating: its composition and effects on body fluids. Ann N Y Acad Sci 301: 160-174, 1977.
25. Costill DL, Branam G, Fink W, and Nelson R. Exercise induced sodium conservation: changes in plasma renin and aldosterone. Med Sci Sports 8: 209-213, 1976.
26. Coyle EF, Hemmert MK, and Coggan AR. Effects of detraining on cardiovascular responses to exercise: role of blood volume. J Appl Physiol 60: 95-99, 1986.
27. Coyle EF, Hopper MK, and Coggan AR. Maximal oxygen uptake relative to plasma volume expansion. Int J Sports Med 11: 116-119, 1990.
28. Damgaard M, Gabrielsen A, Heer M, Warberg J, Bie P, Christensen NJ, and Norsk P. Effects of sodium intake on cardiovascular variables in humans during posture changes and ambulatory conditions. Am J Physiol Regulatory Integrative Comp Physiol 283: R1404-1411, 2002.
29. Damgaard M, Norsk P, Gustafsson F, Kanters JK, Christensen NJ, Bie P, Friberg L, and Gadsboll N. Hemodynamic and neuroendocrine responses to changes in sodium intake in compensated heart failure. Am J Physiol Regul Integr Comp Physiol 290: R1294-1301, 2006.
30. Davies JA, Harrison MH, Cochrane LA, Edwards RJ, and Gibson TM. Effect of saline loading during heat acclimatization on adrenocortical hormone levels. J Appl Physiol 50: 605-612, 1981.
31. Davis DP, Videen JS, Marino A, Vilke GM, Dunford JV, Van Camp SP, and Maharam LG . Exercise-associated hyponatremia in marathon runners: a two-year experience. J Emerg Med 21: 47-57, 2001.
32. Decaux G. Is asymptomatic hyponatremia really asymptomatic? Am J Med 119: S79-82, 2006.
33. Dill DB, and Costill DL . Calculation of percentage changes in volumes of blood, plasma, and red cells in dehydration. J Appl Physiol 37: 247-248, 1974.

169
34. Edelman IaL, J. Anatomy of Body Water and Electrolytes. American Journal of Medicine 1959.
35. Eilers RJ. Notification of final adoption of an international method and standard solution for hemoglobinometry specifications for preparation of standard solution. Am J Clin Pathol 47: 212-214, 1967.
36. Elliott P . Commentary: Role of salt intake in the development of high blood pressure. Int J Epidemiol 34: 975-978, 2005.
37. Falkner B, and Kushner H. Effect of chronic sodium loading on cardiovascular response in young blacks and whites. Hypertension 15: 36-43, 1990.
38. Fallo F. Renin-angiotensin-aldosterone system and physical exercise. J Sports Med Phys Fitness 33: 306-312, 1993.
39. Freund BJ, Shizuru EM, Hashiro GM, and Claybaugh JR. Hormonal, electrolyte, and renal responses to exercise are intensity dependent. J Appl Physiol 70: 900-906, 1991.
40. Fritzsche RG, and Coyle EF. Cutaneous blood flow during exercise is higher in endurance-trained humans. J Appl Physiol 88: 738-744, 2000.
41. Frye AJ, and Kamon E. Responses to dry heat of men and women with similar aerobic capacities. J Appl Physiol 50: 65-70, 1981.
42. Garcia MC, Gonzalez-Serratos H, Morgan JP, Perreault CL, and Rozycka M . Differential activation of myofibrils during fatigue in phasic skeletal muscle cells. J Muscle Res Cell Motil 12: 412-424, 1991.
43. Gardner JW. Death by water intoxication. Mil Med 167: 432-434, 2002. 44. Garigan TP, and Ristedt DE. Death from hyponatremia as a result of acute
water intoxication in an Army basic trainee. Mil Med 164: 234-238, 1999. 45. Grant SM, Green HJ, Phillips SM, Enns DL, and Sutton JR. Fluid and
electrolyte hormonal responses to exercise and acute plasma volume expansion. J Appl Physiol 81: 2386-2392, 1996.
46. Green HJ, Thomson JA, Ball ME, Hughson RL, Houston ME, and Sharratt MT . Alterations in blood volume following short-term supramaximal exercise. J Appl Physiol 56: 145-149, 1984.
47. Greenleaf JE, and Brock PJ. Na+ and Ca2+ ingestion: plasma volume-electrolyte distribution at rest and exercise. J Appl Physiol 48: 838-847, 1980.
48. Greenleaf JE, Looft-Wilson R, Wisherd JL, McKenzie MA, Jensen CD, and Whittam JH . Pre-exercise hypervolemia and cycle ergometer endurance in men. Biol Sport 14: 103-114, 1997.
49. Havenith G, Luttikholt VG, and Vrijkotte TG . The relative influence of body characteristics on humid heat stress response. Eur J Appl Physiol Occup Physiol 70: 270-279, 1995.
50. Heer M, Baisch F, Kropp J, Gerzer R, and Drummer C. High dietary sodium chloride consumption may not induce body fluid retention in humans. Am J Physiol Renal Physiol 278: F585-595, 2000.
51. Herfel R, Stone CK, Koury SI, and Blake JJ. Iatrogenic acute hyponatraemia in a college athlete. Br J Sports Med 32: 257-258, 1998.

170
52. Hew-Butler TD, Sharwood K, Collins M, Speedy D, and Noakes T. Sodium supplementation is not required to maintain serum sodium concentrations during an Ironman triathlon. Br J Sports Med 40: 255-259, 2006.
53. Hiller W . Dehydration and hyponatremia during triathlons. Med Sci Sports Exerc 21: S219-221, 1989.
54. Hiller W, O'Toole M, Fortess E, Laird R, Imbert P, and Sisk T. Medical and physiological considerations in triathlons. Am J Sports Med 15: 164-167, 1987.
55. Hiller WD . Dehydration and hyponatremia during triathlons. Med Sci Sports Exerc 21: S219-221, 1989.
56. Hogervorst E, Riedel W, Jeukendrup A, and Jolles J. Cognitive performance after strenuous physical exercise. Percept Mot Skills 83: 479-488, 1996.
57. Hopper MK, Coggan AR, and Coyle EF. Exercise stroke volume relative to plasma-volume expansion. J Appl Physiol 64: 404-408, 1988.
58. Horne M, and P. Swearingen. Fluids, electrolytes, and acid-base balance. In: Fluids, electrolytes, and acid-base balance, edited by Book MY1993.
59. Hsieh M, Roth R, Davis DL, Larrabee H, and Callaway CW. Hyponatremia in runners requiring on-site medical treatment at a single marathon. Med Sci Sports Exerc 34: 185-189, 2002.
60. Johnson BD, Beck KC, Proctor DN, Miller J, Dietz NM, and Joyner MJ. Cardiac output during exercise by the open circuit acetylene washin method: comparison with direct Fick. J Appl Physiol 88: 1650-1658, 2000.
61. Kanstrup IL, and Ekblom B . Acute hypervolemia, cardiac performance, and aerobic power during exercise. J Appl Physiol 52: 1186-1191, 1982.
62. Kozak-Collins K, Burke ER, and Schoene RB. Sodium bicarbonate ingestion does not improve performance in women cyclists. Med Sci Sports Exerc 26: 1510-1515, 1994.
63. Krip B, Gledhill N, Jamnik V, and Warburton D . Effect of alterations in blood volume on cardiac function during maximal exercise. Med Sci Sports Exerc 29: 1469-1476, 1997.
64. Mallie JP, Ait-Djafer Z, Saunders C, Pierrat A, Caira MV, Courroy O, Panescu V, and Perrin P. Renal handling of salt and water in humans during exercise with or without hydration. Eur J Appl Physiol 86: 196-202, 2002.
65. Martin JC, Wagner BM, and Coyle EF. Inertial-load method determines maximal cycling power in a single exercise bout. Med Sci Sports Exerc 29: 1505-1512, 1997.
66. McCance RA. The effect of salt deficiency in man on the volume of the extracellular fluids, and on the composition of sweat, saliva, gastric juice and cerebrospinal fluid. J Physiol 92: 208-218, 1938.
67. Mitchell D, Senay LC, Wyndham CH, van Rensburg AJ, Rogers GG, and Strydom NB. Acclimatization in a hot, humid environment: energy exchange, body temperature, and sweating. J Appl Physiol 40: 768-778, 1976.
68. Mitchell JW, Nadel ER, and Stolwijk JA. Respiratory weight losses during exercise. J Appl Physiol 32: 474-476, 1972.
69. Montain S, Sawka M, and Wenger C. Hyponatremia associated with exercise: risk factors and pathogenesis. Exerc Sport Sci Rev 29: 113-117, 2001.

171
70. Montain SJ, Cheuvront SN, and Sawka MN. Exercise associated hyponatraemia: quantitative analysis to understand the aetiology. Br J Sports Med 40: 98-105; discussion 198-105, 2006.
71. Montain SJ, Latzka WA, and Sawka MN. Control of thermoregulatory sweating is altered by hydration level and exercise intensity. J Appl Physiol 79: 1434-1439, 1995.
72. Nakajima S, Nakajima Y, and Bastian J. Effects of sudden changes in external sodium concentration on twitch tension in isolated muscle fibers. J Gen Physiol 65: 459-482, 1975.
73. Noakes T. Hyponatremia in distance runners: fluid and sodium balance during exercise. Curr Sports Med Rep 1: 197-207, 2002.
74. Noakes TD, Norman RJ, Buck RH, Godlonton J, Stevenson K, and Pittaway D. The incidence of hyponatremia during prolonged ultraendurance exercise. Med Sci Sports Exerc 22: 165-170, 1990.
75. Noakes TD, Sharwood K, Speedy D, Hew T, Reid S, Dugas J, Almond C, Wharam P, and Weschler L. Three independent biological mechanisms cause exercise-associated hyponatremia: evidence from 2,135 weighed competitive athletic performances. Proc Natl Acad Sci U S A 102: 18550-18555, 2005.
76. O'Brien K, Montain S, Corr W, Sawka M, Knapik J, and Craig S. Hyponatremia associated with overhydration in U.S. Army trainees. Mil Med 166: 405-410, 2001.
77. Pahnke MD, Trinity JD, Zachwieja JJ, Stofan JR, Hiller WD, and Coyle EF. Serum Sodium Concentration Changes Are Related To Fluid Balance and Sweat Sodium Loss. Med Sci Sports Exerc 42: 2010.
78. Patterson MJ, Galloway SD, and Nimmo MA. Variations in regional sweat composition in normal human males. Exp Physiol 85: 869-875, 2000.
79. Pivarnik JM, Leeds EM, and Wilkerson JE. Effects of endurance exercise on metabolic water production and plasma volume. J Appl Physiol 56: 613-618, 1984.
80. Potteiger JA, Nickel GL, Webster MJ, Haub MD, and Palmer RJ. Sodium citrate ingestion enhances 30 km cycling performance. Int J Sports Med 17: 7-11, 1996.
81. Renneboog B, Musch W, Vandemergel X, Manto MU, and Decaux G. Mild Chronic Hyponatremia Is Associated With Falls, Unsteadiness, and Attention Deficits. The American Journal of Medicine 119: 71.e71-71.e78, 2006.
82. Robinson S, Kincaid RK, and Rhamy RK. Effect of Salt Deficiency on the Salt Concentration in Sweat. J Appl Physiol 3: 55-62, 1950.
83. Robinson S, and Robinson AH. Chemical Composition of Sweat. Physiol Rev 34: 202-220, 1954.
84. Sadaniantz A, Yurgalevitch S, Zmuda JM, and Thompson PD. One year of exercise training does not alter resting left ventricular systolic or diastolic function. Med Sci Sports Exerc 28: 1345-1350, 1996.
85. Sanders B, Noakes TD, and Dennis SC. Sodium replacement and fluid shifts during prolonged exercise in humans. Eur J Appl Physiol 84: 419-425, 2001.

172
86. Sato K, and Dobson RL. The effect of intracutaneous d-aldosterone and hydrocortisone on human eccrine sweat gland function. J Invest Dermatol 54: 450-462, 1970.
87. Sato K, and Dobson RL. Regional and individual variations in the function of the human eccrine sweat gland. J Invest Dermatol 54: 443-449, 1970.
88. Schmidlin O, Forman Anthony Sebastian A, and Morris RC, Jr. What Initiates the Pressor Effect of Salt in Salt-Sensitive Humans?: Observations in Normotensive Blacks. Hypertension 49: 1032-1039, 2007.
89. Shirreffs SM, and Maughan RJ. Whole body sweat collection in humans: an improved method with preliminary data on electrolyte content. J Appl Physiol 82: 336-341, 1997.
90. Silverthorn DU . Human Physiology. San Francisco: Pearson Education Inc. Benjamin Cummings, 2010.
91. Sims ST, Rehrer NJ, Bell ML, and Cotter JD. Preexercise sodium loading aids fluid balance and endurance for women exercising in the heat. J Appl Physiol 103: 534-541, 2007.
92. Smiles KA, and Robinson S. Sodium ion conservation during acclimatization of men to work in the heat. J Appl Physiol 31: 63-69, 1971.
93. Speedy DB, Noakes TD, Kimber NE, Rogers IR, Thompson JM, Boswell DR, Ross JJ, Campbell RG, Gallagher PG, and Kuttner JA. Fluid balance during and after an ironman triathlon. Clin J Sport Med 11: 44-50, 2001.
94. Speedy DB, Noakes TD, and Schneider C. Exercise-associated hyponatremia: a review. Emerg Med (Fremantle) 13: 17-27, 2001.
95. Speedy DB, Rogers IR, Noakes TD, Wright S, Thompson JM, Campbell R, Hellemans I, Kimber NE, Boswell DR, Kuttner JA, and Safih S. Exercise-induced hyponatremia in ultradistance triathletes is caused by inappropriate fluid retention. Clin J Sport Med 10: 272-278, 2000.
96. Speedy DB, Thompson JM, Rodgers I, Collins M, Sharwood K, and Noakes TD. Oral salt supplementation during ultradistance exercise. Clin J Sport Med 12: 279-284, 2002.
97. Spina RJ, Ogawa T, Martin WH, 3rd, Coggan AR, Holloszy JO, and Ehsani AA . Exercise training prevents decline in stroke volume during exercise in young healthy subjects. J Appl Physiol 72: 2458-2462, 1992.
98. Standardization IOf . ISO 9886: Evaluation of Thermal Strain by Physiological Measurements. Geneva, Switzerland: 1992.
99. Sullivan JM, Prewitt RL, Ratts TE, Josephs JA, and Connor MJ . Hemodynamic characteristics of sodium-sensitive human subjects. Hypertension 9: 398-406, 1987.
100. Sullivan JM, and Ratts TE. Hemodynamic mechanisms of adaptation to chronic high sodium intake in normal humans. Hypertension 5: 814-820, 1983.
101. Sullivan JM, and Ratts TE. Sodium sensitivity in human subjects. Hemodynamic and hormonal correlates. Hypertension 11: 717-723, 1988.
102. Tanaka H, Shindo M, Gutkowska J, Kinoshita A, Urata H, Ikeda M, and Arakawa K . Effect of acute exercise on plasma immunoreactive-atrial natriuretic factor. Life Sci 39: 1685-1693, 1986.

173
103. Thaysen JH, and Schwartz IL. Fatigue of the sweat glands. J Clin Invest 34: 1719-1725, 1955.
104. Twerenbold R, Knechtle B, Kakebeeke TH, Eser P, Muller G, von Arx P, and Knecht H. Effects of different sodium concentrations in replacement fluids during prolonged exercise in women. Br J Sports Med 37: 300-303, 2003.
105. USDA. Dietary Guidelines for Americans. edited by Services USDoHaH2005. 106. Verde T, Shephard RJ, Corey P, and Moore R. Sweat composition in exercise
and in heat. J Appl Physiol 53: 1540-1545, 1982. 107. Volpe M, Tritto C, DeLuca N, Rubattu S, Rao MA, Lamenza F, Mirante A,
Enea I, Rendina V, and Mele AF. Abnormalities of sodium handling and of cardiovascular adaptations during high salt diet in patients with mild heart failure. Circulation 88: 1620-1627, 1993.
108. Vrijens DM, and Rehrer NJ. Sodium-free fluid ingestion decreases plasma sodium during exercise in the heat. J Appl Physiol 86: 1847-1851, 1999.
109. Watt G, Hart JT, and Foy C. Dietary sodium restriction for mild hypertension in general practice. Br Med J (Clin Res Ed) 286: 1146-1147, 1983.
110. Welmsley RNaMDG. Disorders of Fluid and Electrolyte Balance. John Wright & Sons Ltd., 1984.
111. Weschler LB. Sweat electrolyte concentrations obtained from within occlusive coverings are falsely high because sweat itself leaches skin electrolytes. J Appl Physiol 105: 1376-1377, 2008.
112. Wilmore JH, Stanforth PR, Gagnon J, Rice T, Mandel S, Leon AS, Rao DC, Skinner JS, and Bouchard C. Cardiac output and stroke volume changes with endurance training: the HERITAGE Family Study. Med Sci Sports Exerc 33: 99-106, 2001.

174
VITA
Matthew Daleon Pahnke attended Kewaunee High School, Kewaunee, Wisconsin. In
1990 he entered Bradley University in Peoria, Illinois. He received the degree of
Bachelor of Arts in International Business from Bradley in May, 1994. He was employed
in various aspects of international business until 2002. In August, 2002, he entered the
Graduate School at The University of Texas at Austin in the Department of Kinesiology
and Health Education. In 2004, working in the Human Performance Laboratory of Dr.
Edward Coyle, Matthew received the degree of Master of Arts in Kinesiology from the
University of Texas at Austin. He remained at The University of Texas at Austin in
pursuit of the degree of Doctor of Philosophy. He was a teaching and research assistant
during his graduate work in the Departments of Kinesiology and Health Education and
Biological Sciences. Matthew has presented his research at conferences such as the
American College of Sports Medicine’s Annual Meeting, Exercise in Hot Environments
in Doha, Qatar, and The Art & Science of Triathlon at the United States Olympic
Training Center. Matthew’s research was funded in part by grants from the Gatorade
Sports Science Institute. He received an Outstanding Teaching Award, a TACSM
Doctoral Poster Award, an ASPETAR Doctoral Student Presentation Travel Award, and
the L.W. McCraw Endowed Presidential Fellowship. He has also volunteered for the
Leukemia & Lymphoma Society as a coach, presenter, and fundraiser since 2004.
Matthew will marry Lauren Strickler in 2010.
Email Address: [email protected]
This manuscript was typed by the author.


