Prepared by Kevin C. Dittman for Systems Analysis & Design Methods 4ed by J. L. Whitten & L. D. Bentley Copyright Irwin/McGraw-Hill 1998 1 Network Modeling Introduction The chapter will address the following questions: Why may network modeling become an important skill for applications developers in the next several years? What is the description network modeling and explain why it is important? What is the definition of a system in terms of locations, location types, and clusters? How can you factor a system’s or application’s locations into component locations using a special location decomposition diagram? How can you document the connections and essential data flows between locations using location connectivity diagrams (LCDs)?
Transcript
Prepared by Kevin C. Dittman for
Systems Analysis & Design Methods 4ed
by J. L. Whitten & L. D. BentleyCopyright Irwin/McGraw-Hill 19981
Network Modeling
Introduction
The chapter will address the following questions: Why may network modeling become an important skill for
applications developers in the next several years? What is the description network modeling and explain why it is
important? What is the definition of a system in terms of locations, location
types, and clusters? How can you factor a system’s or application’s locations into
component locations using a special location decomposition diagram?
How can you document the connections and essential data flows between locations using location connectivity diagrams (LCDs)?
Prepared by Kevin C. Dittman for
Systems Analysis & Design Methods 4ed
by J. L. Whitten & L. D. BentleyCopyright Irwin/McGraw-Hill 19982
Network Modeling
Introduction
The chapter will address the following questions: What is the complementary relationship between network,
process, and data models? How can you synchronize data, process, interface, and network
models to provide a complete and consistent logical system specification?
How is network modeling useful in different types of projects and phases?
Prepared by Kevin C. Dittman for
Systems Analysis & Design Methods 4ed
by J. L. Whitten & L. D. BentleyCopyright Irwin/McGraw-Hill 19983
Network ModelingNetwork Modeling - Not Just For Computer
Networks
Computer Networks Have become the nervous system of today’s information systems. The computer network is a physical component of an information
system. Must be created to support the logical distribution of data,
processes, and interfaces of an information system. Network modeling is a technique for documenting the
geographic structure of a system. Synonyms include distribution modeling and geographic modeling.
Prepared by Kevin C. Dittman for
Systems Analysis & Design Methods 4ed
by J. L. Whitten & L. D. BentleyCopyright Irwin/McGraw-Hill 19984
Network ModelingINFORMATION SYSTEMS FRAMEWORK
SYSTEM
ANALYSTS
SYSTEMBUILDERS
(components)
SYSTEMDESIGNERS
(specification)
SYSTEMUSERS
(requirements)
SYSTEMOWNERS
(scope)
DatabaseTechnology
(and standards)
Data Requirements
Logical Data Model
FOCUS ONSYSTEM
DATA
Business Processes
Logical Process Model
FOCUS ONSYSTEM
PROCESSES
Interface Requirements
Logical Interface Model
FOCUS ON SYSTEM
INTERFACES
Software(and Hardware)
Technology
(and standards)
InterfaceTechnology
(and standards)
NetworkingTelchnology
(and standards)
Communication Reqts.
Location ConnectivityDiagram
Operating Locations
Location Decomposition
FOCUS ONSYSTEM
GEOGRAPHY
Definition Phase
(establish and
prioritize
business system
requirements)
Study Phase
(etablish system
improvemetn
objectives)
Survey Phase
(establish scope &
project plan)
FASTMethodology
EDI Cust
St. Louis
HQ
LA Office
Indy Ware- house
NY Office
West Customers
East Customers
Maintenance Records
Products Catalog
ordercatalog
changes
ship order
ship order ship order
credit credit
service
Prepared by Kevin C. Dittman for
Systems Analysis & Design Methods 4ed
by J. L. Whitten & L. D. BentleyCopyright Irwin/McGraw-Hill 19985
Network ModelingNetwork Modeling - Not Just For Computer
Networks
Computer Networks The need for network modeling is being driven by a technical
trend – distributed computing. Distributed computing is the assignment of specific
information system elements to different computers which cooperate and interoperate across computer network. A synonym is client/server computing; however, client/server is actually one style of distributed computing.
The distributed computers include:• desktop and laptop computers, sometimes called clients
• shared network computers, called servers
• legacy mainframe computers and minicomputers
Prepared by Kevin C. Dittman for
Systems Analysis & Design Methods 4ed
by J. L. Whitten & L. D. BentleyCopyright Irwin/McGraw-Hill 19986
Network Modeling
System Concepts For Network Modeling
Today’s systems analyst must seek answers to new questions:
What locations are applicable to this information system or application?
How many users are at each location? Do any users travel while using (or potentially using) the system? Are any of our suppliers, customers, contractors, or other external
agents to be considered locations for using the system? What are the user’s data and processing requirements at each
location? How much of a location’s data must be available to other
locations? What data is unique to a location?
Prepared by Kevin C. Dittman for
Systems Analysis & Design Methods 4ed
by J. L. Whitten & L. D. BentleyCopyright Irwin/McGraw-Hill 19987
Network Modeling
System Concepts For Network Modeling
Today’s systems analyst must seek answers to new questions: (continued)
How might data and processes be distributed between locations? How might data and processes be distributed within a location?
A network modeling tool is needed to document what we learn about a business system’s geography and requirements.
Network modeling is a diagrammatic technique used to document the shape of a business or information system in terms of its business locations.
Prepared by Kevin C. Dittman for
Systems Analysis & Design Methods 4ed
by J. L. Whitten & L. D. BentleyCopyright Irwin/McGraw-Hill 19988
Network Modeling
System Concepts For Network Modeling
Business Geography Logical network modeling is the modeling of business network
requirements independent of their implementation. All information systems have geography. The location connectivity diagram (LCD) models system
geography independent of any possible implementation. A location connectivity diagram (LCD) is a logical network
modeling tool that depicts the shape of a system in terms of its user, process, data, and interface locations and the necessary interconnections between those locations.
Prepared by Kevin C. Dittman for
Systems Analysis & Design Methods 4ed
by J. L. Whitten & L. D. BentleyCopyright Irwin/McGraw-Hill 19989
Network Modeling
Suppliers (275)
Buyers (20)
on-the-road
Accounts Payable Office
(Atlanta)
Central Warehouse
(Atlanta)
Inventory Control Manager's Office
(Atlanta)
Purchasing Clerks
(3) Atlanta
Distribution Center
(New York)
Distribution Center
(Chicago)
Distribution Center
(Los Angeles)
Prepared by Kevin C. Dittman for
Systems Analysis & Design Methods 4ed
by J. L. Whitten & L. D. BentleyCopyright Irwin/McGraw-Hill 199810
Network Modeling
System Concepts For Network Modeling
Business Geography The location connectivity diagram (LCD) illustrates two concepts
– locations and connectivity. The concept of geography is based on locations.
• A location is any place at which users exist to use or interact with the information system or application. It is also any place where business can be transacted or work performed.
Business management and users will tend to identify logical locations where people do work or business.
Information technologists will tend to discuss physical locations where computer and networking technology is located.
Location
Prepared by Kevin C. Dittman for
Systems Analysis & Design Methods 4ed
by J. L. Whitten & L. D. BentleyCopyright Irwin/McGraw-Hill 199811
Network Modeling
System Concepts For Network Modeling
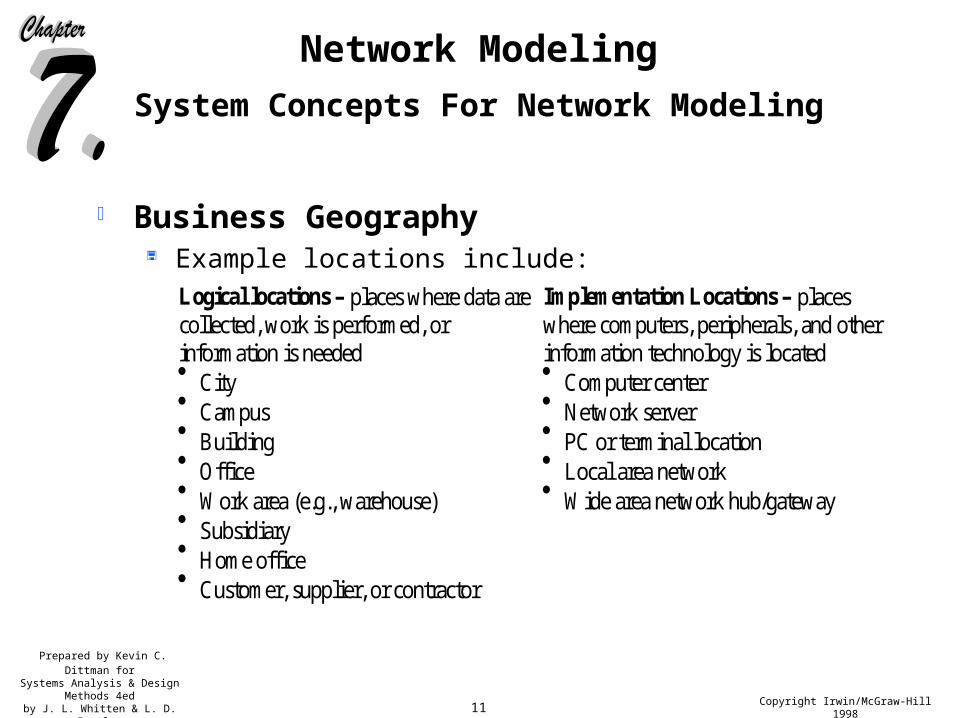
Business Geography Example locations include:
Logical locations – places where data arecollected, work is performed, orinformation is needed
Implementation Locations – placeswhere computers, peripherals, and otherinformation technology is located
City Computer centerCampus Network serverBuilding PC or terminal locationOffice Local area networkWork area (e.g., warehouse) Wide area network hub/gatewaySubsidiaryHome officeCustomer, supplier, or contractor
Prepared by Kevin C. Dittman for
Systems Analysis & Design Methods 4ed
by J. L. Whitten & L. D. BentleyCopyright Irwin/McGraw-Hill 199812
Network Modeling
System Concepts For Network Modeling
Business Geography Logical locations can be:
scattered throughout the business for any given information system.
on the move (e.g., traveling sales representatives). external to the enterprise for which the system is being built.
For instance, customers can become users of an information system via the telephone or the Internet.
Logical locations can represent: clusters of similar locations organizations and agents outside of the company but which
interact with or use the information system; possibly (and increasingly) as direct users
Prepared by Kevin C. Dittman for
Systems Analysis & Design Methods 4ed
by J. L. Whitten & L. D. BentleyCopyright Irwin/McGraw-Hill 199813
Network Modeling
System Concepts For Network Modeling
Business Geography Derivatives of the rectangle will be used to illustrate different
types of locations. The standard rectangle will be used to represent a specific
location. The rectangle with the double, vertical lines will be used to
represent a cluster of locations. Some locations are not stationary, a rounded rectangle will
represent their mobility. Some locations represent external organizations and agents
(such as customers, suppliers, taxpayers, contractors, and the like). A parallelogram to illustrate these external locations.
Specific Location
Moving or Mobile Location(s)
Cluster of "like"
locations
External Location
Prepared by Kevin C. Dittman for
Systems Analysis & Design Methods 4ed
by J. L. Whitten & L. D. BentleyCopyright Irwin/McGraw-Hill 199814
Network Modeling
System Concepts For Network Modeling
Business Geography Location names should describe the location and/or its users. Examples of location names follows:
Paris, France Indianapolis, Indiana Grissom Hall Building 105 Grant Street building Room 222 Warehouse Rooms 230-250 Shipping Dock Order Clerk User names (as locations) Order Entry Dept. Customers Order clerks (a cluster) Suppliers Students
Prepared by Kevin C. Dittman for
Systems Analysis & Design Methods 4ed
by J. L. Whitten & L. D. BentleyCopyright Irwin/McGraw-Hill 199815
Network Modeling
System Concepts For Network Modeling
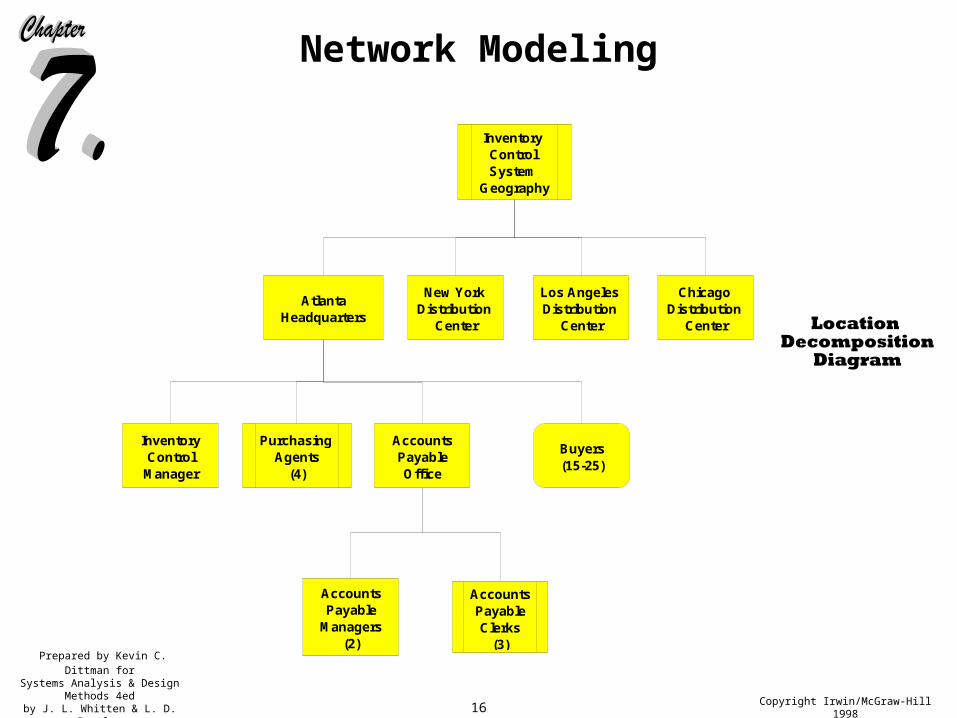
Business Geography Some locations consist of other locations and clusters. It can be quite helpful to understand the relative decomposition of
locations and types of location. Decomposition is the act of breaking a system into its
component subsystems. Each ‘level’ of abstraction reveals more or less detail (as desired) about the overall system or a subset of that system.
In systems analysis, decomposition allows you to partition a system into logical subsets of locations for improved communication, analysis, and design. A location decomposition diagram shows the top down
geographic decomposition of the business locations to be included in a system.
Prepared by Kevin C. Dittman for
Systems Analysis & Design Methods 4ed
by J. L. Whitten & L. D. BentleyCopyright Irwin/McGraw-Hill 199816
Network Modeling
Inventory Control System
Geography
New York Distribution
Center
Chicago Distribution
Center
Atlanta Headquarters
Los Angeles Distribution
Center
Inventory Control
Manager
Purchasing Agents
(4)
Accounts Payable Office
Buyers (15-25)
Accounts Payable
Managers (2)
Accounts Payable Clerks
(3)
Prepared by Kevin C. Dittman for
Systems Analysis & Design Methods 4ed
by J. L. Whitten & L. D. BentleyCopyright Irwin/McGraw-Hill 199817
Network Modeling
System Concepts For Network Modeling
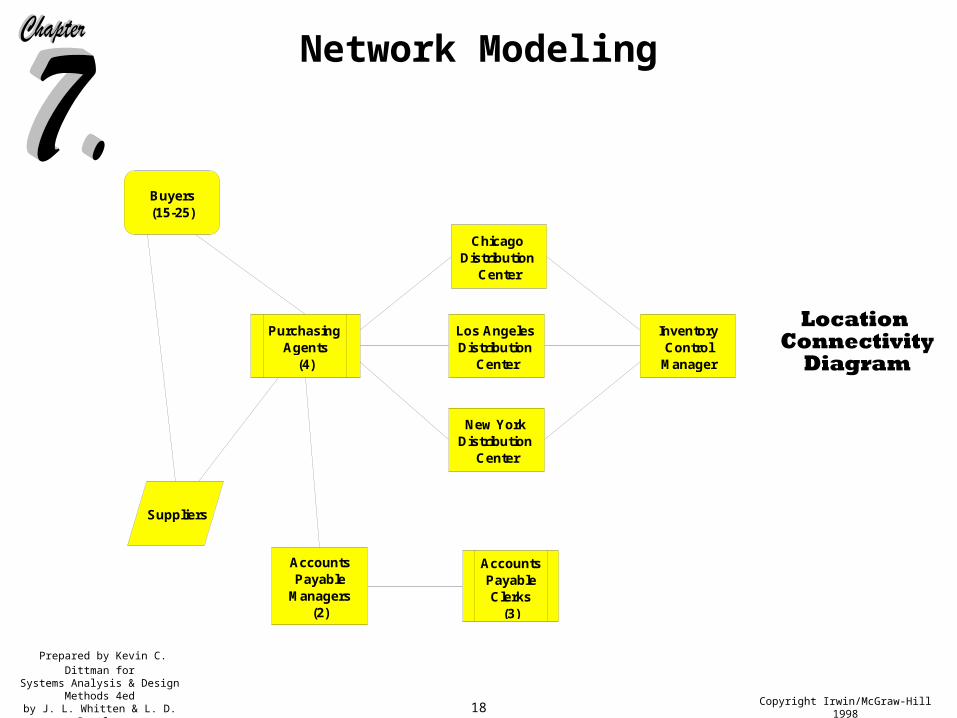
Business Geography The purpose of network modeling is to help system designers
distribute the technical data, processes, and interfaces across the computer network.
The systems analyst needs to specify the technology-independent communications that must occur between business locations.
The communication between business locations requires connectivity. Connectivity defines the need for, and provides the means for
transporting essential data, voice, and images from one location to another.
Connections between locations represent the possibility of data flows between locations.
Prepared by Kevin C. Dittman for
Systems Analysis & Design Methods 4ed
by J. L. Whitten & L. D. BentleyCopyright Irwin/McGraw-Hill 199818
Network Modeling
New York Distribution
Center
Chicago Distribution
Center
Los Angeles Distribution
Center
Inventory Control
Manager
Purchasing Agents
(4)
Buyers (15-25)
Accounts Payable
Managers (2)
Accounts Payable Clerks
(3)
Suppliers
Prepared by Kevin C. Dittman for
Systems Analysis & Design Methods 4ed
by J. L. Whitten & L. D. BentleyCopyright Irwin/McGraw-Hill 199819
Network Modeling
System Concepts For Network Modeling
Miscellaneous Constructs There are no universal standards for location connectivity
diagrams; therefore, in appropriate situations it is permissible to annotate LCDs with symbols from other models, such as data flow diagrams.
Prepared by Kevin C. Dittman for
Systems Analysis & Design Methods 4ed
by J. L. Whitten & L. D. BentleyCopyright Irwin/McGraw-Hill 199820
Network Modeling
System Concepts For Network Modeling
Synchronizing of System Models Network, data, interface, and process models represent different
views of the same system, but these views are interrelated. Modelers need to synchronize the different views to ensure
consistency and completeness of the total system specification.
Prepared by Kevin C. Dittman for
Systems Analysis & Design Methods 4ed
by J. L. Whitten & L. D. BentleyCopyright Irwin/McGraw-Hill 199821
Network Modeling
System Concepts For Network Modeling
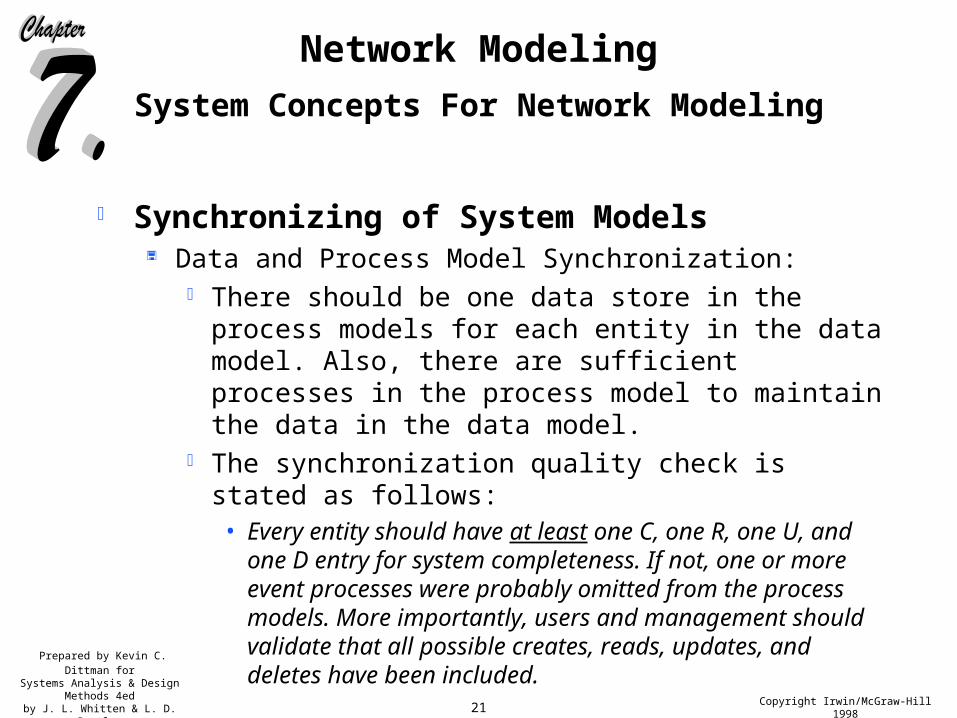
Synchronizing of System Models Data and Process Model Synchronization:
There should be one data store in the process models for each entity in the data model. Also, there are sufficient processes in the process model to maintain the data in the data model.
The synchronization quality check is stated as follows: • Every entity should have at least one C, one R, one U, and one D
entry for system completeness. If not, one or more event processes were probably omitted from the process models. More importantly, users and management should validate that all possible creates, reads, updates, and deletes have been included.
Prepared by Kevin C. Dittman for
Systems Analysis & Design Methods 4ed
by J. L. Whitten & L. D. BentleyCopyright Irwin/McGraw-Hill 199822
Network Modeling
Entity . Attribute Pro
cess
Cu
sto
mer
Ap
pli
cati
on
Pro
cess
Cu
sto
mer
Cre
dit
A
pp
lica
tio
n
Pro
cess
Cu
sto
mer
Ch
ang
e o
f A
dd
ress
Pro
cess
In
tern
al C
ust
om
er C
red
it
Ch
ang
e
Pro
cess
New
Cu
sto
mer
Ord
er
Pro
cess
Cu
sto
mer
Ord
er
Can
cell
atio
n
Pro
cess
Cu
sto
mer
Ch
ang
e to
O
uts
tan
din
g O
rder
Pro
cess
In
tern
al C
han
ge
to
Cu
sto
mer
Ord
er
Pro
cess
New
Pro
du
ct A
dd
itio
n
Pro
cess
Pro
du
ct W
ith
dra
wl
fro
m
Mar
ket
Pro
cess
Pro
du
ct P
rice
Ch
ang
e
Pro
cess
Ch
ang
e to
Pro
du
ct
Sp
ecif
icat
ion
Pro
cess
Pro
du
ct I
nve
ntr
oy
Ad
just
men
t
Customer C C R R R R
.Customer Number C C R R R R
.Customer Name C C U R R R
.Customer Address C C U RU RU RU
.Customer Credit Rating C U R R R
.Customer Balance Due RU U R R
Order C D RU RU
.Order Number C R R
.Order Date C U U
.Order Amount C U U
Ordered Product C D CRUD CRUD RU
.Quantity Ordered C CRUD CRUD
.Ordered Item Unit Price C CRUD CRUD
Product R R R R C D RU RU RU
.Product Number R R R R C R
.Product Name R R R C RU
.Product Description R R R C RU
.Product Unit of Measure R R R C RU RU
.Product Current Unit Price R R R U
.Product Quantity on Hand RU U RU RU RU
Prepared by Kevin C. Dittman for
Systems Analysis & Design Methods 4ed
by J. L. Whitten & L. D. BentleyCopyright Irwin/McGraw-Hill 199823
Network Modeling
System Concepts For Network Modeling
Synchronizing of System Models Data and Network Model Synchronization:
A data model describes the stored data requirements for a system as a whole.
The network model describes the business operating locations. The goal is to identify what data is at which locations. Specifically, the following business questions might be asked:
• Which subset of the entities and attributes are needed to perform the work to be performed at each location?
• What level of access is required?
• Can the location create, read, delete, or update instances of the entity?
Prepared by Kevin C. Dittman for
Systems Analysis & Design Methods 4ed
by J. L. Whitten & L. D. BentleyCopyright Irwin/McGraw-Hill 199824
Network Modeling
System Concepts For Network Modeling
Synchronizing of System Models Data and Network Model Synchronization: (continued)
System analysts have found it useful to define logical requirements in the form of a Data-to-Location-CRUD matrix.
• A Data-to-Location-CRUD Matrix is a table in which the rows indicate entities (and possibly attributes); the columns indicate locations; and the cells (the intersection rows and columns) document level of access where C = create, R = read or use, U = update or modify, and D = delete or deactivate.
Prepared by Kevin C. Dittman for
Systems Analysis & Design Methods 4ed
by J. L. Whitten & L. D. BentleyCopyright Irwin/McGraw-Hill 199825
Network Modeling
Entity . Attribute Cu
sto
mer
s
Kan
sas
Cit
y
. M
arke
tin
g
. A
dve
rtsi
ng
. W
areh
ou
se
. S
ales
. A
cco
un
ts
……
..R
ecei
vab
le
Bo
sto
n
. S
ales
. W
areh
ou
se
San
Fra
nci
sco
. S
ales
San
Die
go
. W
areh
ose
Customer INDV ALL ALL SS SS SS SS
.Customer Number R R CRUD R CRUD R CRUD R
.Customer Name RU R CRUD R CRUD R CRUD R
.Customer Address RU R CRUD R CRUD R CRUD R
.Customer Credit Rating X R RU R R
.Customer Balance Due R R RU R R
Order INDV ALL SS ALL SS SS SS SS
.Order Number SRD R CRUD R CRUD R CRUD R CRUD R
.Order Date SRD R CRUD R CRUD R CRUD R CRUD R
.Order Amount SRD R CRUD CRUD R CRUD R CRUD R
Ordered Product INDV ALL SS ALL SS SS SS SS
.Quantity Ordered SUD R CRUD R CRUD R CRUD CRUD
.Ordered Item Unit Price SUD R CRUD CRUD R CRUD CRUD
Product ALL ALL ALL ALL ALL ALL ALL ALL ALL
.Product Number R CRUD R R R R R R R
.Product Name R CRUD R R R R R R R
.Product Description R CRUD RU R R R R R R
.Product Unit of Measure R CRUD R R R R R R R
.Product Current Unit Price R CRUD R R R R R R
.Product Quantity on Hand X RU R R RU R RU
INDV = individual ALL = ALL SS = subset X = no access
S = submit C = create R = read U = update D = delete
Prepared by Kevin C. Dittman for
Systems Analysis & Design Methods 4ed
by J. L. Whitten & L. D. BentleyCopyright Irwin/McGraw-Hill 199826
Network Modeling
System Concepts For Network Modeling
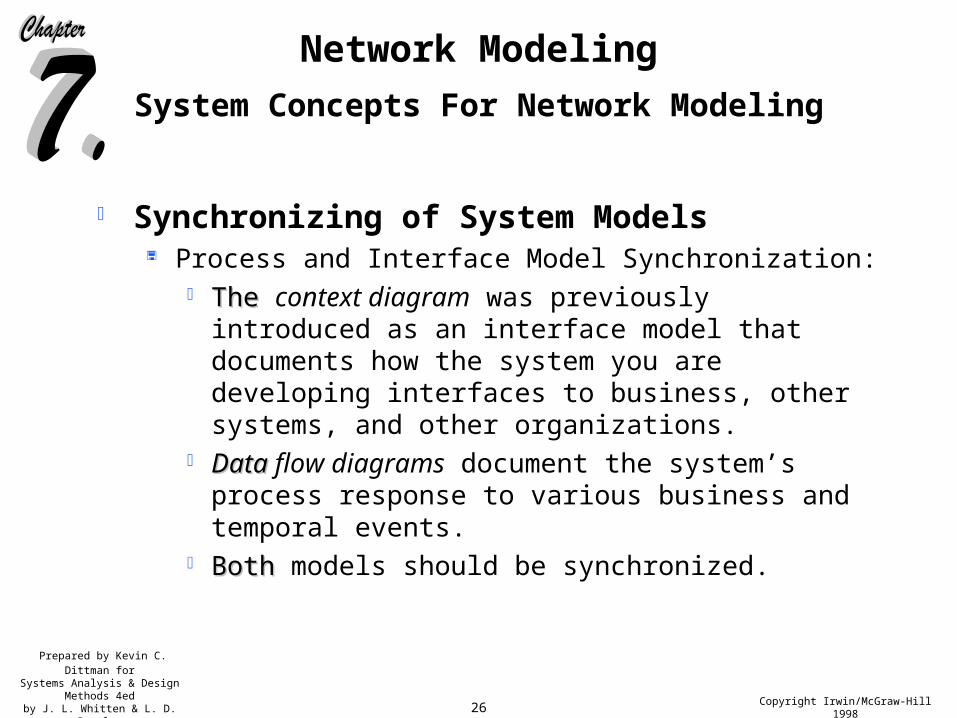
Synchronizing of System Models Process and Interface Model Synchronization:
The The context diagram was previously introduced as an interface model that documents how the system you are developing interfaces to business, other systems, and other organizations.
DataData flow diagrams document the system’s process response to various business and temporal events.
BothBoth models should be synchronized.
Prepared by Kevin C. Dittman for
Systems Analysis & Design Methods 4ed
by J. L. Whitten & L. D. BentleyCopyright Irwin/McGraw-Hill 199827
Network Modeling
System Concepts For Network Modeling
Synchronizing of System Models Process and Network Model Synchronization:
Process models illustrate the essential work to be performed by the system as a whole.
Network models identify the locations where work is to be performed.
Some work may be unique to one location. Other work may be performed at multiple locations.
Before designing the information system, what processes must be performed at which locations should be identified and documented.
Prepared by Kevin C. Dittman for
Systems Analysis & Design Methods 4ed
by J. L. Whitten & L. D. BentleyCopyright Irwin/McGraw-Hill 199828
Network Modeling
System Concepts For Network Modeling
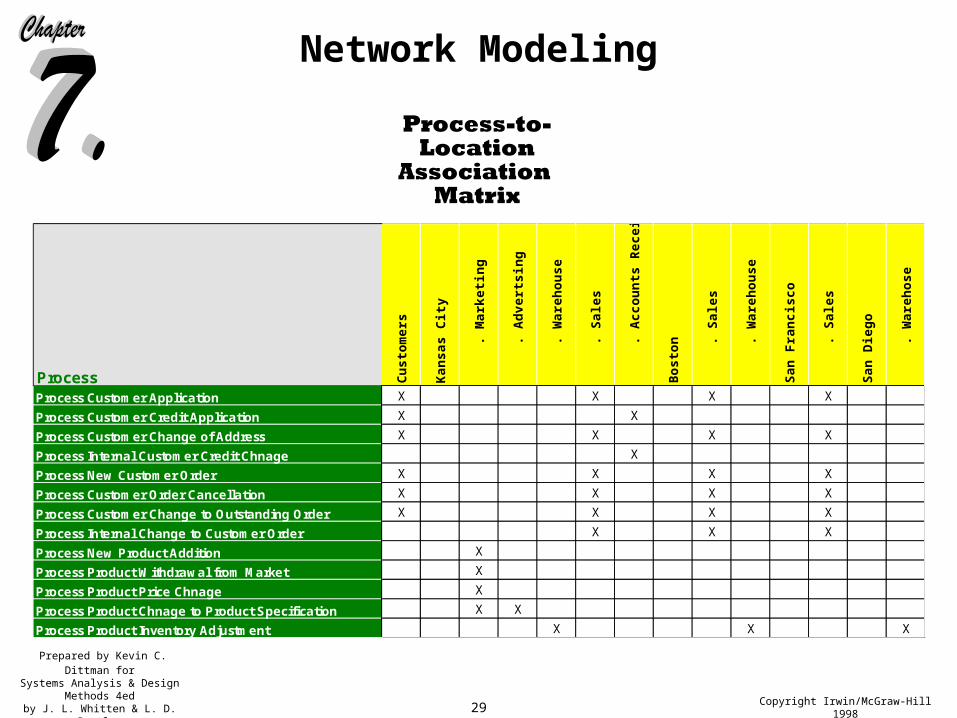
Synchronizing of System Models Process and Network Model Synchronization:
Synchronization of the process and network models can be accomplished through a Process-to-Location-Association Matrix.
• A Process-to-Location-Association Matrix is a table in which the rows indicate processes (event or elementary processes); the columns indicate locations, and the cells (the intersection rows and columns) document which processes must be performed at which locations.
Prepared by Kevin C. Dittman for
Systems Analysis & Design Methods 4ed
by J. L. Whitten & L. D. BentleyCopyright Irwin/McGraw-Hill 199829
Network Modeling
Process Cu
sto
mer
s
Kan
sas
Cit
y
. M
arke
tin
g
. A
dve
rtsi
ng
. W
areh
ou
se
. S
ales
. A
cco
un
ts R
ecei
vab
le
Bo
sto
n
. S
ales
. W
areh
ou
se
San
Fra
nci
sco
. S
ales
San
Die
go
. W
areh
ose
Process Customer Application X X X X
Process Customer Credit Application X X
Process Customer Change of Address X X X X
Process Internal Customer Credit Chnage X
Process New Customer Order X X X X
Process Customer Order Cancellation X X X X
Process Customer Change to Outstanding Order X X X X
Process Internal Change to Customer Order X X X
Process New Product Addition X
Process Product Withdrawal from Market X
Process Product Price Chnage X
Process Product Chnage to Product Specification X X
Process Product Inventory Adjustment X X X
Prepared by Kevin C. Dittman for
Systems Analysis & Design Methods 4ed
by J. L. Whitten & L. D. BentleyCopyright Irwin/McGraw-Hill 199830
Network Modeling
The Process of Logical Network Modeling
Network Modeling during Strategic Systems Planning Projects
Many systems planning methodologies and techniques result in a network architecture to guide the design of all future computer networks and applications that use those networks. May be a traditional map, or a top-down decomposition
diagram that logically groups locations. Association matrices are also typically used to provide an
initial mapping of data entities to locations, and processes to locations
Prepared by Kevin C. Dittman for
Systems Analysis & Design Methods 4ed
by J. L. Whitten & L. D. BentleyCopyright Irwin/McGraw-Hill 199831
Network Modeling
The Process of Logical Network Modeling
Network Modeling during Systems Analysis During the study phase of systems analysis, a project team should
review any existing network models, logical or physical. In the definition phase of systems analysis, network modeling
becomes more important. If a network model already exists, it is expanded or refined to
reflect new application requirements. If a network model does not exist, a network model should be
built from scratch.
Prepared by Kevin C. Dittman for
Systems Analysis & Design Methods 4ed
by J. L. Whitten & L. D. BentleyCopyright Irwin/McGraw-Hill 199832
Network Modeling
The Process of Logical Network Modeling
Looking Ahead to Systems Design The logical application network model from systems analysis
describes business networking requirements, not technical solutions.
In systems design, network models must become more technical – they must become physical network models that will guide the technical distribution and duplication of the other physical system components, namely, DATA, PROCESSES, and INTERFACES.
Prepared by Kevin C. Dittman for
Systems Analysis & Design Methods 4ed
by J. L. Whitten & L. D. BentleyCopyright Irwin/McGraw-Hill 199833
Network Modeling
The Process of Logical Network Modeling
Fact-Finding and Information Gathering for Network Modeling
Like all system models, network models are dependent on appropriate facts and information as supplied by the user community.
Facts can be collected by sampling of existing forms and files; research of similar systems; surveys of users and management; and interviews of users and management.
The fastest method of collecting facts and information, and simultaneously constructing and verifying the process models is Joint Application Development (JAD). JAD uses a carefully facilitated group meeting to collect the
facts, build the models, and verify the models – usually in one or two full-day sessions.
Prepared by Kevin C. Dittman for
Systems Analysis & Design Methods 4ed
by J. L. Whitten & L. D. BentleyCopyright Irwin/McGraw-Hill 199834
Network Modeling
The Process of Logical Network Modeling
Computer-Aided Systems Engineering (CASE) for Network Modeling
Network models should be stored in the repository. Computer-aided systems engineering (CASE) technology provides
the repository for storing various models and their detailed descriptions.
Prepared by Kevin C. Dittman for
Systems Analysis & Design Methods 4ed
by J. L. Whitten & L. D. BentleyCopyright Irwin/McGraw-Hill 199835
Network Modeling
How to Construct Logical Network Models
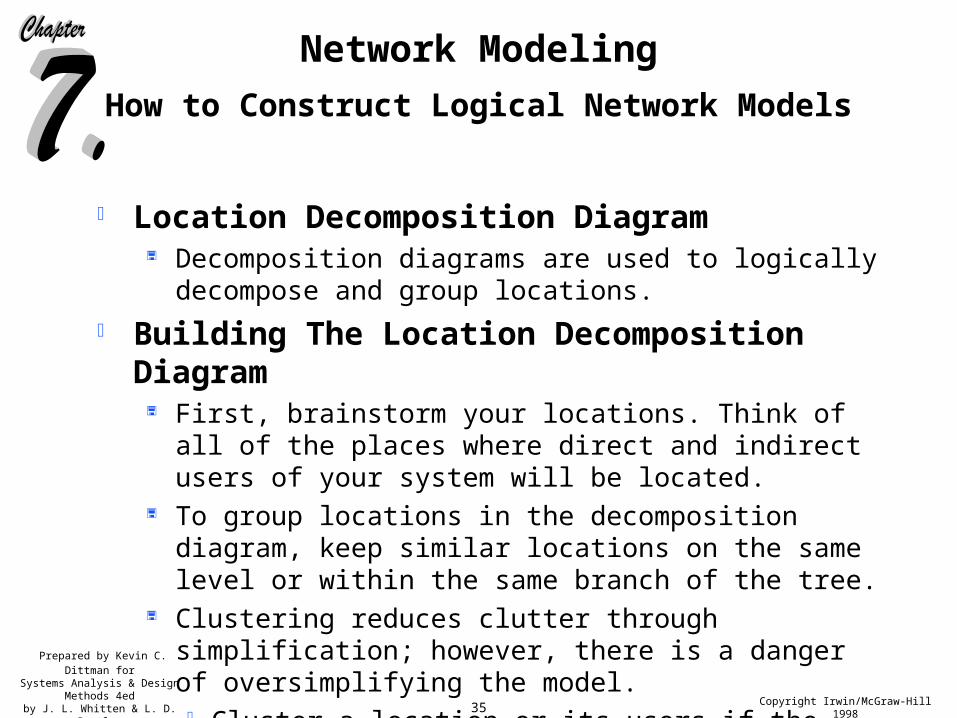
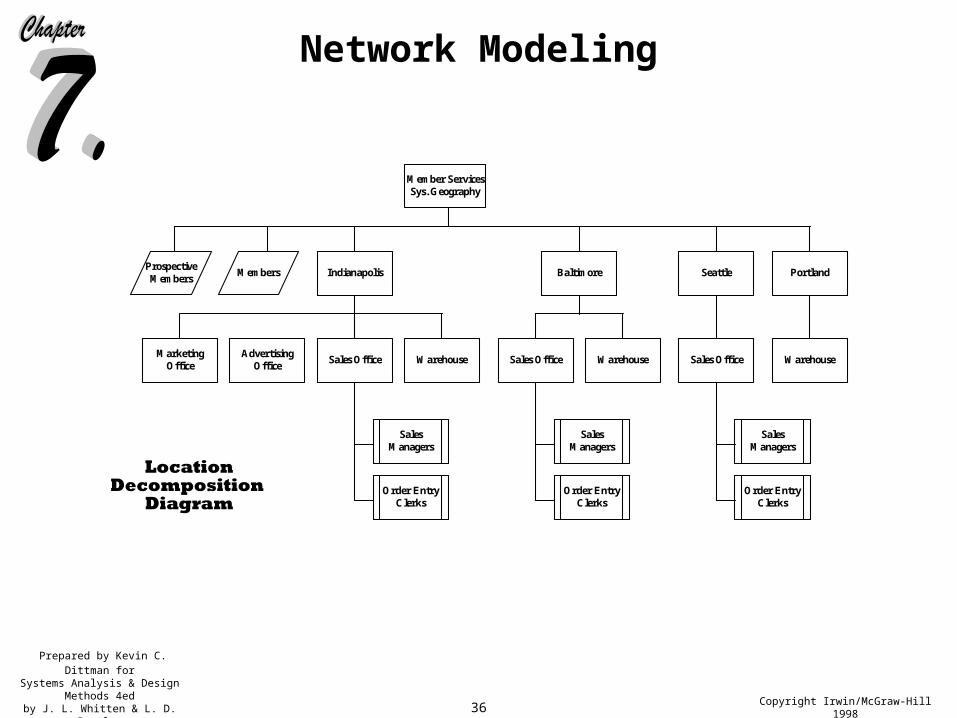
Location Decomposition Diagram Decomposition diagrams are used to logically decompose and
group locations.
Building The Location Decomposition Diagram First, brainstorm your locations. Think of all of the places where
direct and indirect users of your system will be located. To group locations in the decomposition diagram, keep similar
locations on the same level or within the same branch of the tree. Clustering reduces clutter through simplification; however, there is
a danger of oversimplifying the model. Cluster a location or its users if the data and processing
requirements for all users are expected to be the same.
Prepared by Kevin C. Dittman for
Systems Analysis & Design Methods 4ed
by J. L. Whitten & L. D. BentleyCopyright Irwin/McGraw-Hill 199836
Network Modeling
Member ServicesSys. Geography
Indianapolis
MarketingOffice
AdvertisingOffice
Sales Office
Baltimore SeattleProspectiveMembers
Members
Warehouse
Order EntryClerks
SalesManagers
Sales Office Warehouse
Order EntryClerks
SalesManagers
Sales Office
Order EntryClerks
SalesManagers
Portland
Warehouse
Prepared by Kevin C. Dittman for
Systems Analysis & Design Methods 4ed
by J. L. Whitten & L. D. BentleyCopyright Irwin/McGraw-Hill 199837
Network Modeling
How to Construct Logical Network Models
Location Connectivity Diagram Location connectivity diagrams can be initially drawn at a high-
level to communicate general information. More detailed information can be added to subsequent diagrams.
In the following slides, the first location connectivity diagram drawn is a systemwide model. It will include any external locations and locations that have sublocations. The second diagram reveals an exploded view.
Prepared by Kevin C. Dittman for
Systems Analysis & Design Methods 4ed
by J. L. Whitten & L. D. BentleyCopyright Irwin/McGraw-Hill 199838
Network Modeling
Members
ProspectiveMembers
Seattle
Portland
Baltimore
Indianapolis
indeterminate distance
indeterminate distance
2250 miles
2250 miles
575 miles
Prepared by Kevin C. Dittman for
Systems Analysis & Design Methods 4ed
by J. L. Whitten & L. D. BentleyCopyright Irwin/McGraw-Hill 199839
Network Modeling
Balt. Order EntryClerks (8)
Indpls. Order EntryClerks (12)
Indpls. AdvertisingOffice (4)
Indpls. MarketingOffice (3)
Seattle SalesManagers (2)
Seattle Order EntryClerks (7)
Members (n)
Balt. SalesManagers (2)
Members (n)
Port. WarehouseStations (2)
Balt. WarehouseStations (3)
Indpls. WarehouseStations (3)
Indpls. SalesManagers (3)
Members (n)
ProspectiveMembers (n)
Figure 7.10
Indeterminate Distance
Indeterminate Distance
2250 miles
575 miles
250 feet
50 feet
< 150 feet
200 miles
Indeterminate Distance
< 40 feet
< 20 feet
Indeterminate Distance
< 50 feet
580 feet
2250 miles
2800 miles
575 miles
Prepared by Kevin C. Dittman for
Systems Analysis & Design Methods 4ed
by J. L. Whitten & L. D. BentleyCopyright Irwin/McGraw-Hill 199840
Network Modeling
The Next Generation
The Next Generation The demand for logical network modeling skills will remain
strong so long as the trend towards distributed computing remains strong.
CASE tool support will evolve after methodologies, since CASE tool engineers are reluctant to invest time and effort prior to some semblance of a widely accepted methodological standard.
Prepared by Kevin C. Dittman for
Systems Analysis & Design Methods 4ed
by J. L. Whitten & L. D. BentleyCopyright Irwin/McGraw-Hill 199841
Network Modeling
Summary
Introduction Network Modeling - Not Just For
Computer Networks
System Concepts For Network Modeling The Process of Logical Network Modeling How to Construct Logical Network Models The Next Generation