30
Corangamite Salinity Action Plan Recharge Mapping Report No: CCMA 05/01 January 2005

Corangamite Salinity Action Plan
Recharge Mapping
Report No: CCMA 05/01 January 2005

Corangamite Salinity Action Plan – Recharge Mapping
Dahlhaus Environmental Geology Pty Ltd i
Executive Summary
The second-generation Corangamite Salinity Action Plan (SAP) sets challenging targets for 12 salinity management areas to protect the region’s assets from damage or deterioration due to salinity. The Morrisons-Sheoaks salinity target area is nominated due to rising salinity trends in the Moorabool River, and the Illabarook and Pittong target areas are nominated due to rising salinity trends in the Woady Yaloak River. All three areas have some responsive groundwater systems (local systems) where recharge control should assist in stabilising or reversing the trends.
This report analyses the landscapes and salinity processes in these three salinity target areas where recharge control is applicable. A brief overview of recharge processes is provided as context for the analysis of landscape elements in each target area. The report outlines the conceptual models and logic used to set the priority for recharge control works, which is spatially mapped for each area.
The mapping has been presented at a medium scale (1:25,000) which is suitable for strategic planning of salinity management. Recharge management at the property-scale will require collaboration with the land-owners, reference to the individual whole-farm plans, and on-ground assessment of the landscapes. Options for managing recharge and discharge are provided in the Corangamite SAP and background reports, along with the management targets for the next decade.
The Morrisons-Sheoaks and Illabarook salinity target areas have similar conceptual models for salinity processes, based on the geology, terrain, environmental histories and observed saline discharge. In both areas the priority targets for recharge management are the local groundwater systems of the Highlands gravel caps. Extensive mining of the gravels during the mid to late nineteenth century has left the legacy of a landscape cleared of native vegetation, with a disturbed regolith and pathways for rapid recharge, and saline discharge accompanied by erosion. The higher priority recharge control areas are those where replanting and rehabilitation can provide multiple benefits, such as reducing salinity, erosion, pest animals and pest plants, and improving water quality.
Discharge management to reduce salt wash-off remains the highest priority in the immediate term, as this can provide the greatest gain in the shortest time frame. However, the preliminary scenario modelling shows that both recharge and discharge management are required to reduce the discharge volume.
The scenario models for the Morrisons-Sheoaks target area clearly indicate that while recharge and discharge management will have an effect, they are not sufficient to stabilise or reverse the trend. More direct engineering intervention will probably be required meet the goal of the National Action Plain (NAP) for salinity and water quality, that is: to stabilise or reverse the trend.
In the Illabarook and Pittong target areas, the combination of both recharge and discharge management has a greater chance of meeting the NAP goal. The rising salinity trend in the Woady Yaloak River is less challenging than the Moorabool River and the scenario modelling is more optimistic of achieving the goal. However the trend of increasing area of land salinisation in the Pittong target area, particularly when groundwater levels are declining, presents a paradox.
Corangamite Salinity Action Plan – Recharge Mapping
Dahlhaus Environmental Geology Pty Ltd ii
Table of contents
EXECUTIVE SUMMARY ...............................................................................................................................I
1 INTRODUCTION................................................................................................................................. 1 1.1 Scope of this report ............................................................................................................ 1 1.2 Disclaimer............................................................................................................................. 1
2 RECHARGE...................................................................................................................................... 2 2.1 Factors influencing recharge ............................................................................................ 3
2.1.1 Groundwater hydrology ................................................................................................................. 3 2.1.2 Geology .......................................................................................................................................... 3 2.1.3 Regolith profile and properties....................................................................................................... 3 2.1.4 Climate............................................................................................................................................ 4 2.1.5 Slope............................................................................................................................................... 4 2.1.6 Land-use history............................................................................................................................. 4 2.1.7 Current land-use............................................................................................................................. 4
2.2 Recharge evidence ............................................................................................................. 5 2.3 Modelling recharge ............................................................................................................. 5
2.3.1 Conceptual models ........................................................................................................................ 5 2.3.2 Numerical models .......................................................................................................................... 5
3 MORRISONS – SHEOAKS ................................................................................................................. 6 3.1 Landscape parameters....................................................................................................... 6
3.1.1 Geology .......................................................................................................................................... 6 3.1.2 Climate............................................................................................................................................ 7 3.1.3 Terrain ............................................................................................................................................ 7 3.1.4 Land-use history............................................................................................................................. 8 3.1.5 Current land-use............................................................................................................................. 8
3.2 Conceptual Models ............................................................................................................. 9 3.3 Recharge mapping............................................................................................................10
4 ILLABAROOK..................................................................................................................................11 4.1 Landscape parameters.....................................................................................................11
4.1.1 Geology ........................................................................................................................................11 4.1.2 Climate..........................................................................................................................................12 4.1.3 Terrain ..........................................................................................................................................12 4.1.4 Land-use history...........................................................................................................................12 4.1.5 Current land-use...........................................................................................................................13
4.2 Conceptual models...........................................................................................................13 4.3 Recharge mapping............................................................................................................15
5 PITTONG........................................................................................................................................16 5.1.1 Geology ........................................................................................................................................16 5.1.2 Climate..........................................................................................................................................17 5.1.3 Terrain ..........................................................................................................................................17 5.1.4 Land-use history...........................................................................................................................17 5.1.5 Current land-use...........................................................................................................................18
5.2 Conceptual models...........................................................................................................18 5.3 Recharge mapping............................................................................................................19
6 DISCUSSION AND CONCLUSIONS....................................................................................................21
REFERENCES.........................................................................................................................................22
APPENDIX A MORRISONS-SHEOAKS DATA....................................................................................25
APPENDIX B ILLABAROOK DATA....................................................................................................26
APPENDIX C PITTONG DATA ..........................................................................................................27

Corangamite Salinity Action Plan – Recharge Mapping
Dahlhaus Environmental Geology Pty Ltd 1
1 Introduction
The second-generation Corangamite Salinity Action Plan (SAP) sets challenging targets for 12 salinity management areas to protect the region’s assets from damage or deterioration due to salinity (CCMA, 2003). The salinity management actions are based on the response of the groundwater flow systems implicated in the salinity process, and aim to control the groundwater recharge or discharge in the target areas.
This report analyses the landscapes and salinity processes in the three salinity target areas where recharge control is applicable, viz: Pittong, Illabarook and Morrisons-Sheoaks. A brief overview of recharge processes is provided as context for the analysis of landscape elements in each target area. The report outlines the conceptual models and logic used to set the priority for recharge control works, which is spatially mapped for each area.
The recharge mapping project was commissioned by Tim Corlett, Salinity Program Manager, Corangamite Catchment Management Authority (CMA) in June 2004. Maps delineating the priority areas were provided to the Department of Primary Industries (DPI) and the Woady Yaloak Catchment Group (WYCG) in October 2004. This document reports on the methods used to determine the priority areas shown on the maps.
1.1 Scope of this report
This report details the landscape attributes and environmental history regarded as relevant to spatially map the priority recharge zones within each of the three salinity management target areas. The maps have been compiled using the relevant existing data, previous knowledge of the target areas, and conceptual models of the salinity processes. The data includes Geographic Information System (GIS) layers, databases, exploration and mining records, aerial photography and historical literature. The accuracy of the information in these existing data sources was assumed. The project did not include verification of the data in the field, such as mapping, subsurface investigations, or groundwater data collection.
The mapping has been presented at a medium scale (1:25,000) which is suitable for strategic planning of salinity management. Recharge management at the property-scale (i.e. Precisely where do we plant the trees?) will require collaboration with the land-owners, reference to the individual whole-farm plans, and on-ground assessments This report does not assess all the options for managing recharge or discharge. These are provided in the Corangamite SAP and background reports, along with the management targets for the next decade (Appendix 5 of the SAP).
1.2 Disclaimer
This document has been prepared for use by the Corangamite Catchment Management Authority by Dahlhaus Environmental Geology Pty Ltd and has been compiled using the consultants’ expert knowledge, due care and professional expertise. Some of the interpretations within the report are based on data sourced from other government agencies, student reports, mineral exploration and mining records, and other consultant’s reports, and have not been evidentially tested. Dahlhaus Environmental Geology Pty Ltd does not guarantee that the publication is without flaw of any kind or is wholly appropriate for every purpose for which it may be used and therefore disclaim all liability for any error, loss, damage or other consequence whatsoever which may arise from the use of or reliance on the information contained in this publication.

Corangamite Salinity Action Plan – Recharge Mapping
Dahlhaus Environmental Geology Pty Ltd 2
2 Recharge
Groundwater recharge is the term given to that water which is added to groundwater storage. The source of the water may be rainfall which has infiltrated into the ground, or water which has leaked from lakes, dams, swamps or rivers. Recharge is not equivalent to infiltration, as the rainfall that infiltrates the soil may 1) return to the atmosphere by transpiration or evaporation 2) move downslope as either interflow or throughflow and return to the surface as runoff or 3) continue to move downwards under the force of gravity and reach the water table. It is only the water that reaches the saturated zone which is termed groundwater recharge and it contributes to the groundwater storage.
Recharge rates are expressed in terms of volume/unit time/unit area. In simplest form it can be thought of as the depth of water reaching the groundwater surface over a given time, at a particular point in the landscape. So recharge rates vary from year to year, depending on rainfall, land-use, the soil moisture condition, and run-off. Recharge in Victoria varies from zero to about 600 mm per year.
In a groundwater system, water enters in the recharge areas and moves to the discharge areas. In the Corangamite region, discharge occurs to nearly all lakes, streams and rivers, and in discrete locations on the land surface. Discharge is much more efficient than recharge as it takes up much less area to get the groundwater out of the system, since it involves largely horizontal movement of groundwater (often the direction of highest permeability). By comparison, recharge depends on infiltration of small amounts of water vertically through the unsaturated zone.
Another important difference between recharge and discharge involves timing. The majority of recharge occurs due to rainfall, and therefore it's intermittent. Discharge, of course, is continuous, as long as the groundwater heads are above the level of discharge. As the recharge declines during the summer, so the discharge declines (given a lag time). Therefore the boundary between a recharge zone and discharge zone (known as the hinge line) can move with the seasons, in concert with the fluctuating groundwater table.
In an unconfined aquifer, recharge to the watertable can occur anywhere outside the discharge area, although the rate of recharge may vary depending on the soil and rock conditions. In a confined aquifer (artesian groundwater), the recharge area is limited to the outcrop of the aquifer, and/or leakage from overlying beds.
The rate at which recharge occurs is variable, depending upon, among other things, the thickness of the unsaturated zone. Where the depth to the watertable is relatively shallow, such as in topographic low spots near a lake or discharge zone, recharge will usually reach the watertable first, creating a local groundwater mound. In low permeability materials this mound can take a long time to dissipate, resulting in very complex transitory localised flow systems, where the groundwater flow can be locally reversed for a time.
A groundwater system can categorised as either recharge driven or discharge driven. A recharge driven system is one in which the volume water in the system is dependent on the volume of recharge. In other words, the system could handle more water if it were available. A discharge driven system is one in which the rate of discharge controls the flow of water through the system. Regardless of the volume of water in the system, it can only discharge at a given rate, and excess recharge is diverted at the surface or within the soil layers to runoff.
Corangamite Salinity Action Plan – Recharge Mapping
Dahlhaus Environmental Geology Pty Ltd
2.1 Factors influencing recharge
2.1.1 Groundwater hydrology
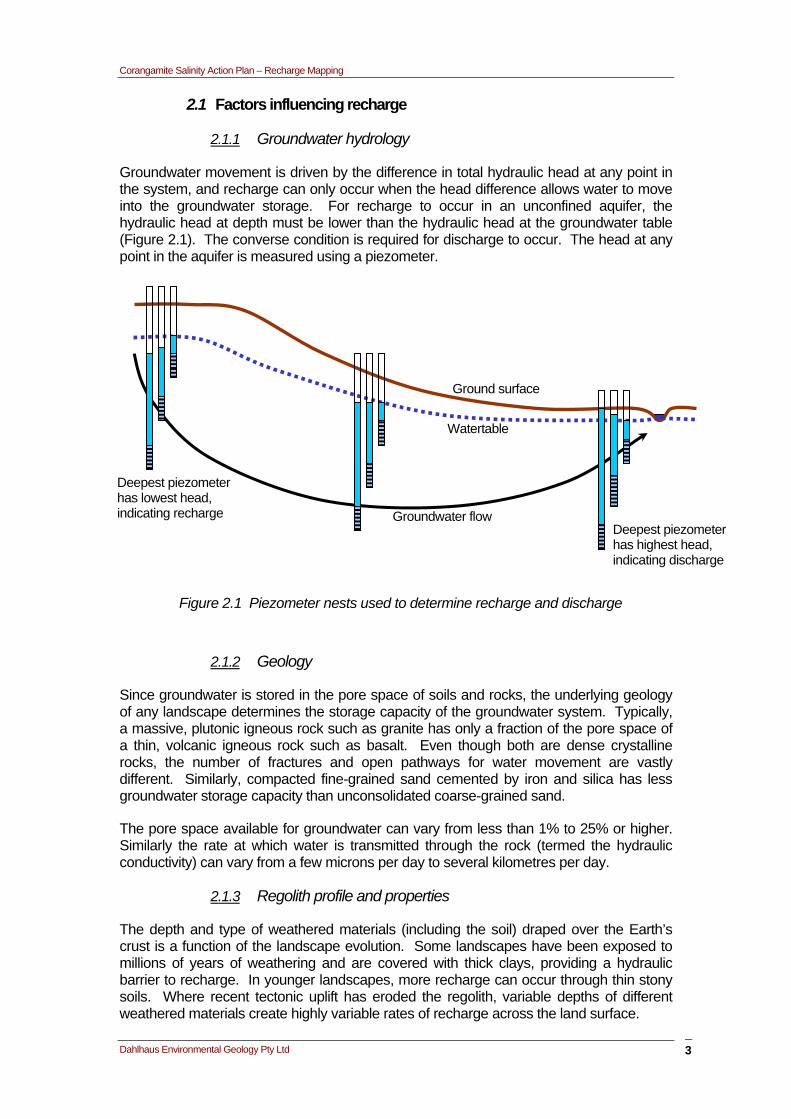
Groundwater movement is driven by the difference in total hydraulic head at any point in the system, and recharge can only occur when the head difference allows water to move into the groundwater storage. For recharge to occur in an unconfined aquifer, the hydraulic head at depth must be lower than the hydraulic head at the groundwater table (Figure 2.1). The converse condition is required for discharge to occur. The head at any point in the aquifer is measured using a piezometer.
Deepest piezometer has lowest head, indicating recharge
Deepest piezometer has highest head, indicating discharge
Groundwater flow
Watertable
Ground surface
Figure 2.1 Piezometer nests used to determine recharge and discharge
2.1.2 Geology
Since groundwater is stored in the pore space of soils and rocks, the underlying geology of any landscape determines the storage capacity of the groundwater system. Typically, a massive, plutonic igneous rock such as granite has only a fraction of the pore space of a thin, volcanic igneous rock such as basalt. Even though both are dense crystalline rocks, the number of fractures and open pathways for water movement are vastly different. Similarly, compacted fine-grained sand cemented by iron and silica has less groundwater storage capacity than unconsolidated coarse-grained sand.
The pore space available for groundwater can vary from less than 1% to 25% or higher. Similarly the rate at which water is transmitted through the rock (termed the hydraulic conductivity) can vary from a few microns per day to several kilometres per day.
2.1.3 Regolith profile and properties
The depth and type of weathered materials (including the soil) draped over the Earth’s crust is a function of the landscape evolution. Some landscapes have been exposed to millions of years of weathering and are covered with thick clays, providing a hydraulic barrier to recharge. In younger landscapes, more recharge can occur through thin stony soils. Where recent tectonic uplift has eroded the regolith, variable depths of different weathered materials create highly variable rates of recharge across the land surface.
3

Corangamite Salinity Action Plan – Recharge Mapping
Dahlhaus Environmental Geology Pty Ltd 4
2.1.4 Climate
Since the majority of groundwater recharge is derived from rainfall, recharge can be correlated to climate, both seasonal and annual. At any given position in the landscape the temporal climatic factors affecting the recharge are complex. The amount of water infiltrating the soil depends on the intensity and duration of a rainfall event, the antecedent soil moisture condition, and the condition of the ground surface. The amount of infiltrated water which is subsequently committed to recharge depends on the soil moisture deficit, the evaporation from the soil and amount transpired by the plants. Maximum recharge is generally provided by days of gentle soaking rain in a wet landscape during the colder seasons when evaporation and plant growth is minimal.
2.1.5 Slope
In general steeper slopes experience less recharge as the runoff and infiltrated water quickly flow down hill under the influence of gravity. By contrast, flatter areas may experience prolonged waterlogging, allowing more time for recharge to occur.
2.1.6 Land-use history
Increased recharge is widely reported to be linked to clearing of the native vegetation and replacement with annual pastures or crops. This axiom forms the basis of recharge management using biological control, such as replanting trees in the landscape. However, it is increasingly recognised that different responses occur in different landscapes, depending on the complexity of the underlying groundwater systems and hydrological processes (Dahlhaus & MacEwan, 1997, Dahlhaus et al., 2000).
In the landscapes of the CCMA SAP target areas where recharge control is considered effective, the legacy of land-use over the past 170 years has left widespread changes to the regolith hydrology. Squatters and settlers cleared some of the native vegetation, constructed drains to alleviate waterlogging, and drained wetlands for agriculture. In some areas, the period of gold mining between 1850 and 1900 has had the most dramatic effect on the hydrological systems. Large tracts of forests were rapidly removed, the regolith was mined for alluvial gold, and the natural drainage channels were altered. For a period of decades, dewatering of the deeper mines created a groundwater sink and disposal of the pumped water added to the sludge from mineral processing to degrade the waterways. As settlement developed, the removal of gravel (especially ironstone gravel) and sand for construction, the restoration of the mined landscapes and the development of urban centres further altered the near-surface hydrology. The pre-settlement recharge conditions of the landscape were irreversibly and considerably changed by these cumulative disturbances.
In the districts where agriculture has prevailed, the clearing of tree stumps has also left channels (or preferred pathways) for increased recharge in some landscapes. Elsewhere in Australia, these “holey landscapes” have been shown to leak disproportionate amounts of water to the groundwater system (Williams et al., 2001).
2.1.7 Current land-use
Among the current land-uses, urban and rural infrastructure development, cropping, and agroforestry probably have the greatest impacts on recharge. Infrastructure development both decreases recharge by the creation of impervious surfaces and increases recharge through garden irrigation and water ponding. Cropping can increase recharge during periods of tillage and fallow and agroforestry can reduce recharge by tree water use.

Corangamite Salinity Action Plan – Recharge Mapping
Dahlhaus Environmental Geology Pty Ltd 5
2.2 Recharge evidence
The most direct evidence for recharge is supplied through measurements, such as the time-series trends in nested piezometers (Figure 2.1), or the volume of water committed to deep drainage in a lysimeter. Measurement using infiltrometers has also incorrectly been related to recharge (for the reasons outlined at the start of this Section).
In the landscape, indirect evidence for recharge is generally subtle, such as consistently well-drained soils, leaky dams, and thin soil cover over fractured rocks. Soil colour and mottling patterns may be used as a guide, as soil colour results from the redoximorphic conditions established by the long-term soil hydrology (Brouwer & Fitzpatrick, 2002). Rises in groundwater levels are often assumed to be related to increased recharge, although there may be other reasons such as barometric pressure changes, or changes to groundwater discharge conditions.
2.3 Modelling recharge
2.3.1 Conceptual models
Conceptual models result from inductive reasoning or inference, and are arrived at by recognising the pattern in a set of observations from which predictions are then made, and tested against the data or observations. They cannot be made by deductive reasoning alone (MacLean & Gribble, 1985).
Conceptualising the salinity process is the first step in understanding how to manipulate the discharge by controlling the recharge. Conceptual models are based on an understanding of the landscape parameters in three dimensions, especially the geology, geometry of the aquifers, aquifer parameters and groundwater pressures within the system. Theoretical models are tested against the observations and existing data are subsequently modified until the model holds true. Inevitably, conceptual models are continuously refined as additional observations and data are iterated through the model.
2.3.2 Numerical models
Numerical models use deductive reasoning or deduction. The geometry and parameters of the numerical model is based on the conceptual model, and the outcome is arrived at by iteration through mathematical arguments. There are several accepted numerical methods used to model recharge such as water balance techniques and groundwater flow models (Petheram, et al., 2002).
The paucity of quality hydrological data in the Morrison-Sheoaks and Illabarook target areas restricts the opportunity for rigorous numerical modelling. However, for the SAP, some preliminary models were calculated using Flowtube, one-dimensional finite difference model, to provide salinity management scenarios (Dahlhaus, 2003). The results showed that eucalypt plantations over the entire slopes in conjunction with revegetating discharge zones provides the most effective control of saline groundwater discharge.
In the Pittong target area, the conceptual model of groundwater and salinity processes is still emerging, and more rigorous numerical modelling may be possible in the near future. This may result in a revision of the Flowtube modelling that was completed for the SAP.

Corangamite Salinity Action Plan – Recharge Mapping
Dahlhaus Environmental Geology Pty Ltd 6
3 Morrisons – Sheoaks
3.1 Landscape parameters
The biophysical components of the environment that are considered relevant to recharge mapping in the Morrisons – Sheoaks SAP target area are the geology, physiography, climate and land-use.
3.1.1 Geology
The geology of the Morrisons-Sheoaks salinity management target area was first investigated and described during the mid-nineteenth century gold rush. Dunn (1888a, 1888b, 1888c) first documented the stratigraphic layers and recognised both the Neogene gravel conglomerate and overlying sands sandwiched between the Palaeozoic basement and the Plio-Pleistocene Newer Volcanic Formation.
Ordovician age sandstone, siltstones, slates and shales form the basement rocks of the SAP target area. The sediments were initially deposited in large submarine turbidite fans and were subsequently lithified, folded, faulted and injected with quartz veins during a series of tectonic events during the Ordovician and Silurian periods. Although the rocks are monotonously similar, the strata are subdivided on the basis of their fossil content.
East of Meredith, an outcrop of a Jurassic age dyke of igneous rock occurs (Ferguson 1914). The monchiquite rock is probably associated with the igneous activity at the time of the Australia-Antarctic breakup. It has little or no relevance to groundwater movement and salinity processes of the SAP target area.
Unconformably overlying the Ordovician rocks are a series of sedimentary rocks deposited during the Palaeogene and Neogene periods. The oldest of these is the Werribee Formation, comprising coarse gravels, sands and clays of Eocene age, which occur in isolated outcrops within the SAP target area. The late Miocene Ballark Conglomerate was described by Bolger (1978) as a very coarse, poorly sorted conglomerate which occurs in outcrop along the Moorabool River valley and Tea Tree Creek. The rock comprises cobbles and boulders of mixed provenance, with an average grain size of 7 cm to 15 cm.
The Pliocene deposits of the Moorabool Viaduct Formation are the most widespread of the Neogene age sediments, being exposed across most of the SAP target area. Ferruginous fine to coarse sandstone, fine to coarse grained gravel, and occasional unconsolidated sands are the dominant lithologies. The vast majority of the sediments are heavily ferruginised to ironstone and ironstone conglomerate (Bolger 1978). Siliceous conglomerate and quartzite also occur in outcrop throughout the area, although their origin and relationship to the Moorabool Viaduct Formation is still uncertain (Carey & Hughes, 2002).
The basalts of the Newer Volcanics Formation stratigraphically overlie the Moorabool Viaduct Formation, and dominate the western portion of the target area. The basalts were emplaced by volcanic eruptions during the Pliocene and Pleistocene as relatively thin and fluid lava flows, and built up over successive eruptions to form a sheet of basalt. Two flows are recognised at Morrisons, the younger of which filled the valley of the ancient Moorabool River (Bolger, 1978).

Corangamite Salinity Action Plan – Recharge Mapping
Dahlhaus Environmental Geology Pty Ltd
Sporadic thin deposits of Quaternary sediments including river alluvium, terrace deposits, swamp deposits, lunettes and colluvium have been deposited by the recent landscape forming processes. The geology is illustrated in Appendix A.
3.1.2 Climate
The relevant climate statistics for the Morrisons - Sheoaks salinity target area are tabulated below. The statistics are based on the modelled climate surfaces as indicated in Table 3.1 and the spatial distributions for some parameters are illustrated in Appendix A.
Parameter Maximum Minimum Model Source Average Annual Rainfall 735 mm 581 mm Average Annual Rain Days 174 days 165 days Average Annual Pan Evaporation 1167 mm 1042 mm
ANUCLIM Dahlhaus, 2002
Average Annual Aerial Actual Evapotranspiration 598 mm 546 mm
Average Annual Aerial Potential Evapotranspiration 1046 mm 1013 mm
Average Annual Point Potential Evapotranspiration 1310 mm 1238 mm
BoM / ANU BoM, 2002
Table 3.1 Relevant climate statistics for the Morrisons-Sheoaks salinity target area
3.1.3 Terrain
The Morrisons-Sheoaks salinity management target area comprises a relatively planar to gently undulating surface which has been dissected by the Moorabool River and tributaries (Figure 3.1). The overall slope of the terrain is to the south, with the highest elevation (495 metres AHD) in the north west corner and the lowest elevation (173 metres AHD) in the valley of the Moorabool River just below Sheoaks.
Drainage development is generally dendritic, with tributaries connecting to the central trunk of the Moorabool River. In the centre north, and in the south west, twin parallel streams either side of the basalts of the Newer Volcanic Formation represent the displaced drainage of the ancestral Moorabool River, which was filled by the lava flow.
Figure 3.1 Terrain model of the Morrisons Sheoaks salinity target area.
7

Corangamite Salinity Action Plan – Recharge Mapping
Dahlhaus Environmental Geology Pty Ltd
3.1.4 Land-use history
The landscapes of the Moorabool River valley in Morrisons – Sheoaks SAP target area have undergone considerable change over the past 200 years. It is likely that the majority of the area was vegetated by forests and grassy woodlands prior to 1840. A report by Surveyor Skene (1859) listed the Moorabool River basin as “entirely wooded” and the Ecological Vegetation Class (EVC) mapping shows a 20 EVC classes estimated to be present in 1750 (Appendix A).
Extensive land-use change commenced with the early pastoral settlement in 1838 (Learmonth, 1853 in Bride, 1898). However, the most extensive hydrological change was associated with the clearing of native vegetation and gold mining activities of the mid-1850s to 1880s. Although history shows that the Morrison’s gold field was never very rich, Dunn (1888c) speculates that there was little unworked ground under the plateau between the Moorabool River and Ti-Tree Creek. Dunn (1888b) also noted the extensive quarrying of ironstone gravel (of the Moorabool Viaduct Formation) for road-making.
The hydrological changes to the landscape were also undertaken to increase agricultural production or secure water resources. Dunn (1888a) lamented that the Beremboke Swamp, an area of about 1500 acres (607 Ha), should be drained and cultivated, ”…but for want of a little unanimity among the various landholders.” As an alternative he suggested that the swamp could serve as a reservoir to supply Geelong.
Figure 3.2 Ground sluicing near Ballarat, circa. 1880, shows the extent of regolith disturbance. (source: Geological Survey of Victoria collection)
3.1.5 Current land-use
Current land-use in the area is mainly grazing and mixed farming on the volcanic landscapes, with grazing and lifestyle properties on the gravels and Palaeozoic landscapes. Forestry is increasing, particularly in the eastern portion around the water supply catchments for Geelong. Public land accounts for over 6000 hectares in the region, mostly confined to the landscapes developed on Palaeozoic rocks (Appendix A).
8
Corangamite Salinity Action Plan – Recharge Mapping
Dahlhaus Environmental Geology Pty Ltd
3.2 Conceptual Models
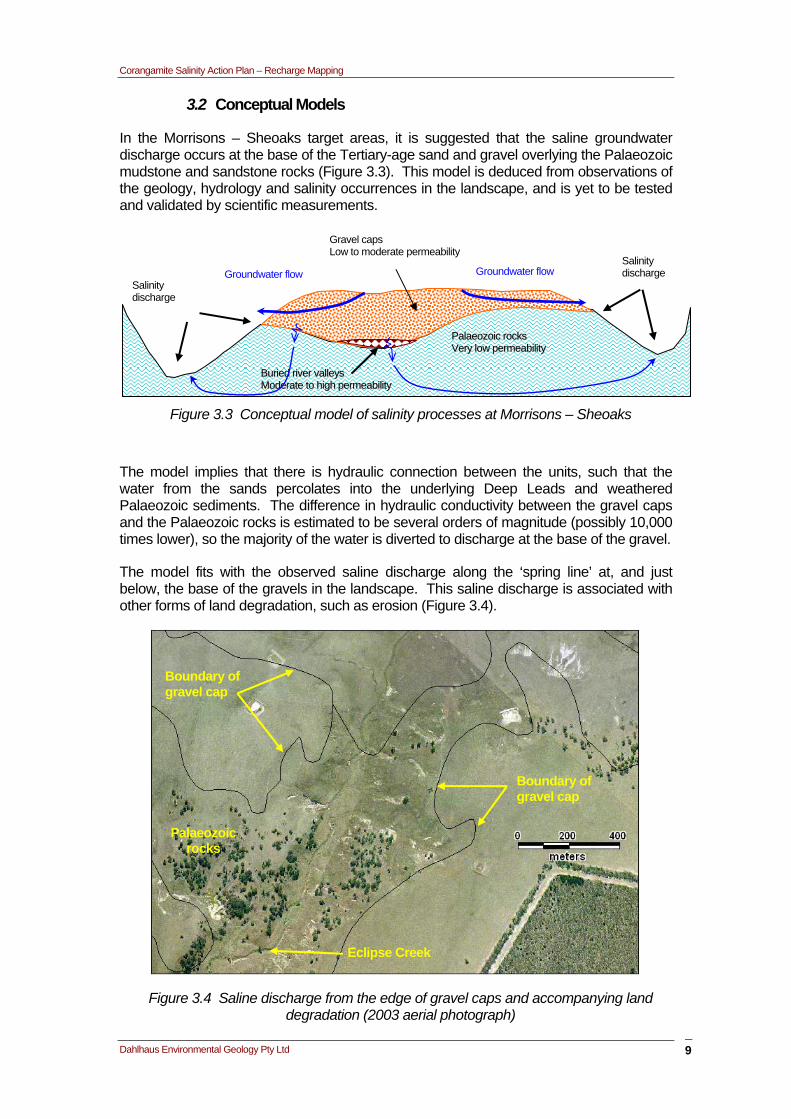
In the Morrisons – Sheoaks target areas, it is suggested that the saline groundwater discharge occurs at the base of the Tertiary-age sand and gravel overlying the Palaeozoic mudstone and sandstone rocks (Figure 3.3). This model is deduced from observations of the geology, hydrology and salinity occurrences in the landscape, and is yet to be tested and validated by scientific measurements.
PPaallaaeeoozzooiicc rroocckkss VVeerryy llooww ppeerrmmeeaabbiilliittyy
BBuurriieedd rriivveerr vvaalllleeyyss MMooddeerraattee ttoo hhiigghh ppeerrmmeeaabbiilliittyy
Gravel caps Low to moderate permeability
Groundwater flow Salinity discharge
Salinity discharge
Groundwater flow
Figure 3.3 Conceptual model of salinity processes at Morrisons – Sheoaks
The model implies that there is hydraulic connection between the units, such that the water from the sands percolates into the underlying Deep Leads and weathered Palaeozoic sediments. The difference in hydraulic conductivity between the gravel caps and the Palaeozoic rocks is estimated to be several orders of magnitude (possibly 10,000 times lower), so the majority of the water is diverted to discharge at the base of the gravel.
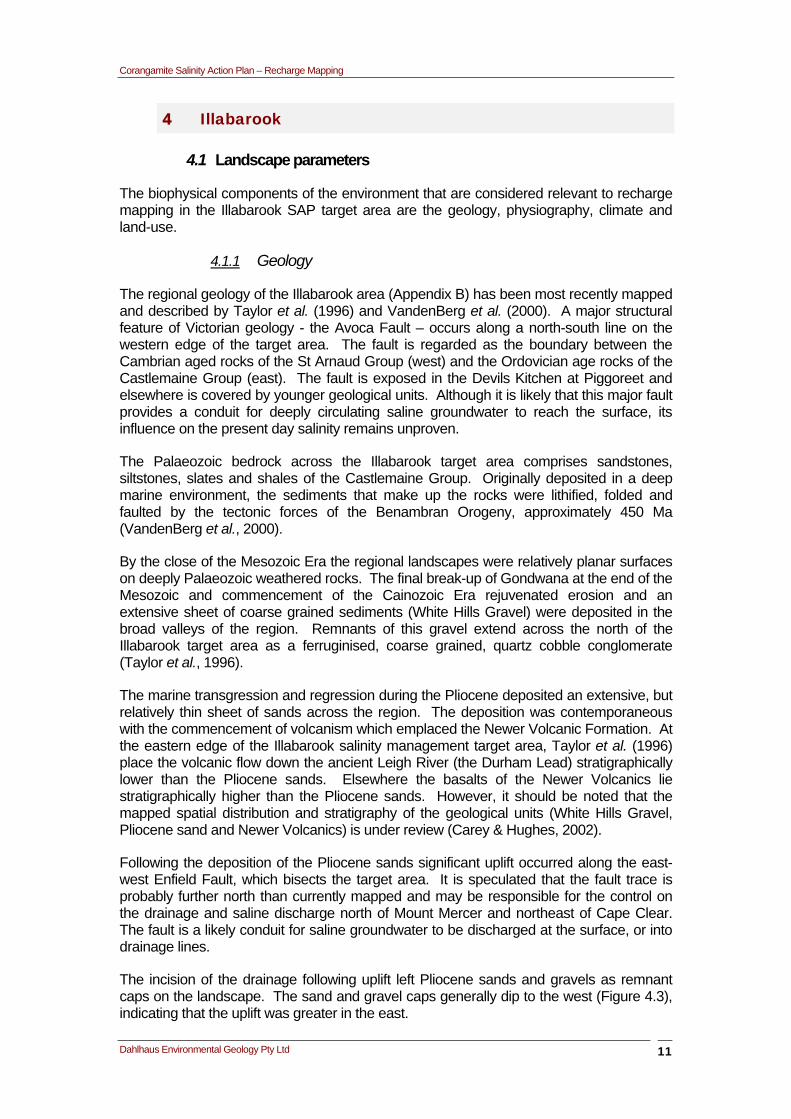
The model fits with the observed saline discharge along the ‘spring line’ at, and just below, the base of the gravels in the landscape. This saline discharge is associated with other forms of land degradation, such as erosion (Figure 3.4).
Eclipse Creek
Boundary of gravel cap
Palaeozoic rocks
Boundary of gravel cap
Figure 3.4 Saline discharge from the edge of gravel caps and accompanying land degradation (2003 aerial photograph)
9

Corangamite Salinity Action Plan – Recharge Mapping
Dahlhaus Environmental Geology Pty Ltd 10
3.3 Recharge mapping
Twenty-five categories have been delineated on the recharge map (Figure 3.5, in pocket at rear of report). The categories have been principally delineated using the conceptual model of the hydrogeology and salinity process (Figure 3.3) and the mapped geology, buffered to include the hydrogeological influence around the boundaries of the units. Land degradation and land-use, as determined from aerial photos, were also important decision parameters. The logic in setting priorities is tabulated below (Table 3.2)
Area Decision data Comment
1. Saline discharge PIRVic salinity mapping + buffer Areas requiring discharge management to reduce salt export.
2. Degraded areas Conceptual hydrogeology, obviously disturbed areas in the 2003 air photography
Ground disturbance creates high recharge and erosion.
3 & 4. High priority, few trees
Conceptual hydrogeology, geology + buffer, evidence of degradation and saline discharge in 2003 air photo, few trees
Tree planting brings multiple benefits, recharge control, and erosion control.
5 – 8. Higher priority landscapes
Conceptual hydrogeology, geology + buffer, few trees on 2003 air photo. Priority recharge control areas.
9. Lower priority volcanic landscapes
Conceptual hydrogeology, geology + buffer, few trees in 2003 air photos.
Considered a contributor to recharge and saline discharge.
10 – 14. Partly treed landscapes
Conceptual hydrogeology, geology + buffer, partly treed in 2003 air photos.
General recharge areas but already partly treed.
15 – 21. Generally treed landscapes
Conceptual hydrogeology, geology + buffer, generally treed in 2003 air photos.
General recharge areas already covered with trees, or volcanic landscapes considered important in the discharge model, which already have some trees.
22 – 24. Landscapes outside of the target area
Conceptual hydrogeology, geology + buffer.
Outside of salinity target area to protect Moorabool River water quality.
25. Volcanic landscapes outside of target area.
Conceptual hydrogeology, geology + buffer.
Outside of salinity target area to protect Moorabool River water quality, or inside target area boundary, but considered not to contribute to the salinity problem.
26. Township areas 2003 aerial photos, VicMap data. Urban management
Table 3.2 Decision making logic in Morrisons-Sheoaks recharge mapping
The primary intent of the salinity management works in the Morrisons - Sheoaks target area is to stabilise or reverse the trend of increasing salinity in the Moorabool River. The priority areas are:
1. Saline discharge areas
The management of saline discharge aimed at reducing or preventing salt wash-off.
2. Degraded areas
Sites where mining or quarrying have occurred provide pathways for rapid recharge. Rehabilitation is aimed at restoring recharge rates to pre-degradation values.
3. High priority landscapes with few trees
Saline discharge occurs at the boundaries and erosion is evident. Re-vegetation is aimed at restoring pre-clearing recharge rates and stabilising erosion.
4. Higher priority landscapes
Re-vegetation is required to restore pre-clearing recharge rates.
Corangamite Salinity Action Plan – Recharge Mapping
Dahlhaus Environmental Geology Pty Ltd 11
4 Illabarook
4.1 Landscape parameters
The biophysical components of the environment that are considered relevant to recharge mapping in the Illabarook SAP target area are the geology, physiography, climate and land-use.
4.1.1 Geology
The regional geology of the Illabarook area (Appendix B) has been most recently mapped and described by Taylor et al. (1996) and VandenBerg et al. (2000). A major structural feature of Victorian geology - the Avoca Fault – occurs along a north-south line on the western edge of the target area. The fault is regarded as the boundary between the Cambrian aged rocks of the St Arnaud Group (west) and the Ordovician age rocks of the Castlemaine Group (east). The fault is exposed in the Devils Kitchen at Piggoreet and elsewhere is covered by younger geological units. Although it is likely that this major fault provides a conduit for deeply circulating saline groundwater to reach the surface, its influence on the present day salinity remains unproven.
The Palaeozoic bedrock across the Illabarook target area comprises sandstones, siltstones, slates and shales of the Castlemaine Group. Originally deposited in a deep marine environment, the sediments that make up the rocks were lithified, folded and faulted by the tectonic forces of the Benambran Orogeny, approximately 450 Ma (VandenBerg et al., 2000).
By the close of the Mesozoic Era the regional landscapes were relatively planar surfaces on deeply Palaeozoic weathered rocks. The final break-up of Gondwana at the end of the Mesozoic and commencement of the Cainozoic Era rejuvenated erosion and an extensive sheet of coarse grained sediments (White Hills Gravel) were deposited in the broad valleys of the region. Remnants of this gravel extend across the north of the Illabarook target area as a ferruginised, coarse grained, quartz cobble conglomerate (Taylor et al., 1996).
The marine transgression and regression during the Pliocene deposited an extensive, but relatively thin sheet of sands across the region. The deposition was contemporaneous with the commencement of volcanism which emplaced the Newer Volcanic Formation. At the eastern edge of the Illabarook salinity management target area, Taylor et al. (1996) place the volcanic flow down the ancient Leigh River (the Durham Lead) stratigraphically lower than the Pliocene sands. Elsewhere the basalts of the Newer Volcanics lie stratigraphically higher than the Pliocene sands. However, it should be noted that the mapped spatial distribution and stratigraphy of the geological units (White Hills Gravel, Pliocene sand and Newer Volcanics) is under review (Carey & Hughes, 2002).
Following the deposition of the Pliocene sands significant uplift occurred along the east-west Enfield Fault, which bisects the target area. It is speculated that the fault trace is probably further north than currently mapped and may be responsible for the control on the drainage and saline discharge north of Mount Mercer and northeast of Cape Clear. The fault is a likely conduit for saline groundwater to be discharged at the surface, or into drainage lines.
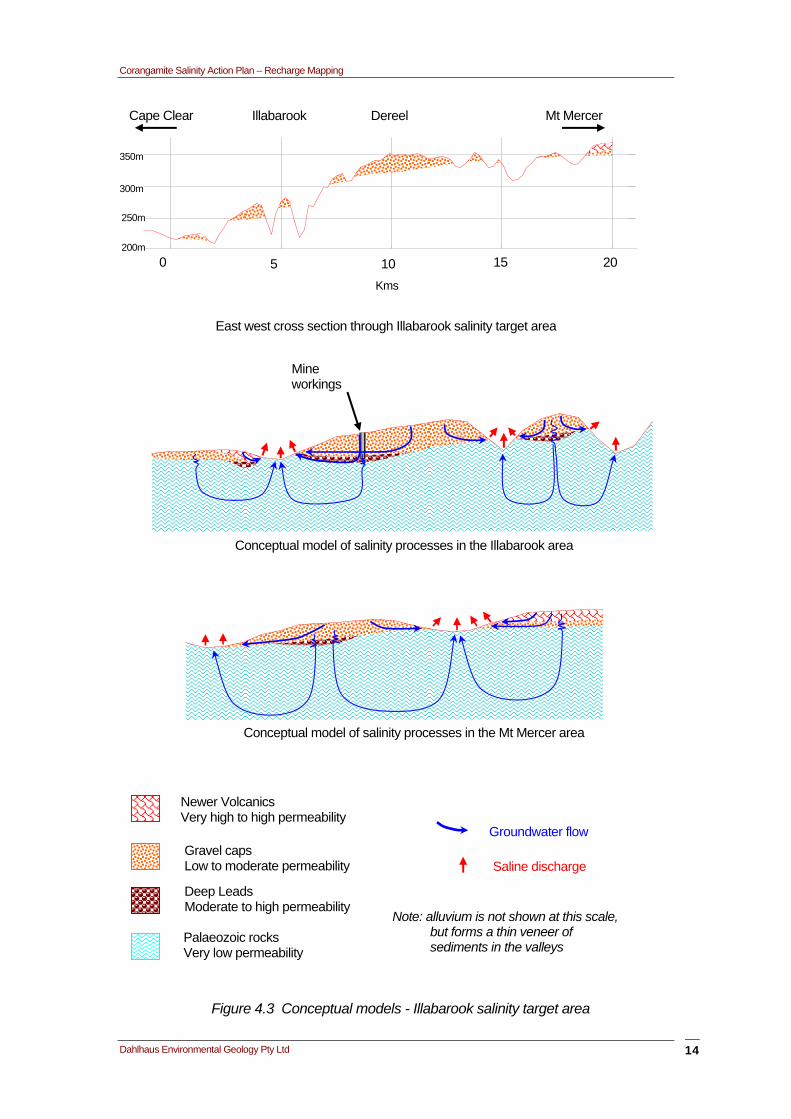
The incision of the drainage following uplift left Pliocene sands and gravels as remnant caps on the landscape. The sand and gravel caps generally dip to the west (Figure 4.3), indicating that the uplift was greater in the east.

Corangamite Salinity Action Plan – Recharge Mapping
Dahlhaus Environmental Geology Pty Ltd
4.1.2 Climate
The relevant climate statistics for the Illabarook salinity target area are tabulated below. The statistics are based on the modelled climate surfaces as indicated in Table 4.1 and the spatial distribution for some parameters are illustrated in Appendix B.
Parameter Maximum Minimum Model Source Average Annual Rainfall 735 mm 561 mm Average Annual Rain Days 169 days 163 days Average Annual Pan Evaporation 1167 mm 1062 mm
ANUCLIM Dahlhaus, 2002
Average Annual Aerial Actual Evapotranspiration 594 mm 573 mm
Average Annual Aerial Potential Evapotranspiration 1039 mm 1016 mm
Average Annual Point Potential Evapotranspiration 1314 mm 1256 mm
BoM / ANU BoM, 2002
Table 4.1 Relevant climate statistics for the Illabarook salinity target area
4.1.3 Terrain
The terrain of the Illabarook salinity management target area is generally planar to gently undulating, and sloping to the south (Figure 4.1). The plain has been dissected by the drainage, creating some steeper valleys along Illabarook Creek, Moonlight Creek, Mount Misery Creek, Corindhap Creek, Pinchgut Creek and Kuruc-a-ruc Creek. The drainage pattern is generally dendritic in the east, tending to rectilinear in the west. The elevation varies from 425 metres AHD along the northern edge, to 185 metres AHD in the valley of Mount Misery Creek at the southern edge.
Figure 4.1 Terrain model of the Illabarook salinity management target area
4.1.4 Land-use history
The occupation of the land by squatters during the early pastoral settlement period (1838 – 1851) marks the commencement of widespread land-use change. The clearing of native vegetation accelerated significantly when gold was discovered at Buninyong and Ballarat in 1851. The mining soon spread to all parts of the salinity target area, viz: Grenville, Mount Mercer, Dereel, Corindhap, Rokewood, Berringa, Illabarook, Rokewood Junction and Cape Clear. By 1887 timber was in short supply for mining and most areas close to the mining centres had been cleared (Langtree, 1887).
12
Corangamite Salinity Action Plan – Recharge Mapping
Dahlhaus Environmental Geology Pty Ltd
The earliest mining exploited the coarse gold in shallow alluvial deposits along the creeks and drainage lines. This was soon followed by deeper mining of the alluvium along buried ancestral drainage lines, contemporaneous with reef mining in open cut and underground mines. The DPI VicMine database records 798 mine locations within the boundaries of the Illabarook salinity target area (Appendix B). It is estimated that many hundreds more existed in the area, especially as shallow alluvial workings in the earliest years of the gold mining era.
The majority of the mining had ceased by the first decade of the 20th century, although a short-lived revival occurred during the economic depression in the 1930s. Following the mining, the general land-use returned to grazing and mixed farming.
4.1.5 Current land-use
Grazing and mixed farming remain the dominant land-use in the area. Forestry is increasing, particularly in the Dereel region. Smaller hectare rural living properties (sometimes termed “hobby farms” or “lifestyle properties”) have also increased markedly over the past three decades.
4.2 Conceptual models
In the Illabarook target area, three salinity processes are recognised, viz: saline discharge at the base of the Pliocene sand and gravel overlying the Palaeozoic mudstone and sandstone rocks, saline discharge at the boundary of the Newer Volcanics and the underlying sands or shales, and saline discharge as baseflow into the drainage lines in the Palaeozoic rocks. These models are deduced from observations of the geology, hydrology and salinity occurrences in the landscape, and are yet to be tested and validated by scientific measurements.
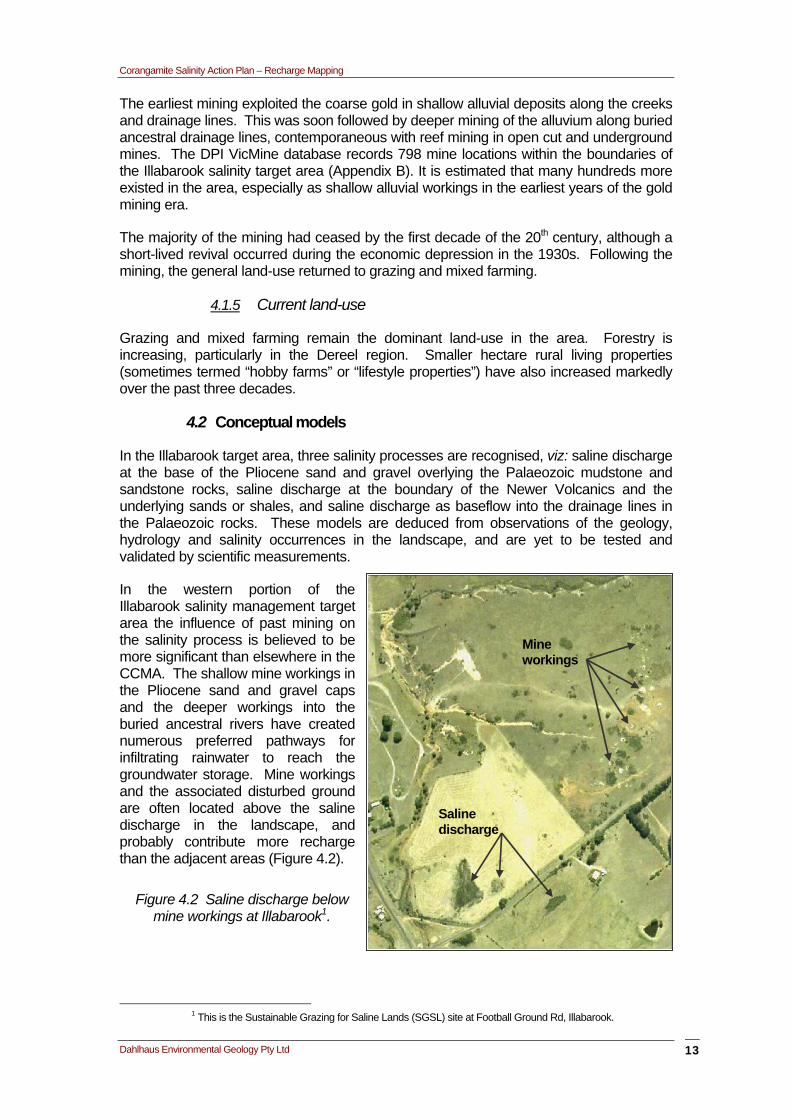
In the western portion of the Illabarook salinity management target area the influence of past mining on the salinity process is believed to be more significant than elsewhere in the CCMA. The shallow mine workings in the Pliocene sand and gravel caps and the deeper workings into the buried ancestral rivers have created numerous preferred pathways for infiltrating rainwater to reach the groundwater storage. Mine workings and the associated disturbed ground are often located above the saline discharge in the landscape, and probably contribute more recharge than the adjacent areas (Figure 4.2).
Mine workings
Saline discharge
Figure 4.2 Saline discharge below mine workings at Illabarook1.
1 This is the Sustainable Grazing for Saline Lands (SGSL) site at Football Ground Rd, Illabarook.
13
Corangamite Salinity Action Plan – Recharge Mapping
Dahlhaus Environmental Geology Pty Ltd 14
Figure 4.3 Conceptual models - Illabarook salinity target area
250m
300m
350m
20 10 5 0 200m
Cape Clear Mt Mercer Illabarook Dereel
15
Kms
East west cross section through Illabarook salinity target area
Mine workings
Conceptual model of salinity processes in the Illabarook area
Conceptual model of salinity processes in the Mt Mercer area
Newer Volcanics Very high to high permeability
Groundwater flow Gravel caps Low to moderate permeability Saline discharge
Deep Leads Moderate to high permeability
Note: alluvium is not shown at this sbut forms a thin veneer of sediments in the valleys
cale, Palaeozoic rocks Very low permeability
Corangamite Salinity Action Plan – Recharge Mapping
Dahlhaus Environmental Geology Pty Ltd 15
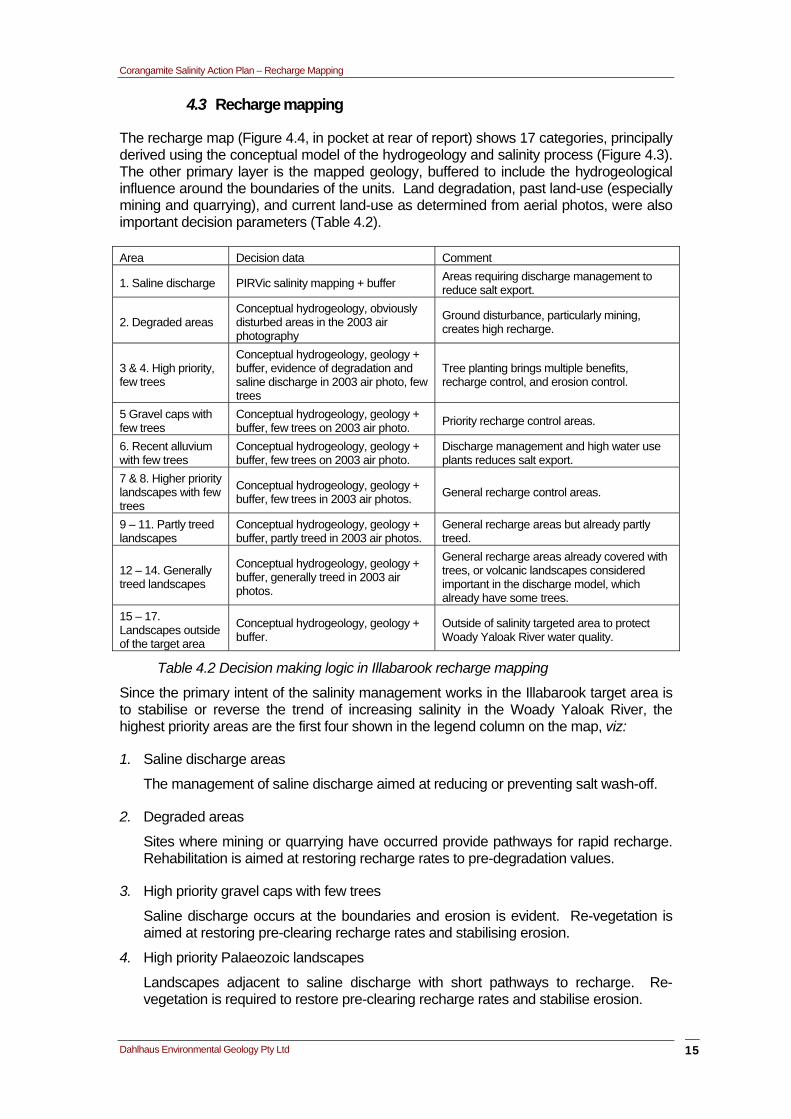
4.3 Recharge mapping
The recharge map (Figure 4.4, in pocket at rear of report) shows 17 categories, principally derived using the conceptual model of the hydrogeology and salinity process (Figure 4.3). The other primary layer is the mapped geology, buffered to include the hydrogeological influence around the boundaries of the units. Land degradation, past land-use (especially mining and quarrying), and current land-use as determined from aerial photos, were also important decision parameters (Table 4.2).
Area Decision data Comment
1. Saline discharge PIRVic salinity mapping + buffer Areas requiring discharge management to reduce salt export.
2. Degraded areas Conceptual hydrogeology, obviously disturbed areas in the 2003 air photography
Ground disturbance, particularly mining, creates high recharge.
3 & 4. High priority, few trees
Conceptual hydrogeology, geology + buffer, evidence of degradation and saline discharge in 2003 air photo, few trees
Tree planting brings multiple benefits, recharge control, and erosion control.
5 Gravel caps with few trees
Conceptual hydrogeology, geology + buffer, few trees on 2003 air photo. Priority recharge control areas.
6. Recent alluvium with few trees
Conceptual hydrogeology, geology + buffer, few trees on 2003 air photo.
Discharge management and high water use plants reduces salt export.
7 & 8. Higher priority landscapes with few trees
Conceptual hydrogeology, geology + buffer, few trees in 2003 air photos. General recharge control areas.
9 – 11. Partly treed landscapes
Conceptual hydrogeology, geology + buffer, partly treed in 2003 air photos.
General recharge areas but already partly treed.
12 – 14. Generally treed landscapes
Conceptual hydrogeology, geology + buffer, generally treed in 2003 air photos.
General recharge areas already covered with trees, or volcanic landscapes considered important in the discharge model, which already have some trees.
15 – 17. Landscapes outside of the target area
Conceptual hydrogeology, geology + buffer.
Outside of salinity targeted area to protect Woady Yaloak River water quality.
Table 4.2 Decision making logic in Illabarook recharge mapping
Since the primary intent of the salinity management works in the Illabarook target area is to stabilise or reverse the trend of increasing salinity in the Woady Yaloak River, the highest priority areas are the first four shown in the legend column on the map, viz:
1. Saline discharge areas
The management of saline discharge aimed at reducing or preventing salt wash-off.
2. Degraded areas
Sites where mining or quarrying have occurred provide pathways for rapid recharge. Rehabilitation is aimed at restoring recharge rates to pre-degradation values.
3. High priority gravel caps with few trees
Saline discharge occurs at the boundaries and erosion is evident. Re-vegetation is aimed at restoring pre-clearing recharge rates and stabilising erosion.
4. High priority Palaeozoic landscapes
Landscapes adjacent to saline discharge with short pathways to recharge. Re-vegetation is required to restore pre-clearing recharge rates and stabilise erosion.
Corangamite Salinity Action Plan – Recharge Mapping
Dahlhaus Environmental Geology Pty Ltd 16
5 Pittong
There is a substantial body of previous salinity investigation work for the Pittong salinity target area. The salinity in the Pittong target area has been recognised as a problem from the early 1950’s (Cope 1958) and has been the subject of research and investigation by a number of Universities and research organisations for at least the past three decades (eg. Duff 1983, MacEwan & Dahlhaus 1996, Heislers & Pillai 2000). In addition, a database of information on the geology and regolith of the area has been amassed during five decades of exploration for kaolin clay.
5.1.1 Geology
The basement rocks of the Pittong salinity target area are the Cambrian age sedimentary rocks of the St Arnaud Group, largely quartz-rich sandstones (arenites) and shales. Tectonic activity during the Silurian Period folded and faulted the rocks, metamorphosing the shales into phyllite and quartz-mica schists, and emplacing quartz veins (some mineralised).
Three granite bodies were emplaced during the Devonian Period (GSV, 2003):
• Tiac Granite, a coarse-grained equigranular biotite granite, in the north west of the target area
• Mount Bute Granite, a coarse-grained to medium-grained hornblende biotite granite (adamellite), which underlies the northern part of the salinity target area, and
• Illoura Granodiorite, a coarse-grained hornblende biotite granodiorite and porphyritic biotite granite, which underlies the southern portion of the salinity target area.
The emplacement of the igneous rocks caused contact metamorphism of the surrounding St Arnaud Group rocks, resulting in an aureole of hornfels, approximately one kilometre wide around the rim of the granites.
A lengthy period of erosion followed the intrusion of the granites, resulting in the removal of at least two kilometres of crustal rocks to expose the granites at the surface (Taylor, et al., 1996). The uplift associated with the Gondwana break-up at the end of the Mesozoic Era and start of the Cainozoic Era rejuvenated erosion resulting in the widespread deposition of the White Hills Gravels. The ferruginous quartz sandstone and consolidated gravel is distributed in a wide arc across the northern portion of the Pittong target area, and is best seen in the road cutting opposite the kaolin clay mine.
Deep weathering of the granites occurred during the late Palaeogene and early Neogene Periods as a result of the wet climatic conditions. The very thick regolith of sandy kaolin clay is now commercially exploited by Imerys Minerals Australia Pty Ltd. Higher in the landscape the regolith developed on the granite is largely made up of grus, which has been exploited for road-making sand by the local Shire. The erosion-resistant hornfels of the aureole now form the highest points in the landscape, creating a shallow amphitheatre which forms the surface water basin of the Naringal Creek.
Volcanism during the late Neogene and Quaternary Periods resulted in the emplacement of basalts in the southern portion of the area, which form the northern fringe of the Victorian Volcanic Plains. Quaternary colluvium, alluvium and paludal deposits form the most recent sediments. The geology of the target area is illustrated in Appendix C.

Corangamite Salinity Action Plan – Recharge Mapping
Dahlhaus Environmental Geology Pty Ltd
5.1.2 Climate
The relevant climate statistics for the Pittong salinity target area are tabulated below. The statistics are based on the modelled climate surfaces as indicated in Table 5.1 and the spatial distributions for some parameters are illustrated in Appendix C.
Parameter Maximum Minimum Model Source Average Annual Rainfall 755 mm 604 mm Average Annual Rain Days 166 days 160 days Average Annual Pan Evaporation 1156 mm 1069 mm
ANUCLIM Dahlhaus, 2002
Average Annual Aerial Actual Evapotranspiration 589 mm 580 mm
Average Annual Aerial Potential Evapotranspiration 1045 mm 1038 mm
Average Annual Point Potential Evapotranspiration 1330 mm 1318 mm
BoM / ANU BoM, 2002
Table 5.1 Relevant climate statistics for the Pittong salinity target area
5.1.3 Terrain
The Pittong salinity management target area forms a broad amphitheatre bisected by a central low ridge (Figure 5.1). The drainage sub-catchment forms the head waters of the Naringhill Creek, with the main trunk extending along the eastern side of the central ridge. The northern boundary coincides with the Corangamite CMA boundary, being the watershed between the Woady Yaloak River (Corangamite Basin) and the Mount Emu Creek (Hopkins Basin). Elevations vary from 470 metres to 253 metres AHD.
Figure 5.1 Terrain model of the Pittong salinity management target area.
5.1.4 Land-use history
The pre-1750 vegetation of the Pittong salinity target area is thought to be dominantly Granitic Grassy Woodland (EVC 175_62), Grassy Dry Forest (EVC 22), and Heathy Dry Forest (EVC 20), with Riparian Woodland (EVC 641) dominant along the broad drainage lines. Along the northern and southern fringe, Plains Grassy Woodland and Plains Grassland (EVC 897) covered the volcanic landscapes (DSE, 2004; Appendix C).
17

Corangamite Salinity Action Plan – Recharge Mapping
Dahlhaus Environmental Geology Pty Ltd
Clearing of the native vegetation probably commenced with the early pastoral settlement in 1840, but would have accelerated rapidly during the last half of the nineteenth century to supply the timber demand from the nearby gold fields such as Linton, Happy Valley, Pitfield, Cape Clear and Scarsdale.
Kaolin was discovered at the time of the gold mining and was regarded as a commercial resource by the early twentieth century (Baragwanath, 1918). Exploitation of the resource was sporadic until the later half of the twentieth century when mining commenced at the present location and a processing plant was established.
5.1.5 Current land-use
The current land-use is largely mixed farming, comprising wool growing, cropping, meat production and forestry. Over the past decade, the Woady Yaloak Catchment Group has been at the forefront of land rehabilitation and catchment management, and has been awarded National acclaim.
5.2 Conceptual models
In the Pittong SAP target area, there have been a number of conceptual models for the salinity processes suggested by previous workers. Kevin (1993) suggested that most groundwater flow occurs in the saprolite along the top of the fresh granite. Dahlhaus and MacEwan (1997) published a conceptual model for the salinity processes at the research site on Knight’s property, which attributed the salinity to soil-water interflow spreading saline discharge issuing from low volume springs in the granite (Figure 5.2). Their model was based on the research by graduate students at the University of Ballarat, especially that by Conn (1994). Heislers & Pillai (2000) suggested that saline groundwater discharge resulted from both the combination of emerging lateral flow from the saprolite and the soil-water interflow; and upward flows from the fractured granite and transitional zone (along the weathering front) flows.
Figure 5.2 Conceptual model of salinity processes at Knight’s property
The concept of saline discharge from point sources in the granite at the base of the regolith fits the observations made by the landholders that ‘patches’ of salinity occur in apparent random positions the landscape (Figure 5.3). These ‘patches’ continue to appear, despite the current run of years of below average rainfall and falling groundwater
18

Corangamite Salinity Action Plan – Recharge Mapping
Dahlhaus Environmental Geology Pty Ltd
levels. At the State salinity monitoring site on R. Kennedy’s property, the area of land salinised has increased 8% over the period from 1996 to 2000, despite below average rainfall and falling groundwater levels (Clark & Hekmeijer, 2004).
Figure 5.3 Saline discharge which has emerged in the past few years.
Saline discharge appears near the very top of the catchment (within a couple of hundred metres horizontal distance and less than 15 metres vertical distance), and coincides with the geological boundary of the granite pluton mapped using the kaolin exploration drilling (Kaolin Australia, unpublished data). This suggests that the majority of the recharge is sourced from the area outside the catchment, along the general direction of regional groundwater flow (Bradley et al. 1994). The groundwater flow is impeded by the granite which results in upward movement along the rock boundary to the surface.
5.3 Recharge mapping
Twelve categories have been delineated on the recharge map (Figure 5.4, in pocket at rear of report). The categories have been principally delineated using the conceptual model of the hydrogeology and salinity process (Figure 5.2), the mapped geology, and interpretation of geophysical images (Appendix C). Past and current land-uses, as determined from aerial photos, were also decision parameters. The logic in setting priorities is tabulated overpage (Table 5.2).
Since stabilising or reversing the trend of increasing salinity in the Woady Yaloak River is the primary intent of the salinity management works in the Pittong target area, the highest priority areas are the first two shown in the legend column on the map, viz:
1. Saline discharge areas
The management of saline discharge aimed at reducing or preventing salt wash-off.
2. Establishing soil-water interception belts in the higher priority areas.
The tree belts are aimed at intercepting the temporal soil water flows which move downslope as throughflow or interflow and interact with the saline discharge points. The belts need to be planted along contours and spaced at intervals which will be effective in intercepting the majority of the upslope infiltration not used by the pasture. An alternative could be the installation of interceptor drains along contours, which drain to a holding dam higher in the slope.
19

Corangamite Salinity Action Plan – Recharge Mapping
Dahlhaus Environmental Geology Pty Ltd 20
Area Decision data Comment
1. Saline discharge Salinity mapping from various sources (PIRVic, WYCG, SMB, UoB, DEG)
Areas requiring discharge management to reduce salt export.
2. High priority, few trees
Conceptual hydrogeology, interpretation of geophysics, geology, evidence of saline discharge, local knowledge, few trees
Tree belts or drains along contours should reduce the saline area by intercepting throughflow. Higher degree of confidence in the model.
3. Medium priority, few trees
Conceptual hydrogeology, interpretation of geophysics, geology, evidence of saline discharge, local knowledge, few trees
Tree belts or drains along contours could reduce the saline area by intercepting throughflow. Medium degree of confidence in the model.
4. Lower priority, few trees
Conceptual hydrogeology, interpretation of geophysics, geology, evidence of saline discharge, local knowledge, few trees
Tree belts or drains along contours may reduce the saline area by intercepting throughflow. Lower degree of confidence in the model.
5 – 9 Areas with some of many trees
As for 2, 3 & 4 above, but with some or many trees in 2003 air photos.
As for 2, 3 & 4 above, but some or many trees are already established
10. Degraded areas Obviously disturbed areas in the 2003 air photography
Ground disturbance, particularly sand quarrying, may be higher recharge
11. Former swamp Conceptual hydrogeology, local knowledge, geology.
Accumulated salt from ephemeral saline waterlogging and evaporation will be exported during wet periods. Retain the salt on site (by vegetation) or improve the current drainage to prevent salt accumulation. An alternative option is to restore the swamp/wetland.
12. Sandier soils Conceptual hydrogeology, interpretation of geophysics.
Sandier soils may allow higher recharge adjacent to the saline areas, increasing the area of low-level salinity and lost production.
Table 5.2 Decision making logic in the Pittong recharge mapping

Corangamite Salinity Action Plan – Recharge Mapping
Dahlhaus Environmental Geology Pty Ltd 21
6 Discussion and conclusions
Morrisons-Sheoaks, Illabarook and Pittong have been nominated as salinity target areas in the second-generation SAP due to rising salinity trends in the Moorabool River and Woady Yaloak River (CCMA, 2003). All three areas have some responsive groundwater systems (local systems) where recharge control should assist in stabilising or reversing the trends.
The Morrisons-Sheoaks and Illabarook salinity target areas have similar conceptual models for salinity processes, based on the geology, terrain, environmental histories and observed saline discharge. In both areas the priority targets for recharge management are the local groundwater systems of the Highlands gravel caps. Extensive mining of the gravels during the mid to late nineteenth century has left the legacy of a landscape cleared of native vegetation, with a disturbed regolith and pathways for rapid recharge, and saline discharge accompanied by erosion. The higher priority recharge control areas are those where replanting and rehabilitation can provide multiple benefits, such as reducing salinity, erosion, pest animals and pest plants, and improving water quality.
Discharge management to reduce salt wash-off remains the highest priority in the immediate term, as this can provide the greatest gain in the shortest time frame. However, the preliminary scenario modelling shows that both recharge and discharge management are required to reduce the discharge volume.
The scenario models for the Morrisons-Sheoaks target area clearly indicate that while recharge and discharge management will have an effect, they are not sufficient to stabilise or reverse the trend (Dahlhaus, 2004). The rising trend of approximately 18µS/cm/yr in the lower Moorabool River may be slowed by approximately 1.5 µS/cm/yr over 30 yrs for every 500 Ha of recharge control. Clearly, more aggressive intervention (engineering?) will be required meet the goal of the National Action Plain (NAP) for salinity and water quality, that is: to stabilise or reverse the trend.
In the Illabarook and Pittong target areas, the combination of both recharge and discharge management has a greater chance of meeting the NAP goal. The rising salinity trend in the Woady Yaloak River is less challenging than the Moorabool River and the scenario modelling is more optimistic of achieving the goal. However the trend of increasing area of land salinisation in the Pittong target area, particularly when groundwater levels are declining, presents a paradox. Investigation of site-specific (paddock-scale) recharge and discharge management is currently underway in the Pittong target area to address this issue.

Corangamite Salinity Action Plan – Recharge Mapping
Dahlhaus Environmental Geology Pty Ltd 22
References
BARAGWANATH W. 1918. Report on clays in the vicinity of Ballarat Geological Survey of Victoria Unpublished Report 1918/72, Department of Mines, Victoria, 6p.
BOLGER P.F. 1978. Explanatory notes on the Meredith and You Yangs 1:50,000 geological maps Geological Survey of Victoria Report 54, Department of Mines and Energy, Melbourne, Victoria.
BOM, 2000 Climate Data: Australia Data extracted from the Australian Data Archive for Meteorology in June 2000 (on CD), Bureau of Meteorology
BOM 2002. Evapotranspiration Data: Mean Monthly and Mean Annual (on CD). Bureau of Meteorology, National Climate Centre, Melbourne Victoria.
BRADLEY, J., STANLEY, D. R., MANN, B. S., CHAPLIN, F., and FOLEY, G., 1994 Ballarat Hydrogeological Map, 1:250,000. Murray Basin Hydrogeological Map Series, Australian Geological Survey Organisation, Canberra, ACT.
BRIDE T.F. 1898. Letters from Victorian Pioneers New edition 1969 Ed., William Heinemann Limited, Melbourne, Victoria.
BROUWER J. & FITZPATRICK R.W. 2002. Interpretation of morphological features in a salt-affected duplex soil toposequence with an altered soil water regime in western Victoria. Australian Journal of Soil Research, 40/6, 903-926.
CAREY S.P. & HUGHES M.J. 2002. Regolith of the West Victorian Uplands, Victoria, Australia Victoria Undercover, Benalla 2002: Collaborative Geoscience in Northern Victoria. Conference Proceedings and Field Guide. CSIRO Publishing, pp.147-154
CCMA 2003. Corangamite Salinity Action Plan 2003 - Regional Draft Salinity Action Plan Technical Report 2, Corangamite Catchment Management Authority, 55p.
CLARK R.M. & HEKMEIJER P. 2004. Victorian Salinity Monitoring: reassessment of six reference discharge monitoring sites in the Corangamite region Centre for Land Protection research report 43, Primary industries Research, Victoria, 70p.
CONN A. 1994. Drainage options for waterlogging and salinity control in granitic soils at Pittong. Graduate Diploma Land Rehabilitation, major project, University of Ballarat (unpubl.) 56p.
COPE F. 1958. Catchment Salting in Victoria. Soil Conservation Authority of Victoria.
DAHLHAUS P.G. 2002. Atlas of GIS data: Corangamite Catchment Management Authority, unpublished report prepared for Corangamite CMA, Colac, Victoria.
DAHLHAUS P.G. 2003. Salinity Target areas: assessment, trends, resource condition targets and management options. Corangamite Salinity Action Plan Background Report 3, Corangamite Catchment Management Authority, 70p.
DAHLHAUS P.G. 2004. Characterising groundwater flow systems for salinity management in the Corangamite Region, Australia (extended abstract T1-30 on CD), Groundwater Flow Understanding from Local to Regional Scales, Proceedings of the XXXIII Congress IAH & 7th Congress ALHSUD, Zacatecas, Mexico 2004.

Corangamite Salinity Action Plan – Recharge Mapping
Dahlhaus Environmental Geology Pty Ltd 23
DAHLHAUS P.G. & MACEWAN R J 1997. Dryland salinity in south west Victoria: challenging the myth in: Collected Case Studies in Engineering Geology, Hydrogeology and Environmental Geology, (McNally G.H., eds) Third Series Ed., Environmental, Engineering and Hydrogeology Specialist Group of Geological Society of Australia, Sydney, pp.165-180
DAHLHAUS P.G., MACEWAN R.J., NATHAN E.L., & MORAND V.J. 2000. Salinity on the southeastern Dundas Tableland, Victoria. Australian Journal of Earth Sciences, 47, pp.3-11
DSE 2004 Ecological Vegetation Classes (EVC) Benchmarks by Bioregion. http://www.dse.vic.gov.au/dse/nrence.nsf/Home+Page/DSE+Conservation%7EHome+Page?open Department of Sustainability and Environment, Victoria
DUFF J.S. 1983. Soil salting in the Lake Corangamite region of south western Victoria. M.Ag.Sci. University of Melbourne (unpubl.) 178p.
DUNN E.J. 1888. Geological progress report No.1 on the Parish of Meredith Reports of the Mining Registrars Quarter ended 31st March, 1888
DUNN E.J. 1888. Geological progress report No.2 - Parish of Meredith Reports of the Mining Registrars Quarter ended 31st March, 1888
DUNN E.J. 1888. Geological progress report - Parish of Bungeeltap Reports of the Mining Registrars Quarter ending 30th June, 1888
DUNN E.J. 1891. Report on prospecting operations at Morrison's Diggings Reports and Statistics of the Mining Department Quarter ended 30th June 1891
FERGUSON W.H. 1914. A volcanic neck, near Meredith Records of the Geological Survey of Victoria, 3, pp.251-252
GSV 2003. Ballarat Geoscientific Data CD. Geological Survey of Victoria, June 2003. Department of Primary Industries, Melbourne (2 CD set).
HEISLERS D.S. & PILLAI M. 2000. A Review of Hot Spots, Treatment Options and Targets in the Corangamite Salinity Region. Centre for Land Protection Research Technical Report 61, Department of Natural Resources and Environment, 74p.
KEVIN P. 1993. Groundwater and salinity processes in the Corangamite Salinity Control Region. Corangamite Salinity Strategy Background Report 3, Department of Conservation and Natural Resources; Centre for Land Protection Research.,
LANGTREE C.W. 1887. Timber Supply for the Goldfields. Reports of the Mining Registrars, Quarter ended 30th June, 1887.
MACEWAN R.J. & DAHLHAUS P.G. 1996. Hydrology, pedology and dryland salinity in the granitic landscape of the upper Woady Yaloak Catchment: Implications for management. 2, Soil Science - Raising the Profile. Proceedings of the Australian and New Zealand Soil Science Societies National Conference, 1-4 July, 1996, The University of Melbourne pp.155-156
MACLEAN A.C. & GRIBBLE C.D. 1985. Geology for Civil Engineers. 2nd edition. George Allan & Unwin, London.

Corangamite Salinity Action Plan – Recharge Mapping
Dahlhaus Environmental Geology Pty Ltd 24
PETHERAM C., WALKER G., GRAYSON R., THIERFELDER T. & ZHANG L. 2002. Towards a framework for predicting impacts of land-use on recharge: 1. A review of recharge studies in Australia. Australian Journal of Soil Research, 40/3, 397-417.
SKENE, A., 1860 PROV (Public Record Office of Victoria), VPRS (Victorian Public Record Series) 44, Unit 507 File 917 Report, District Surveyor A. Skene.
TAYLOR D.H., WHITEHEAD M.L., OLSHINA A., & LEONARD J.G. 1996. Ballarat 1:100 000 map Geological report. Geological Survey Report 101, Energy and Minerals Victoria, 99p.
VANDENBERG A.H.M., WILLMAN C.E., MAHER S., SIMONS B.A., CAYLEY R.A., TAYLOR D.H., MORAND V.J., MOORE D.H., & RADOJKOVIC A. 2000. The Tasman Fold Belt System in Victoria., Geological Survey of Victoria, East Melbourne, 462p.
WILLIAMS B., WALKER J., & TANE H. 2001. Drier Landscapes and Rising Watertables Natural Resource Management, 4, pp.10-15
Corangamite Salinity Action Plan – Recharge Mapping
Dahlhaus Environmental Geology Pty Ltd 25
Appendix A Morrisons-Sheoaks data
On CD in pocket at rear of this report.
Maps (Bitmap images of 1:75,000 scale maps, A3 paper size)
• Geology
• Boreholes
• Rainfall
• Pan evaporation
• Geomorphic units
• Soil landform units
• Terrain
• Terrain aspect
• Terrain slope
• Topographic basemap
• Ecological vegetation classes circa.1750
• Ecological vegetation classes circa.2004
• Public land and tree cover
Maps (Bitmap images of 1:125,000 scale maps, A4 paper size)
• Mapped salinity
• Total magnetic intensity
• Magnetic first derivative (gradient)
• Radiometric ternary ratio (potassium/thorium/uranium)
• Radiometric total count
• Radiometric potassium
• Radiometric thorium
• Radiometric uranium
• Groundwater flow systems
• Land systems
Unit code descriptions (in portable document format [*.pdf] files)
• Geomorphic units
• Groundwater flow systems
• Land systems
• Land units
• Vegetation EVCs

Corangamite Salinity Action Plan – Recharge Mapping
Dahlhaus Environmental Geology Pty Ltd 26
Appendix B Illabarook data
On CD in pocket at rear of this report.
Maps (Bitmap images of 1:75,000 scale maps, A3 paper size)
• Geology
• Boreholes
• Rainfall
• Pan evaporation
• Geomorphic units
• Soil landform units
• Terrain
• Terrain aspect
• Terrain slope
• Topographic basemap
• Ecological vegetation classes circa.1750
• Ecological vegetation classes circa.2004
• Public land and tree cover
Maps (Bitmap images of 1:125,000 scale maps, A4 paper size)
• Mapped salinity
• Total magnetic intensity
• Magnetic first derivative (gradient)
• Radiometric ternary ratio (potassium/thorium/uranium)
• Radiometric total count
• Radiometric potassium
• Radiometric thorium
• Radiometric uranium
• Groundwater flow systems
• Land systems
Unit code descriptions (in portable document format [*.pdf] files)
• Geomorphic units
• Groundwater flow systems
• Land systems
• Land units
• Vegetation EVCs

Corangamite Salinity Action Plan – Recharge Mapping
Dahlhaus Environmental Geology Pty Ltd 27
Appendix C Pittong data
On CD in pocket at rear of this report.
Maps (Bitmap images of 1:75,000 scale maps, A4 paper size)
• Mapped salinity
• Geology
• Geophysical interpretation
• Total magnetic intensity
• Magnetic first derivative (gradient)
• Radiometric ternary ratio (potassium/thorium/uranium)
• Radiometric total count
• Radiometric potassium
• Radiometric thorium
• Radiometric uranium
• Groundwater flow systems
• Boreholes
• Rainfall
• Pan evaporation
• Geomorphic units (with susceptibility to erosion, waterlogging, etc.)
• Soil landform units
• Land systems
• Terrain
• Terrain aspect
• Terrain slope
• Topographic basemap
• Ecological vegetation classes circa.1750
• Ecological vegetation classes circa.2004
• Public land and tree cover
Unit code descriptions (in portable document format [*.pdf] files)
• Geomorphic units
• Groundwater flow systems
• Land systems
• Land units
• Vegetation EVCs


