CORDS: Automatic Discovery of Correlations and Soft Functional Dependencies Ihab F. Ilyas 1 Volker Markl 2 Peter Haas 2 Paul Brown 2 Ashraf Aboulnaga 2 1 Purdue University 2 IBM Almaden Research Center 250 N. University Street 650 Harry Road, K55/B1 West Lafayette, Indiana, 47906 San Jose, CA, 95139 [email protected]marklv,phaas,pbrown1,[email protected]ABSTRACT The rich dependency structure found in the columns of real-world relational databases can be exploited to great advantage, but can also cause query optimizers—which usually assume that columns are statistically independent—to underestimate the selectivities of conjunctive predicates by orders of magnitude. We introduce cords, an efficient and scalable tool for automatic discovery of correlations and soft functional dependencies between columns. cords searches for column pairs that might have interesting and useful dependency relations by systematically enumerating can- didate pairs and simultaneously pruning unpromising candidates using a flexible set of heuristics. A robust chi-squared analysis is applied to a sample of column values in order to identify correla- tions, and the number of distinct values in the sampled columns is analyzed to detect soft functional dependencies. cords can be used as a data mining tool, producing dependency graphs that are of intrinsic interest. We focus primarily on the use of cords in query optimization. Specifically, cords recommends groups of columns on which to maintain certain simple joint statistics. These “column-group” statistics are then used by the optimizer to avoid naive selectivity estimates based on inappropriate inde- pendence assumptions. This approach, because of its simplicity and judicious use of sampling, is relatively easy to implement in existing commercial systems, has very low overhead, and scales well to the large numbers of columns and large table sizes found in real-world databases. Experiments with a prototype implementa- tion show that the use of cords in query optimization can speed up query execution times by an order of magnitude. cords can be used in tandem with query feedback systems such as the leo learning optimizer, leveraging the infrastructure of such systems to correct bad selectivity estimates and ameliorating the poor performance of feedback systems during slow learning phases. 1. INTRODUCTION When a query optimizer in a commercial relational dbms chooses a horrible query plan, the cause of the disaster is usually an inappropriate independence assumption that the optimizer has imposed on two or more columns. Indepen- Permission to make digital or hard copies of all or part of this work for personal or classroom use is granted without fee provided that copies are not made or distributed for profit or commercial advantage and that copies bear this notice and the full citation on the first page. To copy otherwise, or republish, to post on servers or to redistribute to lists, requires prior specific permission and/or a fee. SIGMOD 2004, June 13–18, 2004, Paris, France. Copyright 2004 ACM 1-58113-859-8/04/06...$5.00. dence assumptions are used in virtually all query optimizers because they greatly simplify selectivity estimation: e.g., if p1 and p2 are predicates on respective columns C1 and C2, then the selectivity of the conjunctive predicate p1 ∧ p2 is estimated by simply multiplying together the individual se- lectivities of p1 and p2. This approach, however, ignores the rich dependency structure that is present in most real-world data. Indeed, our experience indicates that dependency be- tween columns is the rule, rather than the exception, in the real world. This paper introduces cords (CORrelation Detection via Sampling), an efficient and scalable tool for automatically discovering statistical correlations and “soft” functional de- pendencies (fds) between columns. By “correlations,” we mean general statistical dependencies, not merely approxi- mate linear relationships as measured, for example, by the Pearson correlation coefficient [7, p. 265]. By a soft fd be- tween columns C1 and C2, we mean a generalization of the classical notion of a “hard” fd in which the value of C1 com- pletely determines the value of C2. In a soft fd (denoted by C1 ⇒ C2), the value of C1 determines the value of C2 not with certainty, but merely with high probability. An example of a hard fd is given by Country and Continent; the former completely determines the latter. On the other hand, for cars, Make is determined by Model via a soft depen- dency: given that Model = 323, we know that Make = Mazda with high probability, but there is also a small chance that Make = BMW. cords both builds upon and significantly modifies the technology of the b-hunt system as described in [12]. As with b-hunt, cords searches for column pairs that might have interesting and useful correlations by systematically enumerating candidate pairs and simultaneously pruning unpromising candidates using a flexible set of heuristics. Also as with b-hunt, cords analyses a sample of rows in order to ensure scalability to very large tables. The sim- ilarities end here, however. Whereas b-hunt uses “bump hunting” techniques to discover soft algebraic relationships between numerical attributes, cords employs a robust chi- squared analysis to identify correlations between both nu- merical and categorical attributes, and an analysis of the number of distinct values in the sampled columns to detect soft fds. The sample size required for the chi-squared anal- ysis is essentially independent of the database size, so that the algorithm is highly scalable. cords can serve as a data mining tool, e.g., its output can be converted to a dependency graph as in Figure 6.
Transcript
CORDS: Automatic Discovery of Correlationsand Soft Functional Dependencies
Ihab F. Ilyas1 Volker Markl2 Peter Haas2 Paul Brown2 Ashraf Aboulnaga2
1 Purdue University 2 IBM Almaden Research Center250 N. University Street 650 Harry Road, K55/B1
ABSTRACTThe rich dependency structure found in the columns of real-world
relational databases can be exploited to great advantage, but can
also cause query optimizers—which usually assume that columns
are statistically independent—to underestimate the selectivities
of conjunctive predicates by orders of magnitude. We introduce
cords, an efficient and scalable tool for automatic discovery of
correlations and soft functional dependencies between columns.
cords searches for column pairs that might have interesting and
useful dependency relations by systematically enumerating can-
didate pairs and simultaneously pruning unpromising candidates
using a flexible set of heuristics. A robust chi-squared analysis is
applied to a sample of column values in order to identify correla-
tions, and the number of distinct values in the sampled columns
is analyzed to detect soft functional dependencies. cords can be
used as a data mining tool, producing dependency graphs that
are of intrinsic interest. We focus primarily on the use of cords
in query optimization. Specifically, cords recommends groups
of columns on which to maintain certain simple joint statistics.
These “column-group” statistics are then used by the optimizer
to avoid naive selectivity estimates based on inappropriate inde-
pendence assumptions. This approach, because of its simplicity
and judicious use of sampling, is relatively easy to implement in
existing commercial systems, has very low overhead, and scales
well to the large numbers of columns and large table sizes found in
real-world databases. Experiments with a prototype implementa-
tion show that the use of cords in query optimization can speed
up query execution times by an order of magnitude. cords can
be used in tandem with query feedback systems such as the leo
learning optimizer, leveraging the infrastructure of such systems
to correct bad selectivity estimates and ameliorating the poor
performance of feedback systems during slow learning phases.
1. INTRODUCTIONWhen a query optimizer in a commercial relational dbms
chooses a horrible query plan, the cause of the disaster isusually an inappropriate independence assumption that theoptimizer has imposed on two or more columns. Indepen-
Permission to make digital or hard copies of all or part of this work forpersonal or classroom use is granted without fee provided that copies arenot made or distributed for profit or commercial advantage and that copiesbear this notice and the full citation on the first page. To copy otherwise, orrepublish, to post on servers or to redistribute to lists, requires prior specificpermission and/or a fee.SIGMOD 2004, June 13–18, 2004, Paris, France.Copyright 2004 ACM 1-58113-859-8/04/06...$5.00.
dence assumptions are used in virtually all query optimizersbecause they greatly simplify selectivity estimation: e.g., ifp1 and p2 are predicates on respective columns C1 and C2,then the selectivity of the conjunctive predicate p1 ∧ p2 isestimated by simply multiplying together the individual se-lectivities of p1 and p2. This approach, however, ignores therich dependency structure that is present in most real-worlddata. Indeed, our experience indicates that dependency be-tween columns is the rule, rather than the exception, in thereal world.
This paper introduces cords (CORrelation Detection viaSampling), an efficient and scalable tool for automaticallydiscovering statistical correlations and “soft” functional de-pendencies (fds) between columns. By “correlations,” wemean general statistical dependencies, not merely approxi-mate linear relationships as measured, for example, by thePearson correlation coefficient [7, p. 265]. By a soft fd be-tween columns C1 and C2, we mean a generalization of theclassical notion of a “hard” fd in which the value of C1 com-pletely determines the value of C2. In a soft fd (denotedby C1 ⇒ C2), the value of C1 determines the value of C2
not with certainty, but merely with high probability. Anexample of a hard fd is given by Country and Continent;the former completely determines the latter. On the otherhand, for cars, Make is determined by Model via a soft depen-dency: given that Model = 323, we know that Make = Mazda
with high probability, but there is also a small chance thatMake = BMW.
cords both builds upon and significantly modifies thetechnology of the b-hunt system as described in [12]. Aswith b-hunt, cords searches for column pairs that mighthave interesting and useful correlations by systematicallyenumerating candidate pairs and simultaneously pruningunpromising candidates using a flexible set of heuristics.Also as with b-hunt, cords analyses a sample of rows inorder to ensure scalability to very large tables. The sim-ilarities end here, however. Whereas b-hunt uses “bumphunting” techniques to discover soft algebraic relationshipsbetween numerical attributes, cords employs a robust chi-squared analysis to identify correlations between both nu-merical and categorical attributes, and an analysis of thenumber of distinct values in the sampled columns to detectsoft fds. The sample size required for the chi-squared anal-ysis is essentially independent of the database size, so thatthe algorithm is highly scalable.
cords can serve as a data mining tool, e.g., its outputcan be converted to a dependency graph as in Figure 6.
Such graphs are of intrinsic interest. Our primary focus,however, is on the application of cords in query optimiza-tion. Our proposed scheme uses the output of cords torecommend groups of columns on which to maintain cer-tain simple joint statistics, such as the number of distinctcombinations of values in the columns. An optimizer canthen use such “column-group” (cg) statistics to avoid in-accurate selectivity estimates caused by naive independenceassumptions. cords can be used in conjunction with a queryfeedback system, leveraging the infrastructure of such a sys-tem to correct bad selectivity estimates and ameliorating thepoor performance of feedback systems during slow learningphases.
cords currently considers only pairs of columns, and nottriples, quadruples, and so forth. This restriction vastly re-duces the complexity of the algorithm, and our experiments(see Section 5.3) indicate that most of the benefit in queryperformance is obtained by maintaining the cg statisticsof order 2. The cords approach, because of its simplicity,restriction to column pairs, and judicious use of sampling,is relatively easy to implement in existing commercial sys-tems, has very low overhead, and scales well to the largenumbers of columns and large table sizes found in real-worlddatabases.
The rest of the paper is organized as follows. Section 2gives an overview of recent technology for relaxing the in-dependence assumption in query optimization, and relatesthe results in the current paper to this body of work. Sec-tion 3 describes the cords detection algorithm in detail,including generation of candidate column pairs, pruning ofunpromising candidates, sampling-based chi-squared analy-sis of correlation, and discovery of soft fds. In Section 4,we discuss our simple but effective method for using theoutput of cords to improve an optimizer’s selectivity esti-mates and hence its choice of query plans. Section 5 containsan experimental evaluation of cords in which we validatethe correlation detection algorithm using a database withknown correlations. We also explore the effect of varyingthe sampling rate and of using higher-order cg statistics,and demonstrate the speedup in query execution times thatcan result from the use of cords. In Section 6 we describe anapplication of cords to several real-world and benchmarkdatabases. Section 7 contains our conclusions and recom-mendations for future work.
2. RELATED WORKRecent years have witnessed a large body of work aimed at
relaxing the independence assumption in selectivity estima-tion. As in [12], we can distinguish between “data driven”and “query driven” approaches to detecting and exploitingdependencies among database columns.
2.1 Query-Driven ApproachesSome query-driven approaches focus on information con-
tained in a query workload, i.e., a list of relevant queries. Forexample, Bruno and Chaudhuri [4] use the query workloadtogether with optimizer estimates of query execution timesto determine a beneficial set of “sits” to retain. sits arestatistics (typically multidimensional histograms) on queryexpressions that can be used to avoid large selectivity esti-mation errors due to independence assumptions.
Alternatively, a query feedback system (qfs) uses feedbackfrom query execution to increase optimizer accuracy. leo,
the DB2 learning optimizer [20], is a typical example of aqfs. leo compares the actual selectivities of query resultswith the optimizer’s estimated selectivities. In this way, leo
can detect errors caused by faulty independence assumptionsand create adjustment factors which can be applied in thefuture to improve the optimizer’s selectivity estimates.
In [1, 5], query feedback is used to incrementally build amultidimensional histogram that can be used to estimate theselectivity of conjunctive predicates. The algorithms in [1, 5]do not discover correlation between columns, however: theset of columns over which to build the histogram must bespecified a priori.
The sash algorithm [14] decomposes the set of columnsin a table into disjoint clusters. Columns within a clus-ter are considered correlated and a multidimensional his-togram is maintained for these columns. Columns in differ-ent clusters are treated as independent. In other words, sash
approximates the full joint distribution of the columns bymaintaining detailed histograms on certain low-dimensionalmarginals in accordance with a high-level statistical inter-action model—namely, a Markov network model—and thencomputing joint frequencies as a product of the marginals.sash uses query feedback together with a steepest-descentmethod to incrementally adjust both the structure of thehigh-level model and the frequency counts in the varioushistogram buckets.
The advantage of query-driven approaches is that theyare efficient, scale well, and result in immediate performancegains, since they focus their efforts on columns that appearin actual queries. The disadvantage is that the system canproduce poor estimates—and hence choose poor plans—if ithas not yet received enough feedback, either during the ini-tial start-up period or after a sudden change in the workload.Indeed, during one of these slow learning phases the opti-mizer is likely to avoid query plans with accurate feedback-based cost estimates in favor of more expensive plans thatappear to be cheap due to cost estimates based on limitedreal data and faulty independence assumptions.
2.2 Data-Driven ApproachesData-driven methods analyze the base data to discover
correlations between database columns, usually without con-sidering the query workload. These methods can comple-ment the query-driven approaches by identifying correla-tions between columns that have not yet been referencedin the workload. By proactively gathering information, adata-driven method can mitigate the poor performance of aquery-driven method during a slow learning phase.
Most data-driven methods use discovered correlations toconstruct and maintain a synopsis (lossy compressed repre-sentation) of the joint distribution of all the attributes. Insome methods, the synopsis takes the form of a graphicalstatistical model. Getoor, et al. [10], for example, use prob-abilistic relational models—which extend Bayesian networkmodels to the relational setting—for selectivity estimation.Deshpande, et al. [8] provide a technique that, similarlyto sash, combines a Markov network model with a set oflow-dimensional histograms. In [8], however, the synopsisis constructed based on a full scan of the base data ratherthan from query feedback. Both of the foregoing techniquessearch through the space of possible models and evaluatethem according to a scoring function. Because the num-ber of possible models is exponential in the number of at-
tributes,1 efficient search techniques and pruning heuristicsare essential ingredients of these approaches.
The method of Cheng, et al. [6] typifies a slightly dif-ferent approach to constructing a synopsis (specifically, aBayesian network model) from the base data. Instead ofsearching through a space of possible models as in [8, 10],the method assesses the dependency between pairs of col-umns by using conditional independence tests based on a“mutual information” measure. The method requires thatall attributes be discrete and that there be no missing datavalues. The method also requires processing of the entiredataset and has a complexity of O(K4) with respect to K,the number of attributes.
As discussed in [12] and references therein, there has alsobeen a great deal of work related to mining of hard fdsand related dependencies. The focus has been on obtainingexact or almost-exact results, and so the amount of workrequired by these algorithms is much greater than in oursetting, where probabilistic results suffice.
Another related body of work concerns the mining of as-sociation rules and semantic integrity constraints; see, forexample, [18, 19]. These dependencies, however, involve re-lationships between a few specific values of a pair of at-tributes, rather than an overall relationship between theattributes themselves. For example, an association mightassert that 10% of married people between age 50 and 60have at least 2 cars. This rule concerns specific values of theMartialStatus, Age, and NumberOfCars attributes.
2.3 Relation of CORDS to Previous WorkIn terms of the above taxonomy, cords is fundamentally
a data-driven method, taking as input the base data as wellas certain database catalog statistics that are maintainedin virtually every commercial database system. We note,however, that cords can also exploit workload informationto limit the search space of possible column pairs; indeed,cords can also exploit schema constraints or semantics pro-vided by users. The cords approach is well-suited to inte-gration with a qfs such as leo, and can potentially be usedto initialize a more elaborate data-driven algorithm, suchas that in [8]. Unlike some of the schemes discussed above,cords can handle either numerical or categorical data.
Because cords merely identifies correlated columns in-stead of producing detailed approximations to the joint at-tribute frequency distribution, the method’s overhead typ-ically is much lower than that of the more elaborate tech-niques in [6, 8, 10]. The use of sampling in cords further re-duces its overhead relative to other methods, so that cords
is well-suited to real-world databases having thousands oftables and hundreds of columns per table. cords can alsodeal relatively well with data that is continually changing,since rechecking column pairs for correlation is much lessexpensive than updating a synopsis. Implementing cords
and integrating cords with existing commercial optimizersis also much easier than for the more elaborate schemes.The downside is that the optimizer tends to exploit the de-pendency information provided by cords in a much coarsermanner than would be the case with a joint-distributionsynopsis—as discussed in Section 4.1, the leo optimizer inessence replaces a rather crude selectivity estimate by a less-
1E.g., even though Deshpande, et al. limit their search to “decom-
posable” models, it can be shown that the number of such models
corresponding to five attributes is 1,233.
crude one. On the other hand, our experiments indicate thateven this simple approach can yield dramatic improvementsin worst-case query performance.
cords may not detect column pairs in which only cer-tain subsets of the rows are correlated. Such detailed rela-tionships are more effectively detected via query feedback.cords is designed to quickly obtain a global picture of thedata relationships, which can then be refined by a qfs.
3. DISCOVERING DEPENDENCIESIn this section, we describe how cords discovers corre-
lations and soft fds. As in the b-hunt algorithm in [12],the first step is to generate candidate column pairs that po-tentially have interesting and useful dependencies. For eachcandidate, the actual dependencies, if any, are detected us-ing both catalog statistics and sampled values from the col-umns.
3.1 Generating CandidatesSimilarly to [12], we define a candidate as a triple
(a1, a2, P ), where ai (i = 1, 2) is an attribute (column) of theform R.c, such as EMPLOYEES.ID or ACCOUNTS.Balance. Thequantity P is a “pairing rule” that specifies which particu-lar a1 values get paired with which particular a2 values toform the set of pairs of potentially correlated values. Whenthe columns lie in the same table R and each a1 value ispaired with the a2 value in the same row, the pairing ruleis then trivial and we denote it by the symbol ∅R. cords
also allows columns a1 and a2 to lie in different tables, sayR and S, where R and S might plausibly be joined duringquery processing. A pairing rule P in this case is simply atwo-table join predicate between R and S.2
cords proceeds similarly to b-hunt, first generating allcandidates having a trivial pairing rule. cords then finds allnontrivial pairing rules that “look like” a key-to-foreign-keyjoin predicate, since such join predicates are likely to occurin query workloads. Each nontrivial pairing rule P connectsa pair of tables R and S, and cords generates all candidatesof the form (R.a, S.b, P ). To find the nontrivial pairing rules,cords first identifies the set K comprising columns that areeither declared primary or unique keys, together with eachcolumn a not of these two types such that
#distinctValues(a)
#rows(a)≥ 1 − ǫ.
(Here ǫ is a parameter of the algorithm.) For each columna ∈ K, cords examines every other column in the schemato find potential matches. A column b is considered a matchfor column a if either (1) column a is a declared primary keyand column b is a declared foreign key for the primary key,or (2) every data value in a sample from column b has amatching value in column a.3 The sample used to check thecondition in (2) need not be large; in our implementationthe sample size was set at a few hundred rows.
The number of potential candidates is typically quitelarge for a complex schema with a large number of col-umns. Therefore cords, like b-hunt, applies a flexible setof heuristic pruning rules to reduce the search space. Someuseful types of pruning rules are as follows.2We allow tables R and S to coincide, so that P can be a self-join
predicate.3As in [12], this procedure can be extended to handle certain com-
pound keys.
• Type Constraints: Prune candidate columns whosedata type does not belong to a specified set, for ex-ample, columns whose data are not either integers orstrings of less than 100 characters.
• Statistical Constraints: Prune tables and columns thatdo not have specified statistical properties, for exam-ple, columns having a small number of distinct valuesor tables having too few rows. See [12] for furtherdiscussion.
• Pairing Constraints: Prune candidates whose pairingrules fail to meet specified criteria. For example, onlyallow pairing rules that correspond to explicitly de-clared primary-key-to-foreign-key relationships. Thisconstraint would rule out a semantically meaninglessjoin condition such as CAR.ID = OWNER.ID on rela-tions CAR(ID, OwnerID, . . .) and OWNER(ID, . . . ).
• Workload Constraints: Prune candidate columns thatdo not appear at least once in an equality predicate ina query workload. These and similar constraints candramatically reduce the size of the search space.
The experiments in Section 5 indicate that even if noneof these pruning rules are applied, so that the search spaceconsists of all possible column pairs, the overhead incurredby cords may still be acceptable in many cases.
3.2 Sampling-Based Testing for CorrelationEach candidate (a1, a2, P ) generated by cords corre-
sponds to a set—call it Ω—containing N (> 1) column-valuepairs of the form (x1, x2), where the domain of xi comprisesdi distinct values (i = 1, 2). In this section, we describehow cords detects the presence of correlation between thecolumns based on a random sample of pairs from Ω.4 Ourkey observation is that the sample size required for a speci-fied degree of accuracy is essentially independent of the sizeof the database, so that the correlation-detection algorithmis highly scalable. We provide a closed-form approximateexpression for the required sample size.
Suppose initially that d1 and d2 are not too large, andwithout loss of generality suppose that the ith domain isDi = 1, 2, . . . , di ; we assume throughout that the do-main is known, e.g., from the system catalog. Also supposeinitially that the sample used for correlation detection isa simple random sample drawn with replacement from Ω;because the sampling rate is typically very low, the with-replacement sampling assumption has a negligible effect onour analysis.
There are many different measures of association betweentwo attributes: see [11] for some classical statistical mea-sures of association and [3, 17] for some general familiesof association measures that include Chernov, Kolmogorov,and Kullback-Leibler distances. We measure association us-ing the mean-square contingency [7, p.282]:
φ2 =1
d − 1
d1∑
i=1
d2∑
j=1
(πij − πi·π·j)2
πi·π·j.
4When the pairing rule P is trivial, this sample is obtained by sam-
pling from the table that contains the two columns. Otherwise, cords
samples from the table containing the “foreign-key” column in the
key-to-foreign-key join condition specified by P and then, for each
sampled row, finds the unique matching row in the table containing
the key column.
Here d = min(d1, d2) and, for each i ∈ D1 and j ∈ D2, thequantity πij is the fraction of the N (x1, x2)-pairs for whichx1 = i and x2 = j, and the quantities πi· and π·j denotemarginal totals: πi· =
∑
j πij and π·j =∑
i πij . We use thismeasure because it is convenient and has been well studied;our basic techniques can be adapted to other measures ofassociation. As shown in [7], 0 ≤ φ2 ≤ 1. The case φ2 = 0corresponds to complete factorizability of the joint frequencydistribution: πij = πi·π·j for all i and j. If the factorizabilitycondition holds and we sample a column-value pair (X1, X2)at random from Ω, then X1 is statistically independent of X2
in that P X1 = i and X2 = j = P X1 = i P X2 = j for all i ∈ D1 and j ∈ D2. With a slight (and standard)abuse of terminology, we therefore often use the term “inde-pendence” instead of “factorizability” when describing therelationship between such attributes. The case φ2 = 1 cor-responds to a hard fd.5
In real-world datasets—or even synthetic datasets wherecolumn values are generated “independently” using pseudo-random number generators—the measure φ2 will never beexactly equal to 0, so we consider the attributes indepen-dent if φ2 ≤ ǫ for some small ǫ > 0. One plausible wayof choosing a value of ǫ is to consider a hypothetical setof N data pairs such that the data is generated accordingto a random mechanism under which the two componentsare truly statistically independent, and then to choose ǫ sothat φ2 exceeds ǫ with a probability that is small, say, lessthan 0.01. It is well known that under our model the quan-tity (d−1)Nφ2 has approximately a chi-squared distributionwith ν = (d1−1)(d2−1) degrees of freedom; see, e.g., [7, 16].Denoting the cumulative distribution function (cdf) of sucha random variable by Gν and the inverse of this function byG−1
ν , we have ǫ = G−1
ν (0.99)/(
N(d − 1))
. The quantity ǫis typically very small; e.g., for d = 20 we have ǫ ≈ 20/N ,where N typically exceeds 106.
To test for correlation, i.e., to test whether φ2 > ǫ, wetake a random sample of n pairs from Ω and consider φ2,the sample estimate of φ2. This estimate is defined as φ2 =χ2/
(
n(d − 1))
, where
χ2 =
d1∑
i=1
d2∑
j=1
(nij − ni·n·j)2
ni·n·j, (1)
nij is the number of pairs (x1, x2) in the sample for whichx1 = i and x2 = j, and ni· and n·j are the correspondingmarginal totals. Our test rejects the hypothesis that theattributes are independent if φ2 > u, where u is a speci-fied constant; equivalently, our test criterion is of the formχ2 > t. We choose t so that the worst-case probability of in-correctly rejecting the independence hypothesis is smallerthan a prespecified value p. By “worst-case,” we meanthe scenario in which the independence hypothesis “barelyholds” in that φ2 = ǫ. When φ2 = ǫ, the test statisticχ2 has approximately a noncentral chi-squared distributionwith ν degrees of freedom and noncentrality parameter equalto n(d − 1)ǫ; see, e.g., [16].6 Because ǫ is very small, we
5The mean-square contingency is not well suited to direct testing for
fds, however, because the value of φ2 does not determine which of the
attributes depends on the other. Moreover, as discussed in the sequel,
we often bucketize the data, in which case φ2 is typically strictly less
than 1 even in the presence of a hard fd.6In general, a noncentral chi-squared distribution with ν degrees of
freedom and noncentrality parameter λ is characterized as the distri-
can approximate the distribution of χ2 by an ordinary chi-squared distribution with ν degrees of freedom. Thus we sett = G−1
ν (1 − p).Note that our procedure is equivalent to computing the
quantity p∗ = 1 − Gν(χ2) and rejecting the independencehypothesis if p∗ is less than a cutoff value p. The quantityp∗, which is called the p-value of the test, is the probabil-ity of seeing a value of χ2 as large as (or larger than) thevalue actually observed, assuming that the attributes aretruly independent. Thus the smaller the p-value, the morelikely that the columns are correlated. The cutoff value p isthe maximum allowable probability of incorrectly assertingcorrelation in the presence of independence.
To determine the sample size n, we fix a small constantδ > ǫ and take enough samples so that, whenever φ2 ≥ δ,the test will correctly reject the independence hypothesiswith probability at least 1 − p. That is, we choose n suchthat Gν,λ(t) = p. Here Gν,λ denotes the cdf of a noncen-tral chi-squared distribution with ν degrees of freedom andnoncentrality parameter λ, with λ depending on n via therelation λ = n(d−1)δ. Observe that, as asserted earlier, thesample size is essentially independent of the database sizeN . For the case δ = 0.005, Figure 1 displays the requiredsample size n as a function of p and of the domain sizesd1 and d2. It can be seen that the sample size is relativelyinsensitive to the values of these parameters. The followingapproximation can be used to determine n from p, d1, andd2:
n ≈[
−16 ν log(
p√
2π)]
1/2 − 8 log(
p√
2π)
1.69 δ(d − 1)ν−0.071. (2)
Here ν = (d1 − 1)(d2 − 1) and d = min(d1, d2) as before.This approximation is accurate to within roughly 2% for10−6 ≤ p ≤ 10−3 and 361 ≤ ν ≤ 2401, and to within roughly5% for 10−6 ≤ p ≤ 10−2 and 81 ≤ ν ≤ 2401. We obtainthe approximation by using the fact [16] that a noncentralchi-squared random variable can be viewed as the sum of ν
bution of the sum of ν independent squared normal random variables,
the ith normal random variable having mean µi and variance 1. Here
λ = µ2
1+ · · · + µ2
ν.
i.i.d. squared normal random variables. Thus
Gν,λ(x) ≈ Φ
(
x − (ν + λ)√2ν + 4λ
)
,
when ν is large, where Φ denotes the cdf of a standardnormal random variable. We then use a standard normaltail estimate [9, p. 175] to approximate Φ−1. Finally, weapply a small empirical correction factor of ν0.071/1.69.
The foregoing discussion suggests that a sample of severalthousand rows should yield acceptable results, regardless ofthe database size. In Section 5.2 we empirically evaluate theeffect of sample size on accuracy and execution time.
There are a couple of important issues that must be ad-dressed when applying the foregoing chi-squared analysis inpractice. One potential problem occurs whenever many ofthe nij ’s are equal to 0 because the corresponding πij ’s arenonzero but very small; in this case the chi-squared test,whose derivation assumes a large sample, tends to be unre-liable. Indeed, one rule of thumb asserts that chi-squaredresults cannot be trusted unless at least 80% of nij ’s exceed5. The nij ’s can be too small if either of the domains D1 orD2 is very large. cords deals with this situation by decom-posing each large domain into a relatively small number ofdisjoint categories. The data is then bucketized accordingly,so that d1 and d2 now represent the number of categories forthe two columns, and nij is now interpreted as the numberof pairs (x1, x2) such that x1 (resp., x2) belongs to cate-gory i (resp., j). To help ensure that each nij is sufficientlylarge, cords examines the frequent-value statistics found inmost database system catalogs. Specifically, cords checkswhether the frequent values of a column account for most ofthe data, so that the data distribution is noticeably skewed.If so, cords uses these frequent values as the column cate-gories (see Section 3.3 for details). Otherwise, cords buck-etizes the data by hashing, in effect creating categories bydividing the domain into equal size subsets. cords also usesthe bucketization approach to deal with real-valued data; inthis case the categories correspond to disjoint subintervalsof the real line.
Another issue concerns structural zeros, that is, (i, j) pairsfor which πij = 0. The chi-squared test is not designed todeal with structural zeros. This problem is partially alle-viated by the bucketization procedure described above. Ifmany zero-valued nij ’s are still present after bucketization,then cords considers these to be structural zeros, and takesthe presence of such zeros as direct evidence of correlationbetween the columns.
3.3 The Detection AlgorithmFigure 2 displays the complete cords detection algorithm.
The algorithm, besides detecting correlations between col-umns, also identifies soft fds and soft keys. For ease ofexposition, we give the algorithm for the case in which thetwo columns of interest both lie in some table R and arerelated via the trivial pairing rule ∅R. The modificationsrequired to handle the case of a nontrivial pairing rule Pare straightforward; in effect, one simply needs to view ta-ble R as the result of executing the join query specified byP . We also restrict the discussion to the case of categoricalor discrete-valued data—see [15] for a discussion of how toapply the chi-squared test to real-valued data.
In the algorithm, |C|T denotes the number of distinct val-ues in column C of table T and |T | denotes the number of
ALGORITHM DetectCorrelationINPUT : A column pair C1, C2 with |C1|R ≥ |C2|R
Discover Trivial Cases1. a. IF |Ci|R ≥ (1 − ǫ1)|R| for i = 1 or i = 2
THEN Ci is a soft key; RETURN.b. IF |Ci|R = 1 for i = 1 or i = 2
THEN Ci is a trivial column; RETURN.
Sampling2. Sample R to produce a reduced table S.
Detect Soft Functional Dependencies in the Sample3. a. Query S to get |C1|S , |C2|S and |C1, C2|S .
b. IF |C1, C2|S ≤ ǫ2|S|AND |C1|S ≥ (1 − ǫ3)|C1, C2|S
Sampling-Based Chi-Squared Test5. a. Initialize each nij , ni·, and n·j to 0.
b. FOR EACH column-value pair (x1, x2)i = Category (1, x1, d1, SKEW1);j = Category (2, x2, d2,SKEW2);Increment nij , ni·, and n·j by 1;
c. IF∑d1
i=1
∑d2
j=1IsZero (nij) > ǫ5d1d2
THEN C1 and C2 are correlated; RETURN.d. Compute χ2 as in (1); set ν = (d1 − 1)(d2 − 1)
and t = G−1ν (1 − p).
e. IF χ2 > tTHEN C1 and C2 are correlated; RETURN.ELSE C1 and C2 are independent; RETURN.
Figure 2: The correlation detection algorithm.
rows in table T . Similarly, |C1, C2|T denotes the number ofdistinct values in the concatenation of columns C1 and C2 intable T . We denote the jth most frequent value in a columnCi by Vij and the corresponding frequency of the value byFij ; we denote by Ni the number of frequent values for Ci
that are stored in the system catalog. Finally, we denoteby di the number of distinct categories for the Ci values inthe chi-squared test. Recall that we write C1 ⇒ C2 to de-note a soft fd of C2 on C1. The algorithm parameters ǫ1through ǫ5 are small positive constants lying between 0 and1. The parameter p is the maximum allowed probability ofa false-positive or false-negative result for the chi-squaredtest. Some key details of the algorithm are as follows.
Step 1. The quantities |Ci|R and |R| are obtained fromthe system catalog. If the number of distinct values in acolumn Ci is close to the table cardinality |R|, then thiscolumn is “almost” a key, and we call such a column a soft
key. A soft key column is trivially statistically correlated
with every other column in R because the value of Ci withhigh probability determines the row, and hence the valuein any other column. Therefore, cords prunes any columnpair for which at least one column is a soft key. cords
similarly prunes pairs in which at least one column is single-valued, because if |Ci|R = 1, then each column Cj with j 6= ifunctionally determines Ci in a trivial manner.
Step 2. Many commercial systems use either a row-levelor page-level Bernoulli sampling scheme. Although theseschemes differ somewhat from the simple random samplingscheme assumed in the sample size analysis of Section 3.2,both theoretical and empirical considerations nonethelesscontinue to support the conclusion that a relatively smallfixed sample size—independent of the table cardinality—isadequate for the chi-squared analysis. This is a crucial fea-ture that allows cords to scale to large databases. Soft fdsare harder to detect from a sample because, as discussedbelow, such detection requires accurate sampling-based es-timates of the number of distinct values in the two columnsand in the concatenation of the two columns. Such estima-tion is notoriously difficult [13], and the required sample sizefor a specified degree of accuracy is determined as a percent-age of the table cardinality. Fortunately, cords usually cor-rectly detects correlation between two columns even whenit fails to detect a fd, and correlation detection suffices forthe purpose of recommending cg statistics.
Step 3. If, in table R, column C1 functionally determinesC2, then |C1|R/|C1, C2|R = 1. Therefore, cords asserts theexistence of a soft fd C1 ⇒ C2 if |C1|S/|C1, C2|S is “close”to 1 (specifically, within a distance of ǫ3). Because determin-ing fds from samples is somewhat risky, cords only testsfor a soft fd if the reduced table S contains enough “infor-mation” in the sense that |S| ≫ |C1, C2|S . Intuitively, ifthe sample S is so small that most column-value pairs (x, y)in the sample are distinct, then a spurious fd will likely bedetected. We define the strength of a soft fd C1 ⇒ C2 as|C1|R/|C1, C2|R. This strength is always less than or equalto 1, and a soft fd with strength equal to 1 coincides with ahard functional dependency. cords estimates the strengthof a soft fd by |C1|S/|C1, C2|S . Note that cords, becauseit works from a sample, can never assert with complete cer-tainty that a discovered fd is a hard dependency.
Step 4. As discussed previously, cords uses each frequentvalue in a column as a category for the chi-squared test whenthe data distribution is highly skewed; in this case di, thenumber of categories, is equal to Ni, the number of frequentvalues in the system catalog. In effect, the chi-squared anal-ysis is applied to a reduced table that is obtained by elim-inating infrequent values. Note that the filtering process isnot determined by properties of the sample, so that the sta-tistical properties of the test are not distorted. When thedata is not skewed, the number of categories is equal to thenumber of distinct column values, up to a specified limitdmax.
7
Step 5. In Step 5.b, cords bucketizes the data, if neces-sary, and creates the “contingency table” for the chi-squaredtest—i.e., the two-dimensional array of nij values along withthe marginal row (ni·) and column (n·j) totals. Figure 3displays the function Category that is used for this compu-tation. In the figure, Hash is a specified integer-valued hashfunction.8 In Step 5.c, cords declares columns C1 and C2
7Our implementation uses a value of dmax = 50.8When |Ci|R ≤ dmax, Hash can be taken as a simple 1-to-1 mapping
FUNCTION Category (i, x, d, SKEW)
IF SKEW = TRUETHEN RETURN j such that x = Vij
ELSE RETURN 1+[Hash(x) mod d].
Figure 3: Assigning column values to categories forthe chi-squared test.
to be correlated if there are too many zeros in the contin-gency table, essentially considering these zeros to be struc-tural zeros because they have persisted in the presence ofbucketization. The function IsZero that is used in Step 5.creturns 1 if its argument is 0 and returns 0 otherwise.
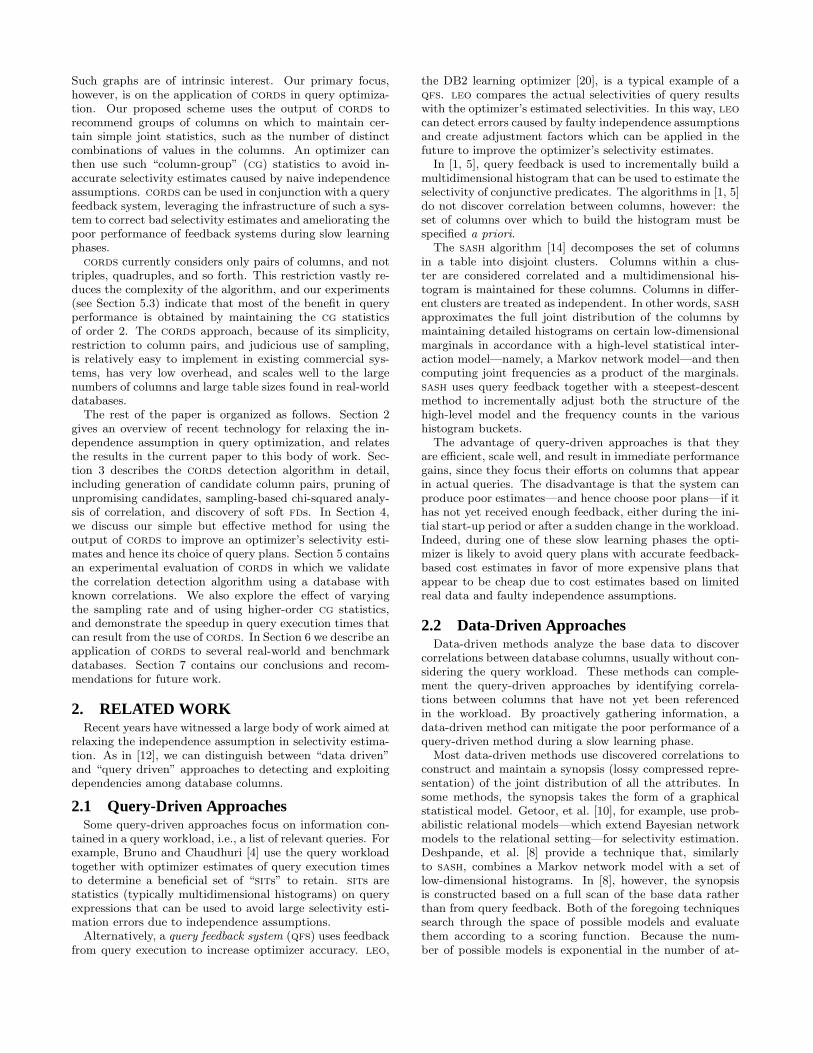
3.4 Displaying the Results GraphicallyEspecially in the context of data mining, it can be illumi-
nating to display the output of cords as a dependency graphin which nodes correspond to columns and arcs correspondto correlation or soft fd relationships; see, for example, Fig-ures 6, 11, and 14 below. Indeed, the name cords waspartially inspired by the visual “cords” that connect corre-lated columns. The thickness of the arcs (or, alternatively,the color) can be used to show the strength of the relation-ships. For soft functional dependencies, the thickness canbe an increasing function of the estimated strength, as de-fined in Section 3.3. For correlations, the thickness can be adecreasing function of the p-value or an increasing functionof the estimated mean-square contingency.
4. CORDS AND QUERY OPTIMIZATIONIn this section we describe one possible scheme for using
cords to improve the accuracy of a query optimizer. Inthis scheme, cords recommends a set of cg statistics forthe optimizer to maintain.
4.1 Use of Column-Group StatisticsConsider two columns C1 and C2 from some specified ta-
ble, and suppose that we wish to estimate the selectivity ofa conjunctive predicate p1 ∧ p2, where each pi is an equalitypredicate of the form “Ci = vi.” A simple and commonly-used selectivity estimate is obtained by first estimating theselectivity of each pi as Spi
= 1/|Ci|, where |Ci| is the num-ber of distinct values in Ci, and then obtaining the finalselectivity estimate as Sp1∧p2
= Sp1· Sp2
= 1/|C1| · 1/|C2|.The foregoing estimate usually suffers from two sources of
error. First, the selectivity estimates for the individual pred-icates p1 and p2 assume that the data values in each columnare uniformly distributed. Second, the selectivity estimatefor p1∧p2 assumes that C1 and C2 are independent. This lat-ter assumption often results in underestimation of the trueselectivity by orders of magnitude. Query optimizers typ-ically impose uniformity assumptions when detailed distri-butional statistics on individual columns are not available inthe system catalog, and impose independence assumptionswhen statistics are available only for individual columns andnot for groups of columns.
from the set of distinct Ci values to 1, 2, . . . , |Ci|R . Of course,
neither mapping nor hashing may be needed when the data is integer-
valued.
ID Make Model
1 Honda Accord
2 Honda Civic
3 Toyota Camry
4 Nissan Sentra
5 Toyota Corolla
6 BMW 323
7 Mazda 323
8 Saab 95i
9 Ford F150
10 Mazda 323
Figure 4: A table with correlated columns.
We focus on ameliorating the latter type of error; errorscaused by inappropriate independence assumptions oftendominate the total error when estimating the selectivity ofa conjunctive predicate. Our approach uses cords to iden-tify a set of column pairs that are strongly correlated; foreach such pair (C1, C2), the optimizer collects the cg statis-tic |C1, C2|, the number of distinct combinations of values inthe two columns. The optimizer then produces the improvedselectivity estimate S′
p1∧p2= 1/|C1, C2|.
cords can profitably be used in conjunction with a qfs,such as leo, that stores and applies a set of multiplicativeadjustment factors to the optimizer’s selectivity estimates.E.g., in an enhanced version of leo, an adjustment factormay be derived either from query feedback or from informa-tion provided by cords. In this way the strengths of bothquery-driven and data-driven approaches can be combined.For our particular example, the adjustment factor for Sp1∧p2
is simply |C1| |C2|/|C1, C2|. This adjustment factor equals 1when the columns are truly independent and grows larger asthe correlation between the two columns becomes stronger.
Example 1. Consider the automobile data in Figure 4,along with a query having a selection predicate p1∧p2, wherep1 = “Make = Honda” and p2 = “Model = Accord”. Thetrue selectivity of this predicate is σp1∧p2
= 1/10. The naiveestimate is Sp1∧p2
= 1/|Make| ·1/|Model| = 1/7 ·1/8 = 1/56,which underestimates the true selectivity by a factor of5.6, or about −82%. After applying a correction factor of|Make| |Model|/|Make, Model| = 56/9, we obtain an adjustedestimate of S′
p1∧p2= 1/9, which has an error of only 11%;
this residual error is caused by departures from the unifor-mity assumption. Thus, by using a cg statistic, we haveremoved the major source of the estimation error.
Of course, the output of cords can be used in more so-phisticated ways. For example the optimizer, prompted bycords, might collect a more detailed set of cg statisticscomprising not only distinct-value information, but also thefrequencies for the k most frequent values, along with quan-tiles. This additional information can be used to alleviateselectivity-estimation errors arising from the uniformity as-sumption. cords can potentially provide guidance whenmaintaining more complex synopses such as those in [1, 8,14]. As indicated by the foregoing example and the ex-periments in Section 5, however, even the simple approachdescribed above can result in dramatic reductions in queryprocessing time. This approach has the important practicaladvantage of being relatively easy to implement in existingcommercial optimizers.
ALGORITHM RecommendCGSINPUT: Discovered correlations and soft FDs
1. Sort correlated pairs, (Ci, Cj) in ascending orderof p-value
2. Sort soft fds in descending order of estimatedstrength
3. Break ties by sorting in descending order of theadjustment factor |Ci| |Cj |/|Ci, Cj |.
4. Recommend the top k1 correlated column pairsand the top k2 soft fds to the optimizer
Figure 5: Ranking Correlations and Soft FDs.
4.2 Recommending Column-Group StatisticsReal-world databases typically contain large numbers of
correlated column pairs. Maintaining cg statistics on eachpair for purposes of optimization is usually too expensiveand increases the complexity of the selectivity estimationprocess to an unacceptable degree. This raises the questionof exactly which of the discovered pairs should be recom-mended to the optimizer.
Suppose that, based on storage and processing con-straints, the user is willing to store cg statistics for k1 cor-related column pairs and k2 soft fds. Then the algorithm inFigure 4.2 can be used to recommend a set of cg statistics tothe optimizer. In Step 1, we can alternatively sort the cor-related pairs in descending order of estimated mean-squarecontingency; either choice ensures that the higher the rankof a column pair, the stronger the correlation between thecolumns. The tie-breaking rule attempts to select the cg
statistics that will have the biggest impact on the optimizerselectivity estimates via the adjustment factor (as describedin Section 4.1). Indeed, the adjustment factor may be usedas the primary ranking criterion and not just as a tie breaker.Finally, we note that more sophisticated methods, e.g., inthe spirit of [4], can potentially be used to decide the set ofcg statistics to maintain.
5. EXPERIMENTAL EVALUATIONWe implemented a cords prototype as an application pro-
gram on top of DB2 V8.1 and applied cords to several syn-thetic, real-world, and benchmark databases. In this sec-tion, we describe the validation of cords using a syntheticdatabase having known correlations and soft fds. We alsoexamine the effects of changing the sample size and of usinghigher-order cg statistics, as well as the overall impact ofcords on query execution times. All experiments were per-formed on a UNIX machine with two 400 MHz processorsand 1 GB of RAM.
In our experiments, we applied a subset of the pruningrules discussed in Section 3.1. Specifically, we excluded col-umns having data types comprised of very many bits andlimited pairing rules to joins between columns having a de-clared primary-key-to-foreign-key relationship. We also con-ducted experiments in which cords did not use any pruningrules, in order to test scalability.
5.1 ValidationWhen generating the synthetic database, we created a pre-
determined set of correlations and soft fds. We could then
analyze the accuracy of cords by comparing the set of cor-relations and soft fds discovered by the algorithm to thetrue set.
The schema of the Accidents database that we gener-ated contains four relations: CAR, OWNER, DEMOGRAPHICS, andACCIDENTS. Several primary-key-to-foreign-key relationshipsexist between the tables, and a number of soft fds betweenattributes, such as Make and Model, are inherent in the at-tribute definitions. We also generated correlations betweencolumns in a table and between columns in different tablesby manipulating the joint frequency distribution. For ex-ample, we created a correlation between Model and Color:most of the Accords are Silver, and so forth. The size of thesynthetic database is around 1 GB. This size is relativelyunimportant, at least with respect to the chi-squared anal-ysis, because cords works from a sample and, as discussedpreviously, the accuracy depends only on the absolute sam-ple size.
We did not explicitly declare any of the primary-key-to-foreign-key relationships in the Accidents database, whichhad the effect of restricting cords to discover correlationsand soft fds only between columns in the same table. Suchrelationships are the most important with respect to thescheme in Section 4.1 for improving selectivity estimates,because optimizers typically do not maintain cg statisticsfor columns in different tables.
cords, using a sample of 4000 rows from each table, dis-covered all of the synthetically generated correlations andsoft fds, and did not incorrectly detect any spurious rela-tionships. Figure 6 displays the dependency graph for eachof the tables in the Accidents database. In the figure, thethickness of a solid line (“cord”) that represents a correla-tion increases as the p-value decreases, and each dashed ar-row that represents a soft fd is labeled with the estimatedstrength of the fd as defined in Section 3.3.
The graph shows a soft fd Model ⇒ Make with an esti-mated strength9 of 0.92. That the estimated strength of thissoft fd is strictly less than 1—and would be less than 1 evenfor a sampling rate of 100%—is expected since certain mod-els share the same make (e.g., Mazda 323 and BMW 323).The soft fds in the dependency graph for the OWNER relationaccurately reflect the hierarchies in the data: City ⇒ State,State ⇒ Country, and the transitive closure of these fds.There were no trivial columns in this example, but cords
identified a number of soft keys. For example, cords iden-tified the columns ID and Name in OWNER table as soft keys.Note that ID is an actual key; Name is not a key, but has alarge number of distinct values close to the relation cardi-nality, so that any functional dependency or correlation thatinvolves Name is likely to be spurious.
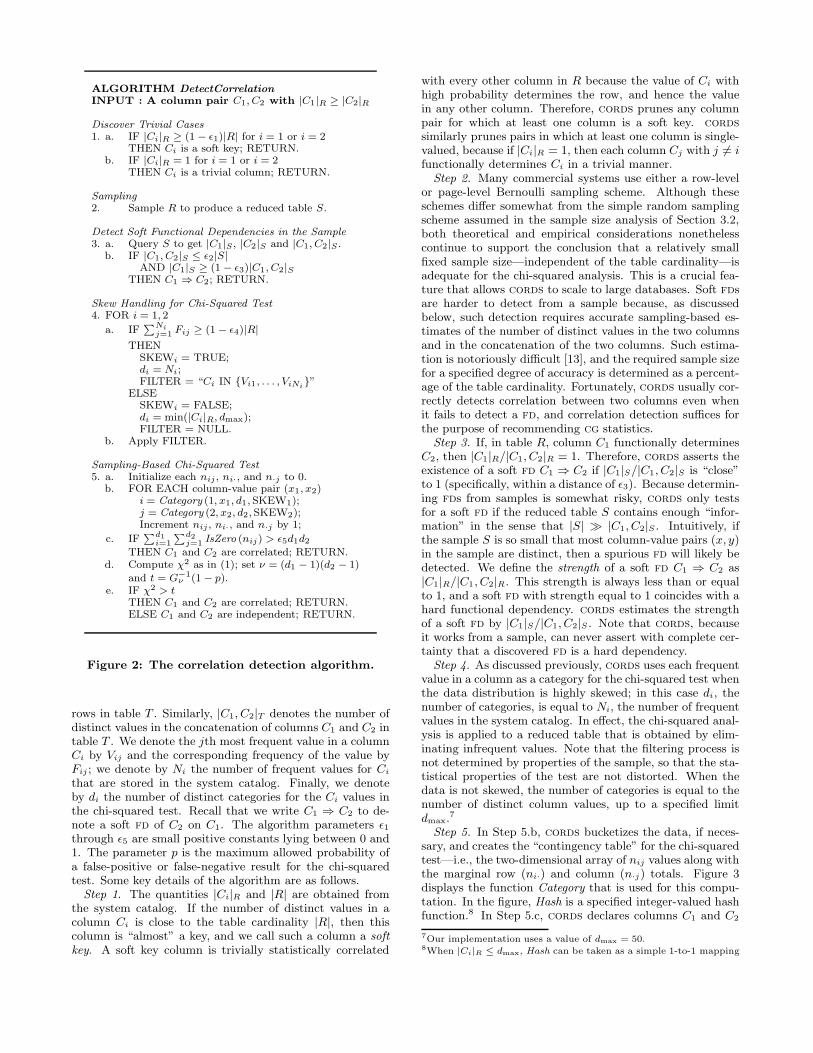
5.2 The Effect of Sample SizeOur implementation of cords exploits the efficient page-
level Bernoulli sampling technique supported by DB2. Forthe sample sizes considered, the cost of retrieving a sample isapproximately a linear function of the sample size, and is in-dependent of the size of the database. Figure 7 displays theoverall execution time of cords as a function of the samplesize. As can be seen, the execution time of cords increases
9The actual strength was 0.9236. cords estimated the strengths of
each soft fd in the Accidents database to within 0.5%. Although this
result is encouraging, the accuracy when estimating soft fds depends
in general on the size of both the database and the sample.
Figure 6: Dependency graph for the Accidents database.
Figure 7: Effect of sample size on execution time.
in a slightly sublinear manner as the sample size increasesfrom 1000 rows to the entire database (no sampling). For asample size of few thousand rows, cords takes less than aminute to complete, regardless of the size of the database.
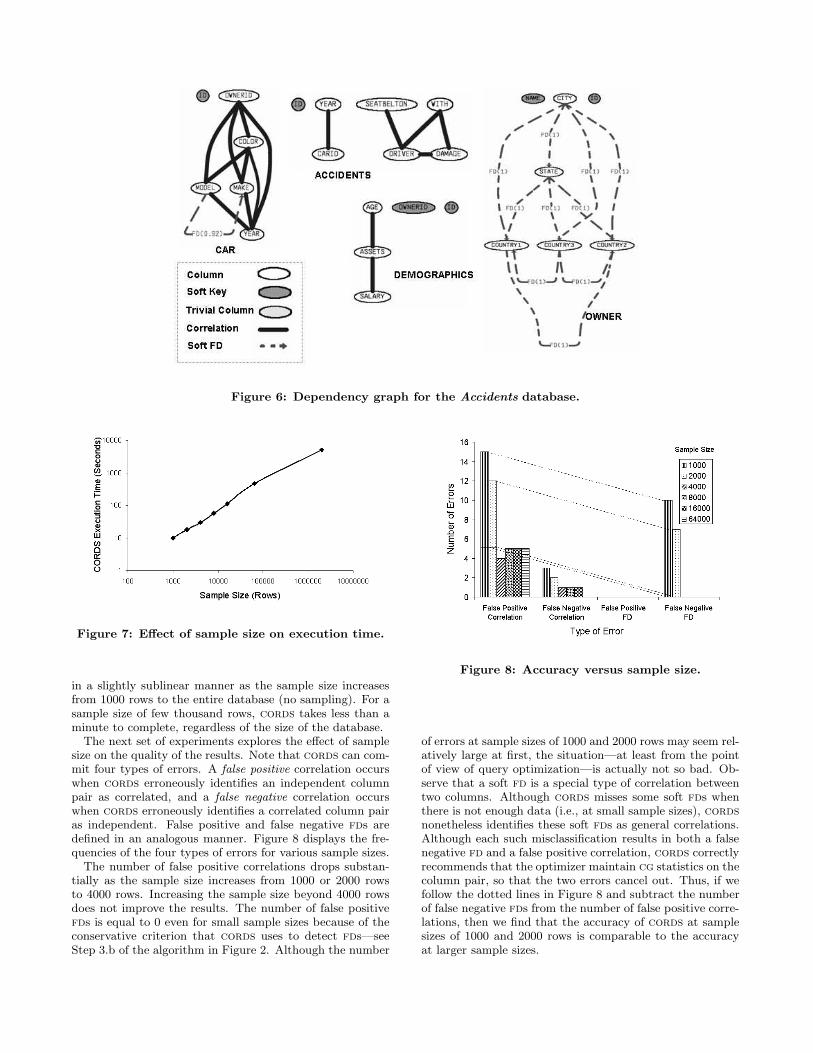
The next set of experiments explores the effect of samplesize on the quality of the results. Note that cords can com-mit four types of errors. A false positive correlation occurswhen cords erroneously identifies an independent columnpair as correlated, and a false negative correlation occurswhen cords erroneously identifies a correlated column pairas independent. False positive and false negative fds aredefined in an analogous manner. Figure 8 displays the fre-quencies of the four types of errors for various sample sizes.
The number of false positive correlations drops substan-tially as the sample size increases from 1000 or 2000 rowsto 4000 rows. Increasing the sample size beyond 4000 rowsdoes not improve the results. The number of false positivefds is equal to 0 even for small sample sizes because of theconservative criterion that cords uses to detect fds—seeStep 3.b of the algorithm in Figure 2. Although the number
Figure 8: Accuracy versus sample size.
of errors at sample sizes of 1000 and 2000 rows may seem rel-atively large at first, the situation—at least from the pointof view of query optimization—is actually not so bad. Ob-serve that a soft fd is a special type of correlation betweentwo columns. Although cords misses some soft fds whenthere is not enough data (i.e., at small sample sizes), cords
nonetheless identifies these soft fds as general correlations.Although each such misclassification results in both a falsenegative fd and a false positive correlation, cords correctlyrecommends that the optimizer maintain cg statistics on thecolumn pair, so that the two errors cancel out. Thus, if wefollow the dotted lines in Figure 8 and subtract the numberof false negative fds from the number of false positive corre-lations, then we find that the accuracy of cords at samplesizes of 1000 and 2000 rows is comparable to the accuracyat larger sample sizes.
Figure 9: Effect of column-group order on accuracyof selectivity estimates.
5.3 Higher-Order CG Statisticscords discovers correlations only between pairs of col-
umns. The rationale behind this approach is that such pairscan be identified in a fast and highly scalable fashion, andthe resulting cg statistics can be used to correct for mostof the errors in selectivity estimation. We tested the lat-ter assumption by measuring the selectivity estimation errorwhen there are either (1) statistics on single columns only,so that the independence assumption is used throughout,(2) cg statistics on column pairs, or (3) cg statistics on col-umn triples. The workload consisted of 300 queries, whereeach query had a set of three or more equality predicates oncorrelated columns. The cg statistics for column pairs wereobtained by running cords, and the cg statistics for columntriples were computed for all triples that appeared in at leastone predicate in the query workload.10 For each of the threescenarios, we computed the error factor in selectivity esti-mation for each query, that is, the ratio of the true to theestimated selectivity. Figure 9 displays the worst-case errorfactors. As can be seen, maintaining cg statistics on columnpairs reduces the worst-case error by an order of magnitude.The figure also clearly shows the diminishing return frommaintaining higher order cg statistics, and provides somejustification for our approach.
5.4 Performance Benefit for Query ExecutionTo evaluate the overall benefit of using cords in the con-
text of query optimization, we ran a workload of 300 querieson the Accidents database, both with and without the cg
statistics recommended by cords. Each query joins the fourtables in the schema and applies multiple local predicates oncorrelated columns. Figures 10(a) and (b) display the boxplot and scatter plot for the workload in these two scenar-ios. As can be seen from Figure 10(a), there is a slight de-crease in the median query execution time, and a dramaticdecrease—by an order of magnitude—in the worst-case ex-ecution time. Inspection of the scatter plot in Figure 10(b)shows that almost all of the plotted points lie below the 45degree line, i.e., almost all of the queries benefitted fromthe use of cords. Many queries benefitted significantly. In-creases in query execution times, when present, were small,and resulted from small inaccuracies in the optimizer’s costmodel.
10Presumably an extension of cords to column triples would recom-
mend some subset of the cg statistics that we used.
6. CORDS IN ACTIONThis section reports some results that were obtained
by applying cords to several real-world and benchmarkdatabases. We first explored a subset of the Census databasecomprising a single table having 123 columns. We thenlooked at the Auto database; this real-world database con-tains motor vehicle information and has over 20 tables andhundreds of columns. As indicated previously, a sample sizeof a few thousand rows suffices for query optimization. Forpurposes of data mining, where we would like to more accu-rately capture soft fds, initial experiments found a samplesize of 10,000 rows to suffice. We therefore use a sample sizeof either 2000 or 10,000 rows throughout.
As seen from the dependency graph11 for the Census
database, based on 2000 rows and displayed in Figure 11,correlations and fds abound in real-world databases. Fig-ure 12(a) shows the number of discovered correlations cor-responding to various upper cutoff levels for the p-value andlower cutoff levels for the adjustment factor (defined as inSection 4.1). Figure 12(b) shows the number of discoveredsoft fds corresponding to various lower cutoff levels for theestimated strength and the adjustment factor. Figure 13 isanalogous to Figure 12, but based on a sample of 10,000rows from the Auto database. The foregoing figures showhow real-world databases can contain large numbers of cor-relations that will likely cause huge errors in selectivity esti-mation. For example, in the Auto database, there are morethan 150 correlated pairs that can cause selectivity estima-tion errors by a factor exceeding 256.
We also applied cords to the TPC-H benchmark data-base. cords discovered various associations between col-umns that resulted from the data generation process, aswell as from naturally arising primary-key-to-foreign-key re-lationships and fds. For example, based on a sample of10,000 rows, cords identified two clusters of attributes inthe LINEITEM table; see Figure 14. The first cluster pertainsto an order, while the second cluster pertains to a supplier.These hidden correlations can result in order-of-magnitudeerrors in estimated selectivities, and hence query plans thatrun in hours instead of seconds. We emphasize that theclusters were discovered without requiring any explicit se-mantic knowledge about the application domain—cords iscompletely data-driven.
7. CONCLUSIONS AND FUTURE WORKcords is a fast and scalable technique for detecting cor-
relations and soft fds between attributes in a relationaldatabase. By combining the candidate-generation frame-work from the b-hunt system with robust chi-squared anal-ysis and a judicious use of sampling, cords can discovercorrelations in a fast, efficient and highly scalable manner.Indeed, our experiments show that cords can discover cor-relations and soft fds in very large databases in a matterof minutes. Our empirical study also shows that real-worlddatabases are rich in such statistical relationships.
cords can be used as a standalone database mining tool.Indeed, cords is well suited to visualization, because theoutput of cords can easily be transformed into a depen-dency graph. An interesting topic for future research is howbest to display the relationships between database attributes
11The dependency graphs in this section have the same legend as that
for Figure 6.
(a) Box Plot (b) Scatter Plot
Figure 10: Effect of CORDS on query execution time.
using linewidth, texture, color, and so forth. Although wehave presented static dependency graphs, one can envisiona dynamic graphical front end that permits the user to dis-play first the strongest relationships, then the next strongestrelationships, and so forth, by manipulating, e.g., a sliderbar. cords can also complement current database min-ers to permit more efficient pruning during the traditionalassociation-rule discovery process. Finally, cords can facili-tate the preliminary phases of schema discovery and schemadesign.
We have shown the potential of cords as a practicaltool for relaxing the independence assumption used by com-mercial query optimizers when estimating selectivities. Wefound cords relatively easy to prototype in a commercialdbms, and our experiments show that the use of cords canlead to order-of-magnitude improvements both in the accu-racy of selectivity estimates and in the resulting query execu-tion times. Moreover, by simultaneously using both cords
and leo-style feedback algorithms as a basis for recommend-ing cg statistics to the optimizer, we can potentially obtainthe best features of both data- and query-driven methods.
Although cords discovers only pairwise correlations, ourexperiments indicate that exploiting such correlations canremove most of the correlation-induced selectivity estima-tion errors, though perhaps the discovery and exploitationof three-way correlations may be worthwhile. We suspecthowever that, for most data-driven methods, the increasein accuracy obtained by capturing high-dimensional jointdistributions does not justify the resulting increase in exe-cution cost and programming complexity. A better strategyis to use cords as a bootstrapping technique for a qfs ifhigher-order cg statistics are needed.
In future work, we plan to investigate techniques for ex-tending cords to detect three-way correlations, and to seeif such an extension is worthwhile for query optimization;one possible approach to this problem is to replace the chi-squared analysis by a more general log-linear analysis asdescribed in [2]. We will also investigate extensions for facil-itating schema discovery, for example, discovering soft com-posite keys and soft fds of the form X, .., Y ⇒ Z. We believethat the cords technique can be applied in contexts otherthan relational databases, for example, discovering relation-ships and schema information in XML data.
8. REFERENCES[1] A. Aboulnaga and S. Chaudhuri. Self-tuning histograms:
Building histograms without looking at data. In Proc. 1999ACM SIGMOD, pages 181–192. ACM Press, 1999.
[2] A. Agresti. Categorical Data Analysis. Wiley, second edition,2002.
[3] S. M. Ali and S. D. Silvey. A general class of coefficients ofdivergence of one distribution from another. J. Royal Statist.Soc. Ser. B, 28:131–142, 1966.
[4] N. Bruno and S. Chaudhuri. Exploiting statistics on queryexpressions for optimization. In Proc. 2002 ACM SIGMOD,pages 263–274. ACM Press, 2002.
[5] N. Bruno, S. Chaudhuri, and L. Gravano. STHoles: amultidimensional workload-aware histogram. In Proc. 2001ACM SIGMOD, pages 211–222. ACM Press, 2001.
[6] J. Cheng, D. A. Bell, and W. Liu. Learning belief networksfrom data: An information theory based approach. In Proc.ACM Conf. Info. Knowledge Mgmt. (CIKM ’97), pages325–331, 1997.
[7] H. Cramer. Mathematical Methods of Statistics. Princeton,1948.
[8] A. Deshpande, M. Garofalakis, and R. Rastogi. Independence isgood: dependency-based histogram synopses forhigh-dimensional data. In Proc. 2001 ACM SIGMOD, pages199–210. ACM Press, 2001.
[9] W. Feller. An Introduction to Probability Theory and ItsApplications, Volume I. Wiley, 1968.
[10] L. Getoor, B. Taskar, and D. Koller. Selectivity estimationusing probabilistic models. In Proc. 2001 ACM SIGMOD,pages 461–472. ACM Press, 2001.
[11] L. A. Goodman and W. H. Kruskal. Measures of association forcross-classifications. J. Amer. Statist. Assoc., 49:733–763,1954.
[12] P. J. Haas and P. G. Brown. BHUNT: Automatic discovery offuzzy algebraic constraints in relational data. In Proc. 29thVLDB, pages 668–679. Morgan Kaufmann, 2003.
[13] P. J. Haas and L. Stokes. Estimating the number of classes in afinite population. J. Amer. Statist. Assoc., 93:1475–1487, 1998.
[14] L. Lim, M. Wang, and J. S. Vitter. SASH: A self-adaptivehistogram set for dynamically changing workloads. In Proc.29th VLDB, pages 369–380. Morgan Kaufmann, 2003.
[15] H. B. Mann and A. Wald. On the choice of the number of classintervals in the application of the chi-square test. Ann. Math.Statist., 13:306–317, 1942.
[16] P. B. Patnaik. The non-central χ2- and F -distributions andtheir applications. Biometrika, 36:202–232, 1949.
[17] T. R. C. Read and N. A. C. Cressie. Goodness-of-Fit Statisticsfor Discrete Multivariate Data. Springer, 1988.
[18] M. Siegel, E. Sciore, and S. Salveter. A method for automaticrule derivation to support semantic query optimization. ACMTrans. Database Syst., 17:563–600, 1992.
[19] R. Srikant and R. Agrawal. Mining quantitative associationrules in large relational tables. In Proc. 1996 ACM SIGMOD,pages 1–12. ACM Press, 1996.
[20] M. Stillger, G. M. Lohman, V. Markl, and M. Kandil. LEO —DB2’s LEarning Optimizer. In Proc. 27th VLDB, pages 19–28.Morgan Kaufmann, 2001.
Figure 11: Dependency graph for the Census database.
(a) Correlations (b) Soft fds
Figure 12: Number of recommended correlations and soft FDs in the Census database.
(a) Correlations (b) Soft fds
Figure 13: Number of recommended correlations and soft FDs in the Auto database.
Figure 14: Dependency graph for the LINEITEM table in TPC-H.