31
| Date post: | 12-Apr-2018 |
| Category: |
Documents |
| Upload: | truonghanh |
| View: | 215 times |
| Download: | 1 times |

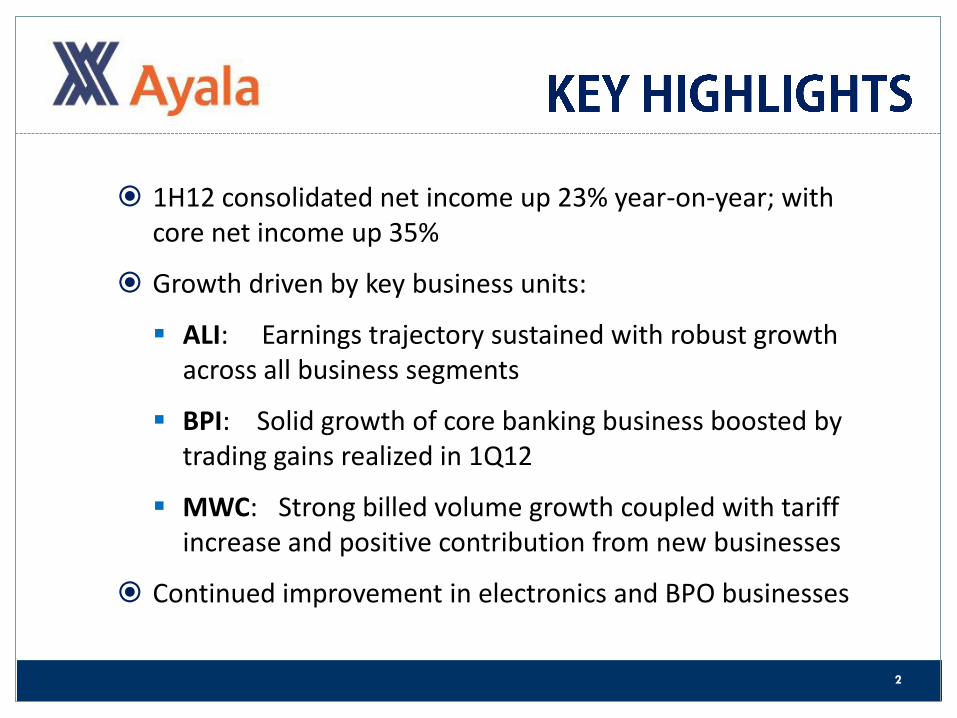
1H12 consolidated net income up 23% year-on-year; with core net income up 35%
Growth driven by key business units:
ALI: Earnings trajectory sustained with robust growth across all business segments
BPI: Solid growth of core banking business boosted by trading gains realized in 1Q12
MWC: Strong billed volume growth coupled with tariff increase and positive contribution from new businesses
Continued improvement in electronics and BPO businesses
2
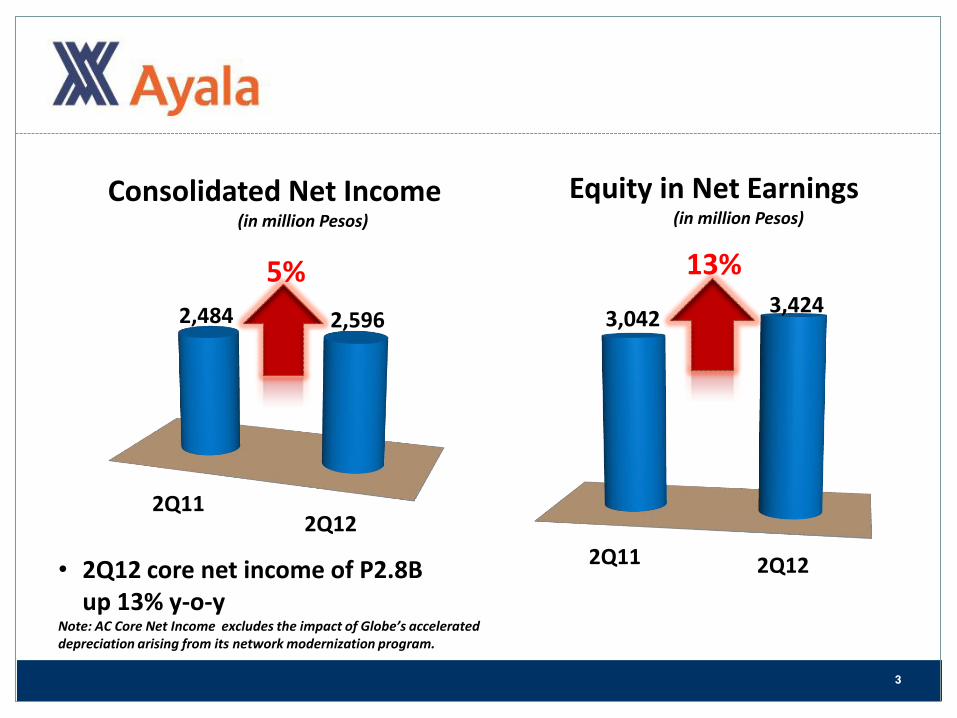
2Q11 2Q12
3,042 3,424
2Q11 2Q12
2,484 2,596
Consolidated Net Income (in million Pesos)
Equity in Net Earnings (in million Pesos)
13%
• 2Q12 core net income of P2.8B up 13% y-o-y Note: AC Core Net Income excludes the impact of Globe’s accelerated depreciation arising from its network modernization program.
5%
3

1H11 1H12
6,173 7,665
1H11 1H12
4,935 6,079
23%
Consolidated Net Income (in million Pesos)
Equity in Net Earnings (in million Pesos)
24%
• 1H12 core net income of P6.3B up 35% Note: 1H12 core net income excludes the impact of Globe’s accelerated depreciation arising from its network modernization program and excludes AG Holdings revaluation gains recognized in 1H11.
4
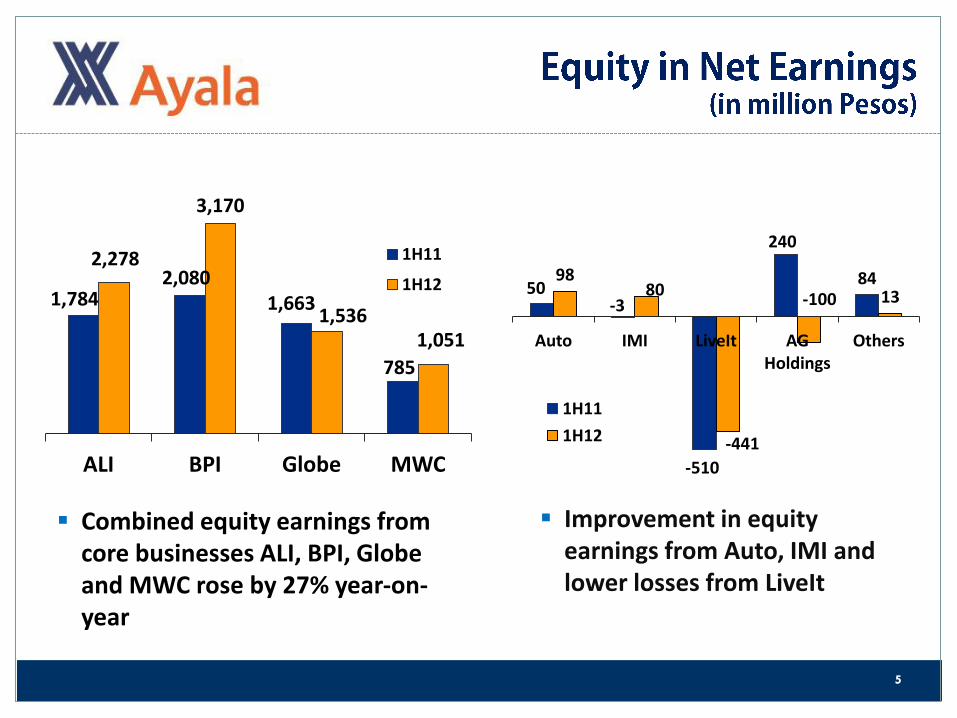
Combined equity earnings from core businesses ALI, BPI, Globe and MWC rose by 27% year-on-year
Improvement in equity earnings from Auto, IMI and lower losses from LiveIt
1,784 2,080
1,663
785
2,278
3,170
1,536 1,051
ALI BPI Globe MWC
1H11
1H12 50 -3
-510
240
84 98 80
-441
-100 13
Auto IMI LiveIt AG Holdings
Others
1H11
1H12
5
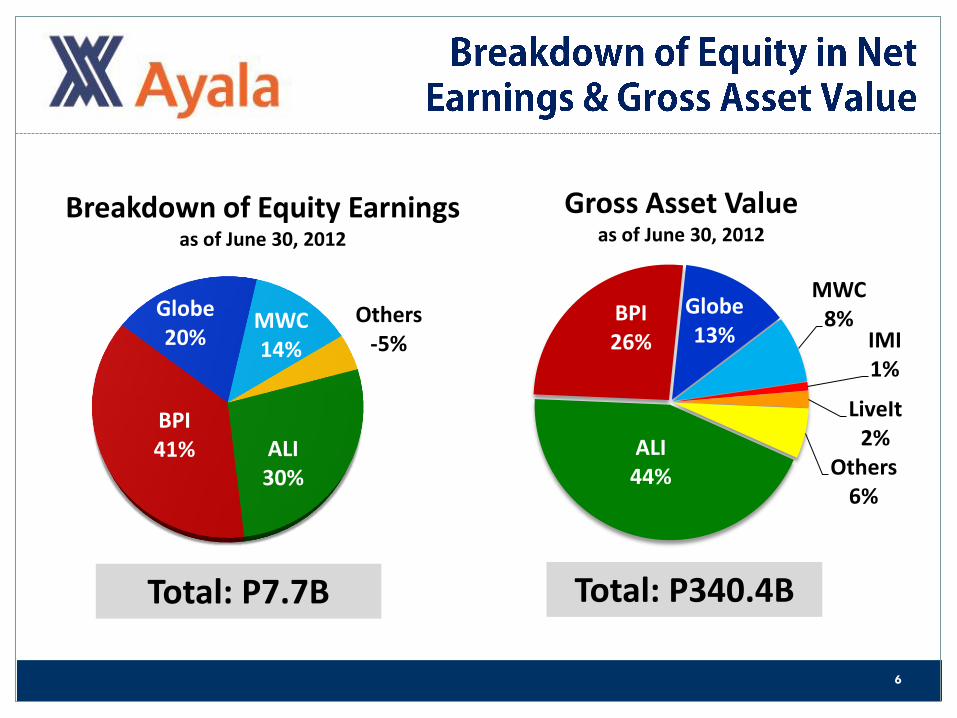
ALI 30%
BPI 41%
Globe 20%
MWC 14%
Others -5%
Breakdown of Equity Earnings as of June 30, 2012
Total: P7.7B
ALI 44%
BPI 26%
Globe 13%
MWC 8%
IMI 1%
LiveIt 2%
Others 6%
Gross Asset Value as of June 30, 2012
Total: P340.4B
6
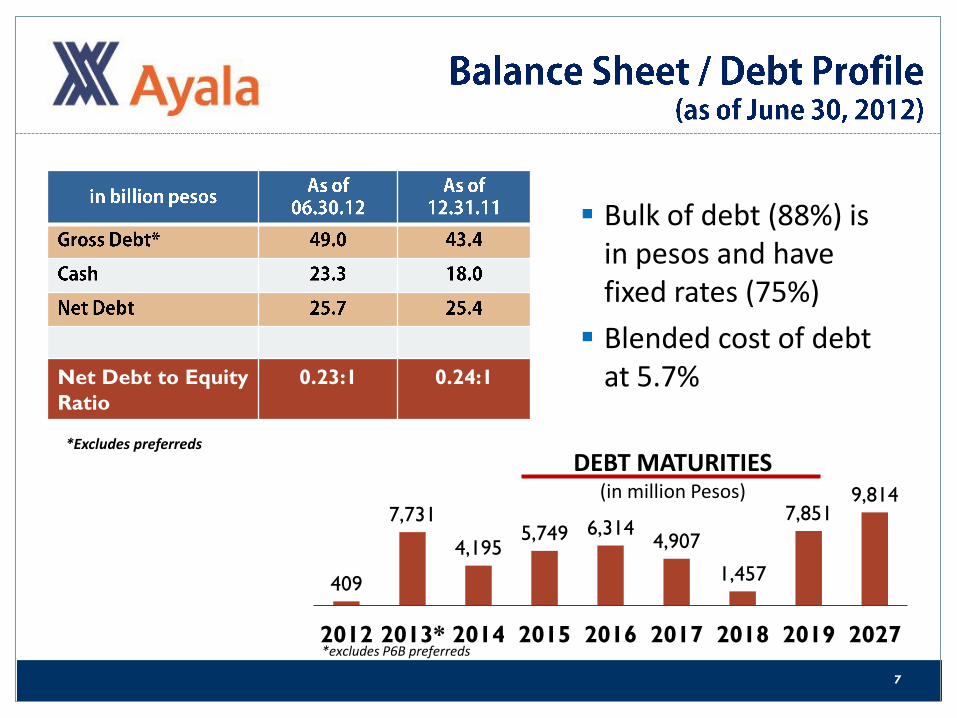
Net Debt to Equity
Ratio
0.23:1 0.24:1
*Excludes preferreds
409
7,731
4,195 5,749 6,314
4,907
1,457
7,851 9,814
2012 2013* 2014 2015 2016 2017 2018 2019 2027
DEBT MATURITIES (in million Pesos)
Bulk of debt (88%) is in pesos and have fixed rates (75%)
Blended cost of debt at 5.7%
*excludes P6B preferreds
7

AC Treasury Share Placement
Placement of 15 million common shares held in Treasury
Shares sold at P430 per share
Raised cash proceeds of P6.45B
Proceeds for working capital and funding of potential investments
5.18 million shares left in Treasury
8
Mainly to support ALI’s fund raising initiatives in preparation for its next phase of business development;
AC sold 680 million of its listed ALI shares at Php20 per share;
Proceeds infused into ALI as subscription for the same number of new ALI common shares at the same price;
Resulting AC ownership in ALI:
o Voting Stock - 71.2% from 73.1%;
o Common Stock - 50.4% from 53.1%;
Transaction has no impact on AC’s cash flow and minimal impact to AC’s net income.
Participation in ALI Equity Offering
9
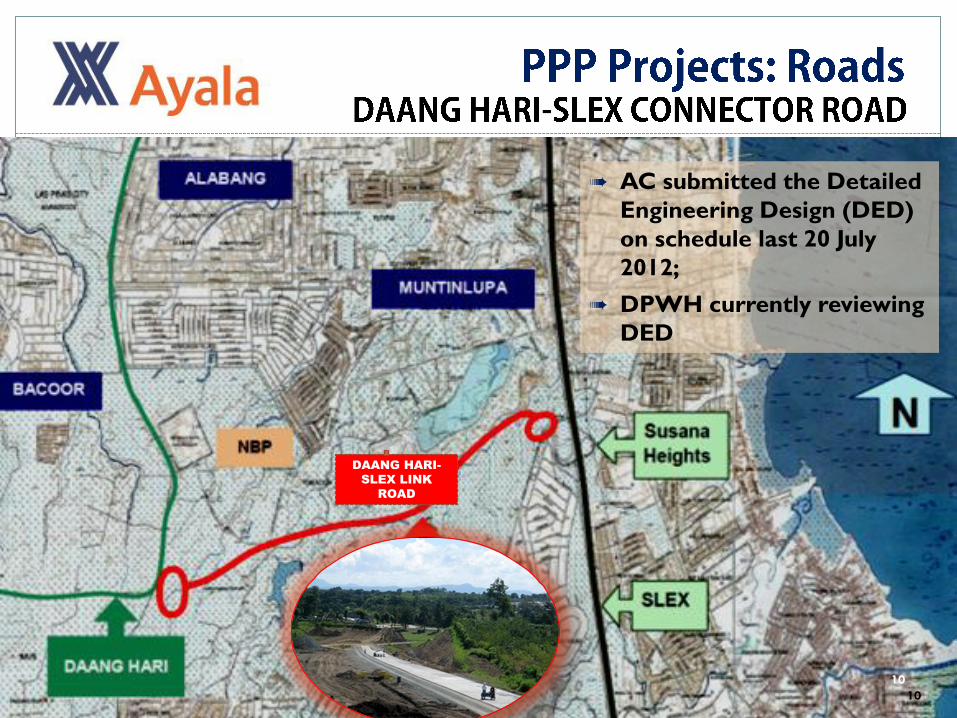
à AC submitted the Detailed
Engineering Design (DED)
on schedule last 20 July
2012;
à DPWH currently reviewing
DED
DAANG HARI-
SLEX LINK
ROAD
10
10
11
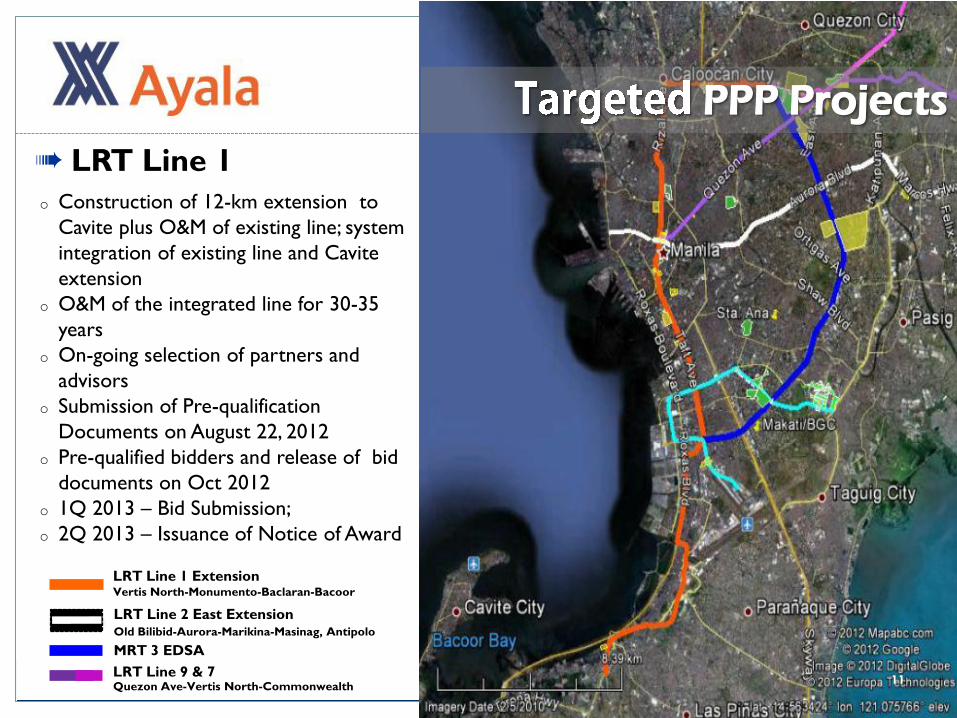
o Construction of 12-km extension to
Cavite plus O&M of existing line; system
integration of existing line and Cavite
extension
o O&M of the integrated line for 30-35
years
o On-going selection of partners and
advisors
o Submission of Pre-qualification
Documents on August 22, 2012
o Pre-qualified bidders and release of bid
documents on Oct 2012
o 1Q 2013 – Bid Submission;
o 2Q 2013 – Issuance of Notice of Award
à LRT Line 1
PPP Projects
LRT Line 1 Extension Vertis North-Monumento-Baclaran-Bacoor
LRT Line 2 East Extension Old Bilibid-Aurora-Marikina-Masinag, Antipolo
MRT 3 EDSA
LRT Line 9 & 7 Quezon Ave-Vertis North-Commonwealth

Design, Build, Operate & Maintain a 7-km 4-lane viaduct from Skyway to Roxas Boulevard and Macapagal Ave.
Estimated Construction Cost: P11B
30-year concession period
Pre-qualification submission: Sept 18, 2012
Bid Submission: December 2012
12
à NAIA EXPRESSWAY
12

o Divided into:
Cavite Section – 27.5 km, 6-lane tolled expressway from Kawit to Silang/ Aguinaldo (via PPP)
Laguna Section - 15.0 km, 6-lane tolled expressway from Silang to SLEX (via ODA)
o NEDA-ICC approved; invitation to pre-qualify expected to come out in the next few months
à Cavite-Laguna (CALA) Expressway
13

14
• Country’s 2nd primary gateway • Terminal expansion being
planned and feasibility study for new international terminal underway
• Development of new airport in Northern Mindanao
• Operation and maintenance of Laguindingan and Palawan airports to support ALI
Mactan Cebu International Airport
Laguindingan Airport
14
15
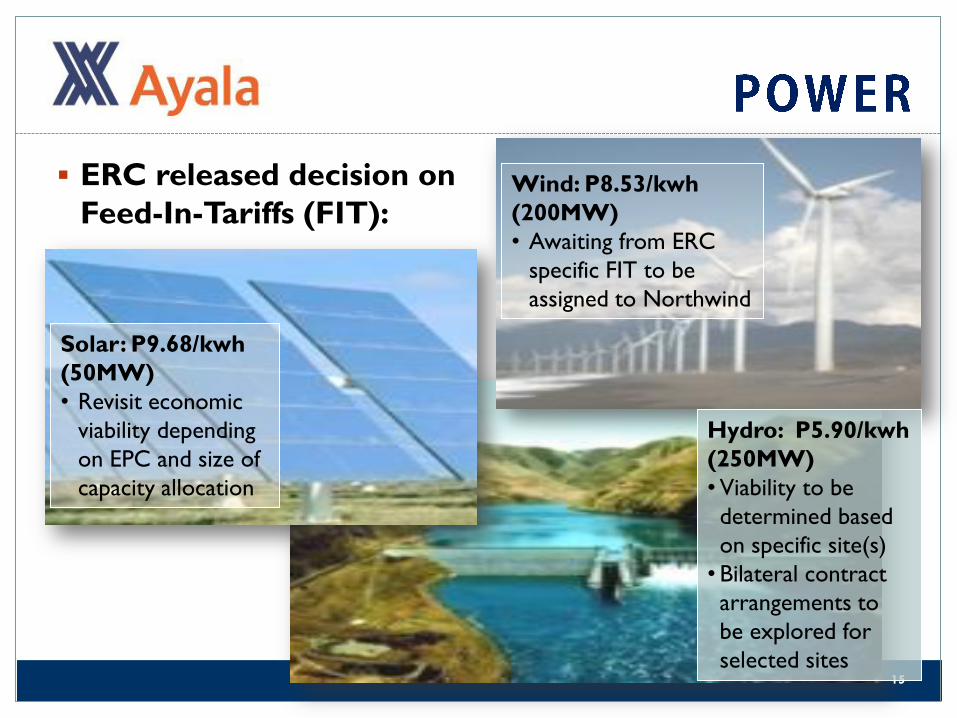
ERC released decision on
Feed-In-Tariffs (FIT):
Solar: P9.68/kwh
(50MW)
• Revisit economic
viability depending
on EPC and size of
capacity allocation
Wind: P8.53/kwh
(200MW)
• Awaiting from ERC
specific FIT to be
assigned to Northwind
Hydro: P5.90/kwh
(250MW)
•Viability to be
determined based
on specific site(s)
• Bilateral contract
arrangements to
be explored for
selected sites
16
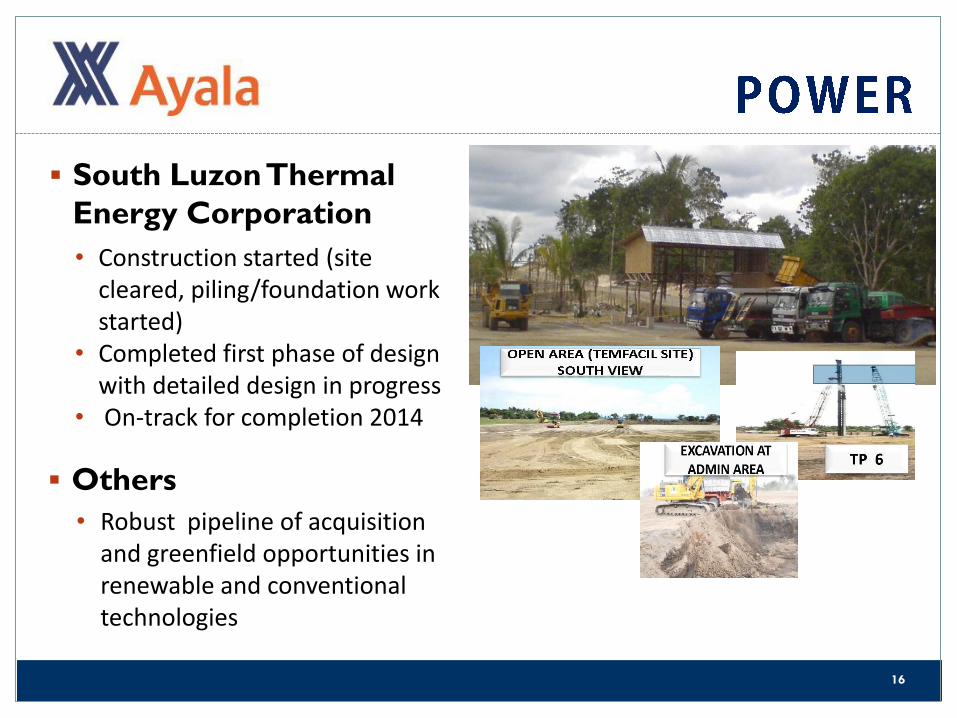
South Luzon Thermal
Energy Corporation
• Construction started (site cleared, piling/foundation work started)
• Completed first phase of design with detailed design in progress
• On-track for completion 2014
• Robust pipeline of acquisition and greenfield opportunities in renewable and conventional technologies
Others

BUSINESS UNIT REVIEW
17

1,759 2,194
3,381
4,326
2Q11 2Q12 1H11 1H12
Net Income (in million Pesos)
+25%
+28%
• Revenues up 18% in 1H12 due to: o 24% growth in Residential Segment o 21% increase in Commercial Leasing o 47% increase in Services o 15% growth in Hotels & Resorts
• 200 basis point improvement in NIAT margin
4Q11 1Q12 2Q12
12.8
19.3 19.8 Amaia
Avida
Alveo
ALP
Residential Sales Take-Up (in billion Pesos)
• Record sales continue: o Ave. monthly take-up of P6.5B in
1H12, up 64% vs P4.0B in 1H11 o Ave. monthly bookings of P3.5B up
57% vs. P2.2B in 1H11
• Strong demand across all brands
18
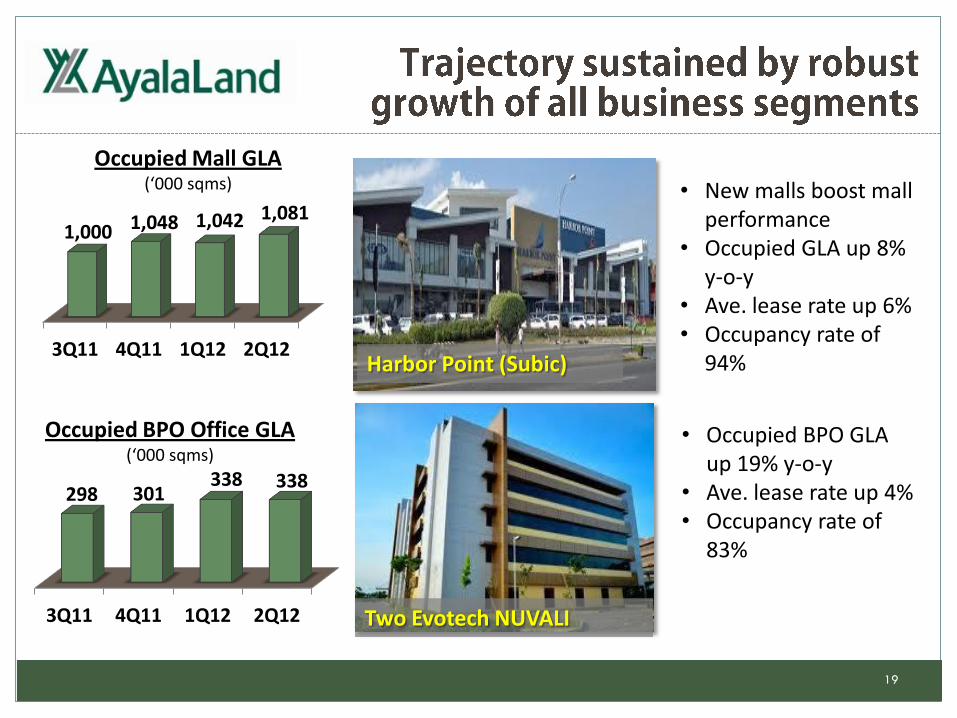
3Q11 4Q11 1Q12 2Q12
1,000 1,048 1,042 1,081
Occupied Mall GLA (‘000 sqms)
Harbor Point (Subic)
3Q11 4Q11 1Q12 2Q12
298 301 338 338
Two Evotech NUVALI
Occupied BPO Office GLA (‘000 sqms)
• New malls boost mall performance
• Occupied GLA up 8% y-o-y
• Ave. lease rate up 6% • Occupancy rate of
94%
• Occupied BPO GLA up 19% y-o-y
• Ave. lease rate up 4% • Occupancy rate of
83%
19

3,344 3,615
6,198
9,449
2Q11 2Q12 1H11 1H12
NET INCOME (in million Pesos)
• Revenues up 24% due to: o 9% growth in net interest
income o 51% increase in non-interest
income
• NIMs improved by 14 basis points
• Loan growth from all segments sustained
o Middle Market & SME +19%
o Corporate + 15%
o Consumer + 17%
• Improvement in cost efficiency
• ROE of 21%
In Billion Php June 30, 2012 YoY Growth
Total Resources 899 5%
Deposits 733 6%
AUM 730 +15%
Net Loans 480 + 17%
Selected Ratios June 2012 Dec 2011
30-day NPL 1.4% 1.9%
Cost-to-Income 49.5% 56.2%
Basel II CAR 14.5%
+8% +52%
20

3,344 3,615
6,198
9,449
2Q11 2Q12 1H11 1H12
NET INCOME (in million Pesos)
• Revenues up 24% due to: o 9% growth in net interest
income o 51% increase in non-interest
income
• NIMs improved by 14 basis points
• Loan growth from all segments sustained
o Middle Market & SME +19%
o Corporate + 15%
o Consumer + 17%
• Improvement in cost efficiency
• ROE of 21%
In Billion Php June 30, 2012 YoY Growth
Total Resources 899 5%
Deposits 733 6%
AUM 730 +15%
Net Loans 480 + 17%
Selected Ratios June 2012 Dec 2011
30-day NPL 1.4% 1.9%
Cost-to-Income 49.5% 56.2%
Basel II CAR 14.5%
+8% +52%
21
Manila Water
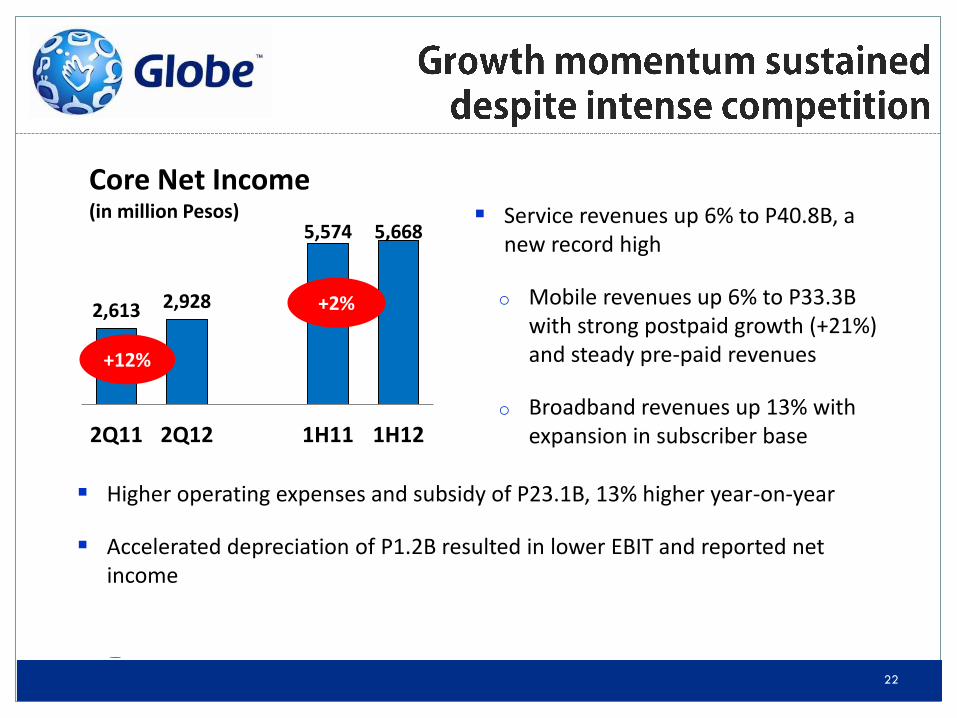
Service revenues up 6% to P40.8B, a new record high
o Mobile revenues up 6% to P33.3B with strong postpaid growth (+21%) and steady pre-paid revenues
o Broadband revenues up 13% with expansion in subscriber base
2,613 2,928
5,574 5,668
2Q11 2Q12 1H11 1H12
Core Net Income (in million Pesos)
+12%
+2%
Higher operating expenses and subsidy of P23.1B, 13% higher year-on-year
Accelerated depreciation of P1.2B resulted in lower EBIT and reported net income
22

Manila Water
Mobile subscribers increased by 12% year-on-year with strong growth across all brands
272 317
1,021 1,267
1H 2011 1H 2012
Wireless
DSL
1,293
1,584
Broadband Subscribers (in ‘000)
+22%
Subscribers by Brand (in Thousand SIMs)
1H12 YoY
Globe Postpaid 1,600 28%
Globe Prepaid 16,110 9%
TM 14,017 12%
Totals 31,726 12%
Broadband subscribers grew by 22% with quarterly gross additions at new all-time high
Continued launch of products and services that
provide differentiated customer experience
23
1H12 1H11 %
Change
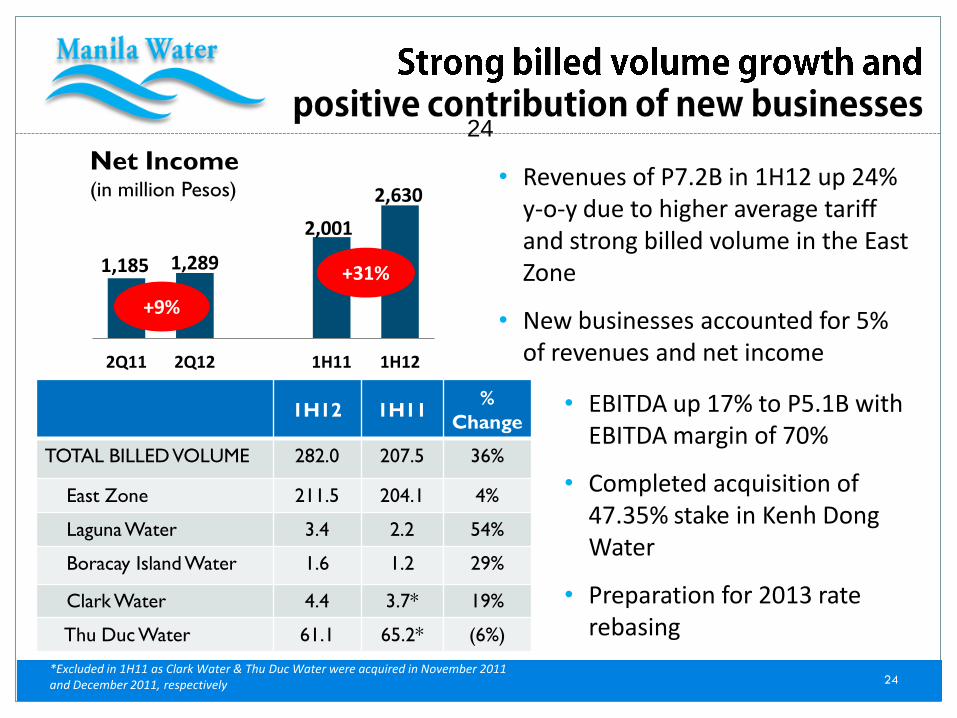
TOTAL BILLED VOLUME 282.0 207.5 36%
East Zone 211.5 204.1 4%
Laguna Water 3.4 2.2 54%
Boracay Island Water 1.6 1.2 29%
Clark Water 4.4 3.7* 19%
Thu Duc Water 61.1 65.2* (6%)
Net Income (in million Pesos)
1,185 1,289
2,001
2,630
2Q11 2Q12 1H11 1H12
+9%
+31%
• EBITDA up 17% to P5.1B with EBITDA margin of 70%
• Completed acquisition of 47.35% stake in Kenh Dong Water
• Preparation for 2013 rate rebasing
• Revenues of P7.2B in 1H12 up 24% y-o-y due to higher average tariff and strong billed volume in the East Zone
• New businesses accounted for 5% of revenues and net income
*Excluded in 1H11 as Clark Water & Thu Duc Water were acquired in November 2011 and December 2011, respectively
24
24
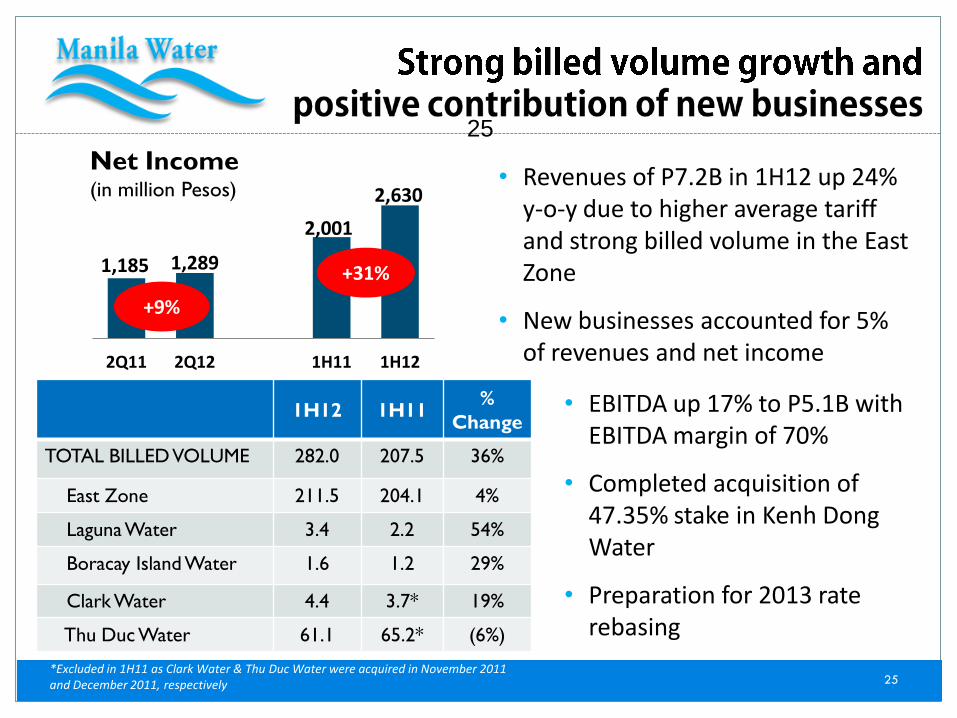
1H12 1H11 %
Change
TOTAL BILLED VOLUME 282.0 207.5 36%
East Zone 211.5 204.1 4%
Laguna Water 3.4 2.2 54%
Boracay Island Water 1.6 1.2 29%
Clark Water 4.4 3.7* 19%
Thu Duc Water 61.1 65.2* (6%)
Net Income (in million Pesos)
1,185 1,289
2,001
2,630
2Q11 2Q12 1H11 1H12
+9%
+31%
• EBITDA up 17% to P5.1B with EBITDA margin of 70%
• Completed acquisition of 47.35% stake in Kenh Dong Water
• Preparation for 2013 rate rebasing
• Revenues of P7.2B in 1H12 up 24% y-o-y due to higher average tariff and strong billed volume in the East Zone
• New businesses accounted for 5% of revenues and net income
*Excluded in 1H11 as Clark Water & Thu Duc Water were acquired in November 2011 and December 2011, respectively
25
25
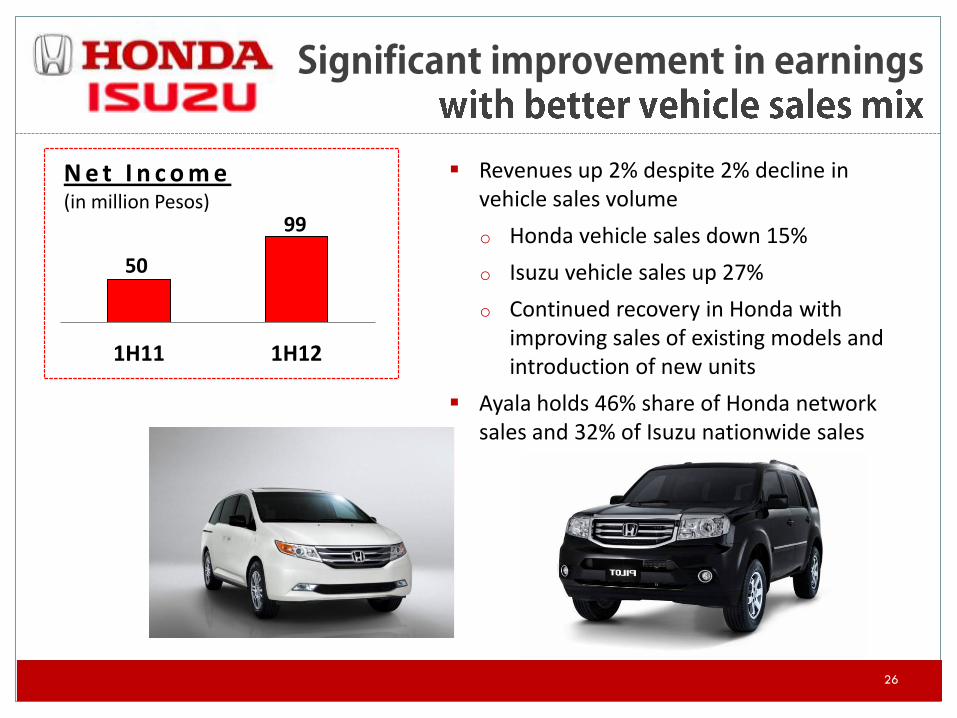
50
99
1H11 1H12
N e t I n c o m e (in million Pesos)
Revenues up 2% despite 2% decline in vehicle sales volume
o Honda vehicle sales down 15%
o Isuzu vehicle sales up 27%
o Continued recovery in Honda with improving sales of existing models and introduction of new units
Ayala holds 46% share of Honda network sales and 32% of Isuzu nationwide sales
26

1.1
3.1
1H11 1H12
Net Income (in million US$) 1H12 revenues grew by 24% to
US$326M due to full-year impact of EPIQ acquisition
EBITDA improved by 22% y-o-y to US$16M with reduced operating expenses
Net income growth brought about by lower selling & admin expenses
Sales mix is 83% turnkey and 17% consignment
77
143
0
42
80
135
86
25
Phils China Europe PSi
1H11
1H12
Revenues (in million US$)
+ 173%
27

$152.3 $166.2
1H 2011 1H 2012
9% YoY growth
Share of Revenues (In USD Millions)
$10.4 $13.1
1H 2011 1H 2012
26% YoY growth
Share of EBITDA (In USD Millions)
• Share of Revenues of $166.2, up 9% year-on-year
• Share of EBITDA of US$13M up 26% due primarily to improved profitability at Stream and Affinity Express.
28
28
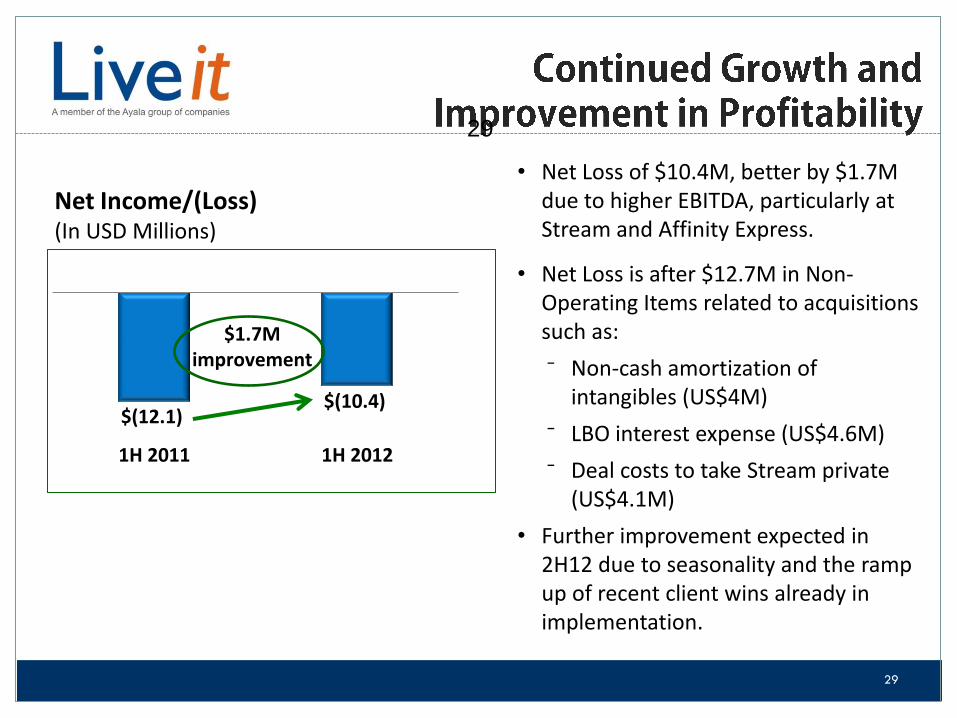
$(12.1) $(10.4)
1H 2011 1H 2012
$1.7M improvement
Net Income/(Loss) (In USD Millions)
• Net Loss of $10.4M, better by $1.7M due to higher EBITDA, particularly at Stream and Affinity Express.
• Net Loss is after $12.7M in Non- Operating Items related to acquisitions such as:
⁻ Non-cash amortization of intangibles (US$4M)
⁻ LBO interest expense (US$4.6M)
⁻ Deal costs to take Stream private (US$4.1M)
• Further improvement expected in 2H12 due to seasonality and the ramp up of recent client wins already in implementation.
29
29
30
Sustained growth momentum of core businesses
International businesses continue to improve
Expanding and executing on new businesses
Strong funding capacity with flexibility to scale up investments