I I I I f\ 'll I I I I I I core Lab PETROLEUM SERVICES CORE LABORATORIES AUSTRALIA PTV L TO 447,449 Belmont Ave, Kewdale. Perth WA 6105 Tel: 16181 9353 3944 Fax: 161 8) 9353 1369 Email: [email protected]Reservoir Fluid Analysis of Sub-Surface Samples from Thylacine - 1 Otway Basin, Prepared for Woodside Energy Limited October 2001 File: AFL 2001-028 ReseNoir Fluid laboratory Core laboratories Australia Ply ltd Perth Western Australia I' I These analyses, opinions or interpretations are based on observations and materials supplied by the client to whom, and for whose exclusive and confidential use, this report is made. The interpretations or opinions expressed represent the best judgment of Core Laboratones, (all errors and omissions excepted); but Core Laboratories and its officers and employees, assume no responsibility and make no warranty or representations, as to the productivitY, proper operations, or profitableness of any oil gas or other mineral well or sand in connection with which such report is used or relied upon.
ReseNoir Fluid laboratoryCore laboratories Australia Ply ltd
PerthWestern Australia
I'I
These analyses, opinions or interpretations are based on observations and materials supplied by the client to whom, and for whose exclusiveand confidential use, this report is made. The interpretations or opinions expressed represent the best judgment of Core Laboratones, (allerrors and omissions excepted); but Core Laboratories and its officers and employees, assume no responsibility and make no warranty orrepresentations, as to the productivitY, proper operations, or profitableness of any oil gas or other mineral well or sand in connection withwhich such report is used or relied upon.
1
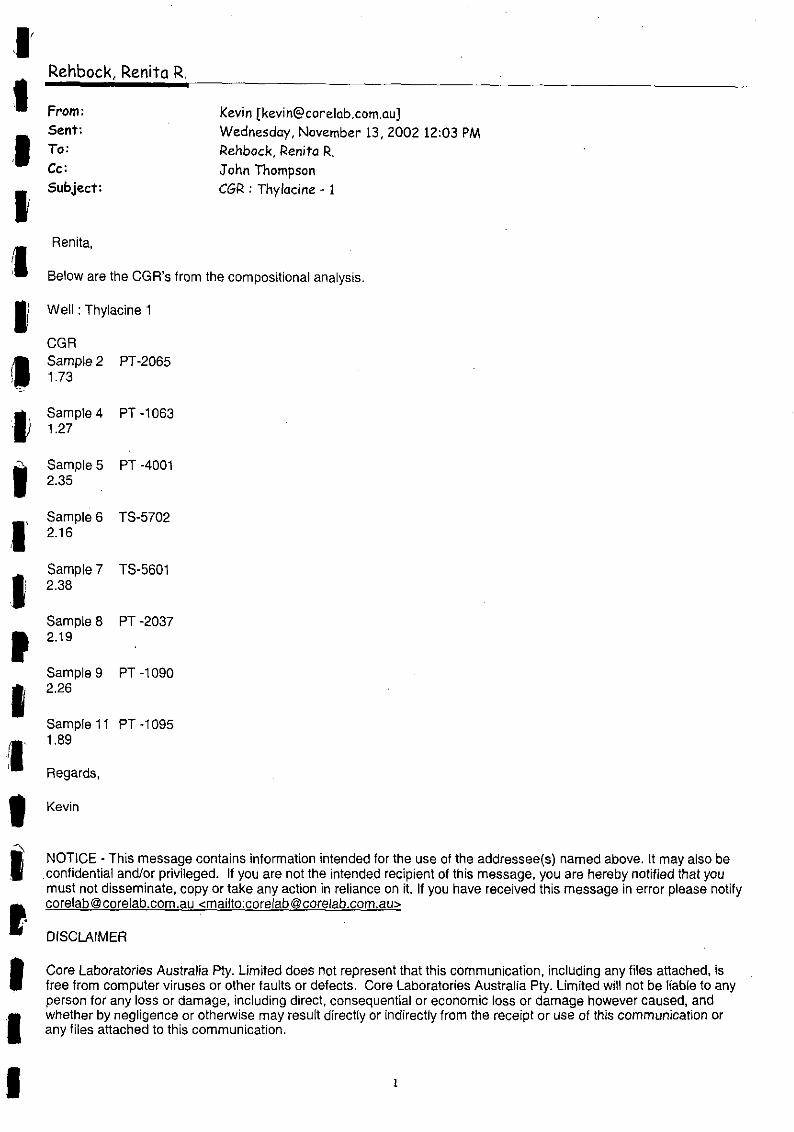
Kevin
DISCLAIMER
Regards,
Kevin [[email protected]]Wednesday, November 13, 2002 12:03 PMRehback, Renita R.John ThompsonCGR : Thylacine - 1
Renita,
Rehbock, Renita R.
From:Sent:To:Cc:
Subject:
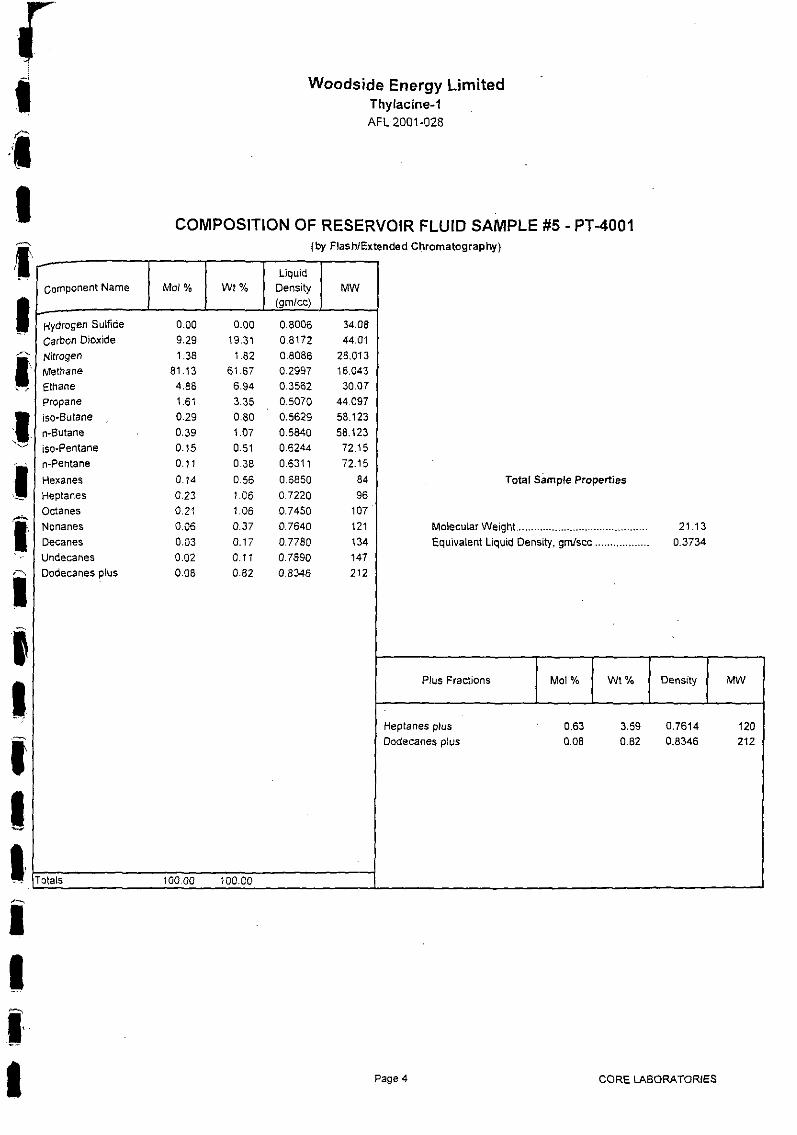
Sample 5 PT -40012.35
Wei! : Thylacine 1
Below are the CGR's from the compositional anaiysis.
CGRSample 2 PT-20651.73
Sample 4 PT -10631.27
Sample 6 TS-57022.16
Sample 11 PT -10951.89
Sample 7 TS-56012.38
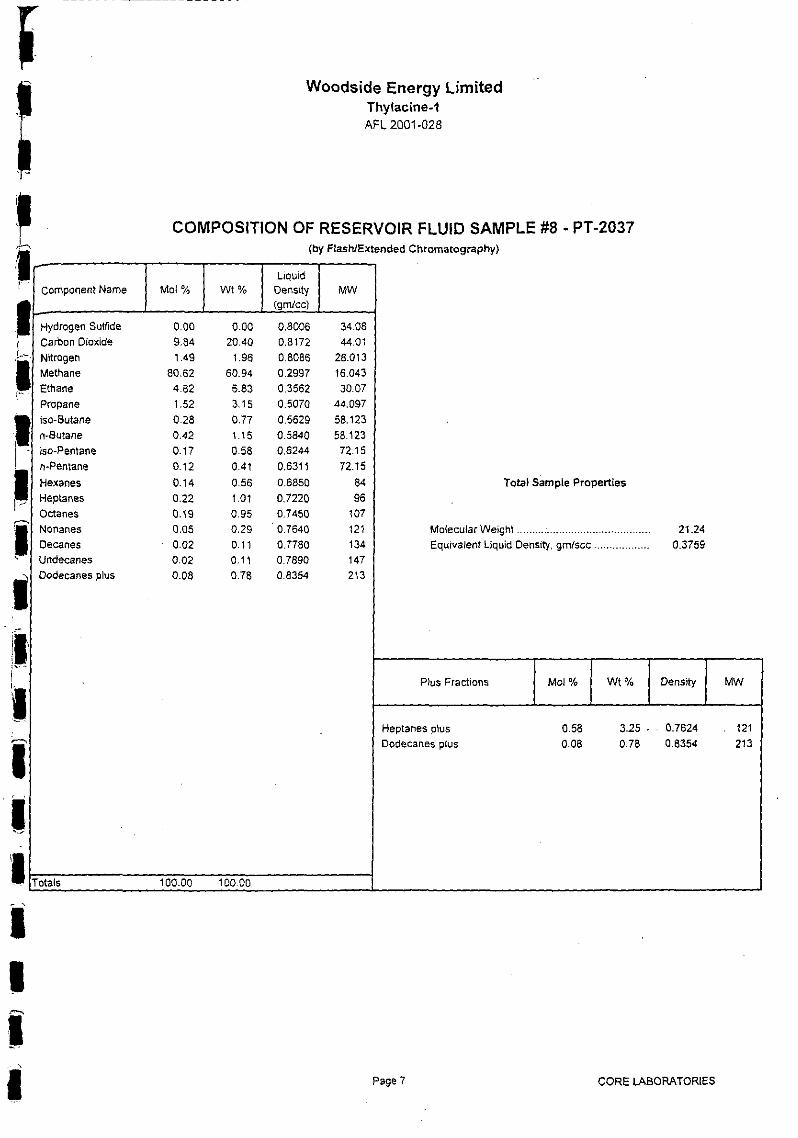
Sample 8 PT -20372.19
Sample 9 PT -10902.26
Core Laboratories Australia Pty. Limited does not represent that this communication, including any files attached, isfree from computer viruses or other faults or defects. Core Laboratories Australia Pty. Limited will not be liable to anyperson for any loss or damage, including direct, consequential or economic loss or damage however caused, andwhether by negligence or otherwise may result directly or indirectly from the receipt or use of this communication orany files attached to this communication.
NOTICE - This message contains information intended for the use of the addressee(s) named above. It may also be.confidential and/or privileged. If you are not the intende.d recipient of this message, you are hereby notified that youmust not disseminate, copy or take any action in reliance on it. If you have received this message in error please [email protected] <maillo:[email protected]>
,II
I,II:1I
i'tj
I'I,II',j,III
ABN 67 065 540 838PO Box 785 Cloverdale, 6985 Western Australia Tel; (61 8) 9353 3944 Fax: (6lB) 9353 1369 Email: [email protected]
Core Laboratories Australia Pty ltd' appreciates this opportunity to be of service to WoodsideEnergy limited. Should you have any questions regarding this report, or if we may be of any furtherassistance, please feel free to contact me at your convenience.
Several sub-surface MDT samples, collected on the Thylacine-1 well, were shipped to our Perthlaboratory for validity checks and use in a reservoir ftuid analysis study. Presented in the followingreport are the results of these analyses.
Woodside Energy Limited1 Adelaide TerracePerthWestern Australia, 6000
19 October, 2001
SUbject:Well:Location:File:
Dear Werner,
Yours Faithfully,For CORE LABORATORIES AUSTRALIA PTY LTO
~evin R Oaken/ .Laboratory Supervisor
A\Core Lab
PETROLEUM SERVICES
i\
"I
'I;,IiIII
I'tt:1IifI'I'ta'IIII
r'ItII,IIIf,I,tII'1\
IIIfII,I
Woodside Energy LimitedThylacine-1AFL 2001-028
TABLE OF CONTENTS
Laboratory Procedures
Sample Validity Checks
Compositional Analyses ofMDT Gas Samples
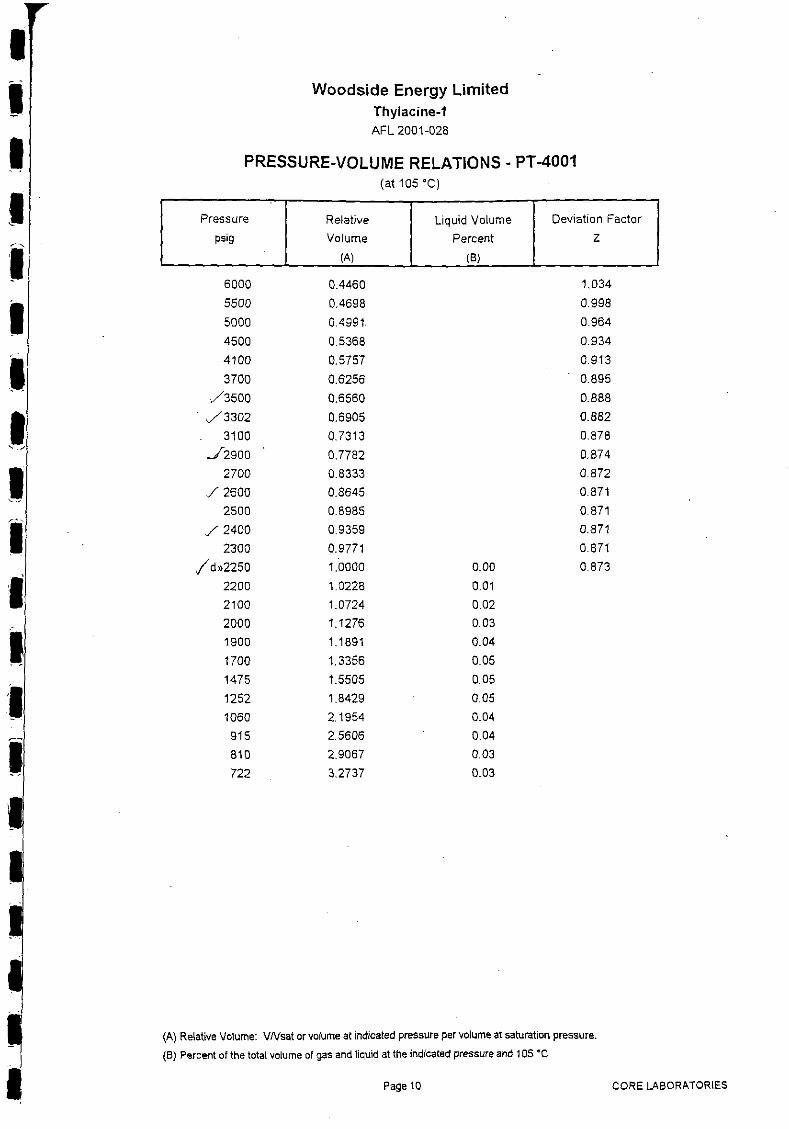
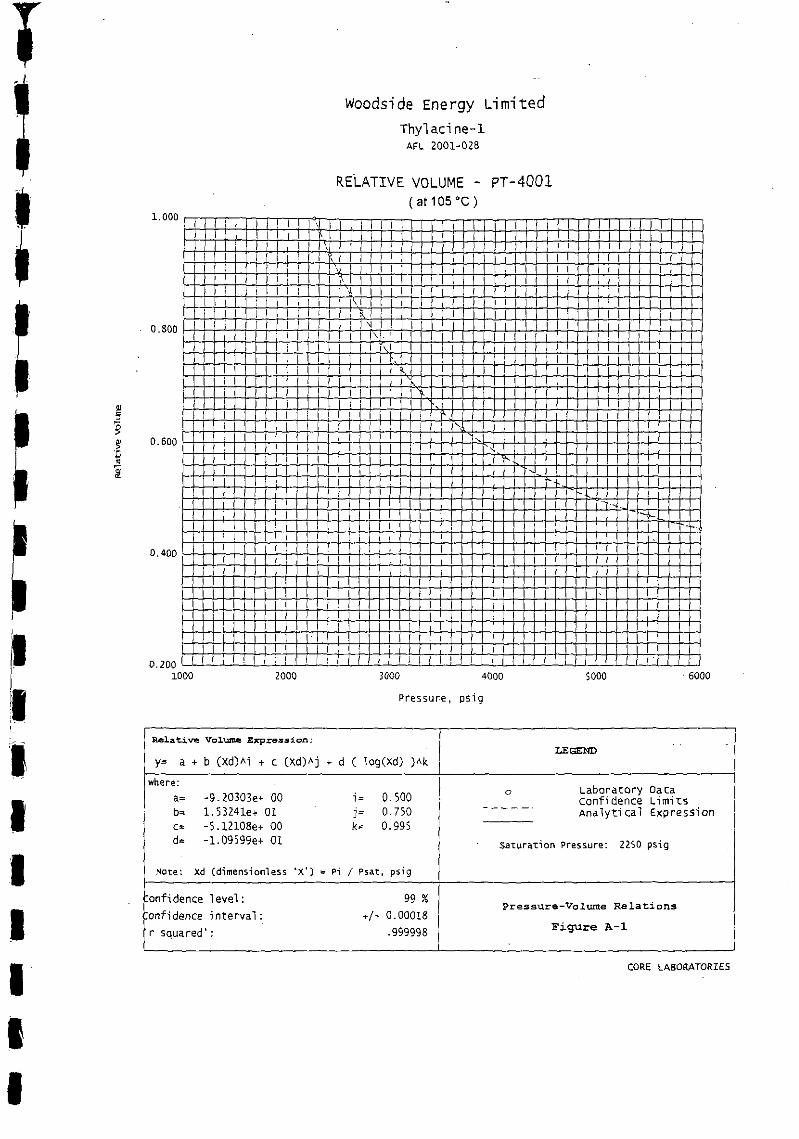
Pressure Volume Relations - PT-4001
Pressure Volume Relations - TS-5702
Water/Filtrate Analysis
Calculated Formation Water Concentrations
Formation Water Calculation Correspondence
LIST OF FIGURES
Pressure-Volume Relations - PT-4001
Relative Volume
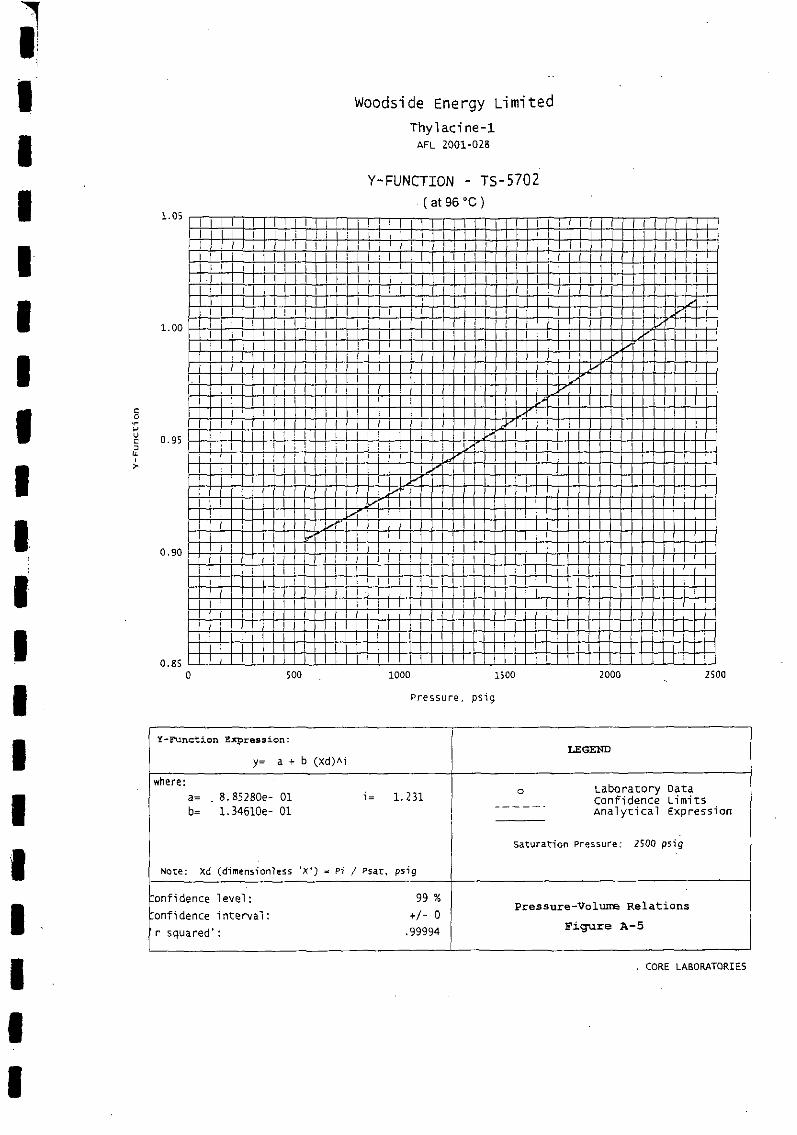
Y - Function
Liquid Phase Volume
Pressure-Volume Relations - TS-5702
Relative Volume
Y - Function
Liquid Phase Volume
a-b
2-9
10
11
12
13
Appendix
A-1
A-2
A-3
A-4
A-5
A-6
Pressure Volume Relations
LABORATORY PROCEDURES
Compositional Analysis
Sample Receipt and Validation
CORE LA .. ''lATORIESPage a
Note: Processing of the flashed liquid chromatograms revealed low level contaminationfrom the synthetic oil based drilling fluid.
After some consideration, Woodside advised that an additional constant composition expansionprocedure be performed on sample PT-2065. As this sample had already been shipped forGeochemistry analysis, sample TS-5702 was subsequently selected for analysis.
A known volume of the PT-4001 reservoir fluid sample was charged to the large volume Sioanetype, high-pressure visual cell and thermally expanded to 105°C. Once equilibrated in single phase,the fluid was then SUbjected to the constant composition expansion procedure. During thisprocedure, a trace of liquid was observed at 3155 psig. During subsequent pressure stages, thisliquid level remained very constant (indicating probable contamination from the drilling fluid) until2250 psig where a significant increase in retrograde liquid volume indicated the dew point for thereservoir gas. The pressure volume relations and a retrograde liquid curve were then completedwith the resulting volumetric data, pressure volume relation and retrograde liquid measurementspresented on page 10. Graphical representations are depicted in figures A-1 through A-3.
The hydrocarbon compositions of the reservoir fluid samples were determined by flash/separationtechniques where a fluid sub-sample was flashed at 120°F and separated into liquid and gasphases. Flashed gas was analysed by gas chromatography using the GPA 2286 method and theflash liquid by temperature programmed capillary chromatography. These flash compositions werethen mathematically recombined to the measured flash gas-liquid ratio and the original reservoirfluid composition was calculated. The resulting reservoir fluid compositions are reported on pages2 through 9. The sample in cylinder PT-4001 was selected for PVT analysis.
Woodside Energy LimitedThylacine-1AFL 2001-028
Ten MDT samples (eight gas and two water) were received in our Perth laboratory for use in acompositional and PVT analysis study. As a preliminary quality check, the opening pressure ofeach sample was determined and compared to field shipping data. The results, summarised onpage 1, indicated that all samples were reasonably consistent with reported shipping conditions andwere therefore selected for compositional analysis.
A known volume of the reservoir fluid sample was charged to the Sloane-type cell and thermallyexpanded to 96°C, equilibrated in single phase and subjected to the constant compositionexpansion procedure. Again, a constant trace of (contamination) liquid was observed from 3500psig until 2500 psig where the significant increase in retrograde liquid volume indicated dew pointfor the reservoir gas. The pressure volume relations and a retrograde liquid curve were thencompleted with the resulting volumetric data, pressure volume relation and retrograde liquidmeasurements presented on page 11. Graphical representations are depicted in figures A-4through A-6.
rI",IaII)
I:1:tIaIaIIII'II,,I,
Using the measured chemical compositions for the drilling fiuid filtrate sample and the water samplefrom cylinder PT-4006, formation water concentrations were calculated using two methods. Theresults of these calculations are summarised on page 13 with a more detailed calculation outlineshown in the correspondence included in the Appendix.
Atmospheric sub-samples were collected from the two pressurised MDT water samples. Since thedrilling fiuid contained Thiocyanate tracer, two small filtrate samples were also provided. Each ofthese samples was subjected to a series of standard water analysis tests and determination of theThiocyanate content was performed. The results of these analyses are presented on page 12.
.'"
IIIt.,II'./
,I;,'II;~
ItIIit
"
I'1I!
~""
Woodside Energy LimitedThylacine-1AFL 2001-028
LABORATORY PROCEDURES (contl-)·
Water/Filtrate Analysis
Page b CORE LABORATORIES
.......' ,,'- '--__. \'.J
Woodside Energy LimitedThylaclne-1AFL 2001·028
PRELIMINARY QUALITY CHECKSof Gas Samples Received in Laboratory
(2) Based on atomic weights, 44,000 ppm K will combine with about 40,000 C1. From Jon'sinformation, there is 59,000 Cl, so the remajning 19,000 is combining with something else, mostlikely Na.
(3) We have to convert 115,000 ppm to mgll to work with the water analyses we provided. You dothis by dividing by specific gravity - should be about 1.08 for this concentration. So 115,000 ppmdivided by 1.08 is around 106,000 mgll.
(7) Total concentration of water from PT-4006 is 43,000 mgll (if you add up analysed constituents·notTDS).
(5) Assuming K is in very low concentrations in the formation water (normally a safe bet) then let'stake the least contaminated sample PT-4006 at 2344.5 mahRT. .
(4) Ratio the individual ionic concentrations and keep atomic weight balances and you havesomething like 40,000 K; 55,000 CI and 11,000 Na.
(6) Since original mud salt concentration was about 106,000 mgll, then this 34,021 is contained in(34,0211106,000) x 1,000 = 321cm3 of solution.
Therefore 43,000 - 34,021 mg is contained in 1,000 - 321 cm3 of solution. That is 8979 mg of
formation water salt in 679 cm3 of solution.
Therefore concentration offormation brine is:
On the resistivity chart this equates to 115,000 ppm NaCI soln. At the K concentration given, K isabout 1: 1 with Na, so 115,000 ppm total is reasonable.
'This contains 13,000 K - which combines with 11,833 C1. Total 24,833 KCl. However, some NaCIin mud filtrate also, ratio is 1.37 (115,000/84,000 from (2) above). So 24,833 x 1.37 =34,021 mgllof the salt concentration comes from mud filtrate contamination.
"(\'YI3Cine Formation Brine Concentration
IIIIIIIIeIIIII ~
r~_
IIIIIII
tor? 1101VO\ 4:'0 PM
IYlacine Formation Brine Concentration
IIIIIIf')IIII
Ie)IIIIIII
20f2
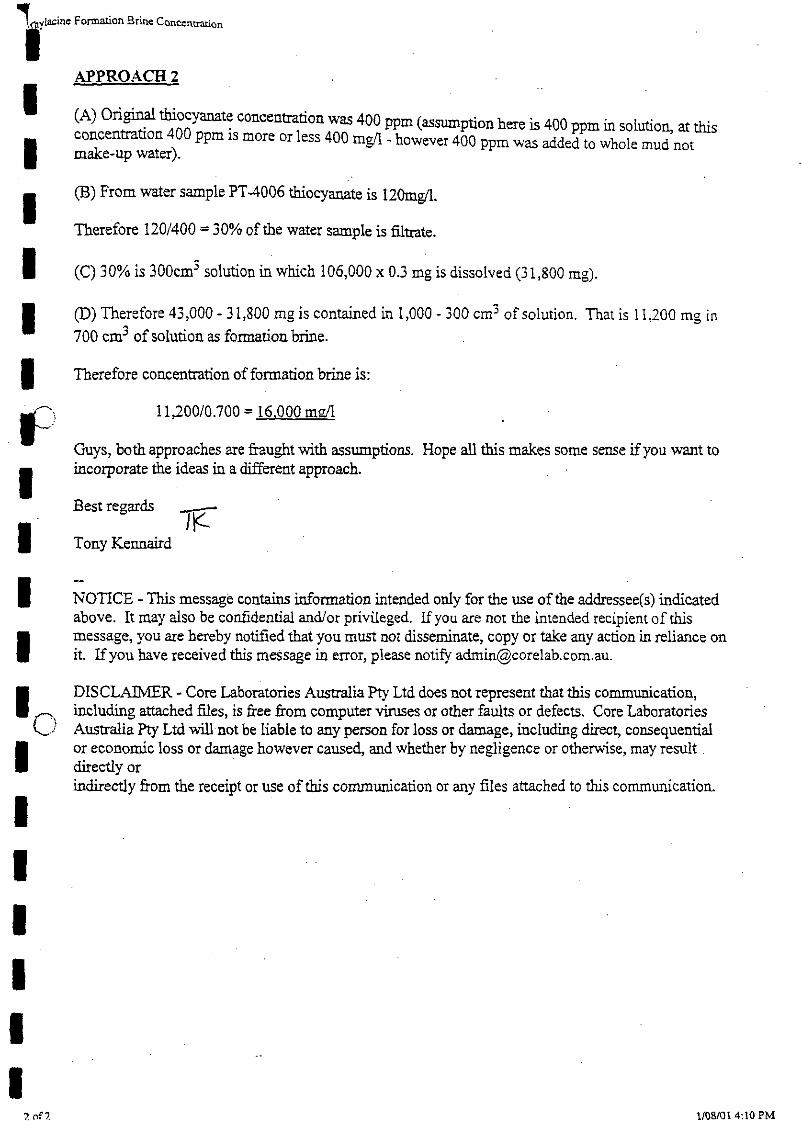
APPROACH 2
(A) Ori~ thiocyanat: concentration was 400 ppm (assumption here is 400 ppm in solution, at thisconcentration 400 ppm IS more or less 400 mg/l- however 400 ppm was added to whole mud notmake-up water).
(B) From water sample PT-4006 thiocyanate is 12Omg/l.
Therefore 120/400 = 30% of the water sample is filtrate.
(C) 30% is 300cm3 solution in which 106,000 x 0.3 mg is dissolved (31,800 mg).
(D) Therefore 43,000 - 31,800 mg is contained in 1,000 - 300 cm3 of solution. That is 11,200 mg in
700 cm3 of solution as formation brine.
Therefore concentration of formation brine is:
11,200/0.700 =16,000 mg/J.
Guys, both approaches are fraught with assumptions. Hope all this makes some sense ifyou want toincorporate the ideas in a different approach.
Best regards 1~
Tony Kennaird
NOTICE - This message contairIs information intended only for the use ofthe addressee(s) indicatedabove. It may also be confidential andlor privileged. ]fyou are not the intended recipient of thismessage, you are hereby notified that you must not disseminate, copy or take any action in reliance onit. lfyou have received this message in error, please notify [email protected].
DISCLAIMER - Core Laboratories Australia Pty Ltd does not represent that this communication,including attached files, is free from computer viruses or other faults or defects. Core LaboratoriesAustralia Pty Ltd will not be liable to any person for loss or damage, including direct, consequentialor economic loss or damage however caused, and whether by negligence or otherwise, may resultdirectly or .indirectly from the receipt or use of this communication or any files attached to this communication.