Coriolis Effect on Dynamic Stall in a Vertical Axis
Wind Turbine at Moderate Reynolds Number
Hsieh-Chen Tsai∗ and Tim Colonius†
California Institute of Technology, Pasadena, CA 91125, USA
The immersed boundary method is used to simulate the flow around a two-dimensionalrotating NACA 0018 airfoil at sub-scale Reynolds number in order to investigate the sep-arated flow occurring on a vertical-axis wind turbine. The influence of dynamic stall onthe forces is characterized as a function of tip-speed ratio. The influence of the Corioliseffect is also investigated by comparing the rotating airfoil to one undergoing a equiva-lent planar motion, which is composed of surging and pitching motions that produce anequivalent speed and angle-of-attack variation over the cycle. When the angle of attack ofa rotating airfoil starts to decrease in the upwind half cycle, the Coriolis force leads to awake-capturing phenomenon of a vortex pair at low tip-speed ratio. This effects occurs ata slightly different phase in each cycle and leads to a significant decrease in the averagelift during the downstroke phase. Moreover, the wake-capturing is only observed when thecombination of surging, pitching, and Coriolis force are present. Finally, an actuator modelis placed at an appropriate location on the suction side of the airfoil surface to control thewake-capturing phenomenon. Based on preliminary simulations, a momentum coefficientabove 0.02 was able to increase the average lift by more than 70% over the upwind-halfcycle.
Nomenclature
c airfoil chord lengthCL lift coefficient, ( L
12ρW
2instc
)
Cµ momentum coefficient of the actuator, (u2jet∆x12U
2∞c
)
k reduced frequency, (Ωc/(2U∞) = λ/(2`))p pressureR radius of the turbineRe Reynolds Number, (U∞c/ν)Ro Rossby Number, (U∞/(2Ωc) = `/(2λ))u velocity of the fluid in the rotating frame of referenceu′ velocity introduced by the change of variablesujet average velocity of the jet injected by the actuatorU∞ freestream velocityW incoming velocityx position vector in the rotating frame of referenceα angle of attackα pitch rateδ spatial distribution of the bodyforce actuationλ tip-speed ratioν fluid kinematic viscosityρ fluid density
θ azimuthal angleω vorticity of the fluid in the rotating frame of referenceω′ vorticity introduced by the change of variables∆t time step∆x grid spacingΩ angular velocity of the turbine` ratio of the radius of the turbine to the chord length, (R/c)
Subscripts
avg average velocityinst instantaneous velocitymax maximumsin sinusoidal variationsurge surge velocityEPM the equivalent planar motionSPM the sinusoidal pitching motionSSPM the sinusoidal surging-pitching motionVAWT vertical axis wind turbine
I. Introduction
Vertical axis wind turbines (VAWT) offer several advantages over horizontal axis wind turbines (HAWT),namely: their low sound emission (consequence of their operation at lower tip speed ratios), their insensi-tivity to yaw wind direction (because they are omnidirectional), and their increased power output in skewedflow.1,2 Dabiri et al.3,4 investigated the use of counter-rotating VAWTs in order to achieve higher poweroutput per unit land area and smaller wind velocity recovery distance than existing wind farms consisting ofHAWTs. In the present study, a two-dimensional VAWT is investigated numerically at sub-scale Reynoldsnumber in order to understand its aerodynamics for the purpose of improving its efficiency and lift generation.
Dynamic stall refers to the delay in the stall of airfoils that are rapidly pitched beyond the static stallangle. It is associated with a substantially higher lift than is obtained quasi-statically. Due to the largevariation in angle of attack, dynamic stall occurs on VAWT operating at low tip speed ratios.5 Furthermore,the pinch off of the dynamic stall vortex (leading-edge vortex, LEV) causes a sudden decrease in the lift, arapid increase in the drag, and a nose-down pitching moment.6,7
We focus here on the Coriolis effect on dynamic stall in a VAWT in present study. The influence of theCoriolis effect on the dynamic stall is investigated by comparing the rotating airfoil to one undergoing aequivalent planar motion, which is composed by a surging and pitching motion that produces an equivalentspeed and angle-of-attack variation over the cycle. The influence of dynamic stall on forces is characterizedas a function of tip-speed ratio. Moreover, inspired by Wang et al.,8 airfoils undergoing a sinusoidal pitchingmotion and a sinusoidal surging-pitching motion are also compared to see if these two motions can be anappropriate model for the VAWT.
Several attempts have been made to model a VAWT at Rec ∼ O(105), which is appropriate to the urbanapplications of VAWTs, using Unsteady Reynolds-Average Navier-Stokes (URANS) with different turbulencemodels by investigating a 2D airfoil undergoing an effective motion9–11 and simulating a multi-bladed 2DVAWT.12,13 Wang et al.8 focused on investigating the dynamic stall in a VAWT numerically by studyingan 2D airfoil undergoing the effective sinusoidal pitching motion. The results have a good agreement withexperiments.7,15–17 Ferreira et al.14 simulated dynamic stall in a section of a VAWT using Detached EddySimulation (DES) at Rec = 50, 000 and validated the results by comparing the vorticity in the rotor areawith particle image velocimetry (PIV) data.
2 of 18
American Institute of Aeronautics and Astronautics
Dow
nloa
ded
by T
im C
olon
ius
on J
uly
31, 2
015
| http
://ar
c.ai
aa.o
rg |
DO
I: 1
0.25
14/6
.201
4-31
40
Active flow control can be used to improve performance of VAWT. Hwang et al.18 applied an individualactive blade control system to change the pitch angles of the blades individually according to the incomingwind velocity and its azimuthal angles. They were able to improve the power output by 60% comparingwith one with fixed pitch airfoils. Greenblatt et al.19 controlled dynamic stall on a double-bladed VAWTusing pulsed dielectric barrier discharge (DBD) plasma actuators in a feed-forward control configuration.Based on choosing appropriately a duty cycle and a range of azimuthal angles of plasma actuation initia-tion and termination, they was able to achieve a net power increase of more than 10%. Inspired by theirwork, we perform an open loop control of dynamic stall vortices by placing an actuator on the suction surface.
In order to explore the parametric space in relatively short computational time and have more understand-ing of the details of the vortex dynamics, flows are simulated at moderate Reynolds number (Rec ∼ O(103))using the immersed boundary projection method. A major limitation of our present approach is the restric-tion of flow to a two-dimensional cross section of an otherwise planar turbine geometry. We believe that theresults will be qualitatively relevant to three-dimensional flows at higher Re, but precise comparisons awaitfuture simulations.
II. Simulation setup and numerical method
Figure 1 shows the schematic of a VAWT. With a freestream velocity, U∞, coming from the left, a VAWTwith a radius R is rotating at an angular velocity Ω. The chord length of the turbine blade is c. In order tosystematically investigate the aerodynamics of a VAWT, three dimensionless parameter are introduced:
tip-speed ratio: λ =ΩR
U∞, (1)
radius-to-chord-length ratio: ` =R
c, (2)
Reynolds number: Re =U∞cν
, (3)
Rossby number: Ro =U∞2Ωc
=`
2λ=
1
4k, (4)
where ν is the kinematic viscosity of the fluid and k is the reduce frequency, k = Ωc2U∞
= λ2` .
The instantaneous incoming velocity Winst and the angle of attack α then can be characterized as afunction of the tip speed ratio λ and the azimuthal angle θ:
α(λ, θ) = tan−1
(sin θ
λ+ cos θ
), (5)
Winst(λ, θ)
U∞=√
1 + 2λ cos θ + λ2 . (6)
igure 2 shows the angle of attack variation and incoming velocity variation of the VAWT at λ = 2. Fromequation (5), the maximum angle of attack,
αmax(λ) = tan−1
(1√
λ2 − 1
), (7)
occurs at θ = − cos(
1λ
).
In order to isolate the Coriolis effect on dynamic stall, a moving airfoil experiencing an equivalent incomingvelocity and angle-of-attack variation over a cycle is proposed. This equivalent planar motion (EPM) iscomposed of a surging motion with a velocity Wsurge and a pitching motion around the leading edge witha pitch rate α. The airfoil is undergoing the EPM in a freestream velocity Wavg. Wavg, Wsurge, and α are
3 of 18
American Institute of Aeronautics and Astronautics
Dow
nloa
ded
by T
im C
olon
ius
on J
uly
31, 2
015
| http
://ar
c.ai
aa.o
rg |
DO
I: 1
0.25
14/6
.201
4-31
40
shown to be
Wavg(λ) =1
2π
∫ 2π
0
Winst(λ, θ) dθ =U∞2π
∫ 2π
0
√1 + 2λ cos θ + λ2 dθ (8)
Wsurge(λ, θ) = Winst(λ, θ)−Wavg(λ) (9)
α(λ, θ) =1
2Ro
(1 + λ cos θ
1 + 2λ cos θ + λ2
)(10)
Moreover, due to the periodic oscillation of angle of attack and incoming velocity variation, Wang etal.8 studied dynamic stall in a VAWT by investigating an airfoil undergoing a simplified sinusoidal pitchingmotion. Inspired by their work, sinusoidal variations in the angle of attack and incoming velocity, whichare written as a function of the tip speed ratio λ and the azimuthal angle θ in equations (11) and (12) andshown in figure 2, are also considered:
αsin(λ, θ) = αmax(λ) sin θ , (11)
Winst,sin(λ, θ)
U∞= λ+ cos θ . (12)
Although the sinusoidal motion shares the same amplitude, it overestimates the angle of attack in the up-stroke phase, underestimates the incoming velocity in the downstroke phase, and slightly underestimatesthe instantaneous velocity over the entire half-cycle. In order to search for the most appropriate modelfor a VAWT, we introduce two additional motions: a sinusoidal pitching motion (SPM) and a sinusoidalsurging-pitching motion (SSPM). Airfoils undergoing both the SPM and SSPM pitch with the sinusoidalangle-of-attack variation described in equation (11) in a freestream velocity Wavg,sin = λU∞. Airfoils under-going the SSPM also surge with a velocity Wsurge,sin = U∞ cos θ.
NACA 0018 airfoils are used as blades in present study. In preliminary simulations of a three-bladedVAWT as well as in previous studies,14 vorticity-blade interaction is only observed in the downwind-half ofa cycle. Because only the flow in the upwind-half cycle is important to torque generation (and to save com-putational time), we use a single-bladed turbine. The immersed boundary projection method developed byColonius et al.20 is used to compute two-dimensional incompressible flows in an airfoil-fixed reference framewith appropriate forces added to the momentum equation to account for the non-inertial reference frameshown in figure 1. The equations are solved on multiple overlapping and progressively coarser grids. Six gridlevels are used for the present computations. Each level has the same number of grid points (600×600), andthe coarsest grid extends to 96 chord lengths in both the transverse and streamwise directions. The ratioof the radius of the turbine to the chord length, `, is chosen to be 6. The time step, ∆tU∞/c, is chosen tomake the CFL number less than 0.4. In order to remove transients associated with the startup of periodicmotion, it was deemed sufficient to compute about five periods of motion. An additional five periods ofstationary-state nearly periodic motion were then computed.
As noted above, we solve the dimensionless momentum equation in the rotating frame of reference
∂u
∂t+ (u · ∇) u = −∇p+
1
Re∇2u− dΩ
dt× x− 2Ω× u−Ω× (Ω× x) , (13)
where u and x are the fluid velocity and the position vector in the rotating frame of reference and Ω = 12Ro is
the dimensionless angular velocity of rotating frame of reference. We then introduce the change of variables
u′ = u + Ω× x (14)
ω′ = ω + 2Ω , (15)
where ω = ∇× u is the vorticity field in the rotating frame of reference. By taking divergence and curl ofequation (13), we will have the following vorticity and pressure equation
∂ω′
∂t= ∇× (u× ω′)− 1
Re∇× (∇× ω′) (16)
∇2
(p+
1
2|u|2 − 1
2|Ω× x|2
)= ∇ · (u× ω′) (17)
4 of 18
American Institute of Aeronautics and Astronautics
Dow
nloa
ded
by T
im C
olon
ius
on J
uly
31, 2
015
| http
://ar
c.ai
aa.o
rg |
DO
I: 1
0.25
14/6
.201
4-31
40
Figure 1. Schematic of a VAWT and the computational domain.
0 60 120 180 240 300 360
−30
−20
−10
0
10
20
30
θ ()
α()
V.A.W.T.
sinusoidal motion
(a) Angle of attack variation
0 60 120 180 240 300 3600
0.5
1
1.5
2
2.5
3
3.5
4
θ ()
Win
st/U
∞
V.A.W.T.
sinusoidal motion
(b) Incoming velocity variation
Figure 2. Comparison of angle of attack variation and incoming velocity variation between the VAWT andthe sinusoidal motion at λ = 2.
5 of 18
American Institute of Aeronautics and Astronautics
Dow
nloa
ded
by T
im C
olon
ius
on J
uly
31, 2
015
| http
://ar
c.ai
aa.o
rg |
DO
I: 1
0.25
14/6
.201
4-31
40
Since the flow is incompressible and two-dimensional, the first term in the right hand side of equation (16) isjust the advection of vorticity with velocity u. Therefore in the body-fixed frame of reference, Coriolis forcedoes not generate vorticity except on the boundary so that it only changes the way vorticity propagates infree space. In the surging-pitching configuration shown in figures 4, since the frame of reference is rotatingclockwise, the Coriolis force deflects the fluid in the clockwise direction. Moreover, because the magnitudeof Coriolis force is proportional to the magnitude of velocity, fluid with high velocity will be deflected morerapidly. The dynamic of vortices could be affected dramatically by Coriolis force because of relatively highfluid local velocity compared to the surrounding values.
III. Results
A. Qualitative flow features in a VAWT
We begin with examining flows at low tip-speed ratio, λ = 2, Ro = 1.5, and Re = 1500, which gives amaximum amplitude of 30 degrees in angle of attack variation and a reduced frequency k = 1/6. Figure3 shows the vorticity field generated by the blade at different azimuthal angles over a cycle. Negative andpositive vorticity are plotted in blue and red contour levels, respectively, and all vorticity contour plots areusing the same contour levels.
At the beginning of a cycle, as shown in figure 3(a), the airfoils just are just returning to zero angleof attack, and there are still the remnants of earlier vortex shedding in the wake. The flow reattaches bythe angle depicted in figure 3(b). When the angle of attack increases further, the wake behind the airfoilstarts to oscillate and vortex shedding commences. We can see the key stages of dynamic stall includinggrowth, pinch-off and advection of an LEV on the suction side in figures 3(c-e). The vortices generated willpropagate downstream into the wake of the VAWT or interact with the blades in the downwind half of a cycle.
When the angle of attack starts to decrease, as shown in figure 3(f), a TEV develops and we observeBloor instability occurs in the trailing-edge shear layer at this Reynolds number. This TEV couples with aLEV forming a vortex pair that travels downstream together with the airfoil as shown in figures 3(g-i). Thisvortex pair interacts with the airfoil in the downwind half of a cycle as shown in figures 3(j-l), which wasalso observed by Ferreira et al.14
When the blade rotates further, the angle of attack becomes negative. Vortices are now generated on theother side of the airfoil as shown in figures 3(m-p), and sheds into the wake of the VAWT. For a multi-bladedVAWT, when a blade is traveling in the downwind half of a cycle, it will interact frequently with the vorticesgenerated upstream from the other blades or even itself. We can observe this trend in our single-bladedVAWT simulation as shown in figure 3(o).
B. Comparison of VAWT and EPM
In this section, we compare flows around an airfoil undergoing the EPM and a single-bladed VAWT at λ = 2,Ro = 1.5, and Re = 1500. We are interested in the tangential force response of the blade over a cycle becausethe power output is proportional to the tangential force acting on the blade when VAWTs operate at a con-stant tip-speed ratio. From preliminary simulations, a three-bladed VAWT with ` = 4 will be free-spinningwith a time-averaged tip-speed ratio λ = 0.95 at Re = 1500 so that in the flow we are examining, theaverage tangential force is expected to be negative. Nevertheless, since the lift and tangential force have thesame trend over a cycle from the preliminary simulations of the free-spinning VAWT, we could alternativelylook at the lift response of the blade. Moreover, from previous studies,14 due to large vorticity-blade inter-actions that cancel out the driving torque in the downwind half cycle, the power of a VAWT is generatedmostly in the upwind half cycle. Therefore in this study, we will focus on the lift in the upwind-half of a cycle.
In figures 4, the first two columns show the vorticity field at different azimuthal angles for EPM andVAWT motion. Figure 5 shows the comparisons of the lift coefficients against dimensionless time and angleof attack for a single rotation and for the average of both lift coefficients over five cycles. Although there arestill the remnants of earlier vortex shedding in the wake when the airfoil just returns to zero angle of attack(figure 4(a)), the flow reattaches by the angle depicted in figure 4(b), which leads to smoothly increasing lift
6 of 18
American Institute of Aeronautics and Astronautics
Figure 3. Vorticity field for a (clockwise rotating) VAWT at various azimuthal angles at λ = 2, Ro = 1.5, andRe = 1500. Negative and positive vorticity are plotted in blue and red contour levels, respectively, and allvorticity contour plots are using the same contour levels.
7 of 18
American Institute of Aeronautics and Astronautics
Dow
nloa
ded
by T
im C
olon
ius
on J
uly
31, 2
015
| http
://ar
c.ai
aa.o
rg |
DO
I: 1
0.25
14/6
.201
4-31
40
coefficients at low angle of attack. The differences in lift coefficients between the EPM and VAWT are smallas shown in figure 5. As the angle of attack increases, dynamic stall commences as shown in figures 4(c-e),which leads to rapidly increasing lift coefficients. Notice that both EPM and VAWT flows are quite similarwith just a small phase difference when the airfoils pitch up; the lift coefficients are similar throughout theupstroke phase.
When the downstroke phase starts (figures 4(e-f)), the development of a TEV leads to a decrease in lift.Bloor instability,21 which seems to resemble the convectively unstable Kelvin-Helmholtz instability observedin plane mixing layers, is observed in the shear layer at the trailing edge and produces high frequency fluc-tuations in the lift coefficient. When the angle of attack decreases further, for EPM, the TEV sheds into thewake and a secondary vortex15 appears (figure 4(g)), which results in a sudden increase in the lift coefficient.On the other hand, for VAWT, as described in section A, this TEV couples with a LEV and forms a vortexpair that travels together with the airfoil (figures 4(g-h)). This generates high pressure on the suction sideand further decreases the lift. This vortex pair seems to be “captured” by the rotating airfoil. By analogywith flow observed in insect flight by Dickinson et al.,22 we refer this phenomenon as the wake-capturing ofvortex pair in a VAWT. The wake-capturing occurs at a slightly different phase in each cycle and leads to asignificant decreases in the average lift in the downstroke phase. In general, the lift of an airfoil undergoingthe equivalent motion is overestimated in the downstroke phase. Moreover, when this vortex pair travelsdownstream, it will interact with the airfoil in the downwind half of a cycle. The lift coefficient will resultin large fluctuations and small mean because of this vorticity-blade interaction, which was also observed byFerreira et al.14
We can see from the second and third columns in figure 4 that the Coriolis force deflects the flow arounda rotating airfoil in clockwise direction. The magnitude of Coriolis force acting on the background fluiddecreases as the azimuthal angle increases. Therefore the Coriolis force acting on the fluid around vorticesbecomes relatively important in the downstroke phase. From figures 4(f-h), a stronger Coriolis force is ex-erted on the fluid around the vortex pair, which deflects the fluid in such a way that the vortex pair travelswith the airfoil.
C. Effect of tip-speed ratio, Rossby number, and Reynolds number
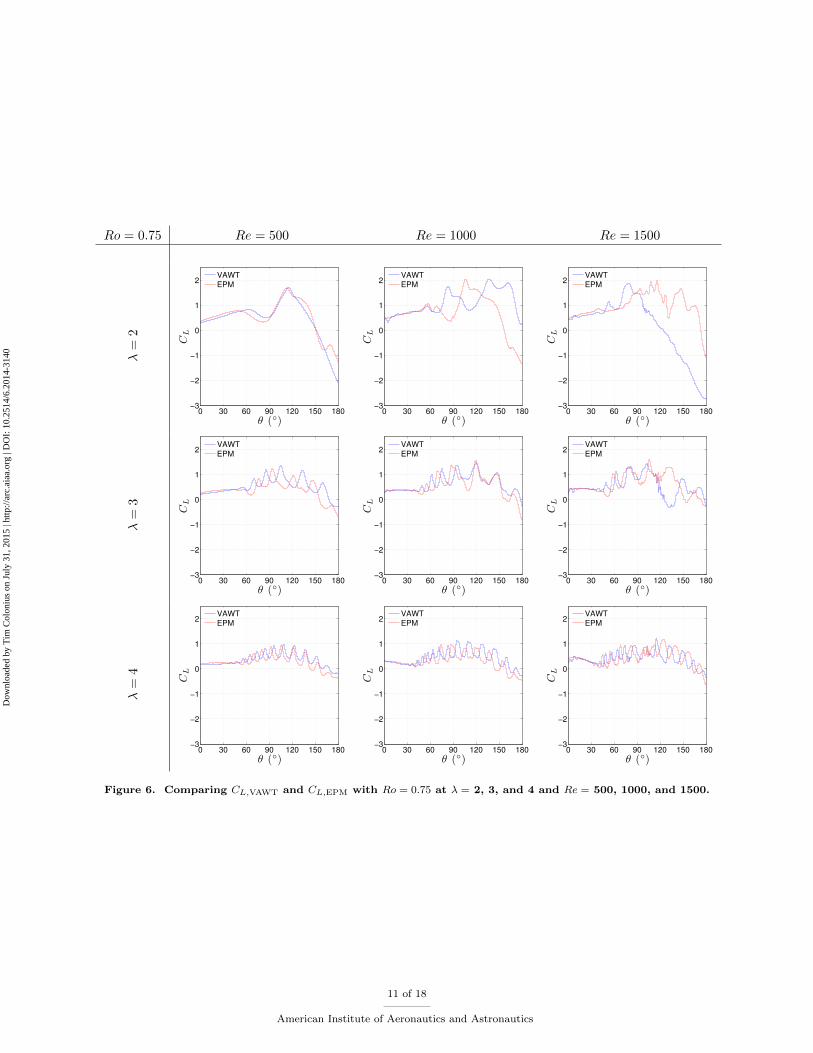
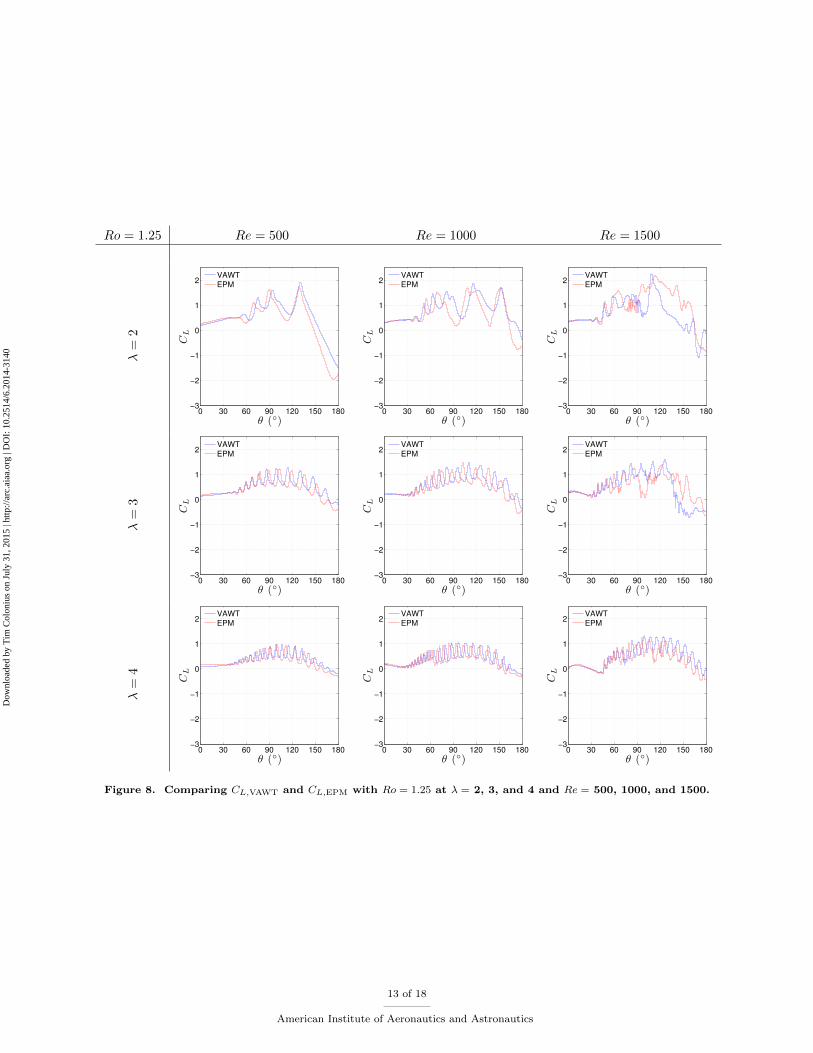
In this section, we examined the flows at tip-speed ratios, λ = 2, 3 and 4, and Reynolds number, Re = 500,1000, and 1500. The corresponding CL,VAWT and CL,EPM in flow with with Rossby number, Ro = 0.75, 1.00,and 1.25 are shown in figures 6, 7, and 8, respectively. As tip-speed ratio increases, the amplitudes of angleof attack variation and the corresponding lift decreases. Furthermore, we can see that the large decrease inCL,VAWT due to wake-capturing of vortex pair occurs in the flows at low tip-speed ratio and higher Reynoldsnumbers. As Rossby number decreases, which corresponds to a larger Coriolis force, this discrepancy in liftcoefficients becomes larger. In preliminary simulations, we have observed this wake-capturing phenomenonfor λ = 2 and Ro = 1.5 at an even higher Reynolds number Re = 4000. Over the range of λ, Ro, and Reconsidered here, such a wake-capturing phenomenon could play a role in three-dimensional flows at higherReynolds number. We can also see that an airfoil undergoing EPM is a good approximation to a rotatingairfoil in a VAWT in upstroke phase for various tip-speed ratios, Rossby number, and Reynolds numbers.However, it overestimates the lift coefficients in the downstroke phase in those cases where wake-capturingoccurs.
To probe the existence of wake-capturing at high Reynolds number, the vorticity field in VAWT (Re =1500) for a single period is compared qualitatively with phase-averaged PIV data from Ferreira et al.14(Re ≈105) at λ = 2 and Ro = 1(` = 4). In figure 9(a), Ferreira et al. filter the phase-averaged vorticity field to plotonly the LEV generated around θ = 72 and overlap its evolutions as the blade travels to various azimuthalangles. Similarly, the filtered phase-averaged TEV evolution is shown in figure 9(c). In order to makequalitatively comparison, in figures 9(b) and 9(d), the vorticity fields in VAWT at corresponding azimuthalangles are overlapped to show the evolution of vortices. From figures 9(b) and 9(d), wake-capturing occursaround θ = 90, which forms a vortex pair traveling with the blade. The vortex pair then detaches aroundθ = 133 and propagates downstream. The evolution of the phase-averaged LEV in figure 9(a) shows similarbehavior. Moreover, at θ = 158, the vortex pair composed of the phase-averaged LEV and TEV seems to
8 of 18
American Institute of Aeronautics and Astronautics
Dow
nloa
ded
by T
im C
olon
ius
on J
uly
31, 2
015
| http
://ar
c.ai
aa.o
rg |
DO
I: 1
0.25
14/6
.201
4-31
40
(a)θ
=0
,
α=
0.
(b)θ
=15 ,
α=
5.
(c)θ
=60 ,
α=
19.
1.
(d)θ
=90 ,
α=
26.
6.
(e)θ
=120 ,
α=
30 .
(f)θ
=15
0,
α=
23.8 .
(g)θ
=16
5,
α=
14.1 .
(h)θ
=18
0,
α=
0.
Figure 4. Vorticity field for EPM and VAWT and the Coriolis force for VAWT at various azimuthal angles.Negative and positive vorticity are plotted in blue and red contour levels, respectively, and all vorticity contourplots are using the same contour levels. In the Coriolis force plots, black arrows show the direction of velocity,blue arrows point the direction of the Coriolis force, and the color contour plots the magnitude of the Coriolisforce.
9 of 18
American Institute of Aeronautics and Astronautics
Dow
nloa
ded
by T
im C
olon
ius
on J
uly
31, 2
015
| http
://ar
c.ai
aa.o
rg |
DO
I: 1
0.25
14/6
.201
4-31
40
0 30 60 90 120 150 180
−2
−1
0
1
2
3
θ ()
CL
VAWT
EPM
(a) The lift coefficients over a cycleagainst dimensionless time.
0 5 10 15 20 25 30
−2
−1
0
1
2
3
α ()
CL
VAWT
EPM
(b) The lift coefficients over a cycleagainst angle of attack.
0 30 60 90 120 150 180
−2
−1
0
1
2
3
θ ()
(CL) a
vg
VAWT
EPM
(c) The average lift coefficients over fivecycles.
Figure 5. Comparing CL,VAWT and CL,EPM at λ = 2, Ro = 1.5, and Re = 1500.
be well captured by the simulation. The qualitative agreement suggests that wake-capturing may also beoccurring in Ferreira et al.’s experiment.
D. Decoupling the effect of surging, pitching, and rotation
The flow around a rotating airfoil in a VAWT is complicated because the angle of attack and incomingvelocity vary simultaneously. In order to have more understanding of this flow, we examine independentlyairfoils undergoing the pitching and surging motion decoupled from EPM and compare their lift responseswith one in VAWT.
1. Airfoil undergoing only surging motion
We examine a surging motion with fixed angles of attack of 15 and 30 degrees at λ = 2, Ro = 1.5 (k = 1/6),and Re = 1500. A rotating airfoil undergoing only the surging motion in VAWT is achieved by pitching theairfoil around the leading edge simultaneously as it rotates so that the angle of attack is fixed with respect tothe incoming velocity. For an airfoil surging at an angle of attack of 15, lift coefficients are shown in figure10(a). We can see that dynamic stall is relatively stable and no wake-capturing phenomenon is observed.Moreover, from the analysis by Choi et al.,23 when the reduced frequency is low enough, the flow can beapproximately quasi-steady, which results in both lift coefficients for VAWT and EPM fluctuating about aslowly increasing mean value. For the case of α = 30, lift coefficients are shown in figure 10(b). The flowis well separated so that there is no stationary vortex shedding. Moreover, no wake-capturing phenomenonis observed in the flow.
2. Airfoil undergoing only pitching motion
We consider a pitching motion in a freestream velocity Wavg = λU∞ at λ = 2, Ro = 1.5 and Re = 1500. Arotating airfoil undergoing only the pitching motion in a VAWT is achieved by rotating an airfoil in a VAWTwithout the external free stream and pitching it around the leading edge with the exact angle of attackvariation simultaneously. The corresponding lift coefficients are shown in figure 11. We can see dynamicstall in both lift coefficients as angle of attack increases. However, there is no wake-capturing.
Table 1 concludes the observations of the wake-capturing phenomenon for all combinations of the motions.No wake-capturing phenomenon is observed in the flow around an airfoil undergoing independent surgingmotion and pitching motions, nor is it observed for the combined pitching and surging associated with EPM.It seems in this flow to be uniquely associated with the combination of pitch, surge, and Coriolis effect.
10 of 18
American Institute of Aeronautics and Astronautics
Dow
nloa
ded
by T
im C
olon
ius
on J
uly
31, 2
015
| http
://ar
c.ai
aa.o
rg |
DO
I: 1
0.25
14/6
.201
4-31
40
Ro = 0.75 Re = 500 Re = 1000 Re = 1500
λ=
2
0 30 60 90 120 150 180−3
−2
−1
0
1
2
CL
θ ()
VAWT
EPM
0 30 60 90 120 150 180−3
−2
−1
0
1
2
CL
θ ()
VAWT
EPM
0 30 60 90 120 150 180−3
−2
−1
0
1
2
CL
θ ()
VAWT
EPM
λ=
3
0 30 60 90 120 150 180−3
−2
−1
0
1
2
CL
θ ()
VAWT
EPM
0 30 60 90 120 150 180−3
−2
−1
0
1
2
CL
θ ()
VAWT
EPM
0 30 60 90 120 150 180−3
−2
−1
0
1
2
CL
θ ()
VAWT
EPM
λ=
4
0 30 60 90 120 150 180−3
−2
−1
0
1
2
CL
θ ()
VAWT
EPM
0 30 60 90 120 150 180−3
−2
−1
0
1
2
CL
θ ()
VAWT
EPM
0 30 60 90 120 150 180−3
−2
−1
0
1
2
CL
θ ()
VAWT
EPM
Figure 6. Comparing CL,VAWT and CL,EPM with Ro = 0.75 at λ = 2, 3, and 4 and Re = 500, 1000, and 1500.
11 of 18
American Institute of Aeronautics and Astronautics
Dow
nloa
ded
by T
im C
olon
ius
on J
uly
31, 2
015
| http
://ar
c.ai
aa.o
rg |
DO
I: 1
0.25
14/6
.201
4-31
40
Ro = 1.00 Re = 500 Re = 1000 Re = 1500
λ=
2
0 30 60 90 120 150 180−3
−2
−1
0
1
2
CL
θ ()
VAWT
EPM
0 30 60 90 120 150 180−3
−2
−1
0
1
2
CL
θ ()
VAWT
EPM
0 30 60 90 120 150 180−3
−2
−1
0
1
2
CL
θ ()
VAWT
EPM
λ=
3
0 30 60 90 120 150 180−3
−2
−1
0
1
2
CL
θ ()
VAWT
EPM
0 30 60 90 120 150 180−3
−2
−1
0
1
2
CL
θ ()
VAWT
EPM
0 30 60 90 120 150 180−3
−2
−1
0
1
2
CL
θ ()
VAWT
EPM
λ=
4
0 30 60 90 120 150 180−3
−2
−1
0
1
2
CL
θ ()
VAWT
EPM
0 30 60 90 120 150 180−3
−2
−1
0
1
2
CL
θ ()
VAWT
EPM
0 30 60 90 120 150 180−3
−2
−1
0
1
2
CL
θ ()
VAWT
EPM
Figure 7. Comparing CL,VAWT and CL,EPM with Ro = 1.00 at λ = 2, 3, and 4 and Re = 500, 1000, and 1500.
12 of 18
American Institute of Aeronautics and Astronautics
Dow
nloa
ded
by T
im C
olon
ius
on J
uly
31, 2
015
| http
://ar
c.ai
aa.o
rg |
DO
I: 1
0.25
14/6
.201
4-31
40
Ro = 1.25 Re = 500 Re = 1000 Re = 1500
λ=
2
0 30 60 90 120 150 180−3
−2
−1
0
1
2
CL
θ ()
VAWT
EPM
0 30 60 90 120 150 180−3
−2
−1
0
1
2
CL
θ ()
VAWT
EPM
0 30 60 90 120 150 180−3
−2
−1
0
1
2
CL
θ ()
VAWT
EPM
λ=
3
0 30 60 90 120 150 180−3
−2
−1
0
1
2
CL
θ ()
VAWT
EPM
0 30 60 90 120 150 180−3
−2
−1
0
1
2
CL
θ ()
VAWT
EPM
0 30 60 90 120 150 180−3
−2
−1
0
1
2
CL
θ ()
VAWT
EPM
λ=
4
0 30 60 90 120 150 180−3
−2
−1
0
1
2
CL
θ ()
VAWT
EPM
0 30 60 90 120 150 180−3
−2
−1
0
1
2
CL
θ ()
VAWT
EPM
0 30 60 90 120 150 180−3
−2
−1
0
1
2
CL
θ ()
VAWT
EPM
Figure 8. Comparing CL,VAWT and CL,EPM with Ro = 1.25 at λ = 2, 3, and 4 and Re = 500, 1000, and 1500.
13 of 18
American Institute of Aeronautics and Astronautics
Dow
nloa
ded
by T
im C
olon
ius
on J
uly
31, 2
015
| http
://ar
c.ai
aa.o
rg |
DO
I: 1
0.25
14/6
.201
4-31
40
(a) Phase-averaged PIV data of the evolution of LEV repro-duced from Ferreira et al.
(b) Evolution of vortices in VAWT simulations at azimuthalangles corresponding to figure 9(a).
(c) Phase-averaged PIV data of the evolution of TEV re-produced from Ferreira et al.
(d) Evolution of vortices in VAWT simulations at azimuthalangles corresponding to figure 9(c).
Figure 9. The superposition of the vorticity fields of phase-averaged PIV data from Ferreira et al.(Re ≈ 105),and of VAWT simulations (Re = 1500) at λ = 2 and Ro = 1(` = 4) at various azimuthal angles.
0 30 60 90 120 150 1800
0.5
1
1.5
θ ()
CL
VAWT
Equiv. motion
(a) α = 15
0 30 60 90 120 150 1800
0.5
1
1.5
2
2.5
3
3.5
θ ()
CL
VAWT
Equiv. motion
(b) α = 30
Figure 10. Comparing lift responses of airfoils undergoing only surging motion at λ = 2, Ro = 1.5, and Re = 1500.
14 of 18
American Institute of Aeronautics and Astronautics
Dow
nloa
ded
by T
im C
olon
ius
on J
uly
31, 2
015
| http
://ar
c.ai
aa.o
rg |
DO
I: 1
0.25
14/6
.201
4-31
40
0 30 60 90 120 150 180−1
−0.5
0
0.5
1
1.5
2
2.5
3
θ ()
CL
VAWT
Equiv. motion
Figure 11. Comparing lift responses of airfoils undergoing only pitching motion at λ = 2, Ro = 1.5, andRe = 1500.
Table 1. Observation of the wake-capturing phenomenon for all combinations of the motions.
E. Comparison with an airfoil undergoing a sinusoidal motion
Flows around an airfoil undergoing SPM and SSPM introduced in section II are compared with one under-going EPM and in VAWT. Let CL,SPM be the lift coefficient of an airfoil undergoing the sinusoidal pitchingmotion and CL,SSPM be the lift coefficient of an airfoil undergoing the sinusoidal suring-pitching motion.The comparison of lift responses at λ = 2, Ro = 1.5, and Re = 1000 are shown in figure 12.
In the upstroke phase, we can see that only CL,EPM is close to CL,VAWT at low angle of attack. CL,SPM andCL,SSPM overestimated the lift. As the angle of attack increases, and after vortex shedding starts, differencesbetween four lift coefficients are relatively small. In the downstroke phase, none of CL,EPM, CL,SPM, andCL,SSPM matches the behavior of CL,VAWT. Therefore, sinusoidal motion can not fully catch the dynamicsof a rotating airfoil in a VAWT at λ = 2, at least for the sub-scale Reynolds numbers considered in this study.
0 5 10 15 20 25 30−1
−0.5
0
0.5
1
1.5
2
2.5
α ()
CL
VAWTEPMSPMSSPM
(a) Upstroke phase
0 5 10 15 20 25 30−1
−0.5
0
0.5
1
1.5
2
2.5
α ()
CL
VAWTEPMSPMSSPM
(b) Downstroke phase
Figure 12. Lift coefficients of VAWT, EPM, SPM, and SSPM over a cycle at λ = 2, Ro = 1.5, and Re = 1000.
15 of 18
American Institute of Aeronautics and Astronautics
Dow
nloa
ded
by T
im C
olon
ius
on J
uly
31, 2
015
| http
://ar
c.ai
aa.o
rg |
DO
I: 1
0.25
14/6
.201
4-31
40
F. Open loop control on the wake-capturing phenomenon
From the discussion in sections IIIB and IIIC, the wake-capturing of vortex pair leads to a large decrease inlift. In order to improve the corresponding implied loss in power production, we apply a open loop controlon dynamic stall in a VAWT. Inspired by Greenblatt et al.,19 an actuator modeled as a bodyforce introducedby Joe et al.24 is placed on the suction surface blowing the fluid tangent to the surface to control dynamicstall vortices.
Cµ is the momentum coefficient that defines the momentum injection added by the forcing. For anactuator with the width estimated as the grid spacing, ∆x, which injects a jet with average velocity, ujet,the momentum coefficient is
Cµ =u2
jet∆x12U
2∞c(18)
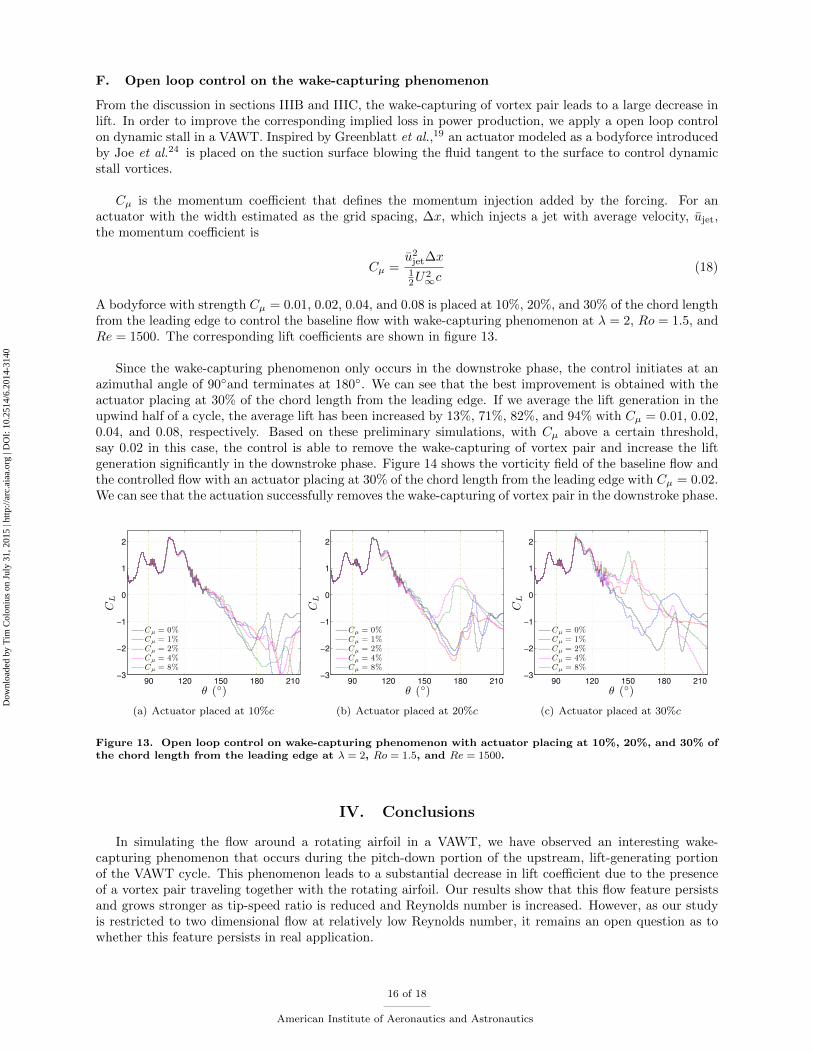
A bodyforce with strength Cµ = 0.01, 0.02, 0.04, and 0.08 is placed at 10%, 20%, and 30% of the chord lengthfrom the leading edge to control the baseline flow with wake-capturing phenomenon at λ = 2, Ro = 1.5, andRe = 1500. The corresponding lift coefficients are shown in figure 13.
Since the wake-capturing phenomenon only occurs in the downstroke phase, the control initiates at anazimuthal angle of 90and terminates at 180. We can see that the best improvement is obtained with theactuator placing at 30% of the chord length from the leading edge. If we average the lift generation in theupwind half of a cycle, the average lift has been increased by 13%, 71%, 82%, and 94% with Cµ = 0.01, 0.02,0.04, and 0.08, respectively. Based on these preliminary simulations, with Cµ above a certain threshold,say 0.02 in this case, the control is able to remove the wake-capturing of vortex pair and increase the liftgeneration significantly in the downstroke phase. Figure 14 shows the vorticity field of the baseline flow andthe controlled flow with an actuator placing at 30% of the chord length from the leading edge with Cµ = 0.02.We can see that the actuation successfully removes the wake-capturing of vortex pair in the downstroke phase.
90 120 150 180 210−3
−2
−1
0
1
2
θ ()
CL
Cµ = 0%Cµ = 1%Cµ = 2%Cµ = 4%Cµ = 8%
(a) Actuator placed at 10%c
90 120 150 180 210−3
−2
−1
0
1
2
θ ()
CL
Cµ = 0%Cµ = 1%Cµ = 2%Cµ = 4%Cµ = 8%
(b) Actuator placed at 20%c
90 120 150 180 210−3
−2
−1
0
1
2
θ ()
CL
Cµ = 0%Cµ = 1%Cµ = 2%Cµ = 4%Cµ = 8%
(c) Actuator placed at 30%c
Figure 13. Open loop control on wake-capturing phenomenon with actuator placing at 10%, 20%, and 30% ofthe chord length from the leading edge at λ = 2, Ro = 1.5, and Re = 1500.
IV. Conclusions
In simulating the flow around a rotating airfoil in a VAWT, we have observed an interesting wake-capturing phenomenon that occurs during the pitch-down portion of the upstream, lift-generating portionof the VAWT cycle. This phenomenon leads to a substantial decrease in lift coefficient due to the presenceof a vortex pair traveling together with the rotating airfoil. Our results show that this flow feature persistsand grows stronger as tip-speed ratio is reduced and Reynolds number is increased. However, as our studyis restricted to two dimensional flow at relatively low Reynolds number, it remains an open question as towhether this feature persists in real application.
16 of 18
American Institute of Aeronautics and Astronautics
Figure 14. Vorticity field of the baseline flow and the controlled flow with an actuator placing at 30% of thechord length from the leading edge with Cµ = 0.02.
An equivalent planar surging-pitching motion was introduced in order to isolate the Coriolis effect ondynamic stall in a VAWT. The results show that the equivalent motion is a good approximation to a rotatingairfoil in a VAWT in the upstroke phase where the Coriolis force has relatively small effect on vortices. How-ever, it overestimates the average lift coefficient in the downstroke phase by eliminating the aforementionedwake-capturing.
We further investigated the flow by decomposing the planar motion into surging- and pitching-onlymotions, where we also compared periodic angle-of-attack and surging velocities corresponding to the realmotion, as well as purely sinusoidal variations. We only observe the wake capturing when the combinationof surging, pitching, and Coriolis force are present. While the equivalent planar motion captures well thepitch up part of the cycle, all the motions show significant differences in forces during the pitch down motion.
In order to improve the efficiency of a VAWT, an actuator modeled as a bodyforce was used to examineopen-loop control in an attempt to suppress the wake-capturing. It is shown that with the actuator placedat appropriate location on the suction surface and the momentum coefficient above a certain threshold, thewake-capturing phenomenon disappears and lift increases significantly in the downstroke phase, with impliedincreases in power production and efficiency of a VAWT.
In future studies, our numerical results will be compared with the experimental data from McKeon groupat Caltech, which will give us more understanding of the aerodynamics in a VAWT. Persistence of the wake-capturing phenomenon in three-dimensional flow at higher Reynolds number also awaits future investigation.Ultimately, we would like to investigate the interactions of multiple VAWTs.
Acknowledgments
This project is sponsored by the Caltech Field Laboratory for Optimized Wind Energy with Prof. JohnDabiri as PI under the support of the Gordon and Betty Moore Foundation. We would like to thank Profs.John Dabiri and Beverley McKeon and Mr. Reeve Dunne for their helpful comments on our work.
Reference
1Mertens, S., van Kuik, G., and van Bussel, G., “Performance of an H-Darrieus in the skewed flow on a roof,” Transactions-American Society of Mechanical Engineers Journal of Solar Energy Engineering, Vol. 125, No. 4, 2003, pp. 433–440.
2Ferreira, C. S., van Bussel, G. J., and van Kuik, G. A., “Wind tunnel hotwire measurements, flow visualization andthrust measurement of a VAWT in skew,” Transactions-American Society of Mechanical Engineers Journal of Solar EnergyEngineering, Vol. 128, No. 4, 2006, pp. 487.
3Dabiri, J. O., “Potential order-of-magnitude enhancement of wind farm power density via counter-rotating vertical-axis
17 of 18
American Institute of Aeronautics and Astronautics
Dow
nloa
ded
by T
im C
olon
ius
on J
uly
31, 2
015
| http
://ar
c.ai
aa.o
rg |
DO
I: 1
0.25
14/6
.201
4-31
40
wind turbine arrays,” Journal of Renewable and Sustainable Energy, Vol. 3, 2011, pp. 043104.4Kinzel, M., Mulligan, Q., and Dabiri, J. O., “Energy exchange in an array of vertical-axis wind turbines,” Journal of
Turbulence, Vol. 13, No. 1, 2012.5Ferreira, C. S., van Kuik, G., van Bussel, G., and Scarano, F., “Visualization by PIV of dynamic stall on a vertical axis
wind turbine,” Experiments in Fluids, Vol. 46, No. 1, 2009, pp. 97–108.6Leishman, J., “Dynamic stall experiments on the NACA 23012 aerofoil,” Experiments in fluids, Vol. 9, No. 1-2, 1990,
pp. 49–58.7Raffel, M., Kompenhans, J., and Wernert, P., “Investigation of the unsteady flow velocity field above an airfoil pitching
under deep dynamic stall conditions,” Experiments in Fluids, Vol. 19, No. 2, 1995, pp. 103–111.8Wang, S., Ingham, D. B., Ma, L., Pourkashanian, M., and Tao, Z., “Numerical investigations on dynamic stall of low
Reynolds number flow around oscillating airfoils,” Computers & Fluids, Vol. 39, No. 9, 2010, pp. 1529–1541.9Paraschivoiu, I. and Allet, A., “Aerodynamic analysis of the Darrieus wind turbines including dynamic-stall effects,”
Journal of Propulsion and Power , Vol. 4, No. 5, 1988, pp. 472–477.10Allet, A., Halle, S., and Paraschivoiu, I., “Numerical simulation of dynamic stall around an airfoil in Darrieus motion,”
Journal of Solar Energy Engineering, Vol. 121, No. 1, 1999, pp. 69–76.11Paraschivoiu, I. and Beguier, C., “Visualization, measurements and calculations of dynamic stall for a similar motion of
VAWT,” Proceedings of the European Wind Energy Conference, Herning, Denmark , 1998.12Hansen, M. and Sresen, D., “CFD model for Vertical Axis Wind Turbine,” Wind Energy for the New Millennium-
Proceedings of the European Wind Energy Conference, Copenhagen, Denmark , 2001.13Nobile, R., Vahdati, M., Barlow, J., and Mewburn-Crook, A., “Dynamic stall for a Vertical Axis Wind Turbine in a
two-dimensional study,” Wind Energy Applications, Vol. 15, 2011, pp. 4225–4232.14Ferreira, C. S., van Bussel, G., and Van Kuik, G., “2D CFD simulation of dynamic stall on a Vertical Axis Wind Turbine:
verification and validation with PIV measurements,” 45th AIAA Aerospace Sciences Meeting and Exhibit/ASME Wind EnergySymposium, 2007.
15McCroskey, W., Carr, L., and McAlister, K., “Dynamic stall experiments on oscillating airfoils,” AIAA Journal , Vol. 14,No. 1, 1976, pp. 57–63.
16Wernert, P., Geissler, W., Raffel, M., and Kompenhans, J., “Experimental and numerical investigations of dynamic stallon a pitching airfoil,” AIAA journal , Vol. 34, No. 5, 1996, pp. 982–989.
17Lee, T. and Gerontakos, P., “Investigation of flow over an oscillating airfoil,” Journal of Fluid Mechanics, Vol. 512, 2004,pp. 313–341.
18Hwang, I. S., Min, S. Y., Jeong, I. O., Lee, Y. H., and Kim, S. J., “Efficiency improvement of a new vertical axis windturbine by individual active control of blade motion,” Smart Structures and Materials, International Society for Optics andPhotonics, 2006, pp. 617311–617311.
19Greenblatt, D., Harav, A. B., and Mueller-Vahl, H., “Mechanism of Dynamic Stall Control on a Vertical Axis WindTurbine,” AIAA paper 2013-851 , 2013.
20Colonius, T. and Taira, K., “A fast immersed boundary method using a nullspace approach and multi-domain far-fieldboundary conditions,” Computer Methods in Applied Mechanics and Engineering, Vol. 197, No. 25, 2008, pp. 2131–2146.
21Bloor, M. S., “The transition to turbulence in the wake of a circular cylinder,” Journal of Fluid Mechanics, Vol. 19,No. 02, 1964, pp. 290–304.
22Dickinson, M. H., Lehmann, F.-O., and Sane, S. P., “Wing rotation and the aerodynamic basis of insect flight,” Science,Vol. 284, No. 5422, 1999, pp. 1954–1960.
23Choi, J., Colonius, T., and Williams, D., “Dynamics and Energy Extraction of a Surging and Plunging Airfoil at LowReynolds Number,” AIAA paper 2013-672 , 2013.
24Joe, W. T., Colonius, T., and MacMynowski, D. G., “Feedback control of vortex shedding from an inclined flat plate,”Theoretical and Computational Fluid Dynamics, Vol. 25, No. 1-4, 2011, pp. 221–232.
18 of 18
American Institute of Aeronautics and Astronautics