125

SUSTAINABILITY OF RURAL WATER SUPPLY AND SANITATION
SERVICES IN ETHIOPIA: A CASE STUDY OF TWENTY VILLAGES IN
ETHIOPIA
A Thesis
Presented to the Faculty of the Graduate School
Of Cornell University
In Partial Fulfillment of the Requirements for the Degree of
MPS in Integrated Watershed Management and Hydrology
By
Tarekegne, Tegegne M.
August 2009
© 2009 Tarekegne, Tegegne M.
ABSTRACT
Providing access to safe water and sanitation to combat poor health is an
integral part of the strategy to alleviate poverty in many countries according to the
United Nations Development Assistance Framework (UNDAF, 2006). Although
sustainable water supply and sanitation services is a basic requirement for
development, there are only very few systems implemented over last 25 years in rural
areas of Ethiopia that are still functioning The objective of the research was to
investigate the reasons behind the low sustainability of rural water supply and
sanitation services among different organizations each with their unique approach. The
research was conducted in the Libo Kemkem Woreda near Lake Tana Ethiopia where
a recent survey showed that two-thirds of constructed water points were not
functioning, and there was a low coverage of sanitation services. In this study a
survey was undertaken covering 20 villages in which more than 400 respondents were
interviewed examining a range of aspects such as community participation, operation
and maintenance practice, institutionalization of schemes, community preferences and
thoughts and major problems in water supply and sanitation services.
Results showed the sustainability of rural water supply and sanitation service
depended on the approach followed by the providers. Water supply systems were
sustainable in which the community participated in all stages of the project, selected
members of the community were educated in operating the system and spare parts and
man power were available and manpower from the agency are special factors to
sustain the system; Latrine construction coverage and hygienic behavior was improved
in villages where volunteers and community facilitator teams were working. The
survey indicated that the best place to meet was on holidays in formal locations and
not in church after church program. Finally, organizations should focus on latrine
construction, both household and communal latrines around farming and grazing
places.
BIOGRAPHICAL SKETCH
Tegegne Mekonnen was told that he came to join this world early in the
morning at 12:30 am on the first day of 1982 in Gonder Referral Hospital, Ethiopia.
Tegegne graduated from Arba Minch University, Ethiopia, in Hydraulic
Engineering in 2005. Since then, he has worked as a technical advisor in a rural water
supply and sanitation program in Libo Kemkem Woreda and a teacher of technical
drawing in a preparatory school in the same place for two years. And he is on the
verge of getting a degree in Integrated Watershed Management and Hydrology from
Cornell University.
iii
ACKNOWLEDGMENT
The author would like to give especial words of thanks to his advisor Professor
Tamo Steenhuise for his support right from the conception of the thesis. His comments
and suggestions were useful in improving the quality of the thesis. I would like to
thank all those who played a major role during my studies at Libo Kemkem Woreda
individually for being informant and provide valuable data; I would like to thank Mr.
Yeshiber Muche, Mr. Alleligne Ewnwtu and Solomon Assefa. I would like to thank
Mr. Tewodros Worku for critical readings of my thesis. Special thanks to Adino
Tegegne, Libo Kemkem RWaSHP member, who accompanied me throughout the
research acting as facilitator and informant.
Gratitude is also deeply expressed to all field workers for their contribution in
data collection. The author especially thanks the household respondents and
participants in focal group discussions without their full participation this study would
have not been possible. Finally but not least I would like to give my special thanks to
Dr. Amy Colic for editing the thesis.
iv
TABLE OF CONTENTS
BIOGRAPHICAL SKETCH.............................................................................................................iii
ACKNOWLEDGMENT.................................................................................................................iv
LIST OF FIGURES.......................................................................................................................vii
LIST OF ABBREVIATIONS..........................................................................................................viii
Chapter 1...................................................................................................................................1
1 Introduction............................................................................................................................1
1.1 Justification of the study..................................................................................................3
1.2 Objective of the study......................................................................................................4
1.3 Organization of the thesis................................................................................................5
Chapter 2...................................................................................................................................6
2 Background of Water Supply and Sanitation..........................................................................6
2.1 Water supplies and sanitation in perspectives..................................................................6
2.2 Sustainability of rural water supply and sanitation as a concept......................................7
Chapter 3.................................................................................................................................10
3 Materials and Methods........................................................................................................10
3.1 Location and description of the study area and the water schemes................................10
3.2 Data collection...............................................................................................................12
3.2.1 Water users.............................................................................................................13
3.2.2 Village level maintenance trainees and water and sanitation committees...............14
3.2.3 Organizations which provided water and (or) sanitation services...........................15
3.3 Data analysis..................................................................................................................17
Chapter 4.................................................................................................................................19
4 Results..................................................................................................................................19
4.1 Characteristics of the respondents..................................................................................19
4.2 Household Water Use and Accessibility........................................................................20
4.3 Community participation...............................................................................................28
4.3.1 Community participation at the pre-planning and planning stage of the project.....30
v
4.3.2 Community participation in village meetings.........................................................32
4.3.3 Community participation during the construction stage of the project....................33
4.4 Operation and Maintenance...........................................................................................33
4.4.1 Existing village level operation and maintenance practice......................................33
4.4.2 Satisfaction with collection and use of operation and maintenance funds...............35
4.7........................................................................................................................................36
4.5 Sanitation.......................................................................................................................40
4.5.2 Types of latrines constructed..................................................................................40
4.5.1 Number of latrine construction...............................................................................41
4.5.3 Hygienic behaviors.................................................................................................42
4.9 The impact of rural water supply and sanitation services...............................................46
4.6 Functionality and institutionalization of schemes and community satisfaction with service.................................................................................................................................47
4.8 Community preferences.................................................................................................47
4.10 Community thoughts in sustaining rural water supply services...................................49
Chapter 5.................................................................................................................................51
5 Discussions and Conclusions.................................................................................................51
5.1 Discussions....................................................................................................................51
5.2 Conclusions...................................................................................................................57
CHAPTER 6...............................................................................................................................60
6. REFERENCES........................................................................................................................60
Appendix 1: List of selected villages for the study..................................................................................72Appendix 2: Table of results from the community..................................................................................73Appendix 3: Comparison of the water quantity measured with the standard........................................80Appendix 4: Questionnaire used for user communities..........................................................................81Appendix 5: Questionnaire used for service providers (organizations)...................................................85Appendix 6: Checklist used for operation and maintenance trainees.....................................................87
vi
LIST OF FIGURES
Figure 1: The sustainability chain................................................................................10
Figure 2: The location of the study area and villages..................................................14
Illustration 1: sample water point.................................................................................41
Illustration 2: Sample household latrine.......................................................................41
vii
LIST OF ABBREVIATIONS
O & M Operation and Maintenance
SPSS Statistical Package for Social Science
USD United State Dollar
WHO World Health Organization
RWaSSHP Rural Water Supply, Sanitation and Hygiene Program
UNICEIF United Nations International
GDP growth domestic product
UNESCA United Nations Economic and Social Council for Africa
ECSA Ethiopian Central Statistical Agency
LKWFDO Libokemkem Woreda Finance and Development Office
NWSSP National Water Supply and Sanitation Program
ORDA Organization of Rehabilitation and Development in Amhara
LKWWRDO Libo Kemkem Woreda Water Resource Development Office
MDGs Millennium Development goals
UNDAF United Nations Development Assistance Framework
MoWR Ministry of Water Resources
NWSSP National Water Supply and Sanitation Program
m.a.s.l meter above sea level
viii
Chapter 1
1 Introduction
It is estimated that 35% of all rural water supplies in sub-Saharan Africa are
not functioning (Baumann, 2005; adopted from Alexia H., 2006). Women and children
in developing countries suffer most from water related diseases and the damaged
environment (WHO/UNICEF, 2003). People do their laundry and bathe in the same
places that they water their animals and get their drinking water. Eighty percent of
health problems in Ethiopia are attributed to poor sanitation and inadequate safe water.
As of 2000 in Ethiopia, 82 percent of rural households nationwide in Ethiopia do not
have sanitation facilities in or near their homes. Latrines are virtually non-existent in
rural communities with defecation taking place in fields, bushes or along drainage
ditches. However, a simple long-drop latrine can radically reduce the amount of fecal
matter entering the water supply. Furthermore, it has been estimated that adequate and
safe water, sanitation and hygiene could decrease the number of diarrhea cases by one-
third to one-fourth (Secil Ozkan et al, 2007). Unfortunately at the rate of construction
in 2007 and not allowing for population growth, it would take more than 100 years for
all households in the rural communities of Ethiopia to be equipped with latrines
(EMoWR, 2007).
Providing access to safe water and sanitation to combat poor health is an
integral part of the strategy to alleviate poverty in many countries according to the
United Nations Development Assistance Framework (UNDAF, 2006). However,
unless strategies are found to motivate rural communities and create a demand for
water and sanitation, we cannot achieve the United Nations Millennium Development
Goal of halving the proportion of the global population without sanitation and access
to safe water by the year 2015 (Waterkeyn and Cairncross, 2005). Clearly, more
resources need to be applied to solving the water supply and sanitation problems of
9
rural people. And for this stronger methodologies for fostering rapid implementation
must be devised, and answers must be found to why sanitation and hygiene programs
are often non-sustainable. Before the inception of this study, the researcher observed
large gaps in the sustainability of water supply and sanitation services in different
villages provided by different organizations. This led to the hypothesis that the
approaches utilized by the organizations in providing rural water supply and sanitation
services were related to the sustainability of rural water supply and sanitation services.
Therefore, these approaches followed by different rural water supply and sanitation
service providers in different areas need to be evaluated so that those approaches
resulting in sustainable services can be identified. Similarly, those approaches which
resulted in non-successive rural water supply and sanitation services need to be
identified so that they will not be used in the future by providers. By evaluating the
sustainability of the services provided by different organizations, this research aimed
to find the appropriate approaches necessary for sustainable water supply and
sanitation services and the right methods to address these approaches.
The widespread failures in water supplies have been attributed by Carter et al.
(1999) to a number of factors in a project: (1) the intervention was not desired by the
community, (2) the capital and/or recurrent costs are too high for the community, (3)
lack of ownership results in neglect of maintenance and repairs, (4) the promised
benefits do not materialize, (5) education programs are too short, and (6) trained
members of the community move away or lose interest (Carter et al, 1999).
It became obvious that the different approaches followed by the organizations
in the study area included adoption of a demand-driven approach based on
empowerment of villagers to ensure their full participation in pre-planning, planning
and implementation; decision-making in the choice of scheme; focus on village level
10
capacity building; and ten per cent capital cost sharing by users. Each organization
also followed different methods in addressing the approaches followed.
This study involved the evaluation of the current status of water supply and
sanitation services sustainability in Libo Kemkem Woreda, North West Ethiopia in
order to explore the effectiveness of the aforementioned dimensions of sustainability,
where and how success has been achieved, and what needs to be done to improve
sustainability of water schemes.
1.1 Justification of the study
Under the National Water Supply and Sanitation Program (NWSSP), the
government of Ethiopia intends to increase the national water supply and sanitation
coverage to 62% and 54%, respectively, by 2015 (MDGs in water supply and
sanitation coverage). It has been said that the chances of achieving the Millennium
Development Goal of halving the proportion of people without access to safe water by
2015 will be seriously lowered unless levels of sustainability can be greatly improved.
(Haysom, 2006). For example in the study area, the present functionality rate of rural
water supply services was only 34.4% (LKWFDO, 2009). Therefore, satisfaction with
the water supply and sanitation services was mixed. Furthermore, some schemes were
institutionalized and eventually governed by the community, while others were not.
Finally, the actual sanitation coverage varied from .high to low throughout the study
area.
Large gaps have been observed in the sustainability of water supply and
sanitation services provided by different organizations in different villages . The gap
in sustainability among villages is a bottle neck for achieving the vision 2015 and
MGDs. Therefore it will be important to explore the main reasons for the gaps in the
sustainability of the schemes in different villages in order for action can be taken to
ensure the longevity of the provision of services at village level. Water and sanitation
11
services are at the centre of all MDGs; therefore, evaluating the different approaches
each organization followed in achieving sustainability and selecting those approaches
resulting in sustainable water supply and sanitation services in order to forward these
approaches to organizations that implement these services is essential for achieving
the vision of the development goals for 2015.
1.2 Objective of the studyTo achieve the United Nations Millennium Development Goals (MDG) in
water supply and sanitation coverage, the government of Ethiopia intends under the
National Water Supply and Sanitation Program (NWSSP )to increase the national
coverage to over 50 percent by 2015 In order to achieve the Millennium
Development Goals the sustainability of the installed systems need be greatly
improved above that in the last 25 years. (Haysom, 2006). Therefore the general
objective of this research is to investigate the reasons that the sustainability of rural
water supply and sanitation services does not meet the expectations. To do so we
assessed in 20 villages in the Libo Kemkem Woreda the utilization, functionality,
institutionalization and community participation and satisfaction of water supply
systems provided implemented by various organizations.
Specific objectives are:
To examine where and how success has been achieved and what needs to be
done to improve sustainability of water schemes.
To investigate the impacts of rural water supply and sanitation services to the
community
To investigate potential and constraints facing rural water supply and
sanitation services
To investigate different needs of user communities of water supply and
sanitation services
12
to explore whether and which of the aforementioned dimensions of
sustainability are effective
1.3 Organization of the thesis
This thesis is made up of five chapters. This chapter provides the introduction
of the water supply and sanitation situation in Ethiopia. The chapter also describes
justification, objectives and hypothesis of the study. Chapter 2 discusses the
background information about rural water supplies, different approaches water
providers follow and sustainability of water schemes. To gain insight of the
sustainability of rural water supply and sanitation services under different
organizations approach, different sources in line with community participation,
satisfaction, functionality, utilization and management of water projects were
explored. Experiences gained from different parts of the world in relation to
community management of water projects in rural areas and community participation
in project activities provided basis for comparison. Chapter 3 describes the materials
and methods used in the study. The chapter describes the location of the study areas
and the status of water schemes visited. The detail research design and data analysis is
also part of this chapter. Chapter 4 contains the results of the study from quantitative
and qualitative data, water quantity measurement, water users, community operation
and maintenance trainees and water providers (the five different organizations
working in the study area). The last chapter, chapter 5, discusses the main findings
which were explored during the study and the conclusion drawn from the results.
13
Chapter 2
2 Background of Water Supply and Sanitation
Water is one of the most important natural resources because access to safe
water is vital for survival. However, despite significant investments in the water
sector, the outlook on access to safe water remains grim at the globally (World Bank,
2001). Rural Africans have the lowest level of access to clean water and sanitation
when compared to other developing areas of the world (UNESCO-WWAP, 2003).
This holds also true in Ethiopia. Lack of access to clean water and proper sanitation is
a major cause of diarrheal diseases, which in turn account for a large fraction of
childhood morbidity and mortality (Janvier et al, 2002). It is generally accepted that
lack of potable water and basic sanitation services remains one of the world’s most
urgent health issues (Onesmo and Holmes, 2006). Inadequate access to sufficient good
quality water and appropriate sanitation will exacerbate already difficult situations,
e.g. where people are being treated for chronic and/ or possibly fatal illnesses such as
HIV/AIDS (Ngwenya and Kgathi, 2006). In a review of over 60 studies, Esrey et al.
(1985) found that the largest benefits of service improvements in reducing morbidity-
related diarrhea were improved water availability (25%), improved excreta disposal
(22%), and water quality (16%).
2.1 Water supplies and sanitation in perspectives
Wilderer, (2004) pointed out that serving the world population with adequate
drinking water and sanitation is an important prerequisite, not only to hygienic safety,
but to prosperity and political stability as well, and will foster the adaptive capacity of
the societies in the developing countries and beyond. Research and experience
continually confirm that a safe water supply is not sufficient and that adequate
sanitation facilities and hygiene practice are essential to improving the health of the
local population (Van Derslice and Briscoe 1995). It is estimated that currently more
14
than one billion people do not have access to safe drinking water. About 2.4 billion
people are not served by any type of reasonable sanitation, and one-half of the world’s
hospital beds are occupied by people suffering from water-borne diseases (Wilderer,
2004).
It is well accepted that water supply and sanitation problems cannot be solved
with concrete and pipes and that integrated approaches to water supply and sanitation
that put people at the center need to be used. This means from a social development
perspective understanding and involving users and responding flexibly towards their
concerns.
2.2 Sustainability of rural water supply and sanitation as a concept
Sustainability pertains to multiple aspects of a rural water supply, with
institutional, social, technical, environmental and financial dimensions (WELL, 1998).
This accounts for the fact that understanding and measuring sustainability is so
difficult, and why solutions are highly context specific. Sustainable rural water
supplies ensure the ongoing provision of a service that is fundamental to improving
health, reducing the burden of carrying water long distances, and enabling users to live
a life of dignity (Haysom, 2006). Therefore, in our context, sustainability is best
defined pragmatically as “whether or not something continues to work overtime”
(Abrams, 1998).
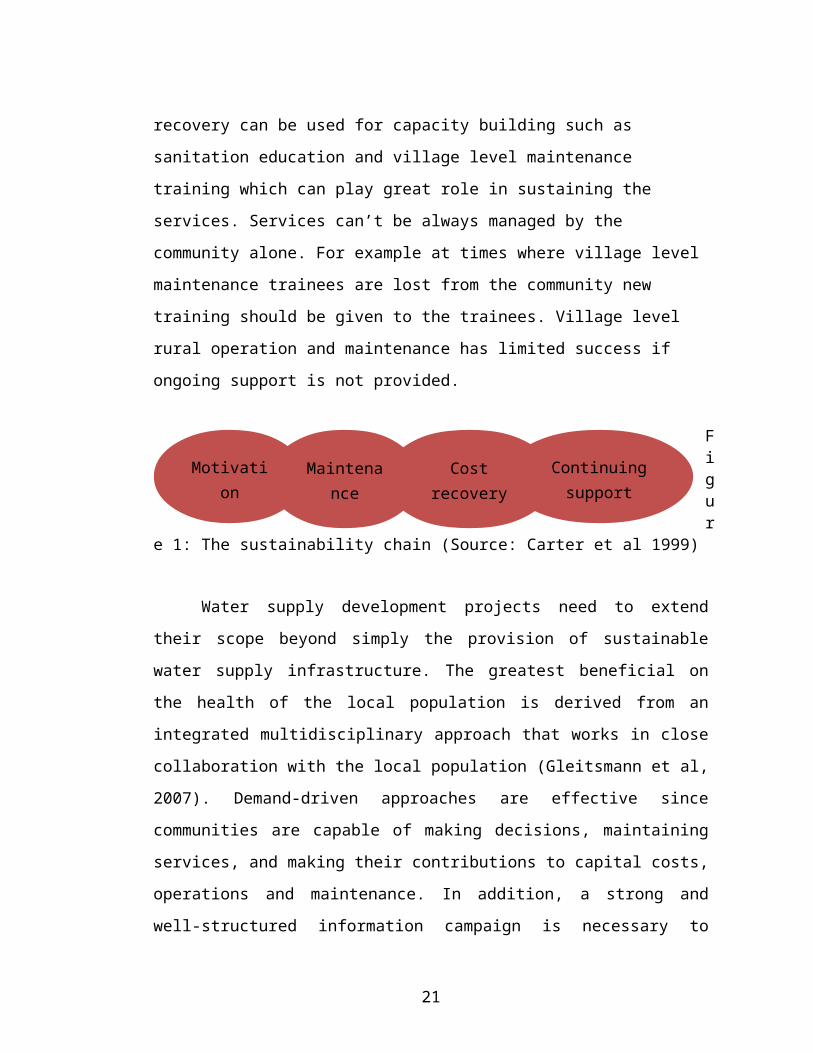
The conceptual frameworks to achieve sustainability by Carter et al (1999) for
rural water supply and sanitation services are depicted in Figure 1. According to these
authors, a motivated community is the one that needs the service more and therefore
considers the scheme as its own property. As a result schemes constructed by
community motivation are likely to be sustainable. Effective O and M is essential for
sustainability and village level O and M is one of the ways through which
sustainability can be achieved. In cases of scarce government resources the money
15
collected from cost recovery can be used for capacity building such as sanitation
education and village level maintenance training which can play great role in
sustaining the services. Services can’t be always managed by the community alone.
For example at times where village level maintenance trainees are lost from the
community new training should be given to the trainees. Village level rural operation
and maintenance has limited success if ongoing support is not provided.
Figure
1: The sustainability chain (Source: Carter et al 1999)
Water supply development projects need to extend their scope beyond simply
the provision of sustainable water supply infrastructure. The greatest beneficial on the
health of the local population is derived from an integrated multidisciplinary approach
that works in close collaboration with the local population (Gleitsmann et al, 2007).
Demand-driven approaches are effective since communities are capable of making
decisions, maintaining services, and making their contributions to capital costs,
operations and maintenance. In addition, a strong and well-structured information
campaign is necessary to empower communities to make an informed choice
(UNESCA, 2005).
Livingstone et al. (1993) explained that poor program conceptualization,
unimaginative planning, use of inappropriate technologies, and rigid management
approaches had contributed to high rates of program failure. Implementation
approaches which resulted in non-sustainability of water supply projects should be
identified so that they would not be repeated in the future. At the same time
Continuing support
Cost recoveryMaintenance
Motivation
16
implementation approaches, which resulted in sustainability of water supply projects
should be identified so that they can be used as a base for future project
implementations.
The chances of achieving the Millennium Development Goals by halving the
proportion of people without access to safe water by 2015 will be seriously hampered
unless levels of sustainability can be greatly improved, (Haysom, 2006). Therefore, it
is necessary to follow approaches which can lead to the sustainability of rural water
supply and sanitation.
17
Chapter 3
3 Materials and Methods
3.1 Location and description of the study area and the water schemes
The study area, Libo Kemkem Woreda, is found in the South Gondar Zone of
the Amhara Regional State. It extends from a latitude of 37o15‘36” E to 38o06’36” E
and from a longitude of 11o54‘36” N to 12o22‘48” N. This area receives a unimodal
rainfall of approximately 1300mm per year, the majority of which falls between June
and August. The mean annual temperature in the area is 19.7oC. According to the 2007
census report of the Ethiopian Central Statistical Agency (ECSA), its total estimated
population was 198,374 of which 88.9% live in rural areas. The rural population is
relatively poor, relying on traditional farming and small holder livestock production,
the success of which is threatened by unpredictable rainfall patterns and low
investment capacity. Rain-fed subsistence farming of crops (maize, millet, “teff” and
sorghum), animal husbandry, and irrigated paddy rice cultivation along the Ribb River
remain the principal agricultural activities despite poor soil fertility and highly
variable rainfall in most areas.
According to the technicians of the organizations working in rural water supply
and sanitation, the groundwater depth ranges from 3m to 30m. This explains that the
prevalence of hand pump schemes in many areas allowing for the widespread use of
shallow and medium depth hand pumps, such as Nira and Afridev, respectively. The
dispersed nature of the settlements also makes point source extraction systems more
appropriate.
The list of the villages that each of the five organizations provided service was
obtained from each organization. Among the villages provided with a water supply
service by each of the five organizations four villages were randomly selected from
each of the organizations. A total of twenty villages were therefore selected for this
18
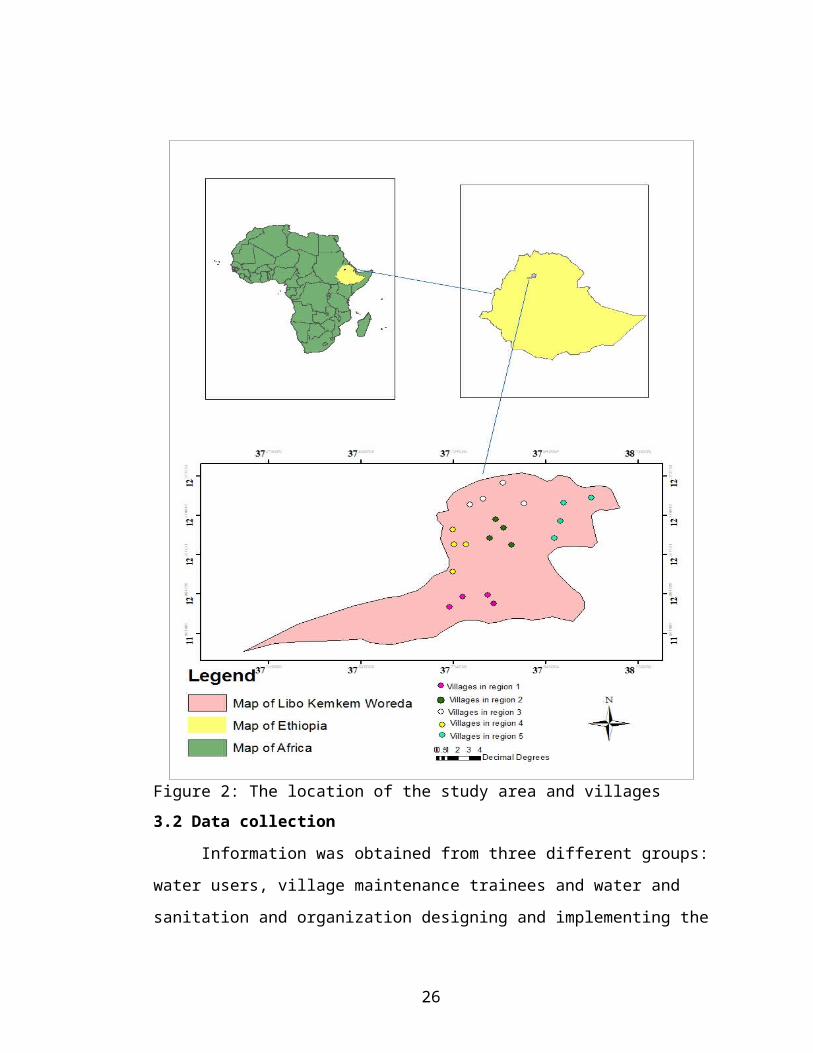
study. The locations of the villages selected are shown in figure 1 below. Information
on the schemes in these villages: the GPS location of each scheme in each village, the
number of water users in each scheme, the time the scheme was constructed, the
organization provided the service is provided in Table 1 of Appendix 1.
For the sake of simplicity the villages served by the five organizations namely
RWaSSHP, LKWWRO, ORDA, RED CROSS and UNICEF are classified as Region
1, Region 2, Region 3, Region 4, and Region 5 respectively in this paper. In region 1
where RWaSSHP was service provider the selected villages were Shini Difa,
Chekchakit, Aba Mederoge and Shina; in Region 2 where LKWWRO was service
provider the selected villages were Bata, Dikulle, Belles and Mewagna; in Region 3
where ORDA was service provider the selected villages were Keroye, Agamoch,
Shumana-2 and Dokimit; in Region 4 where RED CROSS was service provider the
selected villages were Kibichalle, Bisrogmi, Bayiyo and Milangib in Region 5 where
UNICEF was service provider the selected villages were Menta Walka, Lay Chiche
Walka, Kidane Mihret and Endodo Mesk.
19
Figure 2: The location of the study area and villages
3.2 Data collection
Information was obtained from three different groups: water users, village
maintenance trainees and water and sanitation and organization designing and
implementing the water and/or sanitation services. Formal interviews, observation and
20
group discussion were held. Field observations using structured checklists were
administered. Data for the observation included mainly protection mechanism
(presence of fence, guard, problems related with service structures, presence of latrine
and its situation).
To generate information from diverse stakeholders and to capture their
perspectives focus group discussions were held with the following groups in the
communities studied: village Water supply and sanitation commute, village level
operation and maintenance trainees, concerned officials of water supply and sanitation
issues in the study area, representatives of each organization and extension staff
operating in the specific communities.
3.2.1 Water users
The principal researcher was able to directly observe water-use behavior as
well as conduct formal and informal surveys with residents of each village. A pre-
tested structured questionnaire was used for the formal survey, Appendix 4. The
questionnaire was designed to collect information on demographic and socio-
economical characteristics of the respondents and the degree of functioning,
utilization, and participation in water supply facilities and sanitation practices. A total
of 400 water users were interviewed during the questionnaire survey by selecting
randomly twenty interviewees in each village (among list of settlers in each village).
The proportion of respondents in each village consisted of 70% women and 30 % men.
This was done by selecting randomly 17 women and six men among the settlers in
each village. The rationale for this selection was in part from evidence-based literature
on women’s major participation in water resource management (Gleitsmann et al,
2007, Makule, 1997) and through direct observation of women’s primary role in water
provision and distribution at the household level. The higher number of female
respondents is attributed by culture and traditions of Ethiopia, especially in rural areas
21
where women and girls are responsible for collecting water for household use. It is
said that women are more knowledgeable than men of the problems concerning water
accessibility and use (Onesmo et al, 2006). In the Ethiopian context, women are
primary users of water and commit a considerable portion of their daily time table to
water collection and management of household water and hygiene. Therefore, it is an
undeniable fact that, they have the best information on water supply and sanitation
issues.
3.2.2 Village level maintenance trainees and water and sanitation committees
A pre-tested structured checklist was used for conducting formal surveys with
village level maintenance trainees and a checklist was used to gather information on
water and sanitation committee in each village. The checklist used for village level
maintenance trainees included information on the trainees experience in maintaining
the scheme, belief of the trainees on their ability to maintain a system, constraints of
village level maintenance and their perspective in sustaining water supply service.
Except for villages in region 5 where there were no village level maintenance trainees
two village level maintenance trainees were interviewed in each village.
The checklist used for collecting information on water supply and sanitation
committee by holding focal group discussion included their role in water supply and
sanitation, the time the committee was formed (at the beginning or end of the project),
constraints in water supply and sanitation service management. In most of the villages
the water and sanitation committee consist seven members. It was tried to include
more than 50% of the water supply and sanitation committee in each village in the
focus group discussion held.
22
3.2.3 Organizations which provided water and (or) sanitation services
The questionnaire used for the survey with the service providers is attached in
appendix 5. The questionnaire included information on the general approaches that the
organizations followed in providing the services in the villages selected for this study,
more specifically community participation in project activities, operation and
maintenance, supporting mechanisms after handing over the schemes to the
community, opportunities and constraints in working to sustain rural water supply and
sanitation services, perspectives in sustaining rural water supply and sanitation
services.
The interview with WaSSHP, LKWWRDO and ORDA was made with the head of
each of the organizations in the study area. However since RED CROSS and UNICEF
programs phased out in the study area information how these organizations were
working was collected from Libo Kemkem Woreda Water Resource Development
Office as the office has always the responsibility to follow up the works of any
organization in the woreda.
3.3 Well yield measurement
The yields of each of the wells in Region 1, 2, 3, and 4 were measured. However,
the yields of the wells in Region 5 could not be measured since the depth of the wells
was higher and required a higher cost of pumping. The yields of the wells were
measured through the following procedures:
1. The static depth of water was measured in the morning before the well was
pumped by the users.
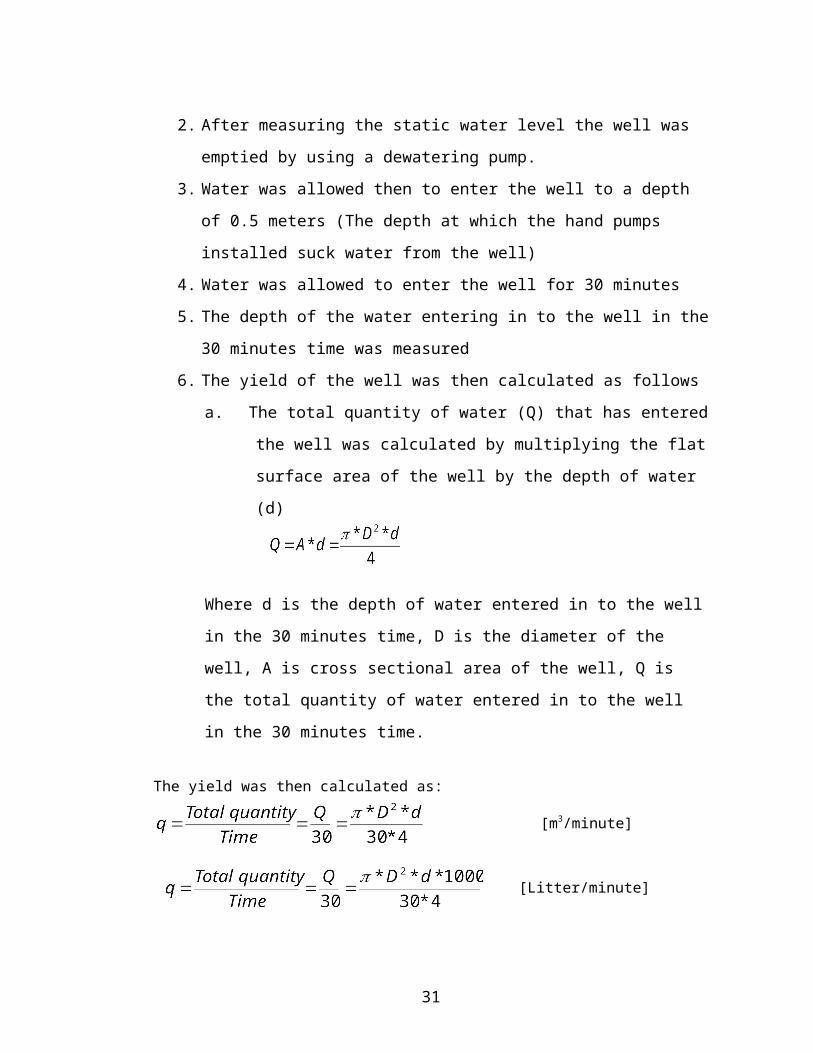
2. After measuring the static water level the well was emptied by using a
dewatering pump.
3. Water was allowed then to enter the well to a depth of 0.5 meters (The depth at
which the hand pumps installed suck water from the well)
23
4. Water was allowed to enter the well for 30 minutes
5. The depth of the water entering in to the well in the 30 minutes time was
measured
6. The yield of the well was then calculated as follows
a. The total quantity of water (Q) that has entered the well was calculated
by multiplying the flat surface area of the well by the depth of water
(d)
Where d is the depth of water entered in to the well in the 30 minutes time, D
is the diameter of the well, A is cross sectional area of the well, Q is the total
quantity of water entered in to the well in the 30 minutes time.
The yield was then calculated as:
[m3/minute]
[Litter/minute]
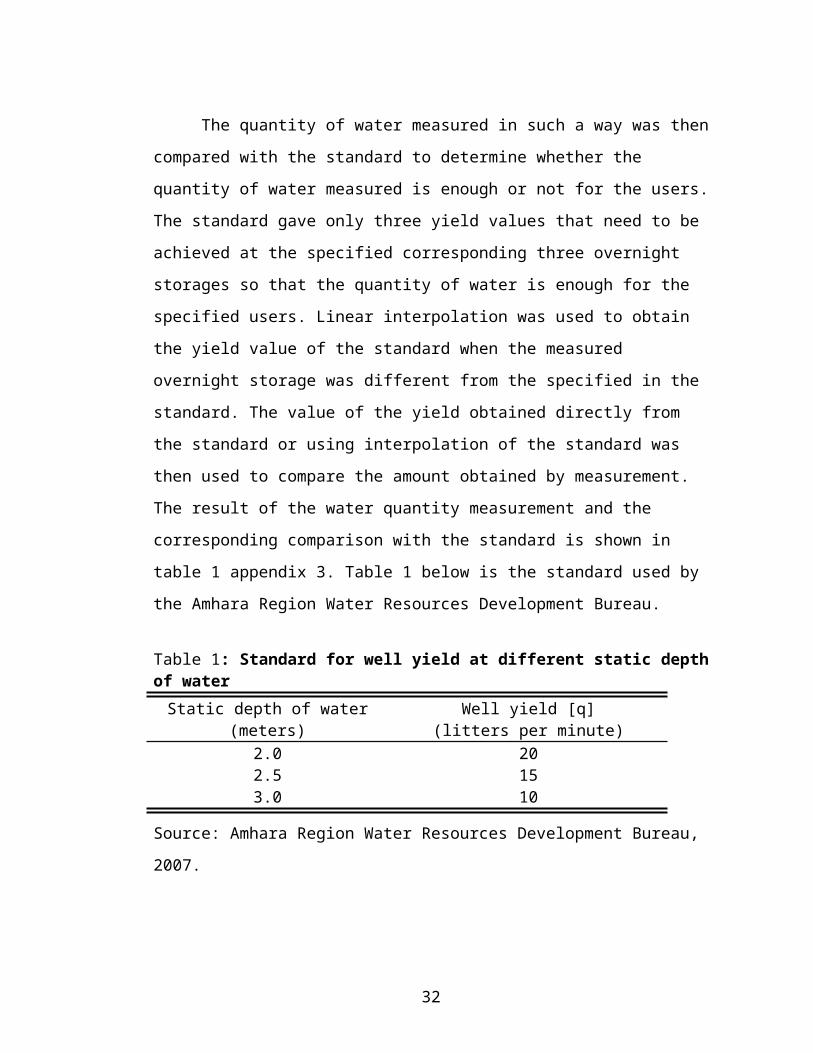
The quantity of water measured in such a way was then compared with the
standard to determine whether the quantity of water measured is enough or not for the
users. The standard gave only three yield values that need to be achieved at the
specified corresponding three overnight storages so that the quantity of water is
enough for the specified users. Linear interpolation was used to obtain the yield value
of the standard when the measured overnight storage was different from the specified
in the standard. The value of the yield obtained directly from the standard or using
interpolation of the standard was then used to compare the amount obtained by
measurement. The result of the water quantity measurement and the corresponding
24
comparison with the standard is shown in table 1 appendix 3. Table 1 below is the
standard used by the Amhara Region Water Resources Development Bureau.
Table 1: Standard for well yield at different static depth of waterStatic depth of water
(meters)Well yield [q]
(litters per minute)2.0 202.5 153.0 10
Source: Amhara Region Water Resources Development Bureau, 2007.
3.3 Data analysis
The Statistical Package for Social Science (SPSS) version 14 for Windows was
used for analyzing the data collected during the questionnaire survey. The respondents
were given numbers for identification purposes. The region and the village each
respondent was living were coded with numbers so that the situation in each region or
village under the different questions in the questionnaire can be analyzed. Each
question in the questionnaires was identified by a variable name and within variables
there were values and value labels for identification of responses from the
respondents. After coding the information from the questionnaires, template for
entering data in the computer program was created. The coded data was then entered
in the SPSS computer program where frequencies, multiple responses, mean, standard
deviations and cross tabulations were computed during the analysis.
Information collected from the water and sanitation committee and water and
sanitation service providers during the FGDs and water providers were grouped
together according to the checklist questions and category of respondents. The issues
originated from different groups but believed to be related were grouped together. For
comparisons between different groups on specific issues to be easier issues believed to
25
be related were arranged in rows and the focus groups related with these issue were
arranged in columns in a summary table. The issues believed to be related were then
summarized and interpreted according to the relation that might exist between them as
seen by different groups. Different views from different groups were taken into
consideration during interpretations.
26
Chapter 4
4 Results
Due to the large number of tables of results, some tables are presented within
the text while others are presented in Appendix 2. Some results obtained during the
focus group discussion are also presented within the text.
4.1 Characteristics of the respondents
About 30% of respondents interviewed were men and 70% women. This was
intentionally made on the belief that women know about water and sanitation more
than men as it is described in section 3.2.1. The age of respondents interviewed ranged
from 20 to 72 years with an average of 41 years.
Table 2 below describes education level of the respondents’ household
composition in the study area. The majority of respondents’ household compositions
(69%) was not educated meaning they could not write or read or did not attend formal
education. About 1% of the composition can write and read without having formal
education in schools. The remaining 30% included those attending or interrupted
education at primary, high school, preparatory or college level.
Table 2: Education level of respondents’ household composition Education level Percentages (n=400)
Write and read /non formal education/ 1.00Primary 15.80
High school 7.20Preparatory 5.90
College 0.60Not educated 69.50
n indicates the number of respondents
The marital status of the respondents is presented in table 3 appendix 2. The
result shows that approximately 84% were married. About 4.5% and 11.5% of them
were divorced and widowed, respectively. Only 0.3% of the respondents were single.
27
Because the majority of the respondents were married, our survey results are valid for
fetching water (usually by the family female members). The number of people in a
household ranged from 1 to 9 with an average of 4.3 persons, which is slightly less
than the average Ethiopian family size of 4.7 persons (Ethiopian Central Statistical
Agency 2007)
4.2 Household Water Use and Accessibility
Functionality of schemes
The functionality of schemes in Libo Kemkem Woreda is about 34.4%.
(Libokemkem Woreda Finance and development Bureau, 2009). Three hand dug
wells in regions 2, 4 and 5 were found to be unfunctional. The villages were Belles in
region 2, Bisgormi in region 4 and Kidane Mihret in region 5. The causes of non-
functionality of these schemes were pump breakage, unproductive well (dried well),
and pump breakage and unproductive well respectively. The Belles scheme served for
28 months before pump breakage. Whereas the Bisgormi scheme served for four
months before the well got dry. The Kidane Mihret on the other hand served for four
months only before the pump got broke and the well got dry.
It was observed that there was a guard in all of the four schemes in region 1and
one of the schemes in region 2. The remaining 15 schemes were not having guards.
The guard works to protect the scheme from damage by animals and children. He will
be paid monthly from the contribution of users for operation and maintenance.
Institutionalization of the schemes
Water and sanitation commute existed in the eighteen villages of the whole
twenty villages. The two villages in which water supply and sanitation commute were
not formed were Bisgormi of region 4 and Kidane Mihret of region 5. Among the
eighteen villages 14 villages formed the commute after the completion of construction
28
work of the scheme. In the remaining 4 villages in region 1 water commute was
formed just at the inception time of the project.
Users in region 1 had rules and regulations in the use of water supply services.
The organization constructed the scheme, RWaSSHHPM, taught these users about the
importance of having rules and regulations and helped them to develop their own rules
and regulations on the use of the water supply services. The rules and regulations
basically included the punishment and measures that will be taken for delays in paying
operation and maintenance fee, the fetching time and so on. Users in a village in
region 2 also developed their own rules and regulation. They took this experience
from villages in region 1 as they were neighbors to them. We can learn from this the
importance of experience sharing. By enabling communities which have less
performance towards sustaining their schemes can learn a lot from villages with better
handling of the schemes. The reason given in villages where rules and regulations
were not developed was luck of awareness on the use of regulations. This implies a
need to inform or to teach about the importance of having rules and regulations in
introducing rural water supply and sanitation.
Modern hand dug wells like the one in figure 3 were the main source of water for
household use in the villages where the schemes were functional. Before the
construction of the modern hand dug wells or when the modern hand dug wells were
not functional: traditional hand dug wells, unprotected wells, rivers, ponds during the
rainy season and lake were mentioned as alternative sources of water used by the
respondents, table 3. This is especially the main problem in villages where the
schemes were not functional. These villages were Belles in region 2, Bisgormi in
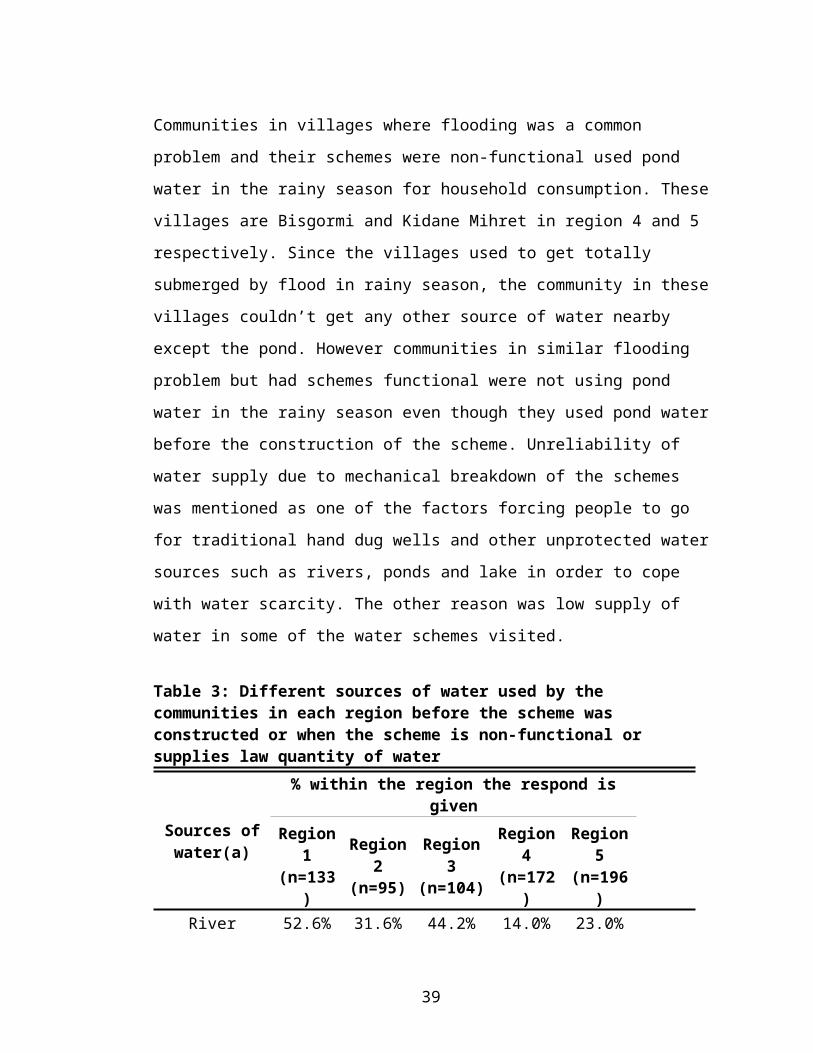
region 4 and Kidane Mihret in region 5. Communities in villages where flooding was
a common problem and their schemes were non-functional used pond water in the
rainy season for household consumption. These villages are Bisgormi and Kidane
29
Mihret in region 4 and 5 respectively. Since the villages used to get totally submerged
by flood in rainy season, the community in these villages couldn’t get any other source
of water nearby except the pond. However communities in similar flooding problem
but had schemes functional were not using pond water in the rainy season even though
they used pond water before the construction of the scheme. Unreliability of water
supply due to mechanical breakdown of the schemes was mentioned as one of the
factors forcing people to go for traditional hand dug wells and other unprotected water
sources such as rivers, ponds and lake in order to cope with water scarcity. The other
reason was low supply of water in some of the water schemes visited.
Table 3: Different sources of water used by the communities in each region before the scheme was constructed or when the scheme is non-functional or supplies law quantity of water
Sources of water(a)
% within the region the respond is givenRegion 1 (n=133)
Region 2 (n=95)
Region 3 (n=104)
Region 4 (n=172)
Region 5 (n=196)
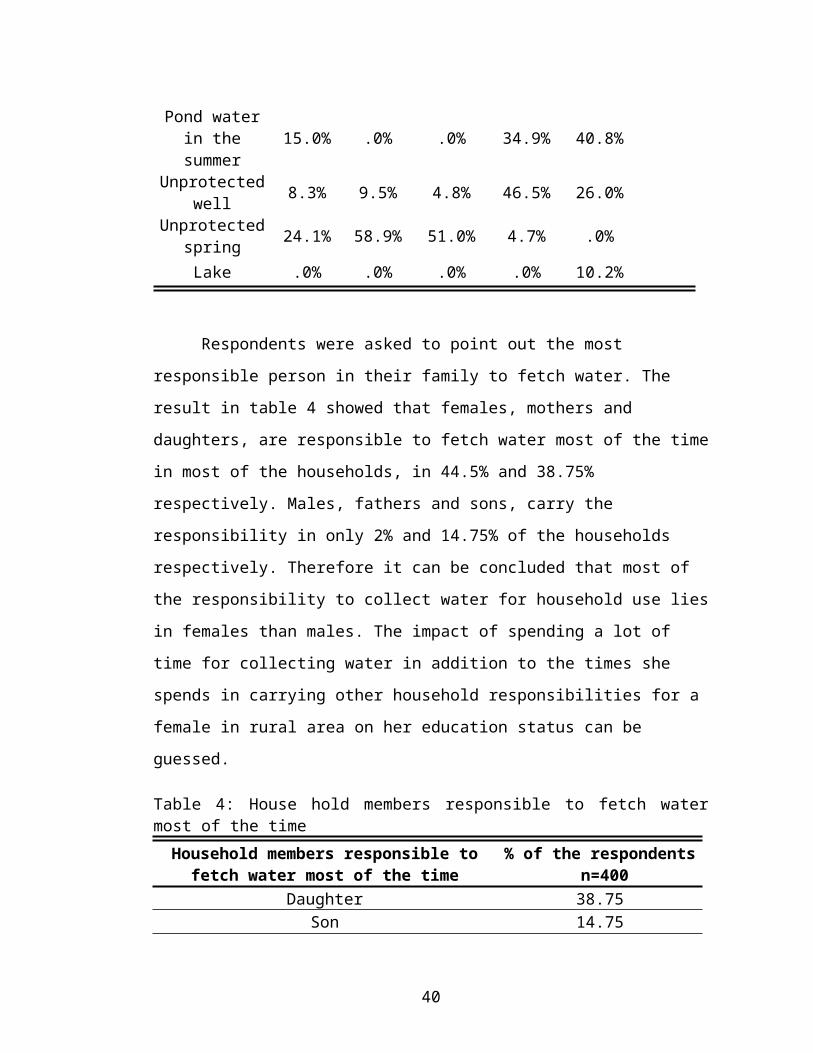
River 52.6% 31.6% 44.2% 14.0% 23.0%Pond water in the summer 15.0% .0% .0% 34.9% 40.8%
Unprotected well 8.3% 9.5% 4.8% 46.5% 26.0%
Unprotected spring 24.1% 58.9% 51.0% 4.7% .0%
Lake .0% .0% .0% .0% 10.2%
Respondents were asked to point out the most responsible person in their
family to fetch water. The result in table 4 showed that females, mothers and
daughters, are responsible to fetch water most of the time in most of the households, in
44.5% and 38.75% respectively. Males, fathers and sons, carry the responsibility in
only 2% and 14.75% of the households respectively. Therefore it can be concluded
30
that most of the responsibility to collect water for household use lies in females than
males. The impact of spending a lot of time for collecting water in addition to the
times she spends in carrying other household responsibilities for a female in rural area
on her education status can be guessed.
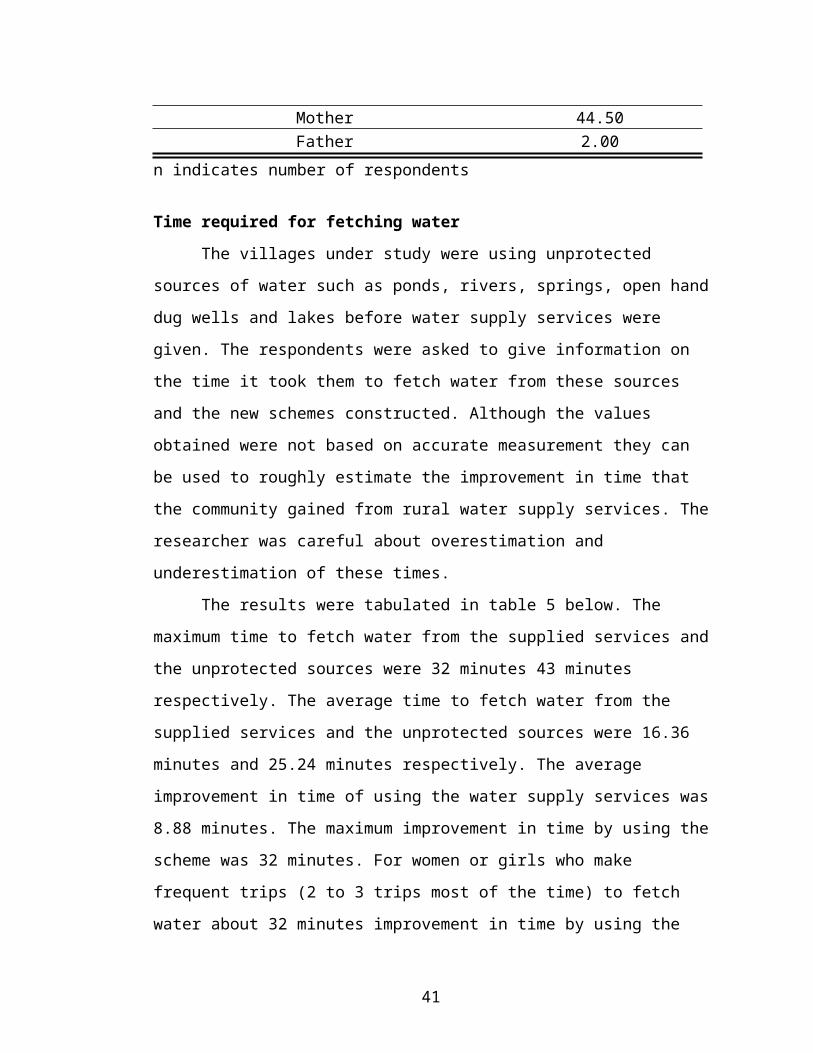
Table 4: House hold members responsible to fetch water most of the timeHousehold members responsible to fetch water
most of the time% of the respondents
n=400Daughter 38.75
Son 14.75Mother 44.50Father 2.00
n indicates number of respondents
Time required for fetching water
The villages under study were using unprotected sources of water such as
ponds, rivers, springs, open hand dug wells and lakes before water supply services
were given. The respondents were asked to give information on the time it took them
to fetch water from these sources and the new schemes constructed. Although the
values obtained were not based on accurate measurement they can be used to roughly
estimate the improvement in time that the community gained from rural water supply
services. The researcher was careful about overestimation and underestimation of
these times.
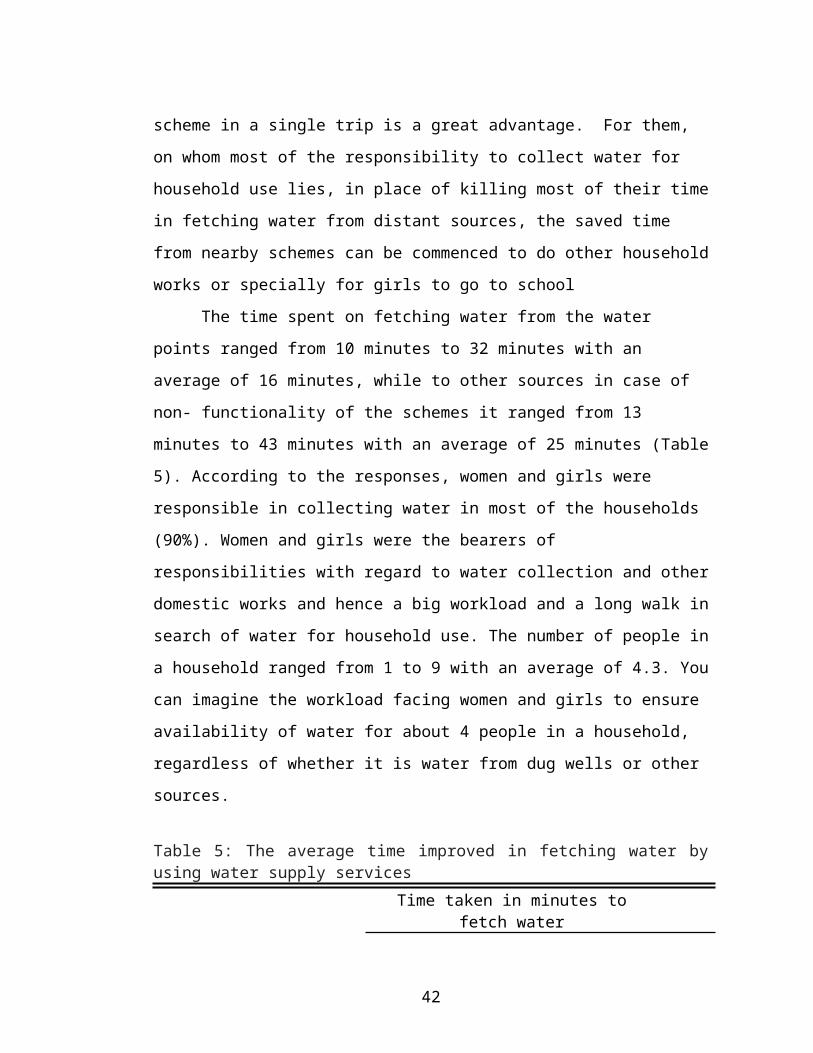
The results were tabulated in table 5 below. The maximum time to fetch water
from the supplied services and the unprotected sources were 32 minutes 43 minutes
respectively. The average time to fetch water from the supplied services and the
unprotected sources were 16.36 minutes and 25.24 minutes respectively. The average
improvement in time of using the water supply services was 8.88 minutes. The
maximum improvement in time by using the scheme was 32 minutes. For women or
31
girls who make frequent trips (2 to 3 trips most of the time) to fetch water about 32
minutes improvement in time by using the scheme in a single trip is a great advantage.
For them, on whom most of the responsibility to collect water for household use lies,
in place of killing most of their time in fetching water from distant sources, the saved
time from nearby schemes can be commenced to do other household works or
specially for girls to go to school
The time spent on fetching water from the water points ranged from 10
minutes to 32 minutes with an average of 16 minutes, while to other sources in case of
non- functionality of the schemes it ranged from 13 minutes to 43 minutes with an
average of 25 minutes (Table 5). According to the responses, women and girls were
responsible in collecting water in most of the households (90%). Women and girls
were the bearers of responsibilities with regard to water collection and other domestic
works and hence a big workload and a long walk in search of water for household use.
The number of people in a household ranged from 1 to 9 with an average of 4.3. You
can imagine the workload facing women and girls to ensure availability of water for
about 4 people in a household, regardless of whether it is water from dug wells or
other sources.
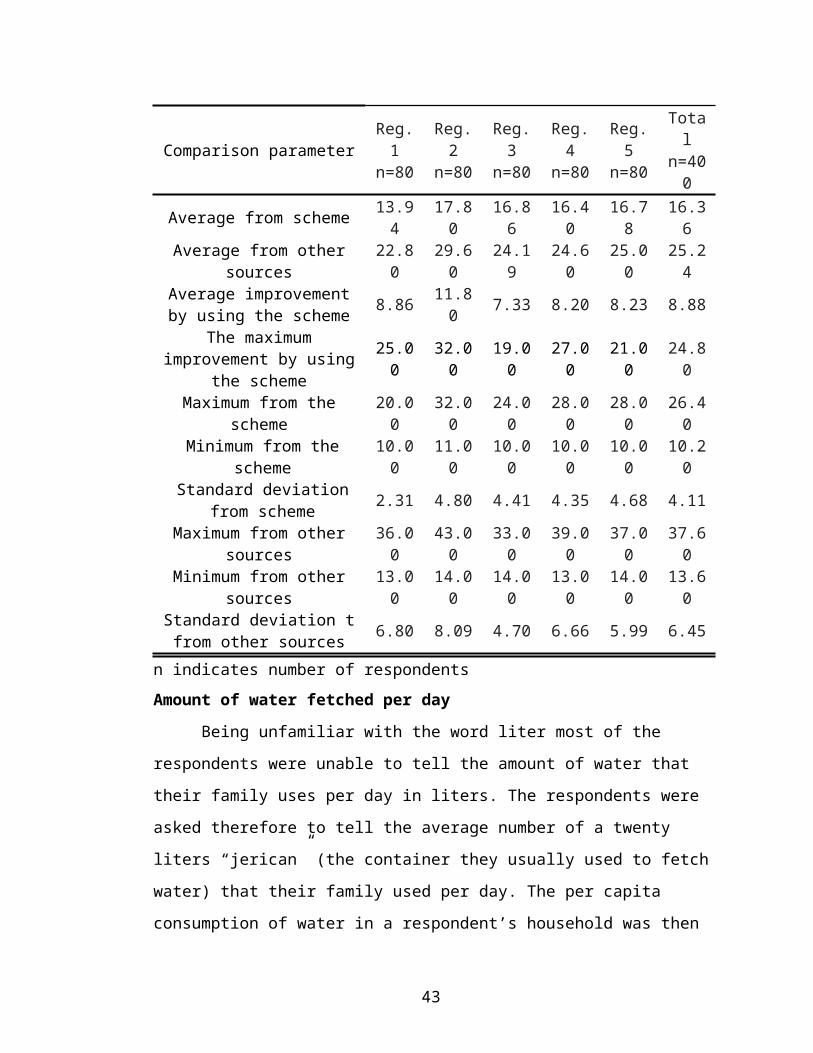
Table 5: The average time improved in fetching water by using water supply servicesTime taken in minutes to fetch water
Comparison parameter Reg. 1 n=80
Reg. 2 n=80
Reg. 3 n=80
Reg. 4 n=80
Reg. 5 n=80
Total n=400
Average from scheme 13.94 17.80 16.86 16.40 16.78 16.36Average from other sources 22.80 29.60 24.19 24.60 25.00 25.24Average improvement by
using the scheme 8.86 11.80 7.33 8.20 8.23 8.88
The maximum improvement by using the scheme 25.00 32.00 19.00 27.00 21.00 24.80
Maximum from the scheme 20.00 32.00 24.00 28.00 28.00 26.40Minimum from the scheme 10.00 11.00 10.00 10.00 10.00 10.20
Standard deviation from 2.31 4.80 4.41 4.35 4.68 4.11
32
schemeMaximum from other sources 36.00 43.00 33.00 39.00 37.00 37.60Minimum from other sources 13.00 14.00 14.00 13.00 14.00 13.60
Standard deviation t from other sources 6.80 8.09 4.70 6.66 5.99 6.45
n indicates number of respondents
Amount of water fetched per day
Being unfamiliar with the word liter most of the respondents were unable to
tell the amount of water that their family uses per day in liters. The respondents were
asked therefore to tell the average number of a twenty liters “jerican” (the container
they usually used to fetch water) that their family used per day. The per capita
consumption of water in a respondent’s household was then calculated by multiplying
the number of “jericans” used per day by twenty and then dividing the result by the
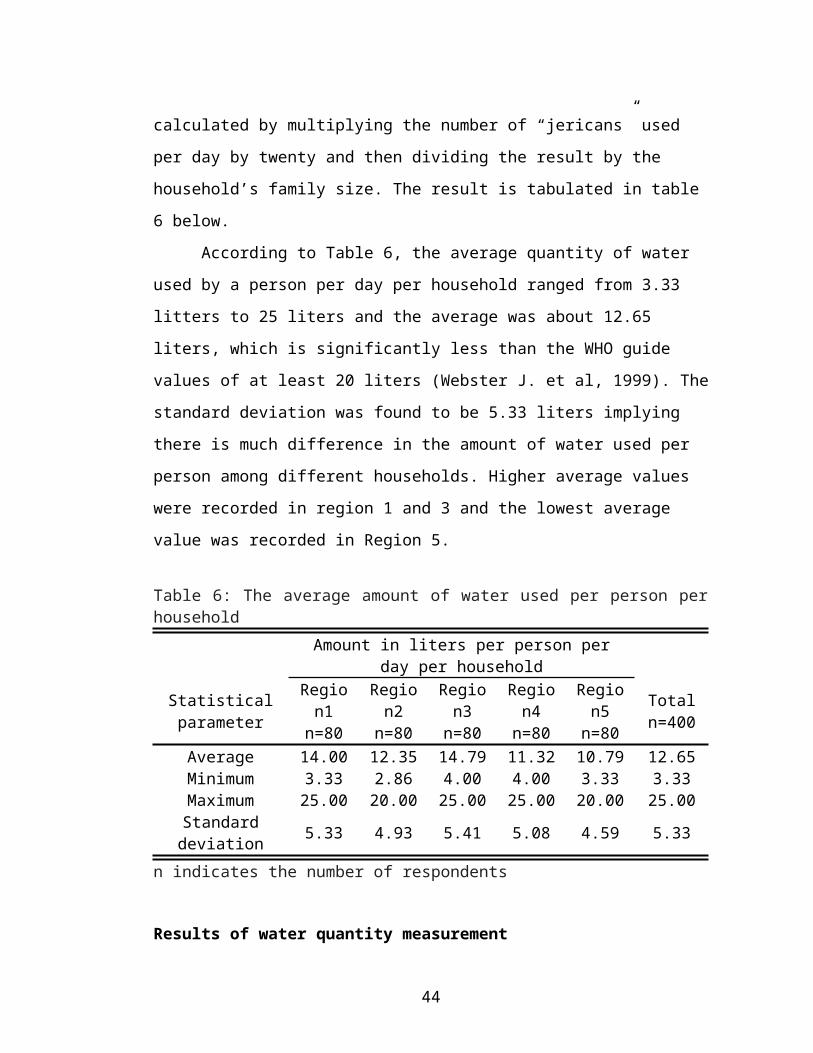
household’s family size. The result is tabulated in table 6 below.
According to Table 6, the average quantity of water used by a person per day
per household ranged from 3.33 litters to 25 liters and the average was about 12.65
liters, which is significantly less than the WHO guide values of at least 20 liters
(Webster J. et al, 1999). The standard deviation was found to be 5.33 liters implying
there is much difference in the amount of water used per person among different
households. Higher average values were recorded in region 1 and 3 and the lowest
average value was recorded in Region 5.
Table 6: The average amount of water used per person per householdAmount in liters per person per day per household
Statistical parameter
Region1 n=80
Region2 n=80
Region3 n=80
Region4 n=80
Region5 n=80
Total n=400
Average 14.00 12.35 14.79 11.32 10.79 12.65Minimum 3.33 2.86 4.00 4.00 3.33 3.33Maximum 25.00 20.00 25.00 25.00 20.00 25.00
Standard deviation 5.33 4.93 5.41 5.08 4.59 5.33
n indicates the number of respondents
33
Results of water quantity measurement
The Amhara Region Water Resources Office has developed a standard that
helps to decide whether the quantity of water that can be obtained from a well gives a
sufficient amount of water for a specified number of users. The procedure for
measuring the water yield is given in the Methodology section. The result of water
quantity measurement was then compared with the Regional Bureau of Water
Resources standard which is 20 liters/day/person. Water quantity measurement was
not done in villages in region 5 as the wells in these villages were deep and their
discharge could not be measured by locally available low capacity dewatering pump.
In the standard the yield of a well is defined as the amount of water the well gives in a
certain time. However it doesn’t mean that a well that has a certain amount of yield
can give that amount of water throughout the day. The continuous ground water flow
in to the well is affected by the level of water in the well. At the time the depth of
water in the well reaches the natural water table level, the flow of water from the
ground in to the well stops. This case will happen at the night time when the well is
not pumped by users. The water stored at the night can be used by users during day
time. The overnight storage is defined as the amount of water that can be stored by the
well in a single night.
According to the standard for a well that can store a certain amount of water in
a night, its yield should correspond with the amount specified in table 1 to fully supply
sixty to seventy households (from 300 to 350 users). This is based on an average use
of 20 liters of water per person per day which is believed to be enough for rural
people.
34
The results of the water quantity measurement show that compared to the
Amhara Region Water Resources Office standard five of the schemes (31.25%) did
not provide sufficient amount of water for the community, table 1 appendix 3.
The role of community participation and contractual agreement in increasing the
quantity of water supplied.
One of the approaches RWaSSHP followed was community participation in
decision making in the processes involved in water supply and sanitation works. The
community through its representatives (usually the water and sanitation committee)
participated in deciding whether the quantity of water that can be supplied by the well
under construction is enough for the community or not. The contractor would be
ordered to deepen the well by the committee to deepen the well if the committee
believed the yield of the well at that depth was not enough for the community.
RWaSSHP gave measured work payment1 contract to contractors. Payments to the
contractor were made by the provider only with the approval of the representatives of
the village.
Red Cross and LKWWRDO did not involve community participation in
decision making especially in approving whether the works of the contractor was
satisfactory. A supervisor was assigned to control the quality of work that a contractor
did under a fixed price2 contract agreement did. Five of the schemes constructed by
these organizations were found to provide a lesser quantity of water than the standard,
table 1 appendix 3.
Unlike Red Cross and LKWWRDO, RWaSSHP gave measured payment
contracts to contractors. Compared to the regional standard the wells constructed by
RWaSSHP provided a higher amount of water to users. Consequently, community
1 The type of payment agreement by which the contractor was paid based on the quantity of work he did. The more quantities of work he did the more he paid.
2 The type of payment agreement by which the contractor was paid only the amount specified in the agreement regardless of the quantities of work he did upon finishing the work.
35
participation in deciding whether further deepening of a well is required is important
in order for the community to receive sufficient water for their needs. This result
shows the higher importance of giving contracts based on unit cost than fixed price.
4.3 Community participation
Most NGOs accept and understand the need to fully involve all members of a
community in the planning and implementation of a water and sanitation project. It is
only through participation that communities will get a sense of ownership and should,
therefore, feel motivated to operate and maintain the system.
Table 7: Cash and kind contributions by the community for water supply systems
Types of cost sharing% within the region the respond is given
Region1 n=80
Region2 n=80
Region3 n=80
Region4 n=80
Region5 n=80
Total n= 400
In cash only 5.0% - - - - 1.0%In kind only 6.3% 13.8% 28.8% 22.5% 27.5% 19.8%
Both in cash and in kind 81.3% - - - - 16.3%
Didn’t share at all 7.5% 86.3% 71.3% 77.5% 72.5% 63.0%
n indicates the number of respondents
In Region 1, over 90% of the respondents have contributed cash, in kind or
both, table 7. The other regions contributed significantly less for the water supply
system and the contributions were only in kind. The reasons of the majority of the
respondents in regions 2, 3, 4 and 5 for not contributing project cost in cash or in kind
is for being not asked, (Table 2 Appendix 2). The other reasons given were being
poor, being old and unable to contribute in kind, the scheme being far and unreliability
of the scheme.
In Region 1, each of these respondents was obliged to contribute 3% of the
construction cost. This amounted from 10 Br to 20 Br with an average of 14 Br. The
payment varied among villages because the cost of construction differed. There were
36
also differences in payments among households within a village because the very poor
members were unable to pay. The shortages were made up by the rest of the
community members.
In kind contributions consisted of fencing the water point, removing excavated
material, providing locally available construction materials such as sand and stone,
inserting pre casted concrete rings in to the well shaft and installing pump (Table 3
Appendix 2).
Community satisfaction with the quantity of water supplied
The respondents were asked to scale their satisfaction level with the quantity of
water they got from the scheme they were using. The satisfaction level on the scale the
respondents were given to choose were: completely unsatisfied, unsatisfied, somewhat
satisfied, satisfied and completely satisfied in increasing order of satisfaction level. It
was found in table 8 below that only 45.5 % of the total respondents were highly
satisfied by the quantity of water supplied by the scheme they were using. More than
40% of them were less satisfied than the highly satisfied. The others level on the
satisfaction level of being satisfaction to some extent, unsatisfied and completely
unsatisfied.
Table 8: Community satisfaction with the quantity of water supplied% within the region the respond was given
Region 1 n=80
Regio2 n=80
Regio3 n=80
Regio4 n=80
Region5 n=80
Total n= 400
Completely unsatisfied - 1.3% - 12.5% - 2.8%Unsatisfied - 5.0% - 16.3% - 4.3%
Somewhat satisfied - 8.8% - 22.5% 3.8% 7.0%Satisfied 26.3% 55.0% 40.0% 46.3% 35.0% 40.5%
Completely satisfied 73.8% 30.0% 60.0% 2.5% 61.3% 45.5%
n indicates the number of respondents
37
The respondents were asked to tell the period through which the quantity of
water supplied was not enough to fulfill their demand. For the same scheme
respondents in a village were using, different periods through which low quantity of
water was obtained from the scheme were specified. These periods are explained in
table 9. The larger gaps in the periods were the highest in region 4 where respondents
claimed low supply from November to June.
Table 9: The period through which the quantity of water supplied is lower than the demand
% within the region the respond was given.Region 1
n=80Region 2
n=80Region 3
n=80Region 4
n=80Region 5
n=80Total n=400
November to June - - - 15.0% - 3.0%February to June - - - 16.3% - 3.3%March to June - - - 3.8% - .8%April to June - 3.8% - 18.8% 6.3% 5.8%May to June 5.0% 15.0% 8.8% 17.5% 13.8% 12.0%
Sufficient well yield throughout
the year95.0% 81.3% 91.3% 28.8% 80.0% 75.3%
n indicates the number of respondents
4.3.1 Community participation at the pre-planning and planning stage of the
project
The types of community participation activities during the planning stage of the
projects in each region are tabulated in table 4 appendixes 2. Each type of participation
activity is briefly described below. It was found that most of the respondents in region
1 participated on most of the activities specified in table 4 appendixes 2. However,
none of the respondents in the other four regions took part in any of the activities,
except in selecting place of construction.
Asking for services
38
The schemes in Region 1 were constructed after the community asked the
organization, RWaSSHP, to provide water. It was the belief of the organization that
communities with severe water supply problems will demand water supply services
prior to other communities. Asking for service would also ensure community
ownership.
The first step of RWaSSHP is to inform all communities in the woreda that
water supply systems are available to groups in villages satisfying the following major
criteria: (1) is able to contribute 3% and 7% of the total construction cost in cash and
in kind respectively (2) able to contribute the total operation and maintenance cost of
the scheme after construction. Community members requesting a hand dug well are
expected to form a group with a maximum number of sixty households. The
community is then expected to submit an application letter signed by all the
participanats to the RWaSSHP.
Selecting a well location
Communities know their environment best and can identify the potential
ground water areas. Based on previous attempts of finding ground water, the
approximate depth of the well and the likely cost can be estimated. The amount that
each household would need to contribute can be decided based on the feasibility of the
project and eventually agree to go with the organization.
Information from the community on excluding cultural sites is very important.
An engineer working in LKWWRO told the principal researcher about a problem he
faced for not participating community in selecting place of construction. He said that a
well constructed on an area where ancient people used as a grave area in a village
could not be used by the community. The primary reason was the fear that the quality
of water was affected by the buried remains. This experience tells how much it is
important to consider community participation in choosing a construction place.
39
Selecting the type of technology
With the help of the community facilitators of RWaSSHP, the community
participates in selecting the type of technology consisting of either a hand dug well,
shallow well, deep well, or spring. Each type of technology is priced, and the
community will select the technology based on the capacity to pay the 3%
construction cost and the advantages and disadvantages of each technology. In most of
the cases, a hand dug well was selected.
Participation in planning the project work
Based on availability and ease of access the community will identify the
construction materials that can be contributed The quantity of sand and stone required
will be estimated with the help of the community facilitator teams and the quantity
that each household need to contribute will be estimated. The water and sanitation
commute handles the responsibility to control the contribution. The community also
participates in planning the project work. This helps in arranging different works of
the project according to the working habits of the community.
4.3.2 Community participation in village meetings
Community participation in village meetings to address and discus water
supply and basic sanitation services in each region were assessed. Findings in table 5
appendix 2 depict community participation in the village meetings. 100% of the
respondents in Region 2, 3, 4 and 5 had not participated to the village meetings; they
said that meetings were not conducted by the village government leaders or the
respective organization giving service in each of these regions. In Region 1, 26% of
the respondents said that they contributed ideas for the improvement of water services
in the meeting with representatives of RWaSSHP. Twenty-seven percent in Region 1
did not attend the meeting.
40
In places where WASH worked, it can be seen that women in these areas have
participated in village meetings than the other villages where other organizations have
worked (table 5 appendixes 2). This is mainly due to the fact that RWaSSHP has
trained workers called community facilitator team that encourages women
participation in meetings. Women seat in front, they will be advised to share ideas in
the meetings if they are not sharing. One of the facilitators said that it is when asked
by name that women share their idea in meetings is most of the time
4.3.3 Community participation during the construction stage of the project
The water committees in region 1 involved in decision making during the construction
phase of the project. The committees in the other regions however were not involved
in making decision during the construction phase of the projects. Water committees in
Region 1 participated in ensuring that they provided sufficient water; supervising the
quality of construction; and approving the works of the contractor for payment. This
might be the case why the distribution of community satisfaction with the quantity of
water supplied by the scheme is the highest for this region, table 14 appendix 2.
4.4 Operation and Maintenance
4.4.1 Existing village level operation and maintenance practice
Sustainability invariably depends upon communities taking financial
responsibility for their schemes, which if achieved will enable scarce resources from
government and donors to be targeted specifically on areas where there is no improved
water supply, (Haysom, 2006; Parry-Jones et al, 2001). Communities are normally
expected to finance and manage the operation and maintenance of a system. This
requires capacity building in money management and organization and planning.
However, funds for O & M were not collected in most of the villages included in this
study. Only in the four villages of Region 1 and one village in Region 2 were O & M
fees collected.
41
Operation and maintenance training was given in all the regions except Region
5 where wells developed were deeper and it was believed to be impossible to maintain.
The trainings for Regions 1, 2 and 3 were given by the organization that installed
water supply system. For Regions 4 and 5 the training was given by Libo Kemkem
Woreda Water Resource Office after one year the construction of the wells were
finished (note that in these regions the training was not given by the organization
which constructed the scheme but the woreda water resource office gave the training).
It was found that 74% of the respondents in Region 1 and 83% in Region 2 did
not believe the operation and maintenance trainees had the capacity to maintain the
scheme, based on the trainees’ performance (Table 6 Appendix 2). None of the
trainees the researcher interviewed even tried to maintain the pump. 90% of operation
and maintenance trainees were not confident to maintain the systems by themselves if
failure occurs in the future.
Representatives of organizations explained that the cost for maintenance was
covered by the respective organization which maintained the schemes. A scheme in
each of region 1 and 3 and two schemes in region 4 were maintained only once since
the schemes had given service. A scheme in each of regions 2, 3 and 5 were
maintained twice since installation. No village had started using the money collected
for maintenance purpose in the schemes where the community was contributing
operation and maintenance cost. Include trainees’ attitude. Maintenance cost required
and operation cost required and the existing situation.
During the focus group discussion with the workers of the organizations it
became obvious that one of the bottle necks in village level maintenance practices was
lack of spare parts in both the local and national markets. Important parts of the hand
pump are made of plastic and wear easily by the up and down movement and need to
be replaced on a yearly basis. This issue was also raised by maintenance trainees.
42
4.4.2 Satisfaction with collection and use of operation and maintenance funds
Respondents in villages 1 and 2, where operation and maintenance costs were
collected, were asked about their satisfaction in how the funds were collected and
used. Twenty-two percent of the respondents in Region 1 and 45% in Region 2 were
dissatisfied with the collection of the funds. The reasons given were that not all users
paid and that the collection was late (Table 10).
In Region 1 23% of the respondents were dissatisfied with how the O & M
funds were managed. Forty percent were not content in Region 2. The dissatisfaction
resulted from not putting funds in the bank and the lack of (or minimal) reporting on
income and expenditures of the funds. The latter resulted in low trust by the
respondents (Table 11).
Table 10: Factors affecting effective collection of money in the regions where some villages practice collecting operation and maintenance cost
Reasons% within the region the respond was givenRegion 1 n=26 Region 2 n=15
Money is not collected from all users 57.7% 53.3%Delay in collection of the money 42.3% 46.7%
Percentages are based on responses.n indicates counts from multiple responds
Table 11: Factors affecting good management of operation and maintenance cost
Reasons% within the region the respond is given
Region 1 n=22Region 2
n=13Money collected should be put in the
bank 22.7% 53.8%
Low reporting rate of incomes and expenditures to the community 77.3% 46.2%
Percentages are based on responses.n indicates counts from multiple responds
43
4.7 Major problems encountered in water supply service
Table 7 appendix 2 lists all the problems the respondents claimed in the use of
water supply service they were using. The major problems are discussed as follows:
Low quality of water supplied
Two villages in region 4 and 5 reported that water quality problem exists in the
schemes they are using. They reported that the test and smell of the water they are
using has been changed after the schemes have served only one year. This might be
due to lack of frequent chlorination of the wells.
Low quantity of water supplied
Most of the respondents in region 1 and 3 (95% and 87.5% respectively)
reported as there is no low quantity of water supplied by the scheme they were using.
Low water quantity was reported as a problem in mainly in region 2, 4 and 5. This was
the case in regions where the community didn’t participate in planning, construction,
and operation phase of the project. The health extension agents in these villages stated
that they had had very limited success with hygiene education because the residents
used to complain that they did not have enough water to satisfy their primary needs
and hygiene was a distant secondary concern. They added that if the community in
these villages were provided enough quantity of water, then training them to store and
use their water in a hygienic manner would be much simpler as they would have a
sufficient supply of water to be able to worry about hygiene. It is obvious that with
law quantity of water supplied to the community building sustainable sanitation
practices will be impossible.
The beliefs of the respondents for no or law quantity of water supplied by the
scheme they are using are tabulated in table 12. They are:
Corruption: 14 responds in region 4 and 19 responds in region 5 believed corruption
between the contractors who constructed the schemes and the supervisor was one of
44
the reasons for no or low quantity of water supplied by the schemes they were using,
table 12. They believed that the existing depths of each of the wells they are using are
not enough to give enough quantity of water to the community. They said that the
wells needed to be deepened during construction. The respondents explained the
relation between corruption and deepening of well as follows.
After the contractors were selected based on tendering, payment agreement
was made between the contractor and the organization. The agreement explains that
the contractor would be paid the amount of money that he won during bidding up on
finishing the construction work regardless of the depth of the well he dug. In other
words the contractor will be paid the same amount of money whether he dug a shorter
or longer depth of well. To the contractor deepening the well more adds some extra
cost to him. The respondents said that we suspect the contractor and the supervisor had
negotiated for gaining the extra cost of deepening the well for them.
Slide of bottom well side made deepening difficult: 18 responds in region 4 and 41
responds in region 5 believe that slide of bottom well side made deepening work
difficult, table 12. They said the soil in the villages this issue was raised was a black
cotton soil type. At the water table the soil is moistened as a result due to its nature the
black cotton soil starts to slide and make the manual deepening of the well difficult.
These respondents claimed that the wells were not deepened to the depth where
enough quantity of water could be gained to supply the community.
Construction began lately: 6 responds in region 2, 32 responds in region 4 and 50
responds in region 5 the contractors were in a hurry to finish the construction work
before the rain hinders the construction work. Because of this the contractors had not
deepen the well at the depth where enough quantity of water can be obtained to supply
the community.
Low reliability of the schemes
45
This was the reason given by the respondents in all of the regions. This is
because the respondents have seen a lot of hand dug wells constructed in different
villages are not functioning. They said that the non-functionality of these schemes is
due to pump breakage. As a result they are in fear of pump breakage of the schemes
they are using now. As a result they the respondents who raised this issue are not
certain about the sustainability of the schemes they are using as they have seen a lot of
the similar technologies in different villages not functioning due to pump breakage.
Structural design not suitable to the village conditions
Problems related with structural design of structures was the case raised in
villages where flooding problem is high in the rainy season. These are the two villages
in region 3 (Keroye, and Agamoch) and four villages in region 4 (Kibichalle,
Bisrogmi, Bayiyo and Milangib). The flooding problem is due to overflow of Ribb
River. The respondents said that the height of the well head structure should be higher
than the depth of the pond that will be created during flooding so that the well head
structure can’t be submerged. Structural design is a part of a project work need to be
done at the planning stage. The villages in these regions didn’t participate at the
planning stage at all, table 4 appendixes 2. The fact that the primary reasons given in
these villages for not satisfied by the schemes were design related shows the
importance of appropriate design for the sustainability of a water supply intervention.
Appropriate design depends upon the communities’ needs and preferences and without
input from the diverse members of the communities it is unlikely that an externally
chosen infrastructure will be appropriate (Brett A. Gleitsmann et al, 2007). The
studied communities in these villages were not consulted during the design phases of
the water supply development projects and thus the dissatisfaction with the design of
the pumping infrastructure is not surprising. In this realm careful strategic ways of
46
engaging community through authentic participation in all processes involved in water
supply works is needed.
Non functionality of the schemes
Three villages in region 2 (Belles), region 4 (Bisgormi), region 5 (Kidane Mihret)
were un functional. The non-functionality in Belles is due to pump breakage. The non-
functionality in Bisgormi was due to pump breakage and dried well while that of
Kidane Mihret was due to dried well.
Table 12: Beliefs of the respondents for no or law quantity of water supplied by the schemes
% within the region the respond was givenRegion1
n=80Region2
n=88Region3
n=80Region4 n=121
Region5 n=82
Total n=451
Corruption 0.0% 6.8% 0.0% 14.0% 0.0% 5.1%Slide of bottom
well made deepening difficult
0.0% 5.7% 8.8% 27.30% 0.0% 10.0%
Construction began lately 0.0% 0.0% 0.0% 31.40% 22.0% 12.4%
Carelessness of the contractor and
supervisor0.0% 14.8% 0.0% 2.50% 3.7% 4.2%
Presence of hard rock made
deepening difficult5.0% 5.7% 0.0% 0.00% 0.0% 2.0%
No low quantity of water supplied 95.0% 67.0% 87.5% 20.70% 67.1% 63.2%
I do not know the reason 0.0% 0.0% 3.8% 4.10% 7.3% 3.1%
n indicates counts from multiple responds
4.5 Sanitation
The higher percentage coverage of latrine in region 1 might be attributed to the
higher frequency of education given by RWaSSHP. It can be said that the average
47
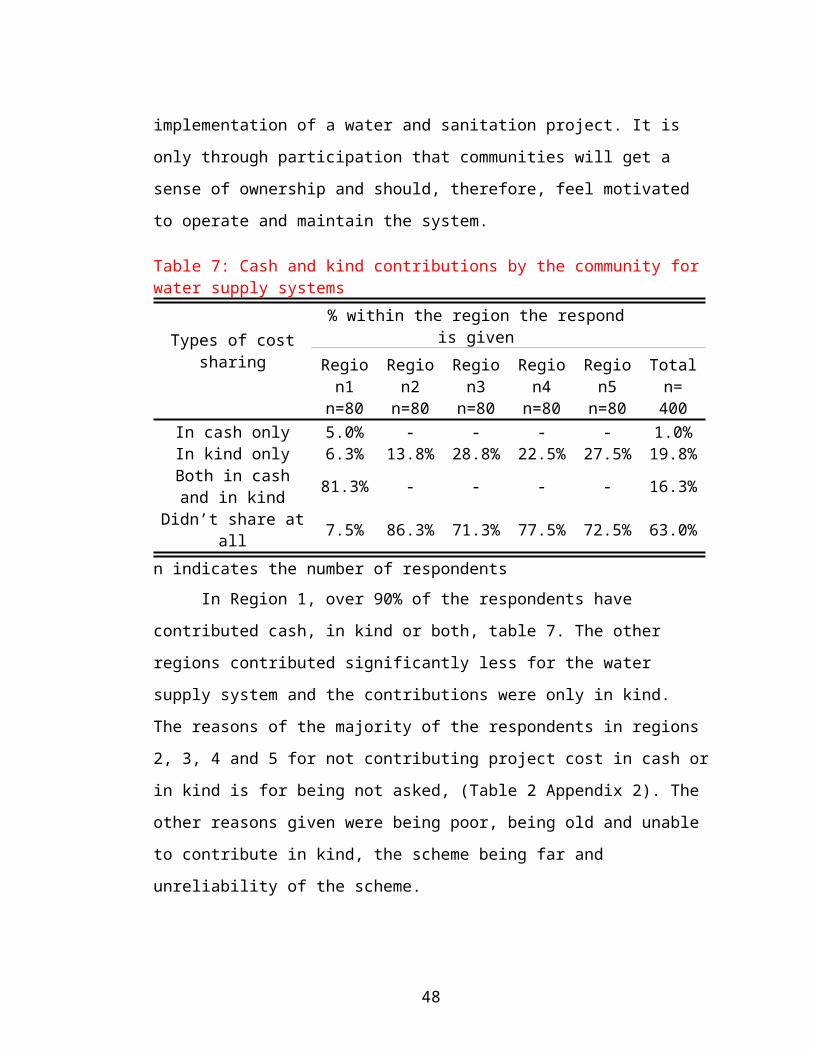
frequency of education given in region 1 was almost every two weeks, table 8
appendix 2 (because more of the respondents, 68.8% said almost every two weeks and
31.3% almost every month). However formal education was not given in region 4 and
5. Sanitation education was given in region 2 and 3 twice or once in six months of
time. The higher frequency of education given in region 1 was due to community
facilitators of RWaSSHP available only in region 1 to teach the community about
sanitation.
Another approach of WaSSHP that might help in getting higher percentage
coverage of latrine in the region it is working, region 1, is the presence of tea and
coffee ceremony. The community discusses in this ceremony the issues of sanitation
and water supply service with the community facilitators of RWaSSHP. The cost for
this ceremony is covered by community contribution for this purpose. The
organization also arranged programs for some villages by which new villages under
the program get experience in the construction and use of latrine from villages where
latrine construction coverage and use is high.
4.5.2 Types of latrines constructed
Three types of latrines were constructed in the five regions: open pit
latrine/without house, pit latrine with walls but without roof, and pit latrine with
closed wall and roof (Table 13). On the average over the five regions, 37% of the
latrines had a wall and roof. The maximum number of this type (70%) was found in
Region 1. An illustration of a pit latrine with wall and roof is shown in Figure 3. This
latrine has a container to store water for washing hands after defecating.
Table 13: Types of latrines used in the five regions% within the region the respond was given
Total n=400Region 1
n=80Region 2
n=80Region 3
n=80Region 4
n=80Region 5
n=80
48
Open pit latrine/without
house7.4% 10.7% 33.3% 44.4% 48.0% 25.0%
Pit latrine without closed wall but
with roof22.2% 53.6% 50.0% 37.0% 40.0% 37.8%
Pit latrine with closed wall and
roof70.4% 35.7% 16.7% 18.5% 12.0% 37.2%
n indicates the number of respondents
4.5.1 Number of latrine construction
In Region 1, 67% of the respondents constructed household latrines. In the
other four regions coverage ranged between 35% and 37.5% table 13 appendixes 2.
The majority of the respondents (80%) in Region 1 constructed their latrine after the
organization, RWaSSHP, started its work.
Respondents who constructed latrines were asked what groups were most
influential in teaching the community about sanitation: community facilitators,
volunteers, political leaders, or health extension workers. The results for Region 1 are
most interesting because all four groups participated in the process. In the other
regions, only politicians and healthcare workers took part (Table 14). Volunteers in
Region 1 consisted of females that were trained to teach 15 to 16 neighbor households.
Males taught male neighbors and female volunteers taught female neighbors on the
belief that within the same gender, the participants would be less inhibited and could
explain things more clearly. In Region 1, volunteers had the greatest influence on
constructing latrines followed by community leaders and health extension workers
(Table 14). The political leaders had the least influence because as the farmers
explained “the issues that the political leaders addressed were assumed to be related
with politics by the community”.
49
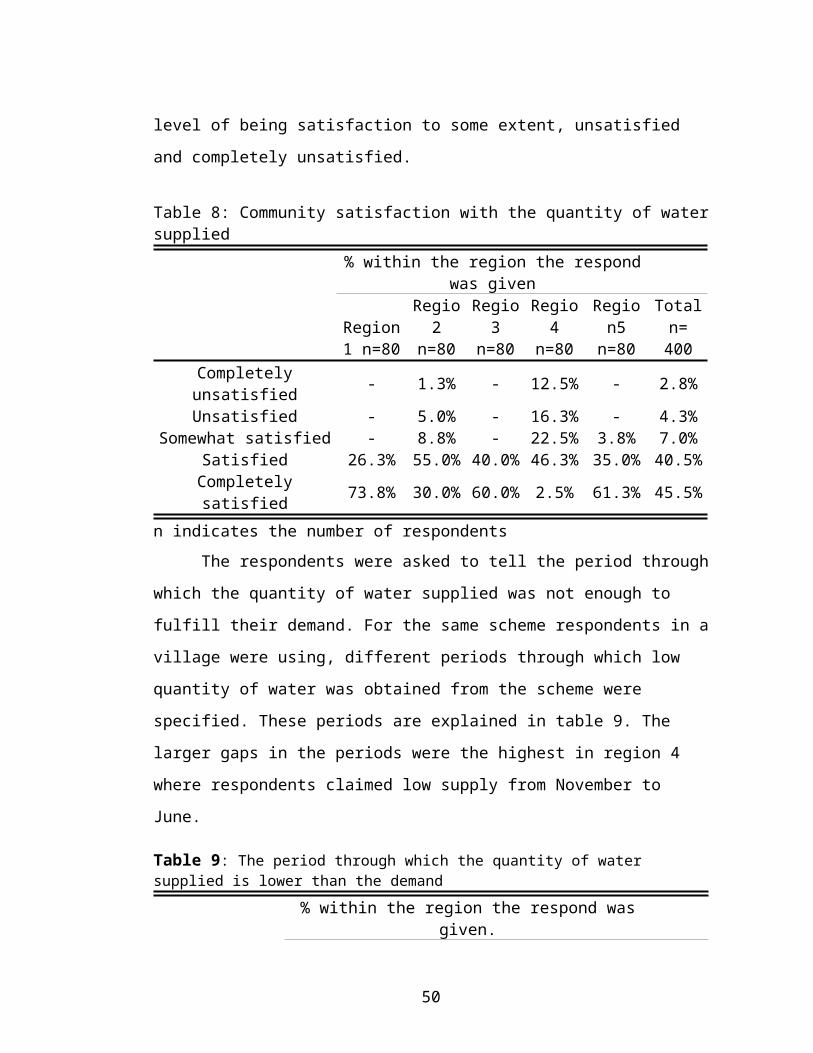
Table 14: Effectiveness of sanitation workers in promoting latrines% within the region the respond was given
Influencing workers Reg. 1 (n=80)
Reg. 2 (n=80)
Reg. 3 (n=80)
Reg. 4 (n=80)
Reg. 5 (n=80)
Total (n400)
Political leaders 5.6% 46.4% 26.7% 48.1% 36.0% 28.0%Community facilitators of
the organization 31.5% - - - - 10.4%
Health extension workers 20.4% 53.6% 73.3% 51.9% 64.0% 47.6%Volunteers 42.6% - - - - 14.0%
n indicates the number of respondentsReg. mean region
The greatest number of latrines in Region 1 can likely be related to both high
frequency of education and organization of tea and coffee ceremonies where sanitation
and water supply service issues were discussed. Both were instituted by RWaSSHP.
Cost for the tea and coffee ceremony was covered by the community. In Region 1,
“sanitation” meetings were held on two- to four-week intervals (Table 8 Appendix 2),
In Region 2, two to four meetings occurred per year and in Regions 4 and 5 no formal
education was given to the community.
4.5.3 Hygienic behaviors
Materials used most of the time for washing hands after defecation
More than 50% of respondents in all regions were neither using soap nor ash
for hand washing (Table 15). The majority of them were using water alone or water
and soap for hand washing after attending toilet. The number of respondents who
don’t use water at all after attending toilet was the smallest in Region 1. Use of soap
was limited because soap was reportedly expensive and was only used for laundry
purposes. For those who used it for hand washing after attending toilet, soap was not
kept at the toilet because of the fear that someone might visit the toilet and decide to
take it.
Table 15: The washing materials used most of the time after defecating% within the region the respond was given Total
50
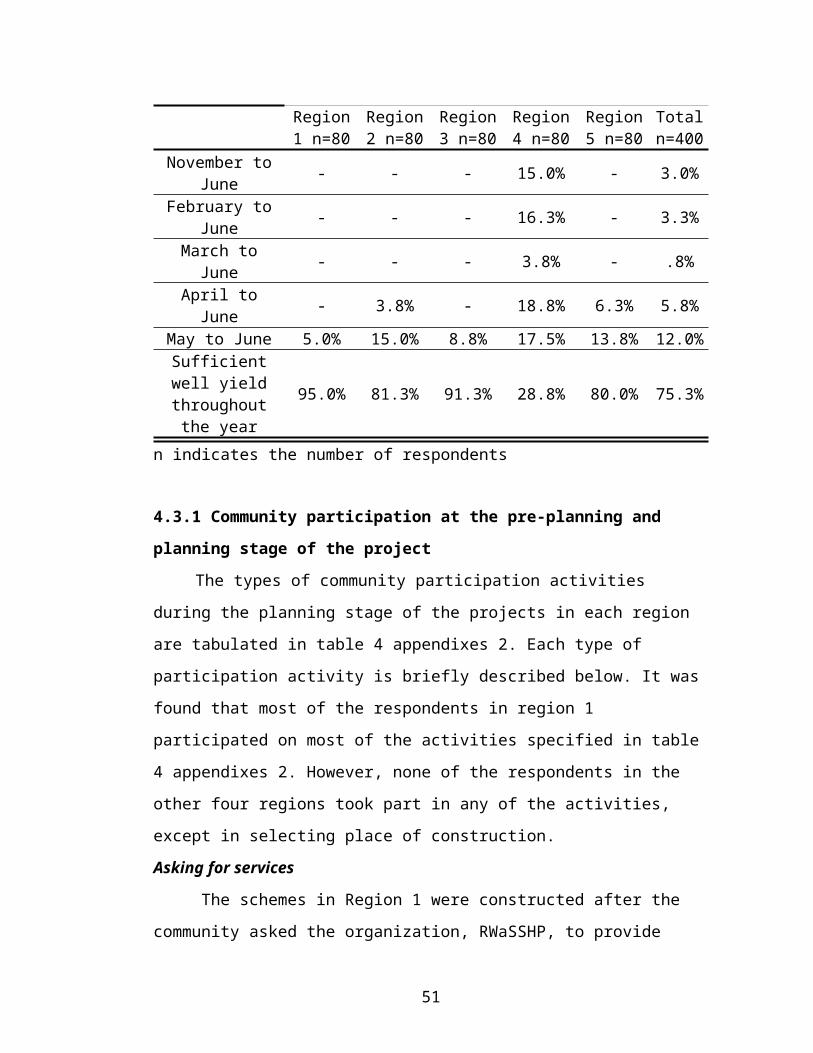
n= 400
Region 1 n= 80
Region 2 n= 80
Region 3 n= 80
Region 4 n= 80
Region 5 n= 80
Water only 29.6% 10.7% 16.7% 14.8% 24.0% 20.7% Water and soap 16.7% 3.6% - - 4.0% 6.7% Water and ash 27.8% 21.4% 20.0% 18.5% 16.0% 22.0% Don't use water at all 25.9% 64.3% 63.3% 66.7% 56.0% 50.6%
n indicates the number of respondents
Figure 3: Photos of sample watering points (A) and sample household latrine (B)
The habit of using latrines
The survey showed that if latrine was constructed, it did not mean it was used
regularly. Only 20% or less of those who constructed a latrine used it regularly (Table
9 Appendix 2). On average, about 35% of the respondents who had constructed a
latrine used it rarely or not at all. The reasons for not using the latrine regularly were
in order of importance: bad smell around the compound, feeling uncomfortable in
A B
51
using the latrine, and the large distance between agricultural fields and their home and
latrine (Table 16).
Table 16: Reasons of the respondents who have latrine for not using it regularly% within the region the respond was given
Total n=491Region1
n=82Region2 n=102
Region3 n=99
Region4 n=111
Region5 n=97
feel uncomfortable using latrine 36.6% 25.5% 31.3% 27.9% 27.8% 29.5%
Farther distance between farming place and home 26.8% 31.4% 23.2% 29.7% 27.8% 27.9%
Bad smell developed around the compound 36.6% 43.1% 45.5% 42.3% 44.3% 42.6%
n indicates counts from multiple responds
Pit latrines with bowls covered
Bowls and air vents are used to avoid bad smell around latrines. However in
most of the latrines observed in the five regions bowls were not covered and air vents
were not installed.
More than 65% of the latrine bowls were not covered (Table 10 Appendix 2).
This poses a risk as far as human health is concerned due to a high probability of water
contamination by flies from the latrines. Apart from water contamination, food and
utensils used in households may also be contaminated by flies. Moreover, covering
might prevent bad smells from spreading beyond the latrine. The greatest number of
latrines (57%) with bowls covered is found in Region 1. In the other four regions less
than 30% of the bowls were covered. There is a link between the presence of
volunteers and community facilitators to teach the community about sanitation and the
acceptance of sanitation facilities.
52
Bowl covers used in Region 1 can be taken as an experience that other
communities can share. They are easy to construct and can be made locally from
straw and mud. They have a funnel shape and handle at the top.
Disposing baby feces
Very few respondents disposed of baby faces in latrines (1.8%), instead threw
it inside their compound or in a nearby field (Table 17). Most of the respondents
believed baby feces were harmless while it has been reported that baby feces that is
not properly disposed might put household members at risk of diarrhea (Tumwine et
al. 2003).
Table 17: Places where baby feces are disposedRegion No.
Regio1 n=80
Regio2 n=80
Regio3 n=80
Regio4 n=80
Regio5 n=80
Total n=400
Throwing inside compound 70.0% 73.8% 70.0% 68.8% 71.3% 70.8%
Throw in the field outside their compound 26.3% 25.0% 27.5% 31.3% 27.5% 27.5%
Who put in to latrine 3.8% 1.3% 2.5% - 1.3% 1.8%
n indicates number of respondents
Defecating places used by respondents without a latrine or who did not use a
latrine regularly
The defecating places of the respondents who had no latrine or didn’t use the
latrine regularly were forest or bush areas, by river sides’, paddy fields and within the
home compound, table 11 appendix 2. The most frequently used places were home
compounds, paddy fields and forest or bush areas. The frequency of responses in
which defecating by river banks was relatively few; however, it was not difficult to
find feces along river banks. It is believed that human feces are sources of disease if
53
contamination with water bodies happens. In rural areas where rivers are used as a
source of water for household consumption, bathing and laundry, defecation along
stream banks especially can cause contamination.
4.9 The impact of rural water supply and sanitation services
The impacts of water supply and sanitation services on users were assessed based on
the effect of the services on women’s relief and the advantages that the services
brought to women.
Most of the respondents believed that the presence of latrines is most important
to females because it allows females to use the toilet during the day time. The habit of
defecating in fields or bushes during the day is not culturally accepted for women.
Women are able to defecate after sunset even though a need may arise. The risks, for
example intestinal drought, of not defecating at the right time can be imagined.
However the presence of latrine can give relief for women as they can attend latrine
during the day time. It should be noted that women defecating in latrine during the day
time has culturally acceptance. What is not accepted is defecating in day time in the
fields has like men do. I am not saying that women need to defecate like men in
bushes or forest like men but the presence of latrine is a relief for women in rural areas
and need to be encouraged.
4.6 Functionality and institutionalization of schemes and community satisfaction
with service
The organization constructed the scheme, RWaSSHHPM, taught these users about the
importance of having rules and regulations and helped them to develop their own rules
54
and regulations on the use of the water supply services. The rules and regulations
basically included the punishment and measures that will be taken for delays in paying
operation and maintenance fee, the fetching time and so on. Users in a village in
region 2 also developed their own rules and regulation. They took this experience
from villages in region 1 as they were neighbors to them. We can learn from this the
importance of experience sharing. By enabling communities which have less
performance towards sustaining their schemes can learn a lot from villages with better
handling of the schemes. The reason given in villages where rules and regulations
were not developed was luck of awareness on the use of regulations. This implies a
need to inform or to teach about the importance of having rules and regulations in
introducing rural water supply and sanitation.
4.8 Community preferences
Preferred meeting places and times to discuss or teach water supply and
sanitation issues
It is important to give attention to community preferences in places and times
to discuss or learn water supply and sanitation issues. Discussing or teaching these
issues in places and times that the community prefers helps in getting the full attention
of the participants. This in turn helps in addressing the issues easily and to the desired
level. The respondents were asked to choose the most preferred places and times to
discuss water supply and sanitation issues among the places that had been commonly
used. Most of the respondents, about 69.5%, preferred to discuss these types of issues
under tree shade near villages during local holidays (none working days), table 18
below. 25.75% of the respondents preferred places where social programs such as
“Zikir”, “Senbete” and “Kub” are undergone. The minority of the respondents, 4.75%,
chose discussion in churches after the church program is over.
55
Table 18: Places and times preferred for discussion or learning about sanitation and water supply issues
List of meeting place and time % of responds n=400
In churches after the church program is over 4.75In churches or other places during social programs such as
“Senbete”, ” Kub”, and “Zikir” 25.75
In places where social or political issues are discussed during non-working days 69.50
n indicates counts from multiple responds
The respondents were also asked to choose the most disliked places and times
to discuss or learn water supply and sanitation issues. The results are tabulated in table
19 below. Most of the respondents, 65.25%, hated discussion or learning these issues
in churches after the church program is over. 22.75% of the respondents hated places
where social programs such as “Zikir”, “Senbete” and “Kub” are undergone. The
minority of the respondents, 12%, chose discussion in churches after the church
program is over. Most extension workers or political leaders prefer churches to discuss
their agenda with the community. This is because they believed that higher number of
persons can be obtained without pre informing. On the other hand most community
members hated discussion or learning in churches after church program is finished.
This is because they go to church early in the morning before eating their breakfast
and need to go to home and eat breakfast as soon as the church program is finished
rather than having a discussion or learning with any issues. The church program
usually takes up to four hours and a person who didn’t eat breakfast prefers to go to
home to eat than discussing or learning any agenda. It will be therefore difficult to get
full attention, from people in hunger and need to eat breakfast, in discussing or
teaching about water supply and sanitation issues.
56
Table 19: Places and times hated for discussion or learning about sanitation and water supply issues
list of meeting place and time % of responds n=400
In churches after the church program is over 65.25In churches or other places during social programs such as
“Senbete”, ” Kub”, and “Zikir” 22.75
In places where social or political issues are discussed during holidays 12.00
n indicates number of respondents
4.10 Community thoughts in sustaining rural water supply services
Community thoughts in sustaining rural hand dug well water supply from table
12 Appendix 2 the highest number of respondents believe on community
empowerment in the processes involved in the project works. These are choice of
place of construction, controlling the quality of construction and financial aspects of
the project.
Six respondents in region 1 and seven in region 2 said that encouraging private
sectors to make available hand pump spare parts in the market is one of the solutions
to sustain hand dug well water supply schemes. Some workers of the organizations
whom the researcher discussed this issue agrees with this idea. They said that
eventhough selected members of the community were trained in each scheme so that
they can maintain it by themselves, lack of hand pump’s spare parts in the local
market was the bottle neck hindering community based maintenance practice. They
added also as they were unable to get spare parts not only in the local market but also
in the national market. Some of the five organizations, RWaSSHP, LKWWRO and
ORDA do maintain hand pumps of the schemes they constructed. However the spare
parts they are using are those additional pump parts supplied when a new pump set is
bought. The limited number of spare parts supplied in the new pump sets can be used
57
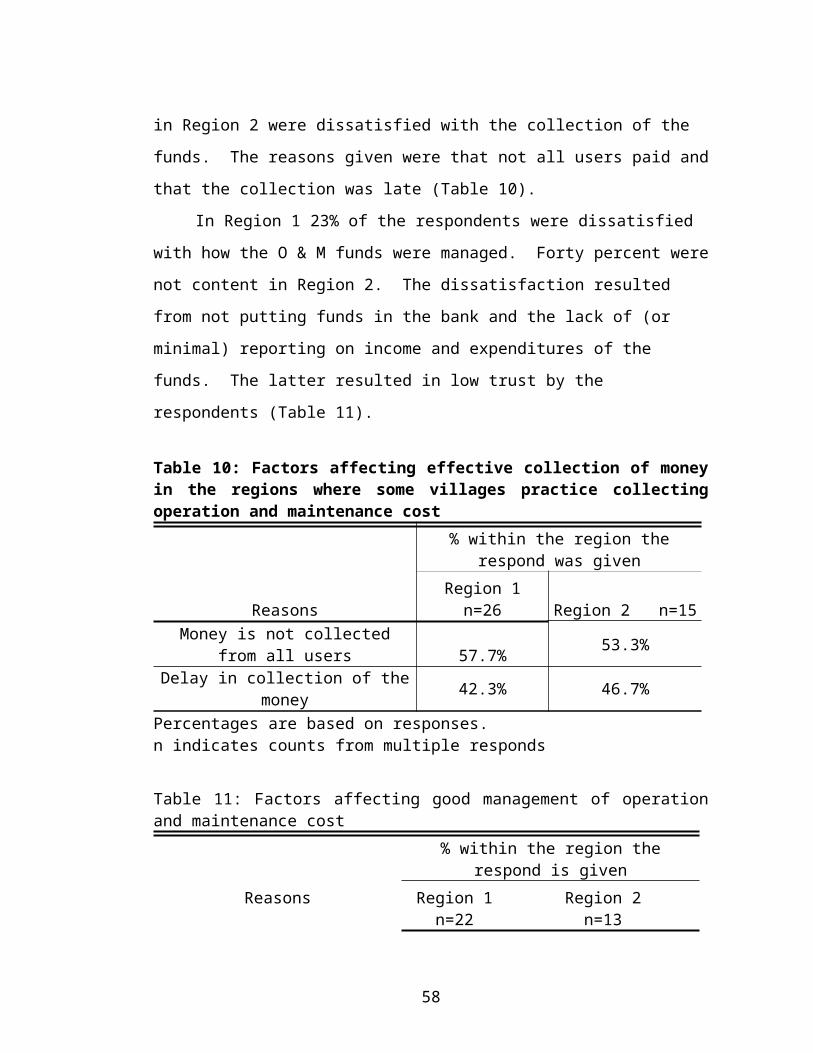
for a limited number of years. Therefore for sustainable use of the hand dug wells,
hand pump spare parts need to be available in the market.
Some respondents also said that a continuous support is required. According to
this respondents the continuous support they believed need to be given are immediate
maintenance during failure and periodic treatment of water. Some respondents also
said the construction period especially the digging time need to be in the dry period in
order to sustain the scheme. In the villages these respondents lived the quantity of
water supplied was lower and they believed the reason for the low quantity of water
supplied was the digging of the well in the wet season instead of the dry season. They
said that the water that is obtained during the wet season might not be available during
the dry season however the water that can be obtained during the driest period is more
likely to be available at all times.
Some other community beliefs in sustaining rural water supply included:
schemes should not be constructed near road ways rather near homes, efficient and
committed leaders required; strong bylaws need to be developed, good fencing and
guarding practice required and closure settlement of users.
58
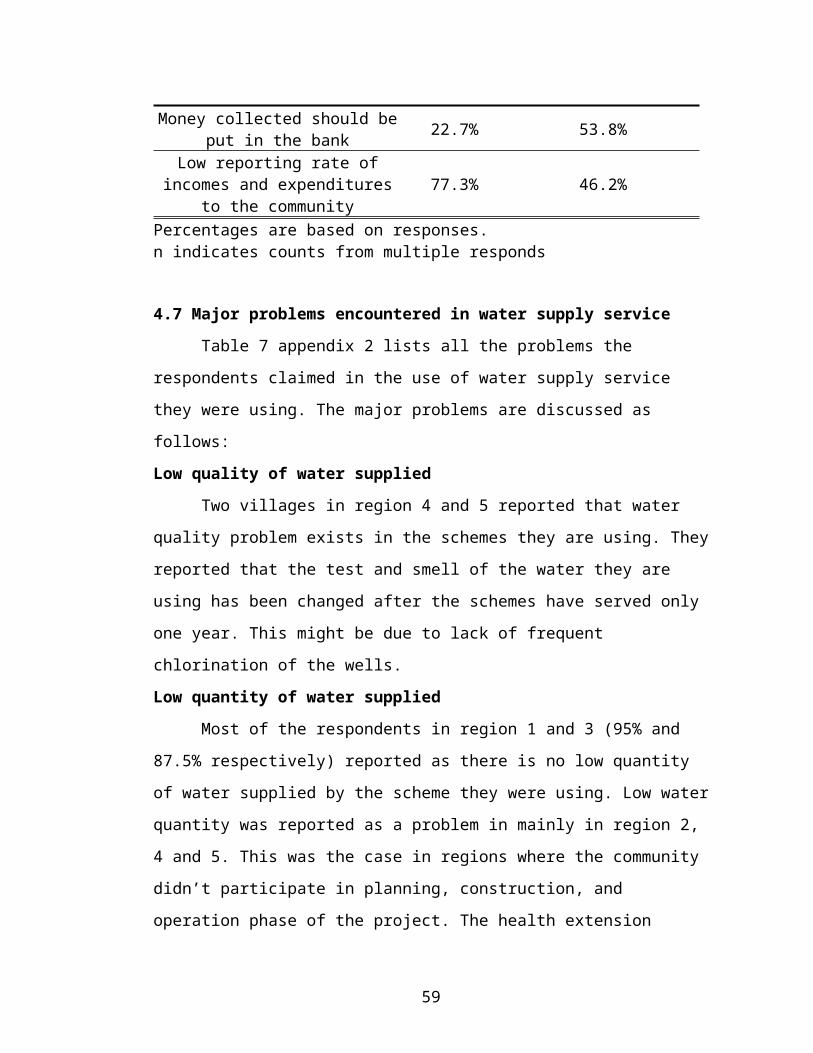
Chapter 5
5 Discussions and Conclusions
5.1 Discussions
The very low coverage of drinking water supply and sanitation in rural areas of
Ethiopia has existed for decades (Birhanu A. 1999, EMoWR, 2007, World Bank
2005). The reason behind is not only low construction rate but also the already
constructed services are not used sustainably. However it doesn’t mean that all the
constructed schemes are not giving service in a sustainable way. Some of them
constructed under the approach of some providers are used in a sustainable way and
some others constructed under different providers approach are not used in a
sustainable way. Therefore it is important to sea which approaches helped in
sustaining rural water supply and sanitation services and which of them didn’t so that
the right approaches need to be followed by providers can be identified.
The functionality of the scheme directly affects household water use. It was
observed that in the villages where schemes were not functional people used
unprotected sources of water such as flood pond. In rural settings where there is very
less environmental protection practice, for example defecating in fields is a common
practice, cattle dung spread over fields the possibility of pollution of pond is
unquestionable. A need to give immediate solutions to the non-functional schemes is
therefore important.
The suitability of structural design of well head to the village conditions was
among the problems encountered in water supply services in the villages where
flooding was a problem. The structural design in these villages was done without the
involvement of the community in the process. If the community were involved in the
design process they might had the chance to explain the flooding problem so that the
59
designer can fix the height of the well head according to the depth of the pond that
could be created by the flood.
It was found that average distance to the schemes decreased in villages
provided service with the demand driven approach which require a 10% construction
cost share by the community. This shows that households settled closely are likely to
agree to pay the 10% construction cost than households settled sparsely. The need to
have a nearby scheme by each household might be the cause why closely settled
households are more likely to agree than sparsely settled households.
It is important to give attention to community preferences in places and times to
discuss or learn water supply and sanitation issues. Discussing or teaching these issues
in places and times that the community prefers helps in getting the full attention of the
participants. This in turn helps in addressing the issues easily and to the desired level.
Most extension workers and political leaders prefer churches to discuss their agenda
with the community. This is because they believed that higher number of persons can
be obtained without pre informing. On the other hand most community members hated
discussion or learning in churches after church program is finished. This is because
they go to church early in the morning before eating their breakfast and need to go to
home and eat breakfast as soon as the church program is finished rather than having a
discussion or learning with any issues. Most of the respondents preferred to discuss
such types of issues in a formal meeting in non-working days.
The time taken to fetch water from protected sources greater than 15 minutes
in most of the villages in this study exceeded the guide line value recommended time
by WHO (World Bank, 1999), which is set at 15 minutes of walking distance,
equivalent to a distance of about one kilometer. Thus daughters and mothers, who are
the common water attendants, spend much time on water collection in the rural
60
settings of Ethiopia. This is believed to affect spare times required for other household
affairs that may impact the health of the family as a whole (WHO, 1992).
The amount of water per capita consumption, about 12.65 liters and less used
by the majority, was significantly different from WHO guide line value set at least 20
liters per capita per day (Webster J. et al., 1999). Inadequate drinking water adversely
affects personal hygiene, clean food preparation, and housing sanitation, hence
favoring the transmission of water borne and water washed communicable diseases.
The amount of water used per person per day increased relatively in villages where
there is no low quantity of water supplied by the services than in villages where the
services provided low quantity of water. Though the water quantity measurement at
some of the schemes showed a higher amount of water than the WHO standard, 20
liters per person per day, can be supplied, still the amount used by users was found to
be lesser. This implies that the amount of water used for different purposes such as
keeping personal hygiene, clean food preparation and housing sanitation was lower
than that need to be used. This in turn implies the per capita consumption is not only
determined by the quantity of water supplied but also community behaviors on the use
of water for different purposes.
In the focus group discussion lack of spare parts and required manpower in
some of the providers are some of the observed problems in the water supply service.
Some workers of the providers said that they couldn’t get spare parts not only in the
local market but also in the national market. They got the spare parts they were using
sometimes from additional parts that were supplied when a new pump sets were
bought. They added that the limited number of spare parts that can be obtained from
buying new pump sets can be used for not more than two years. Therefore for a
sustainable use of the schemes spare parts should be available on local market. For this
the reason(s) why private sectors are not participating in the supply of spare parts need
61
to be known and possible solutions need to be fined accordingly. The LKWWRO also
lacked the required manpower especially social workers to do activities like
community mobilization and participation. This was mainly due to the manpower
structure designed by the government for this office didn’t include social workers. It
mainly included technical persons. Community mobilization and participation are
among the activities that need to be done by social workers. In money literatures these
are among the major factors that determine sustainability of rural water supply and
sanitation services. Therefore the required manpower in the office should be available
so that the desired social works to be done to ensure the continued service of water
points.
It was also discussed in the focus group discussion that he water committees
formed in villages where the project period of the providers was small (only for not
more than four months which was the construction period) were found not properly
doing their job. In the same way the guards were found not doing their job. However
in villages where the project period of the providers was long (more than 1.5 years in
most of the villages) the water committees and guards were found properly doing their
job. This indicates that the formation of committee and guard alone is not enough for a
continued function of these bodies a continuous follow up and support is required until
they accustomed their jobs.
Field observations had given a chance to observe both the negative and
positive factors related to water use and physical features of the water schemes. The
presence of rules and regulations, fences, proper and fixed time of fetching and guards
in 25% of water points is a positive participatory response from the beneficiaries
reflecting their desire to sustain the technology. Negative attitudes are related to the
mishandling of water sources like poor site clearing and not totally having or
maintaining fences in most of the schemes.
62
In villages where the community participated in decision making during the
construction stage (especially in deciding whether the depth of excavation was enough
or not to obtain enough quantity of water from the well) community satisfaction with
the quantity of water supplied increased relatively. This indicates the importance of
community involvement in decision making. This reason can be seen in the other
direction. In the villages where the satisfaction with the quantity of water was
relatively low their beliefs for the low quantity of water supplied was corruption
between the contractor and the supervisor and carelessness of the supervisor and
contractor. Both these problems can be controlled with the involvement of community
in the process.
Effective O&M is essential for sustainability and village level operation and
maintenance is one of the ways through which sustainability can be achieved.
However the government has not facilitated village level operation and maintenance
effectively and services cannot be managed by communities alone. Village level rural
operation and maintenance has limited success if ongoing support is not provided. For
example (1) the capacities of the trainees need to be checked every time and if
required additional training need to be given so that the trainees’ ability to maintain
schemes is assured, (2) to solve the problem of spare parts a way has to be sought to
assure presence of spare parts on the market for example enabling private sectors to
participate on this activity (3) in villages where operation and maintenance cost
collection is not practiced a way these types of villages can practice has to be sought.
With the above mentioned types of maintenance practice in 2009 today achieving the
millennium development goal, to reduce by half the number of people without
sustainable access to safe drinking water by 2015, will be difficult in the case of this
study area.
63
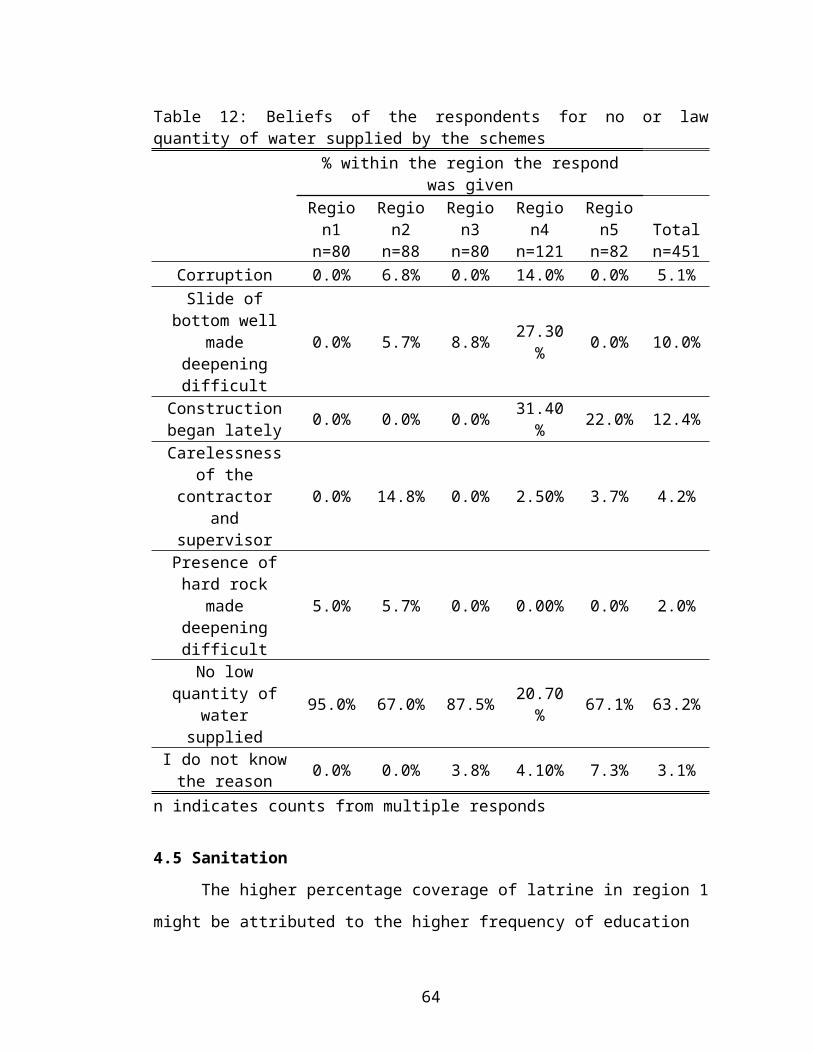
In villages where volunteers were trained and worked to teach the community
about sanitation the latrine construction coverage increased relatively than in villages
where volunteers didn’t exist. Some hygienic behaviors (hand washing habit, Presence
of latrine bowls, the habit of using the constructed latrine and proper disposal of baby
feces) were also better in these villages where volunteers existed. It was also found in
these villages that most people accept sanitation lessons easily and immediately from
volunteers than health extension workers and political leaders. This tells us a need to
scale up the presence of volunteers in villages where volunteers are not present so that
higher latrine construction coverage can be achieved.
One of the reasons given by the respondents for not using the latrine they
constructed in their home regularly was farther distance between farming place and
home. These respondents said that it would take a considerable amount of time to
come to home to use latrine from farming places. To combat this problem a need to
construct communal latrines around farming and grazing places is required.
Organizations involved in sanitation works in rural areas should not focus only in
household latrine construction they also need to focus in the construction of communal
latrines around farming and grazing places.
Involving communities in identifying and planning procedures projects is time-
consuming and cannot be rushed. The traditional hardware-driven approach to water
and sanitation projects does not allow time for community consultation or
participation. A community-based approach requires a much longer lead-in time and
NGOs must have a long-term commitment to see the project through. This is
particularly important when working with poorer communities who may be lacking in
organizational structure and need more capacity building. Projects with a significant
hygiene promotion or behavior change component also need long-term inputs from the
implementing NGO. Donors need to be educated to understand the need for longer-
64
term funding to achieve sustainable projects, and both donors and NGOs should move
away from the “target number of installations” approach and concentrate on achieving
positive long-term benefits for end users.
5.2 Conclusions
The different approaches followed by the different providers had resulted in
the difference in the sustainability of water supply and sanitation services even in
villages under similar circumstances (social, cultural, economical and geographic
locations).
Community participation at all stages of the project, proper capacity building,
and availability of spare parts are special factors to sustain the system. Community
participation at all stages of the project work is very important in addressing the exact
problems of the communities under a given situation, for example: (1) redesigning of
structures can be made if flooding is a problem; (2) community participation in
making decisions during the construction phase helped in assuring the quantity of
water that can be obtained from the well was enough or not by involving in the
decision whether further deepening of the well to get enough water is required or not.
Without effective O & M practice the sustainability of rural water supply schemes
can’t be achieved. If this target is to be achieved through village level O & M the
capacities of village level trainees should be strengthened because none of the
respondents of trainees has said he had confidence in maintaining schemes; they didn’t
maintain the system even failure happened. Besides the reason(s) why private sectors
are not participating in the supply of spare parts need to be known and accordingly
possible solutions need to be found so that spare parts could be available in the local
market. Even though the providers had given the service and left the villages other
methods by which communities which are not contributing O & M should start to
contribute need to be sought.
65
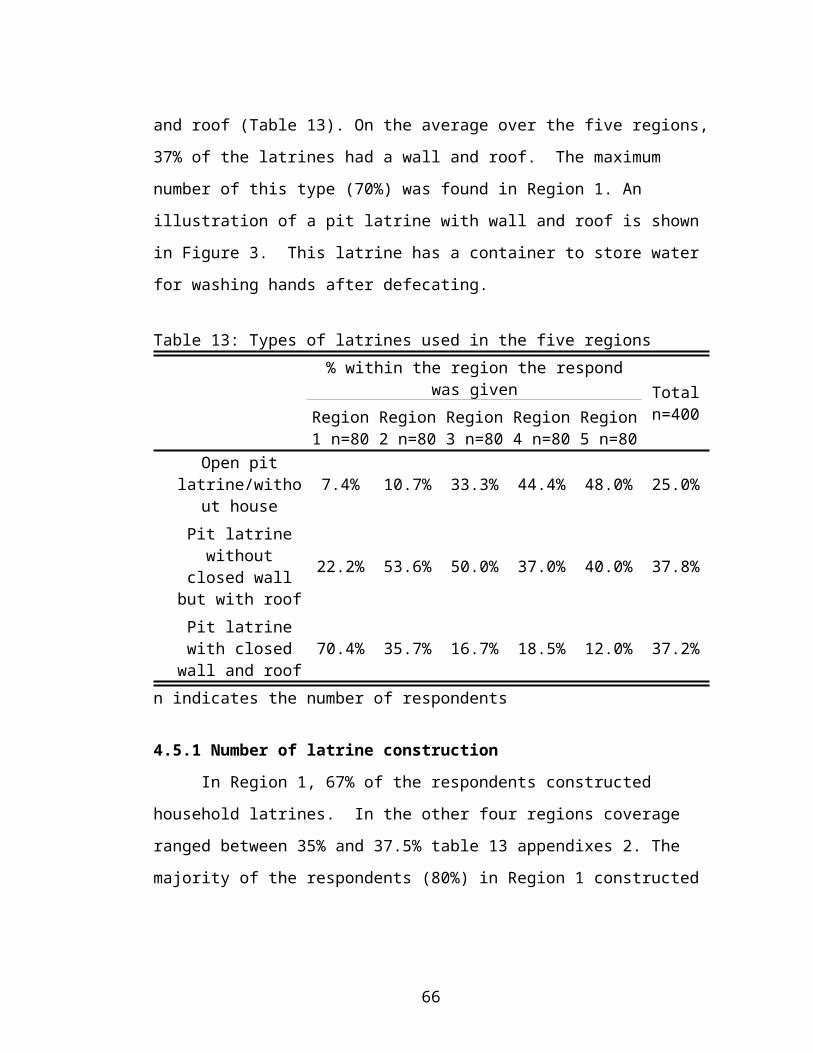
The project period of the providers should be enough to insure the
institutionalization of the schemes by the community. The project period should not
consider only the time required to construct the physical structure. It should also need
to consider the time that will be required to achieve institutionalization of the scheme
so that the constructed scheme can be governed by the community. The water and
sanitation committee could not serve the community for long unless a continuous
follow up and support is given. To do this the providers need to have a project period
through which the institutionalization of the schemes is assured.
To get the proper attention of the community while discussing water supply
and sanitation issues the meetings places and times need not to be in churches after
church program is finished. Instead they need to be in formal places during non
working days.
Providing enough quantity of water didn’t ensure the use of water that need to
be used according to the WHO standard, 20 liters per person per day. This was mainly
due to the lesser amount of water used in clean food preparation, keeping personal
hygiene and housing sanitation. The limited amount of water used when surplus
supply was available was due to lack of awareness on the effect of using the required
amount of water. Therefore besides providing enough quantity of water providers need
to change this behavior through education.
Improvement in the hygiene behavior of a community cannot be sustained
without a concurrent improvement in the quality of environmental sanitation and the
supply of safe drinking water. Therefore providers should not work on water supply
and sanitation separately instead they need to integrate the two as they are very much
dependent on each other.
Success on large latrine construction coverage depends on the presence of
community facilitators and volunteers. This can be scaled up in villages where
66
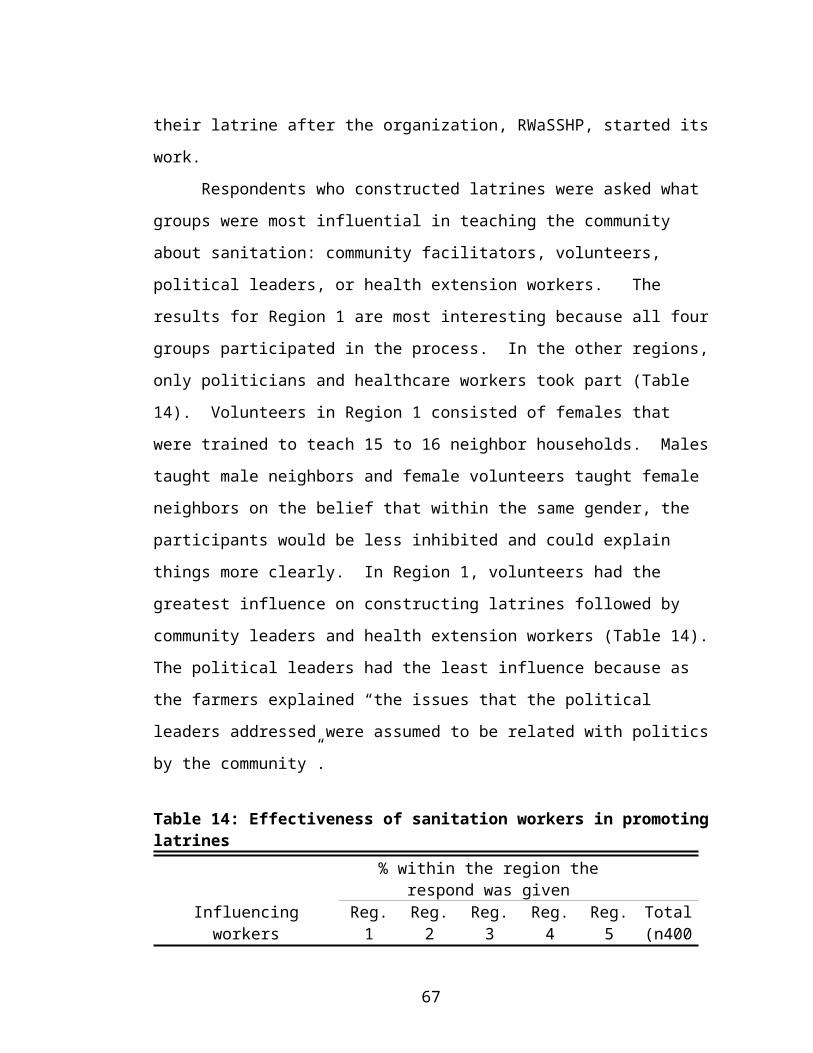
volunteers and community facilitators do not exist. Besides bodies responsible in
sanitation of rural areas need not focus only in household latrine construction only
they also need to focus in the ways communal latrines around farming and grazing
places can be constructed so that better environmental conditions can be created.
The results of the present study have implications for policy-makers, program
planners, academics, and practitioners in the field of water and sanitation in terms of
policy and program formulation, curriculum development, and service delivery. They
serve as a knowledge base on which the national, provincial, local governments as
well NGOs and the private sector can build strategies for promoting good sanitation
practices.
67
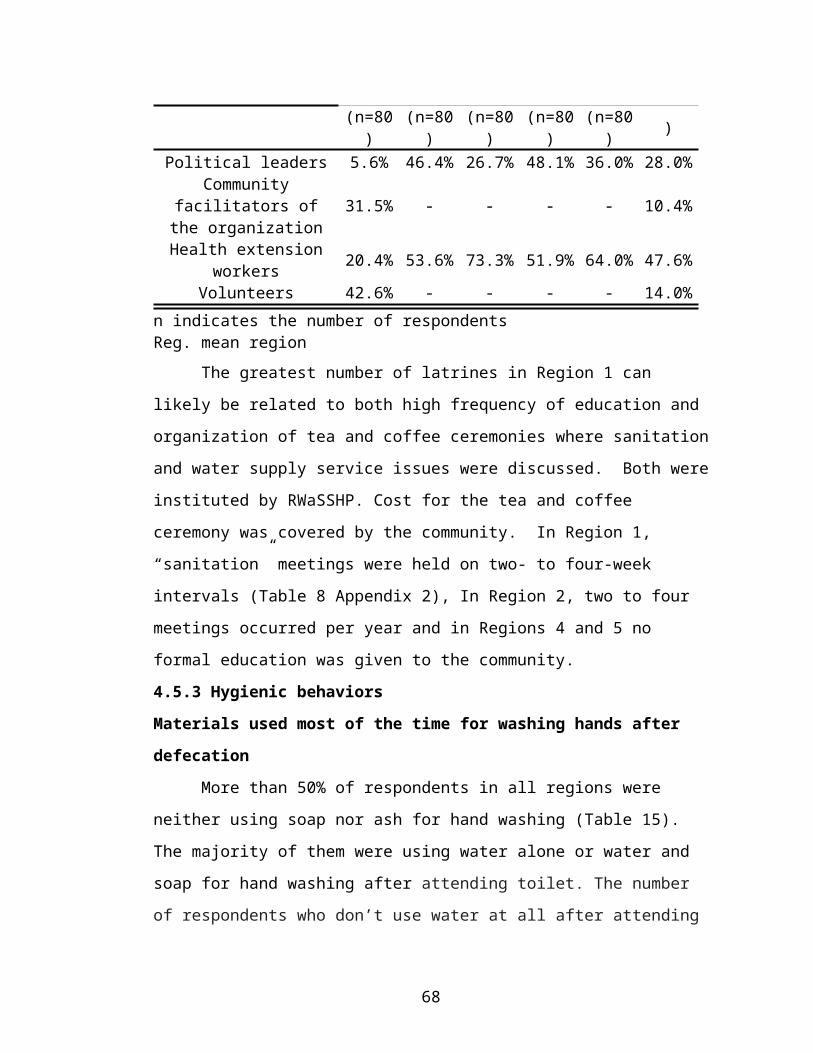
CHAPTER 6
6. REFERENCES
Abrams. Understanding Sustainability of Local Water Services, 1998.
Haysom, Alexia. A study of the factors affecting sustainability of rural water supplies
in Tanzania. msc water management, community water supply option
Cranfield University, Silsoe institute of water and the environment,
September 2006.
Amhara Region Water resources development Bureau. Hand dug well and spring
development construction manual. Amhara Region Water resources
development Bureau, 2007.
Brehanu A. Environmental Impacts of Rural water systems 25th Conference.
Integrated Development for water and Sanitation. Addis Ababa,
Ethiopia, :73-75, 1999.
Brett A. Gleitsmann, Margaret M. Kroma and Tammo Steenhuis. Analysis of a rural
water supply project in three communities in Mali: Participation and
sustainability. Natural Resources Forum 31 142–150, 2007.
Carter, R. C., Tyrrel, S. F. and Howsam, P. Impact and sustainability of community
water supply and sanitation programs in developing countries. Journal of
the Chartered Institute of Water and Environmental Management, 13: 292
– 296, 1999.
Makule, Diana E. Water and sanitation-gender perspective WATER AND
SANITATION FOR ALL: PARTNERSHIPS AND INNOVATIONS:
23rd WEDC Conference Durban, South Africa, 1997.
Mtinda, Elias O., Holmen, Hans Sustainability of Rural Water Supply and Sanitation
Services under Community Management Approach: The Case of six
villages in Tanzania, December 2006.
68
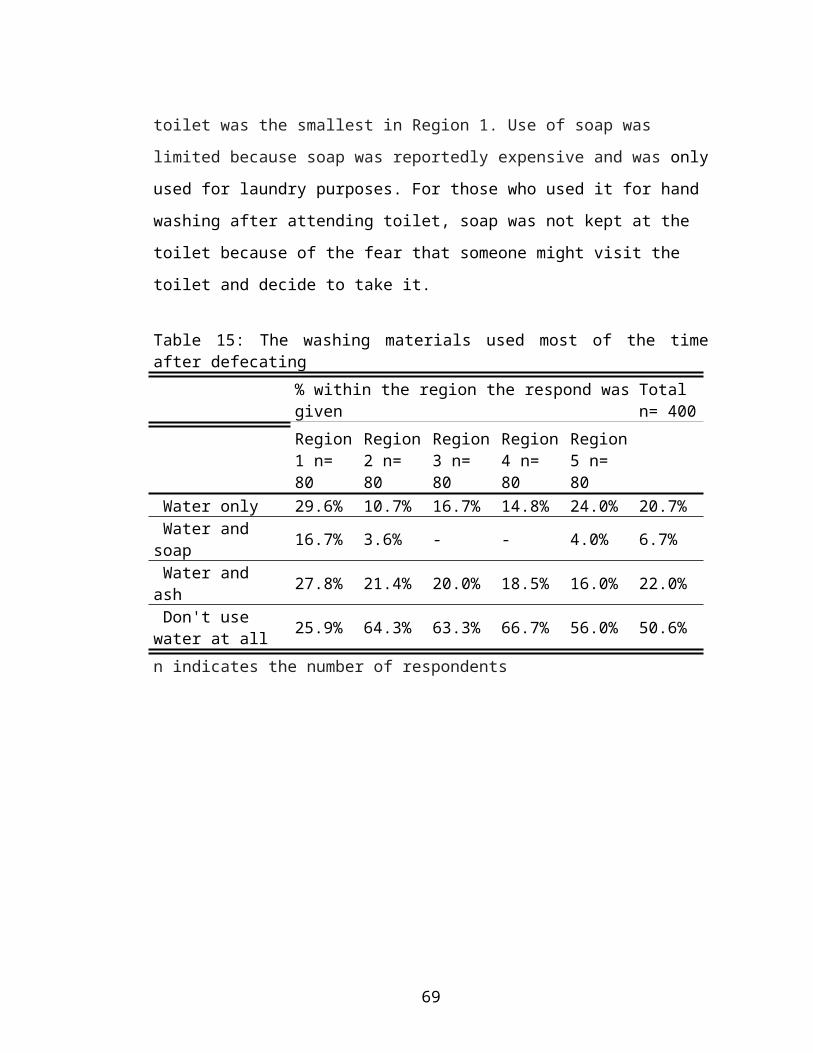
Abitbol, Eric. Water Aid Ethiopia. Evaluation Report Summary, September 2000.
www.wateraid.org.uk. ( last visited January 2009).
Esrey, S.A., Feachem, R. and Hughes, J.M. Interventions for the control of diarrheal
diseases among young children: improving water supplies and excreta
disposal facilities. World Health Organization. 63, 757 – 772, 1985.
Ethiopian Central Statistics Agency (ECSA. Report on the 2007 population and house
count, 2007.
Janvier G., Jules M.,Andre N., and Pie K.. Impact of Water Supply and Sanitation on
Diarrheal Morbidity among Young Children in the Socioeconomic and
Cultural Context of Rwanda (Africa). Environmental Research Section A
90, 76-88, 2002.
Libokemkem Woreda Finance and Development Office. Report on rural water supply
services functionality in Libo kemkem Woreda. Monthly Report Paper,
January 2009.
Ngwenya, B., Kgathi, D. HIV/AIDS and access to water: a case study of home-based
care in Ngamiland, Botswana. Physics and Chemistry of the Earth, 31,
2006.
Wilderer, P.A, Applying sustainable water management concepts in rural and urban
areas: some thoughts about reasons, means and needs. Water Science and
Technology Vol 49 No 7 pp 7–16 © IWA Publishing, 2004
P.K. JHA .Health and social benefits from improving community hygiene and
sanitation: an Indian experience. International Journal of Environmental
Health Research 13, S133 – S140, June 2003.
Parry- Jones, S., Reed, R. and Skinner, B. H. Sustainable hand pump projects in
Africa: A literature review. WEDC, Loughborough University, UK, 2001.
69
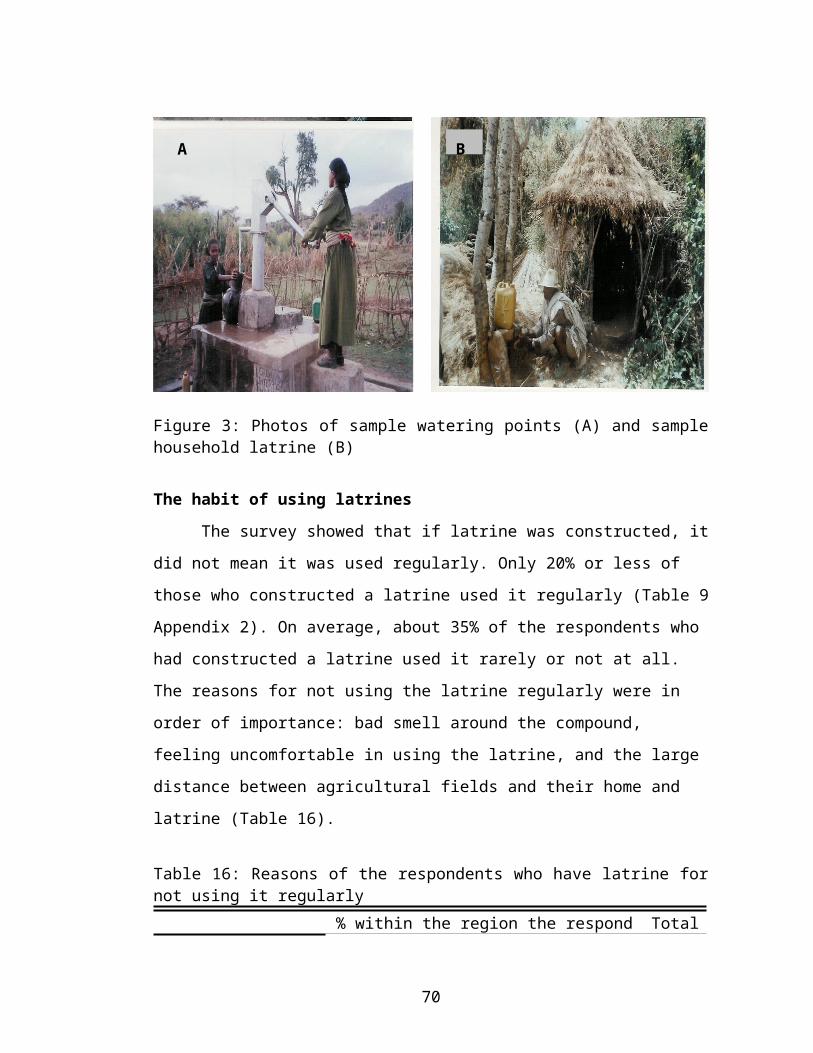
Tumwine JK, Thomson J, Katui-Katua M, Mujwahizi M, Johnstone N, Wood E,
Porras I. Diarrhea and effects of water sanitation and hygiene in East
Africa. Trop Med Int Health 7(9):750 – 756, 2003.
United Nations Development Assistance Framework (UNDAF). 2006. United Nations
Development Assistance Framework reported 2002 – 2006. Policy paper:
in corroboration between United Nations and Arab Republic of Egypt,
2006.
United Nations Economic and Social Council, Economic Commission for Africa
(UNESCA). Public-Private Partnerships for Service Delivery: Water and
Sanitation. Third meeting of the Committee on Human Development and
Civil Society, Addis Ababa, Ethiopia: E/ECA/CHDCS.3/4 13, April
2005.
United Nations Educational, Scientific and Cultural Organization — World Water
Assessment Program (UNESCO-WWAP). Water for People, Water for
Life: The United Nations World Water Development Report, 2003.
VanDerslice, J. and Briscoe, J. Environmental Interventions in Developing Countries
– Interactions and their implications. American Journal of Epidemiology
141(2), 135-144, 1995.
Waterkeyn J, Cairncross S. 2005. Creating demand for sanitation and hygiene through
Community Health Clubs: A cost-effective intervention in two districts in
Zimbabwe. Soc Sci Med 61(2):1958 – 1970.
Webster J. Dejachew G, Bereket G, Mehari N, Tesfaye G. Sustainability of rural water
and sanitation projects. 25th WEDC Conference on integrated
development for water supply and sanitation. Addis Ababa, Ethiopia,
1999:416-417.
70
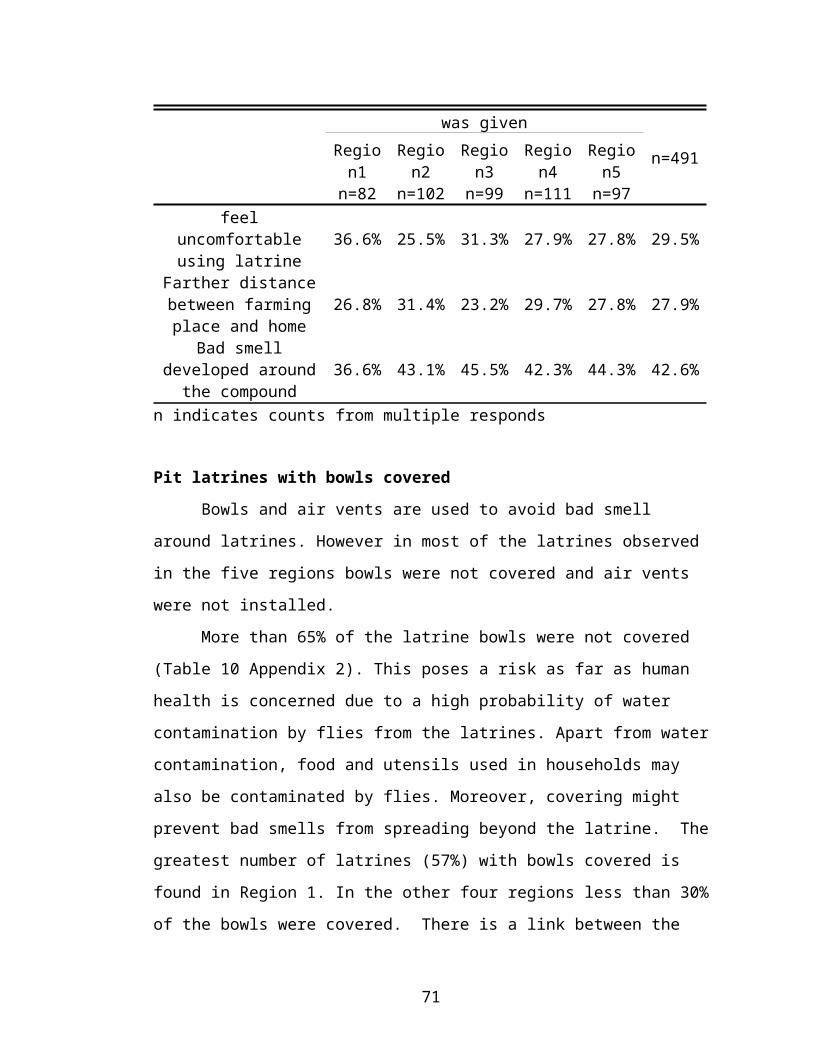
WELL, DFID guidance manual on water supply and sanitation programs. WELL,
WEDC, Loughborough University, UK, 1998.
http://www.lboro.ac.uk/well/resources/Publications/guidancemanual/
overview.pdf#search=%22DFID%20guidance%20manual%22 (accessed:
28thFebruary 2009).
World Bank. Participatory project planning a case study. 25th WEDC Conference,
Addis Ababa, Ethiopia, 1999.
World Bank Participatory project planning a case study. 25th WEDC Conference,
Addis Ababa, Ethiopia, 1999.
World Bank, 2005. Water Supply and Sanitation Feature Story, scaling up support to
water supply and sanitation in Ethiopia. Available on the web:
http://www.worldbank.org/watsan (last visited 10th January 2009).
World Bank, World Bank development report, Washington DC, 2001.
World Health Organization. Our planet, our health: Report of the WHO Commission
on Health and Environment. WHO, Geneva, 1992: 123-124.
World Health Organization. Our planet, our health: Report of the WHO Commission
on Health and Environment. WHO, Geneva, 1992: 123-124
Yohannes Ghebremedhin. Effects of insufficient water supply and sanitation. .
Integrated Development for Water Supply and Sanitation. 25th WEDCH
Conference, Addis Ababa, Ethiopia, 1999.
71
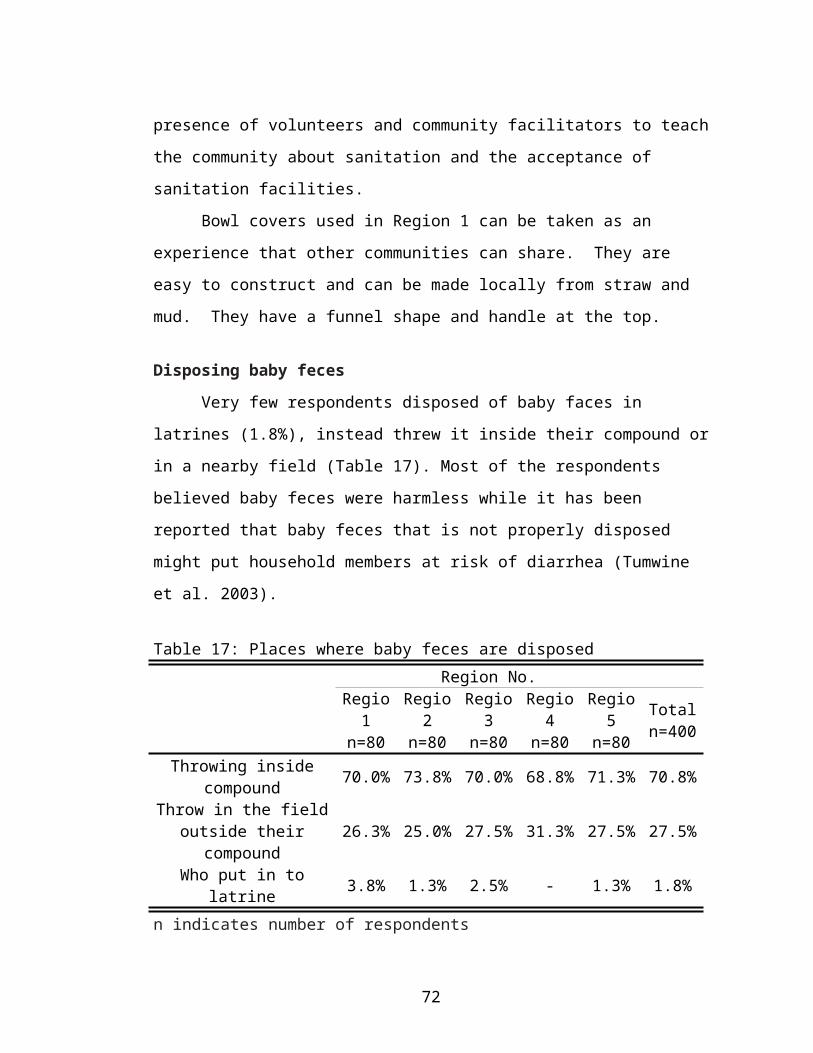
Appendix 1: List of selected villages for the study
Table 1: List of villages selected for the study
NO. Name of the village
The 3Kebelle the village is
found
The organization which gave the
water supply and sanitation service
The assigned region No.
given in this paper
1. Shini Difa Angot RWaSSHP Region 12. Chekchakit Ginaza RWaSSHP Region 13. Aba Mederoge Bura RWaSSHP Region 14. Shina Bura RWaSSHP Region 15. Bata Yifag Zuria LKWWRO Region 26. Dikulle Yifag Zuria LKWWRO Region 27. Belles Yifag Zuria LKWWRO Region 28. Mewagna Yifag Zuria LKWWRO Region 29. Keroye Shumana ORDA Region 310. Agamoch Shumana ORDA Region 311. Shumana-2 Shumana ORDA Region 312. Dokimit Shumana ORDA Region 313. Kibichalle Banbiko RED CROSS Region 414. Bisrogmi Banbiko RED CROSS Region 415. Bayiyo Banbiko RED CROSS Region 416. Milangib Banbiko RED CROSS Region 417. Menta Walka Bira UNICEF Region 518. Lay Chiche Walka Bira UNICEF Region 519. Kidane Mihret Bira UNICEF Region 520. Endodo Mesk Bira UNICEF Region 5
3 Kebelle is the smallest administrative unit in Ethiopia
72
Appendix 2: Table of results from the community
Table 1: Marital Status of the respondents
Table 2: Reasons of the respondents for not contributing project cost (in cash or in kind)
Reason
% within the region the respond was givenRegion 1
n=9Region 2
n=93Region 3
n=107Region 4
n=102Region 5
n=104Was not asked .0% 64.5% 53.3% 60.8% 55.8%Being poor 44.4% 11.8% 21.5% 17.6% 21.2%Being old 22.2% .0% .0% .0% .0%Low reliability of scheme 33.3% 15.1% 15.0% 14.7% 13.5%The scheme being far .0% 8.6% 10.3% 6.9% 9.6%
Percentages and totals are based on responses.a Groupn indicates counts from multiple responds
Table 3: Types of kind contribution by user communities in the water supply projects in the five regions
Types of kind contribution
% within the region the respond was given
Region 1 (n=168)
Region 2 (n=17)
Region 3 (n=26)
Region 4 (n=19)
Region 5 (n=27)
Digging .0% 11.8% .0% .0% .0%
Fencing 26.8% 5.9% 7.7% .0% .0%Removing excavated
Marital statusPercentages
n=400Single 0.3
Married 83.8Divorced 4.5Widowed 11.5
n indicates number of respondents
73
material 20.8% 29.4% .0% .0% 7.4%
Contribute sand 22.6% .0% .0% .0% .0%Inserting pre casted
concrete rings in to the well shaft 11.9% 29.4% 65.4% 78.9% 77.8%
Installing pump 2.4% 23.5% 19.2% 21.1% 14.8%
Contribute stone 15.5% .0% 7.7% .0% .0%Percentages and totals are based on responses.a Groupn indicates counts from multiple responds
Table 4: Participation of the respondents during the planning stage of the water supply projects in each region
Participation% within the region the respond was givenRegion 1 (n=481)
Region 2 (n=82)
Region 3 (n=80)
Region 4 (n=80)
Region 5 (n=80)
Asking for demand 15.6% 9.8% .0% .0% .0%
Selecting construction site 13.5% 13.4% 18.8% 6.3% 10.0%
Selecting the type of technology 12.1% .0% .0% .0% .0%
Decide amount of money need to be contributed by
each HH and how12.9% .0% .0% .0% .0%
Decide how kind contribution could be
performed12.3% .0% .0% .0% .0%
Quantity of sand & stone each HH should
contribute2.7% .0% .0% .0% .0%
Deciding division work 10.6% .0% .0% .0% .0%Scheduling project work 10.4% .0% .0% .0% .0%
Did not participate at planning stage .0% 76.8% 81.3% 93.8% 90.0%
Percentages and totals are based on responses.a Groupn indicates counts from multiple responds
74
Table 5: Community participation in meetings concerning the water supply or (and) sanitation service in the project time
% of responses within the regionTypes of
participationRegion 1
n=80Region 2
n=80Region 3
n=80Region 4
n=80Region 5
n=80Total n=400
Attended the meeting and contribute idea 26.3% - - - - 5.3%
Attended the meeting and contribute idea 46.3% - - - - 9.3%
Didn't attend the meeting 27.5% - - - - 5.5%
No meeting at all - 100.0% 100.0% 100.0% 100.0% 80.0%Percentages and totals are based on responses.a Groupn indicates number of respondents
Table 6: Belief of the households that the operation and maintenance trainees can maintain the scheme based on the existing skill of the trainees
% within the region the respond is givenRegion 1 n=80
Region 2 n=80
Region 3 n=80
Region 4 n=80
Region 5 n=80
Total n=400
O & M training was not given at all - - - - 100.0% 20.0%
believe the trainees can maintain the system 26.3% 17.5% 12.5% 22.5% - 15.8%
believe the trainees cannot maintain the
system73.8% 82.5% 87.5% 77.5% - 64.3%
Percentages and totals are based on responses. a Group n indicates counts from multiple responds
Table 7: Reasons of the respondents for dissatisfaction by the water supply services
% within the region the region the respond was givenRegion 1
n=86Region 2
n=106Region 3 n=93
Region 4 n=142
Region 5 n=100
Total n=527
Low quality of water 0.00% 0.00% 0.00% 5.60% 6.00% 2.70%
Low quantity of water 4.70% 14.20% 6.50% 33.80% 12.00% 16.10%
75
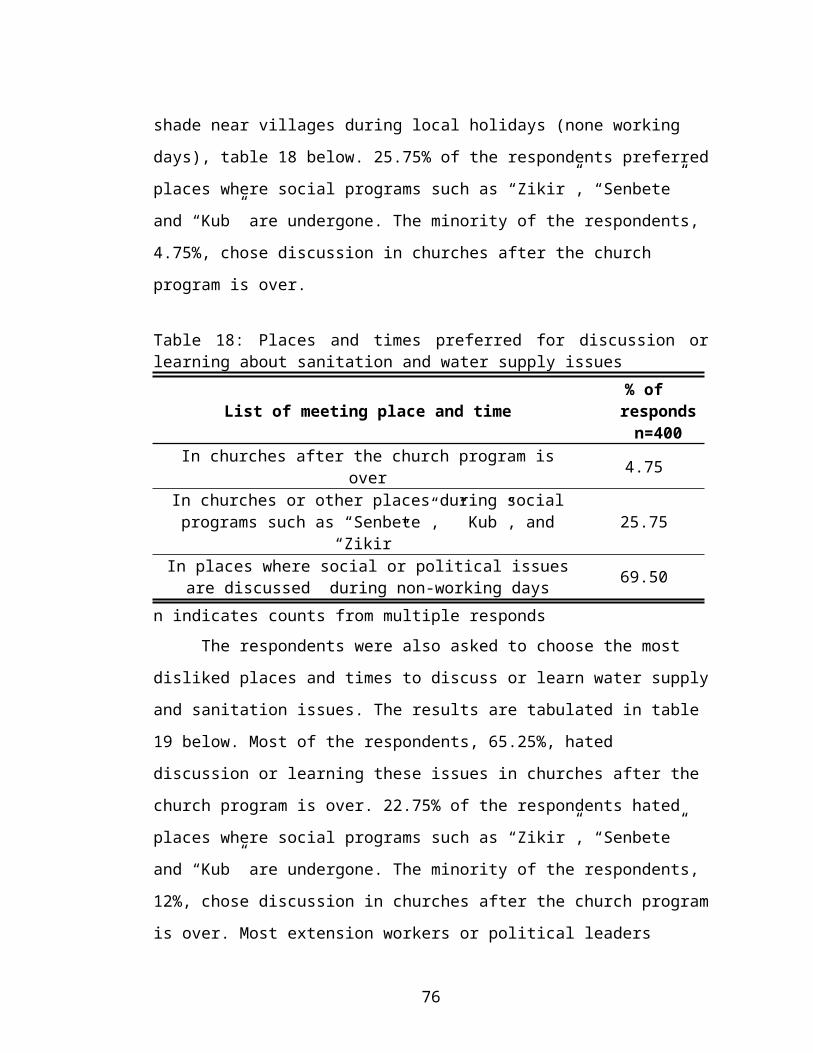
Low reliability of the scheme 23.30% 16.00% 23.70% 8.50% 19.00% 17.10%
OM cost very high 9.30% 1.90% 0.00% 0.00% 0.00% 1.90%
Long distance to the scheme 0.00% 7.50% 11.80% 4.90% 10.00% 6.80%
Delay for maintenance 17.40% 16.00% 12.90% 8.50% 6.00% 11.80%
Structural design not suitable to the village conditions
0.00% 0.00% 7.50% 10.60% 0.00% 4.20%
Do not have water through
year0.00% 6.60% 0.00% 4.90% 9.00% 4.40%
Scheme is non-functional 0.00% 18.90% 0.00% 14.10% 20.00% 11.40%
No problem 45.30% 18.90% 37.60% 9.20% 18.00% 23.70%
n indicates counts from multiple responds
Table 8: The frequency of sanitation education given by the corresponding organization in each of the five regions
% within the region the respond was given
Region 1 n=80
Region 2 n=80
Region 3 n=80
Region 4 n=80
Region 5 n=80
Total n=400
Not at all - - - 100.0% 100.0% 40.0%Almost every two
weeks 68.8% - - - - 13.8%
Almost every month 31.3% - - - - 6.3%
One time through the project time - 63.8% 76.3% - - 28.0%
Almost two times through the project
period- 36.3% 23.8% - - 12.0%
n indicates counts from multiple responds
Table 9: The frequency of using latrine of the respondents who had latrine
76
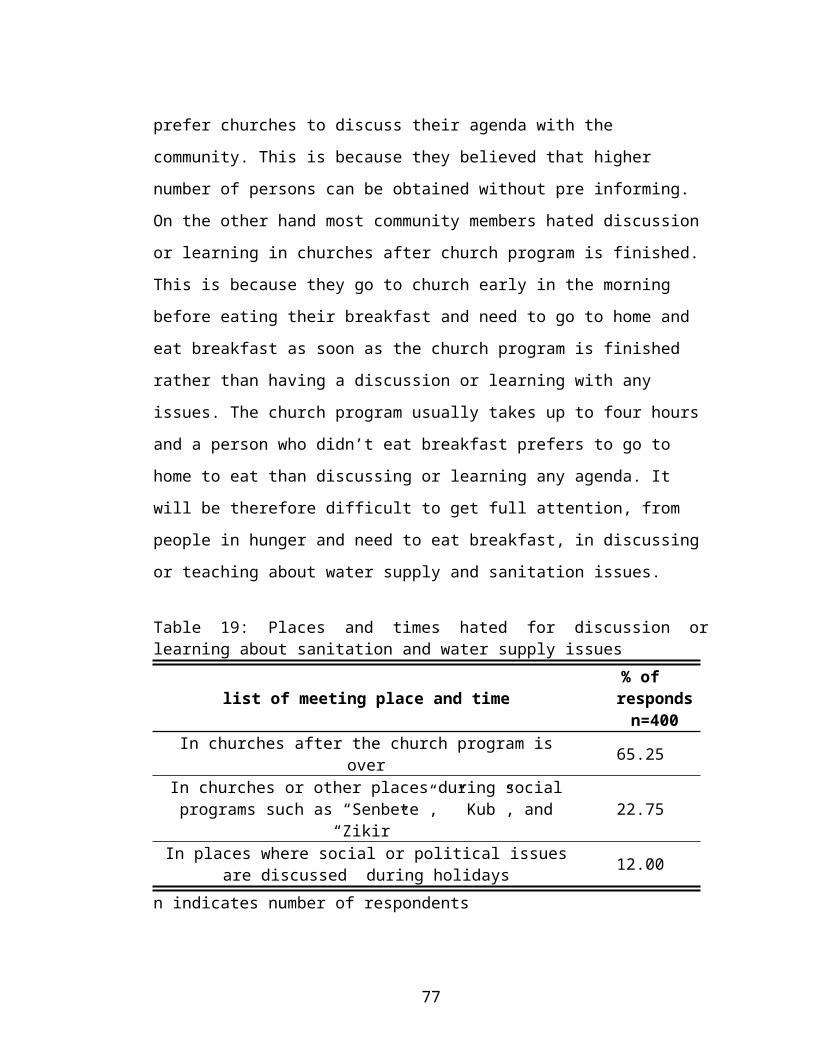
% within the region the respond was givenTotal n=400Region 1
n=80Region 2
n=80Region 3
n=80Region 4
n=80Region 5
n=80Very rarely 14.8% 32.1% 23.3% 40.7% 16.0% 23.8%
Rarely 22.2% 28.6% 36.7% 25.9% 44.0% 29.9%Sometimes 38.9% 7.1% 13.3% 18.5% 8.0% 20.7%Regularly 20.4% 14.3% 13.3% 7.4% 12.0% 14.6%Not at all 3.7% 17.9% 13.3% 7.4% 20.0% 11.0%
n indicates counts from multiple responds
Table 10: Pit latrines with bowls covered
% within the region the respond was givenTotal n=400Region 1
n=80Region 2
n=80Region 3
n=80Region 4
n=80Region 5
n=80pit latrines with bowls covered 57.4% 21.4% 26.7% 25.9% 20.0% 34.8%
n indicates number of responds
Table 11: Defecating places of the respondents who have no latrine or don't use the latrine regularly
% within the region the respond was givenTotal n=546Region 1
n=60Region 2
n=116Region 3
n=106Region 4
n=119Region 5
n=145Inside forest areas or
around bushes 30.0% 23.3% 21.7% 11.8% 25.5% 21.8%
By river sides 13.3% 1.7% .0% .0% 3.4% 2.7%
Paddy fields 28.3% 37.9% 31.1% 44.5% 37.9% 37%Within the home
compound 28.3% 37.1% 47.2% 43.7% 33.1% 38.5%n indicates counts from multiple responds
77
Table 12: Community ideas about sustaining rural water supply services % within the region the respond was given
Total n=434
Reg. 1 n=73
Reg. 2 n=117
Reg. 3 n=53
Reg. 4 n=97
Reg. 5 n=94
Community empowerment in the project works 27.4% 9.4% 20.8% 8.2% 6.4% 12.9%
Hand pumps should be replaced by motor pumps/working with solar
energy0.0% 11.1% 0.0% 10.3% 9.6% 7.4%
Strong training which insures the community maintenance team can
maintain the system should be given
16.4% 3.4% 18.9% 1.0% 0.0% 6.2%
Place of construction should be selected together with the
community0.0% 7.7% 0.0% 13.4% 10.6% 7.4%
Regular maintenance is required 0.0% 11.1% 0.0% 10.3% 3.2% 6.0%
Closure settlement of the community is required 0.0% 12.0% 0.0% 11.3% 6.4% 7.1%
Community ownership should be developed 12.3% 0.0% 20.8% 4.1% 5.3% 6.7%
Schemes should not be constructed near road ways 0.0% 8.5% 0.0% 7.2% 9.6% 6.0%
Regular water treatment is required 4.1% 0.0% 0.0% 0.0% 0.0% 0.7%Increase the number of schemes 0.0% 9.4% 0.0% 5.2% 9.6% 5.8%
Good fencing and guarding practice is required 13.7% 4.3% 15.1% 0.0% 9.6% 7.4%
Efficient/committed leaders required 0.0% 6.8% 0.0% 5.2% 6.4% 4.4%
Strong bylaws should be developed and practiced 19.2% 0.0% 11.3% 0.0% 0.0% 4.6%
Continuous support required 0.0% 7.7% 0.0% 8.2% 6.4% 5.3%Encourage private sectors to sell
maintenance parts 6.8% 0.0% 13.2% 0.0% 0.0% 2.8%
Schemes need to be constructed near to villages 0.0% 4.3% 0.0% 7.2% 5.3% 3.9%
Well shaft should be excavated during dry periods 0.0% 4.3% 0.0% 8.2% 11.7% 5.5%
n indicates counts from multiple responds
Table 13: Household latrine construction coverage
% within the region the respond was given
Region 1 Region 2 Region 3 Region 4 Region 5 Total
78
n=80 n=80 n=80 n=80 n=80 n=400Respondents who constructed home latrine
67.5% 35.0% 37.5% 33.8% 31.3% 41.0%
n indicates number of responds
Appendix 3: Comparison of the water quantity measured with the standard
Table 1: Comparison of the water quantity measured with the standard
79
No.
Village name
Organization which
constructed the well
Overnight storage
The required standard for the given overnight
storage
Well yield=q Comparison
to the regional standard(m) (L/min) (L/min)
1 Shini Difa RWaSSHP 2.54 14.60 23.11 Greater2 Chekchakit RWaSSHP 3.10 9.00 22.48 Greater3 Aba Mederoge RWaSSHP 3.88 1.20 34.83 Greater4 Shina RWaSSHP 2.25 17.50 19.31 Greater5 Bata LKWWRDO 2.43 15.70 21.53 Greater6 Dikulle LKWWRDO 2.05 19.50 16.46 Less7 Belles LKWWRDO 2.60 14.00 20.58 Greater8 Mewagna LKWWRDO 3.40 6.00 28.50 Greater9 Keroye ORDA 3.00 10.00 43.06 Greater10 Agamoch ORDA 3.45 5.50 38.94 Greater11 Shumana-2 ORDA 2.78 12.20 14.25 Greater12 Dokimit ORDA 3.94 0.60 25.33 Greater13 Kibichalle Red Cross 0.90 31.00 10.76 Less14 Bisrogmi Red Cross 1.15 28.50 12.98 Less15 Bayiyo Red Cross 1.15 28.50 8.23 Less16 Milangib Red Cross 0.90 31.00 13.30 Less
Appendix 4: Questionnaire used for user communities
Rural Water supply and sanitation assessment questionnaire To be responded by selected community members
80
1. Family situation1. Age of the respondent……………years2. Sex of the respondent3. Number of household members and their education level 4. Marital status of respondent2. Operation and maintenance practices5. Does your household contribute for operation and maintenance cost of the
scheme?6. If your response for Q1 is yes, how much do you contribute?7. If your response for Q1 is yes, do you believe there is effective financing
management of the money collected in the community? 8. If your response for Q6 is yes, what are your reasons?9. If your response for Q6 is no, what are your reasons?10. If your answer for Q1 is No, What is the reason for not contributing operation and
maintenance cost? 11. Was training on maintenance of the water points given to selected community
members? 12. If your answer to question 10 is yes, do you believe that the training was good
enough to help the trainees to maintain the system without external help?13. If the trainees maintained a failure(s) in the scheme’s system, how many times the
system was maintained and made it function by them?14. Has the scheme maintained up to now by those other than the trainees in the
community because the trainees were unable to maintain the system?15. If your answer for question 14 is yes, who is (are) these persons(s)?16. If your answer for question 14 is yes, who covered the maintenance cost?17. If the trainees tried and failed to maintain the scheme, how many times the trainees
failed to maintain the system? 3. Community participation18. Did you share the cost of construction for the scheme?19. If your answer for question 18 is yes, how did you share?20. If your answer for question 19 is in cash or both in cash and in kind, what is the
amount of money you contributed?21. If your answer for question 19 is in kind or both in cash and kind, on what types of
works did you participated?22. If your answer for Q18 is no, what is the reason?23. Who choose place of construction?24. Was the system constructed by the demand driven approach?25. Who choose the type of technology for the scheme? 26. What was your participation in village meetings concerning water supply and
sanitation?27. Did you participate during the planning stage of the project?28. What was the timescale (period) of the project29. Did the community participate in making decision during the construction phase of
the project?30. If your answer for question 29 above is yes, what are they?
81
4. Effective hygienic use, effective environmental use and health impact
31. Have you constructed a latrine?32. If your answer for Q31 is yes, which of the followings your latrine is composed? 1. Simple dig without house 2. A house with wall and roof 3. A house with wall but without roof 33. If your answer to question 1 is yes, did you construct your latrine after or before
the organization started its work in the community? 34. If your answer to question 1 is yes, how often your families use the constructed
latrine? (Regularly, Sometimes)35. If your answer for Q34 is sometimes, what is the reason for not using the latrine
regularly?36. If you have constructed and started using latrine, what things most of the time do
your family use for washing hands after defecation?37. If your answer to question 31 is yes, who let you to construct the latrine? 38. If your answer to question 31 is No, what is your reason for not constructing
latrine?39. Are there different uses for water from different sources (drinking, cloth washing
and bathing)? 40. If your answer for Q39 is yes, which source(s) of water do you use for drinking,
most of the time? 41. If your answer for Q39 is yes, which source(s) of water do you use for washing
cloth, most of the time? 42. If your answer for Q39 is yes, which source(s) of water do you use for bathing,
most of the time? 43. Who, if anyone, provides any health and/or hygiene education in the community?44. Are there volunteers who are members of the community organized by the
organization who teach the community members about sanitation and help them in constructing household latrines?
45. If your answer for Q44 is yes, how many volunteers are serving the community? Female volunteers……………Male volunteers………….Total……….46. If your answer for Q24 is yes and the volunteers consist of both female and male,
how are they working? 47. Was training given by the organization for the volunteers?48. How often sanitation education is given in churches by the organization?49. If you have latrine, is the bowl covered?50. Before you had latrine, where did you defecate?51. Did the community share experience with other communities who have best
experience in sanitation? (With the help of the organization)52. Where does your family dispose of baby feces?53. If you are not disposing baby feces in to latrine, what is the reason for not
disposing baby feces in to latrines?
82
54. Which one of the following bodies responsible to teach communities about sanitation has the greatest positive influence on you to construct latrine
1. Political leaders2. Community facilitators3. Extension workers4. volunteers
5. Functionality, community satisfaction and willingness to sustain the system55. Is the water point functional now?56. If your answer to question 55 is no, when did it stopped functioning?57. If your answer to question 55 is no, how long did it serve the community before it
stopped functioning? 58. If your answer to question 55 is no, why it is not functioning? (Cause of non-
functionality)59. If you are not using the water supply service, what is the reason for not using the
service? 60. What is the distance of the scheme from your home?61. What time it takes to fetch water from the scheme and return back?62. For how much time you have been using the water supply and sanitation services
provided?63. What are the problems of the water supply service if there is any?6. Quantity and quality of water supplied64. Choose 5 if the quantity of water supplied by the water supply service is enough
and 1 if the quantity of water is very less and in between accordingly. 1. 2. 3. 4. 5.
65. How much water your household uses per day?66. Is there a problem in the water point you are using with the quality of water?67. If your answer for Q4 is yes, what is the problem?68. For what purpose does your family use the water from the scheme?69. If the scheme provides low quantity of water for some dry period in the year, what
other sources of water during these periods do you use (or before the scheme is constructed)?
70. What is the approximate distance of your household from these sources?71. What time it takes to you to fetch water from these sources?72. If the scheme gets dry during some period in a year, when does it dry (which
months)?If the scheme provides low quantity of water, what do you think the reason to be for the low quantity of water supplied by the scheme?7. Institutionalizing of the schemes, effective financing and financial
management73. Is the water point institutionalized (governed by the community)? 74. Has the community water and sanitation committee?
75. If your answer to question 2 is yes, was the water committee really helpful? 76. Have the community rules and regulations in the use of the water supply services?
83
77. If your answer to question 77 is yes, who gave you the information of having rules and regulations for the use of the water supply schemes?
78. If your answer to question 4 is No, what is the reason for not having rules and regulations for the use of the water supply and sanitation services provided?
79. Is there a guard for the water supply scheme constructed?80. If you are contributing the operation and maintenance cost, do you believe there is
effective collection of money? 81. If you are contributing the operation and maintenance cost, do you believe there is
effective management of money? 82. If your answer for Q81 is No, what is the reason? 83. If your answer for Q82 is No, what is the reason? 8. General questions84. What time it takes you to fetch water from the scheme in minutes and return to
your home?85. By whom the responsibility to fetch water most of the time in your household lies?86. For whom do you think the presence of latrine in your compound is more
important?1. For females 2. For males 3. for both it is equal
87. If your answer for Q87 is for females, why it is for?88. Which meeting place and time do you hate the most for discussion or learning
water supply and sanitation issues?89. Which meeting place and time do you hate the most for discussion or learning
water supply and sanitation issues?90. What are your comments for achieving sustainability of water and sanitation
services in rural areas?
THANK YOU FOR YOUR COOPERATION
Appendix 5: Questionnaire used for service providers (organizations)
84
Rural Water supply and sanitation assessment questionnaire to be responded by providers1. Give information on the villages your organization worked in water supply and
sanitation: number of households served in the village, total population served and the project period
2. What are the approaches that your organization followed in giving the communities water supply and sanitation services? List with respect to the following indexes:2.1. Effective financing and financial management of the communities that
you were working with2.2. Operation and maintenance practices2.3. Health impacts Effective hygiene and environmental use2.4. Quantity and quality of water supplied2.5. Effective functioning2.6. Quality of construction2.7. If there are other approaches than mentioned that your organization
follows explain it at the back of this page.3. Do your organization perform water quality test for each of the water points
constructed? 4. If your answer for question 3 is yes, on which of the following parameters your
organization did? 5. If your answer for question 3 is no, why water quality testes have not been done?6. How do you know the yield of the well or the spring that your organization
constructing is enough for the community consumption?7. If your answer for Q6 is by measuring, what is the standard?8. If your answer for Q6 is by guess, how?9. Did the communities participate in the project?10. If your answer for question 9 is yes, at which stage of the projects community
participated? 11. What were the major activities the community participated during planning?12. What were the major activities the community participated during
implementation?13. What were the major activities the community participated during operation?14. If your answer for question 9 is No, why so?15. What is the composition of the professionals in your organization?
15.1. Number of technicians (involved with the hard ware part of the project)…………….....
15.2. Number of social workers (involved with the software part of the project)……………..
15.3. Others (like secretaries)……………………………………..16. If your answer for question 9 is yes, how the community participated? 17. If your answer for question 16 is in cash, what was the amount of money
contributed?18. If your answer for question 16 is in kind, on what types of works do the
community participated?
85
19. Had your organization helped the community in organizing water and sanitation committee in the community?
20. If your answer to question 19 is yes, was the water committee really helpful? 21. What are the works that your organization did differently to make each household
construct latrine? 21. Have your organization worked in collaboration with health extension workers in
the community?22. How did you teach the community to construct household latrine?23. If your answer for question 22 is by arranging community meeting, how often you
did it?24. If your answer for question 22 is by having tea and coffee ceremony, how often
you did it?25. If your answer for question 22 is during weekends in church, how often you did it?26. If your answer for question 22 is during holidays such as “zikir”, “tsige” and
“mahiber” how often you did it?27. Did communities participate in choosing place of construction for the hand dug
wells and spring developments? 28. Have your organization followed demand driven approach? 29. Did your organization helped the community in institutionalizing the hand dug
wells and spring developments? 30. Did your organization give chance to the community in choosing the type of
technology of the water points constructed? 31. Did women participate in the processes involved? 32. If your answer to question 22 is yes, in which of the followings do they involve?33. Mark the approaches that your organization follows among the followings
1. Mass media campaign.2. Social marketing.3. School sanitation (education).4. The hygiene promotion team (HPT) at district and provincial level discussed
with the community how to select a local ‘champion’ as a person or a family that had shown an example of best practice within their community.
5. Raising flag at a compound of a household which has constructed excellent latrine
6. Village experience sharing7. Village volunteers and local advocates to promote community hygiene and
sanitation awareness8. Multidisciplinary team working in the community/community facilitator
team (professionals of social, technical and sanitary)9. Pamphlets, booklets, games, posters10. Hygiene promotion materials for school sanitation program11. Hygiene education in churches
THANK YOU FOR YOUR COOPERATION
86
Appendix 6: Checklist used for operation and maintenance traineesChecklist used discussing and interviewing with trainees of maintenanceCommunity name …………………………………………………………Organization name which gave the training……………………………......Name of respondent…………………………………………………….......1. Who chose you as a trainee?2. When did you get the training?3. For how much days was the training given? (if other trainings such as sanitation
and water use were given together with maintenance, your respond should be specifically the days only the maintenance part took)
4. For how money days you took the theoretical part of the training?5. For how money days you took the practical part of the training?6. How the practical training was given?7. Do you think that you know all the parts of the water supply scheme that need
frequent maintenance?8. Do you think that the training was adequate enough so that you can maintain the
scheme by yourself without assistance at any time?9. If your answer for Q5 is No, why the training was not adequate enough?10. If your answer to question 10 is yes, do you believe that the training was good
enough to help the trainees to maintain the system without external help?11. If you and your friend(S) trained with you maintained a failure(s) in the scheme’s
system, how many times the system was maintained and made it function?12. Has the scheme maintained up to now by those other than you and your friends,
trained with, because you were unable to maintain the system?13. If your answer for question 13 is yes, who is (are) these persons(s)?17. Who covered the maintenance cost in Q15?18. If you and your friend(S) trained with you tried and failed to maintain the scheme,
how many times the failure happened? 19. Are there maintenance spare parts available around?20. What do you recommend for sustainable use of the water supply scheme?
THANK YOU FOR YOUR COOPERATION
87
88


