Page 1
CORNERSTONESof Managerial Accounting, 5e
© 2014 Cengage Learning. All Rights Reserved. May not be copied, scanned, or duplicated, in whole or in part, except for use as permitted in a license distributed with a certain product or service or otherwise on a password-protected website for classroom use.
Page 2
CHAPTER 4:COST-VOLUME-PROFIT ANALYSIS: A MANAGERIAL PLANNING TOOL
Cornerstones of Managerial Accounting, 5e
© 2014 Cengage Learning. All Rights Reserved. May not be copied, scanned, or duplicated, in whole or in part, except for use as permitted in a license distributed with a certain product or service or otherwise on a password-protected website for classroom use.
Page 3
Break-Even Point in Units and in Sales Dollars Companies use CVP analysis to help them reach important benchmarks, like breakeven point.
The break-even point is the point where total revenue equals total cost (i.e., the point of zero profit).
Also the level of sales at which contribution margin just covers fixed costs and when operating income is equal to zero.
LO-1© 2014 Cengage Learning. All Rights Reserved. May not be copied, scanned, or duplicated, in whole or in part, except for use as permitted in a license distributed with a certain product or service or otherwise on a password-protected website for classroom use.
Page 4
Break-Even Point in Units and in Sales Dollars (cont.)Since new companies typically experience losses (negative operating income), they view their first break-even period as a significant milestone.
LO-1© 2014 Cengage Learning. All Rights Reserved. May not be copied, scanned, or duplicated, in whole or in part, except for use as permitted in a license distributed with a certain product or service or otherwise on a password-protected website for classroom use.
Page 5
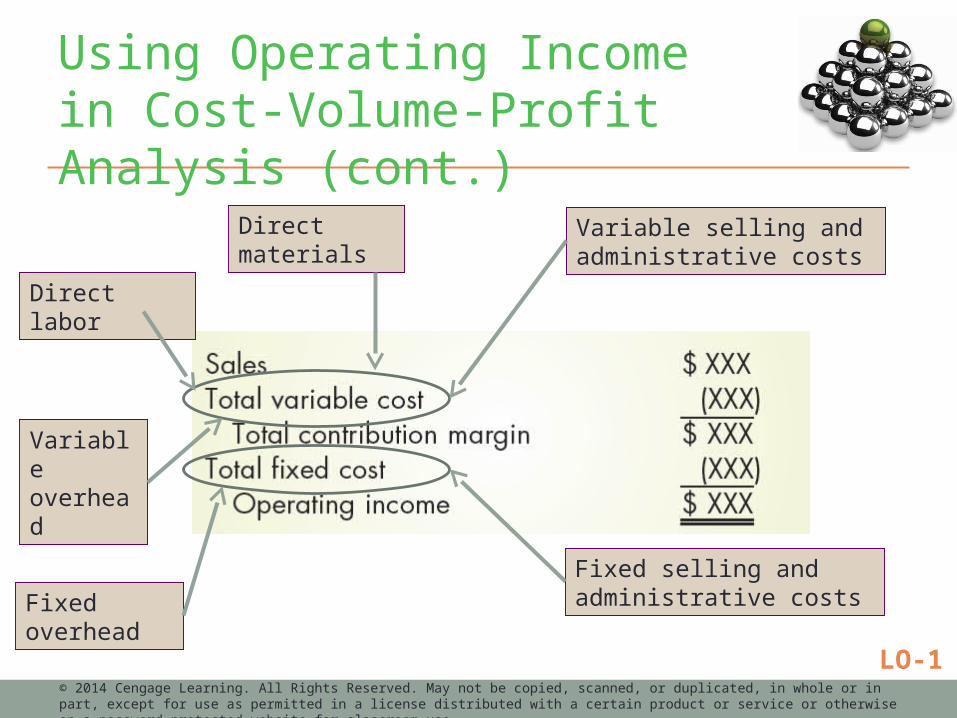
Using Operating Income in Cost-Volume-Profit AnalysisFor CVP analysis, it is useful to organize costs into fixed and variable components.
Below is the income statement format that is based on the separation of costs into fixed and variable components is called the contribution margin income statement.
© 2014 Cengage Learning. All Rights Reserved. May not be copied, scanned, or duplicated, in whole or in part, except for use as permitted in a license distributed with a certain product or service or otherwise on a password-protected website for classroom use.
LO-1
Page 6
Using Operating Income in Cost-Volume-Profit Analysis (cont.)
© 2014 Cengage Learning. All Rights Reserved. May not be copied, scanned, or duplicated, in whole or in part, except for use as permitted in a license distributed with a certain product or service or otherwise on a password-protected website for classroom use.
Direct materials
Direct labor
Variable overhead
Variable selling and administrative costs
Fixed selling and administrative costsFixed
overheadLO-1
Page 7
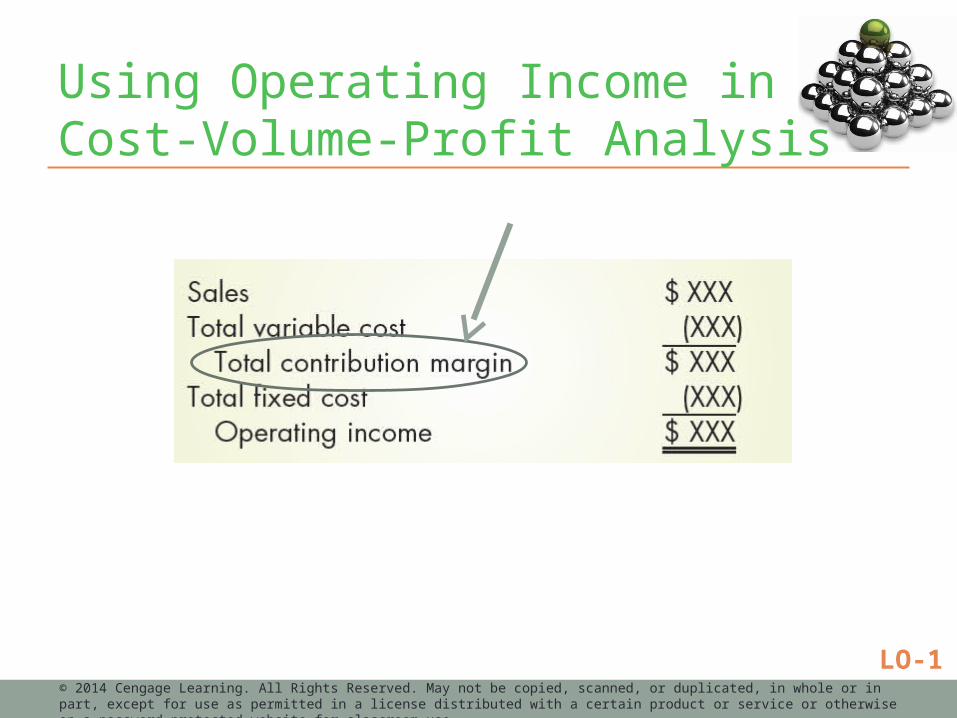
Using Operating Income in Cost-Volume-Profit AnalysisContribution margin is the difference between sales and variable expense.
The amount of sales revenue left over after all the variable expenses are covered that can be used to contribute to fixed expense and operating income.
© 2014 Cengage Learning. All Rights Reserved. May not be copied, scanned, or duplicated, in whole or in part, except for use as permitted in a license distributed with a certain product or service or otherwise on a password-protected website for classroom use.
LO-1
Page 8
Using Operating Income in Cost-Volume-Profit Analysis
© 2014 Cengage Learning. All Rights Reserved. May not be copied, scanned, or duplicated, in whole or in part, except for use as permitted in a license distributed with a certain product or service or otherwise on a password-protected website for classroom use.
LO-1
Page 9
Break-Even Point in Units
© 2014 Cengage Learning. All Rights Reserved. May not be copied, scanned, or duplicated, in whole or in part, except for use as permitted in a license distributed with a certain product or service or otherwise on a password-protected website for classroom use.
If the contribution margin income statement is recast as an equation, it becomes more
useful for solving CVP problems.
Basic CVP Equation
LO-1
Page 10
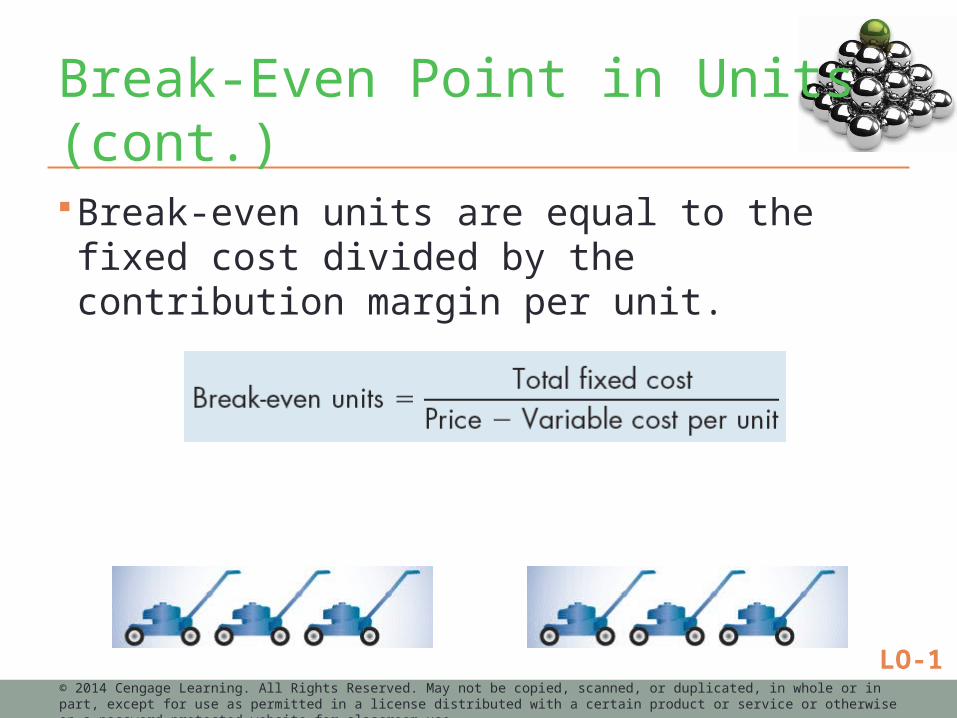
Break-Even Point in Units (cont.)
Break-even units are equal to the fixed cost divided by the contribution margin per unit.
© 2014 Cengage Learning. All Rights Reserved. May not be copied, scanned, or duplicated, in whole or in part, except for use as permitted in a license distributed with a certain product or service or otherwise on a password-protected website for classroom use.
LO-1
Page 11
Break-Even Point in Sales Dollars
© 2014 Cengage Learning. All Rights Reserved. May not be copied, scanned, or duplicated, in whole or in part, except for use as permitted in a license distributed with a certain product or service or otherwise on a password-protected website for classroom use.
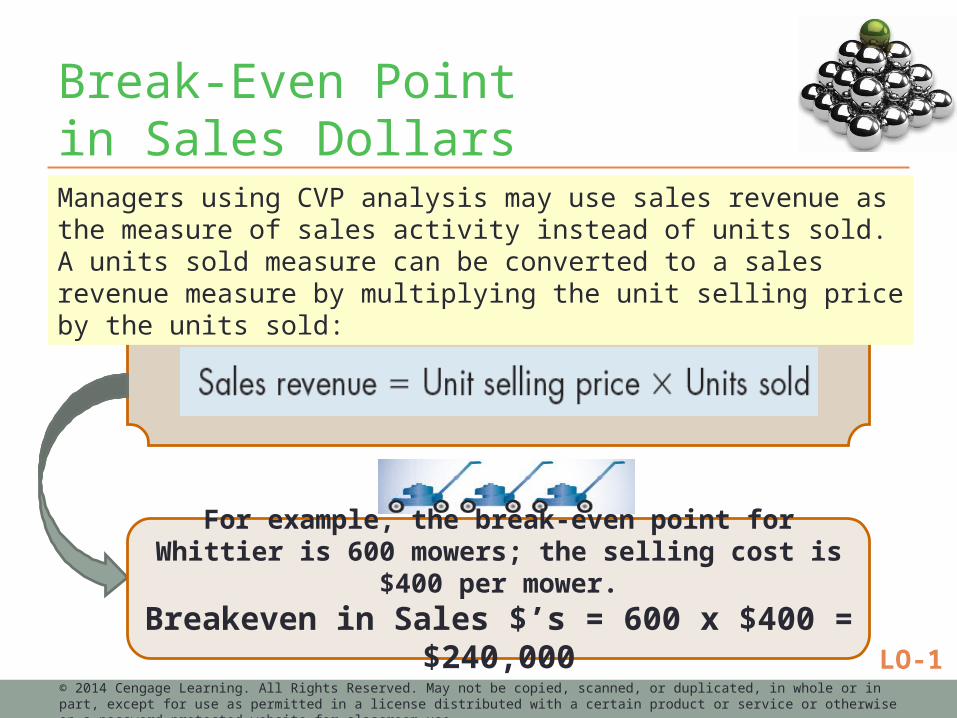
Managers using CVP analysis may use sales revenue as the measure of sales activity instead of units sold. A units sold measure can be converted to a sales revenue measure by multiplying the unit selling price by the units sold:
For example, the break-even point for Whittier is 600 mowers; the selling cost is $400 per mower.
Breakeven in Sales $’s = 600 x $400 = $240,000
LO-1
Page 12
Variable Cost Ratio and Contribution Margin Ratio
© 2014 Cengage Learning. All Rights Reserved. May not be copied, scanned, or duplicated, in whole or in part, except for use as permitted in a license distributed with a certain product or service or otherwise on a password-protected website for classroom use.
Any answer expressed in units sold can be easily converted to one expressed in sales revenues.
Alternatively:
LO-1
Page 13
Fixed Cost’s Relationship withVariable Cost Contribution & Margin Ratios
Since the total contribution margin is the revenue remaining after total variable costs are covered, it must be the revenue available to cover fixed costs and contribute to profit.
How does the relationship of fixed cost to contribution margin affect operating income?
© 2014 Cengage Learning. All Rights Reserved. May not be copied, scanned, or duplicated, in whole or in part, except for use as permitted in a license distributed with a certain product or service or otherwise on a password-protected website for classroom use.
LO-1
Page 14
Fixed Cost’s Relationship withVariable Cost Contribution & Margin Ratios
There are three possibilities: Fixed cost equals contribution margin; operating income
is zero; the company breaks even. Fixed cost is less than contribution margin; operating
income is greater than zero; the company makes a profit.
Fixed cost is greater than contribution margin; operating income is less than zero; the company makes a loss.
© 2014 Cengage Learning. All Rights Reserved. May not be copied, scanned, or duplicated, in whole or in part, except for use as permitted in a license distributed with a certain product or service or otherwise on a password-protected website for classroom use.
LO-1
Page 15
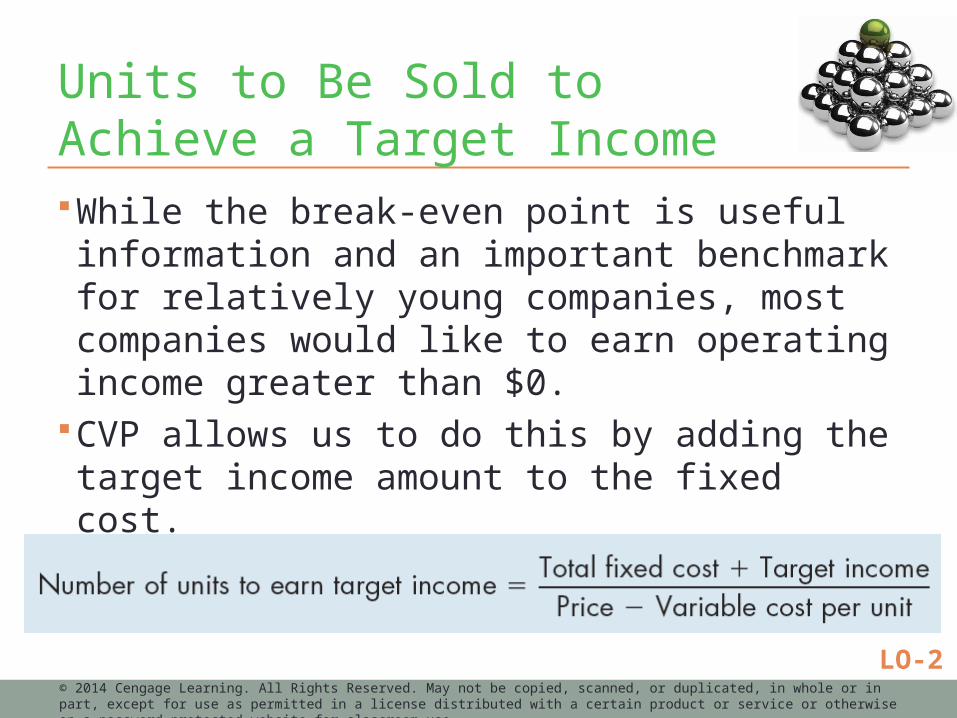
Units to Be Sold to Achieve a Target IncomeWhile the break-even point is useful information and an important benchmark for relatively young companies, most companies would like to earn operating income greater than $0.
CVP allows us to do this by adding the target income amount to the fixed cost.
First, let’s look in terms of units that must be sold.
© 2014 Cengage Learning. All Rights Reserved. May not be copied, scanned, or duplicated, in whole or in part, except for use as permitted in a license distributed with a certain product or service or otherwise on a password-protected website for classroom use.
LO-2
Page 16
Sales Revenue to Achieve a Target IncomeHow much sales revenue must Whittier generate to earn an operating income of $37,500?
This question is similar to the one we asked earlier in terms of units but phrases the question directly in terms of sales revenue.
© 2014 Cengage Learning. All Rights Reserved. May not be copied, scanned, or duplicated, in whole or in part, except for use as permitted in a license distributed with a certain product or service or otherwise on a password-protected website for classroom use.
LO-2
Page 17
Sales Revenue to Achieve a Target IncomeTo answer the question, add the targeted operating income of $37,500 to the $45,000 of fixed cost and divide by the contribution margin ratio. This equation is:
© 2014 Cengage Learning. All Rights Reserved. May not be copied, scanned, or duplicated, in whole or in part, except for use as permitted in a license distributed with a certain product or service or otherwise on a password-protected website for classroom use.
LO-2
Page 18
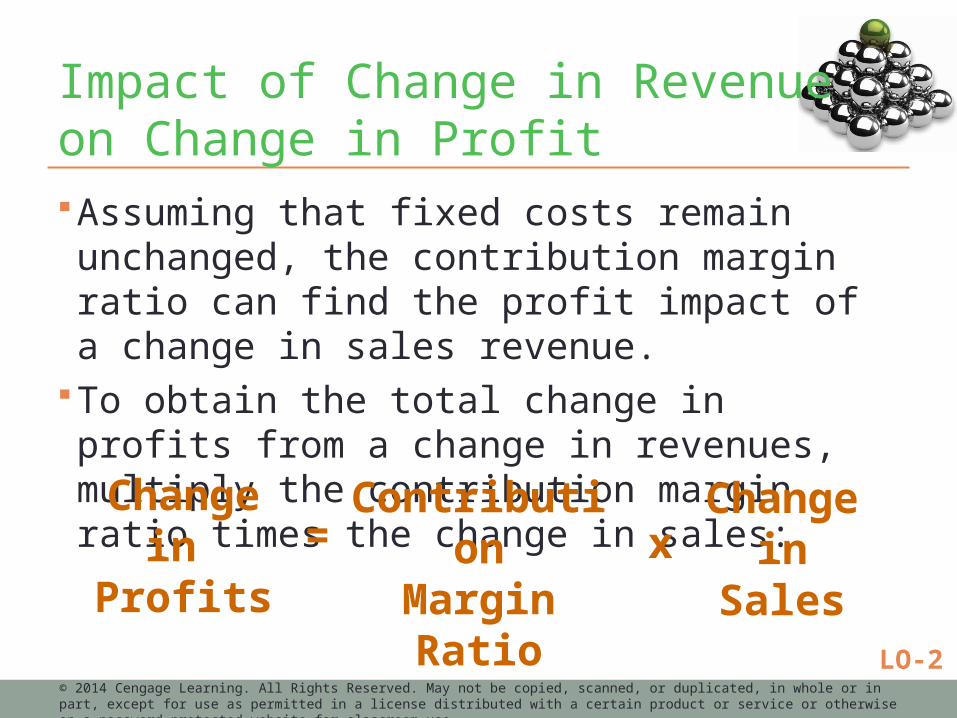
Impact of Change in Revenue on Change in ProfitAssuming that fixed costs remain unchanged, the contribution margin ratio can find the profit impact of a change in sales revenue.
To obtain the total change in profits from a change in revenues, multiply the contribution margin ratio times the change in sales:
© 2014 Cengage Learning. All Rights Reserved. May not be copied, scanned, or duplicated, in whole or in part, except for use as permitted in a license distributed with a certain product or service or otherwise on a password-protected website for classroom use.
Change in
Profits
ContributionMarginRatio
Change in
Sales
= x
LO-2
Page 19
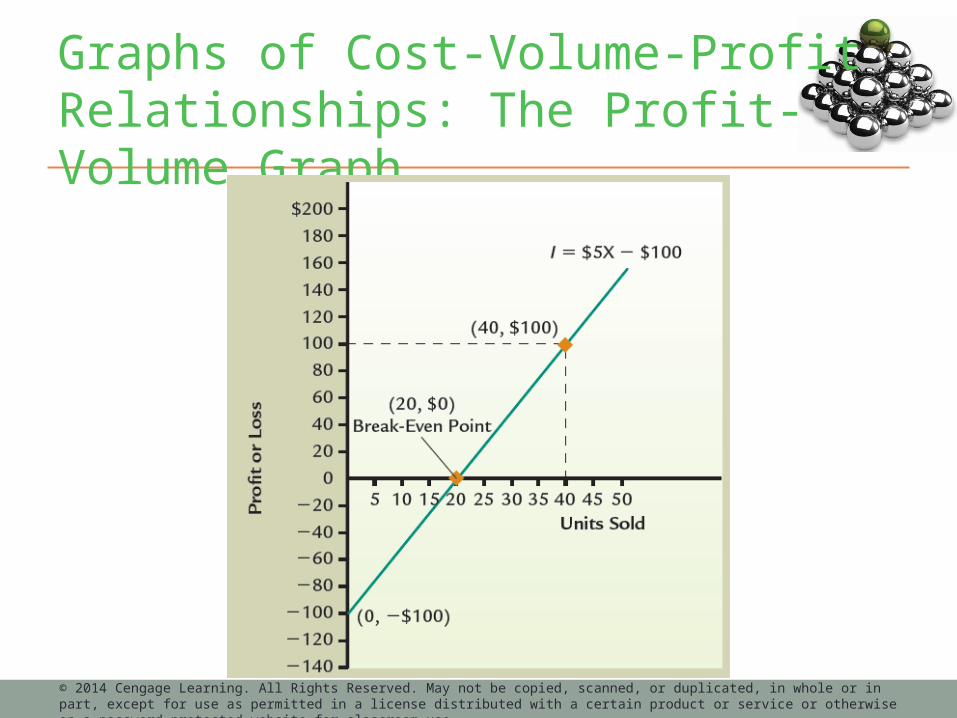
Graphs of Cost-Volume-Profit Relationships: The Profit-Volume GraphA profit-volume graph visually portrays the relationship between profits (operating income) and units sold.
The profit-volume graph is the graph of the operating income equation:
Operating income = (Price x Units) –
(Unit variable cost x Units) – Total fixed cost In the following graph, operating income is the dependent variable, and units is the independent variable.
© 2014 Cengage Learning. All Rights Reserved. May not be copied, scanned, or duplicated, in whole or in part, except for use as permitted in a license distributed with a certain product or service or otherwise on a password-protected website for classroom use.
LO-3
Page 20
Graphs of Cost-Volume-Profit Relationships: The Profit-Volume Graph
© 2014 Cengage Learning. All Rights Reserved. May not be copied, scanned, or duplicated, in whole or in part, except for use as permitted in a license distributed with a certain product or service or otherwise on a password-protected website for classroom use.
Page 21
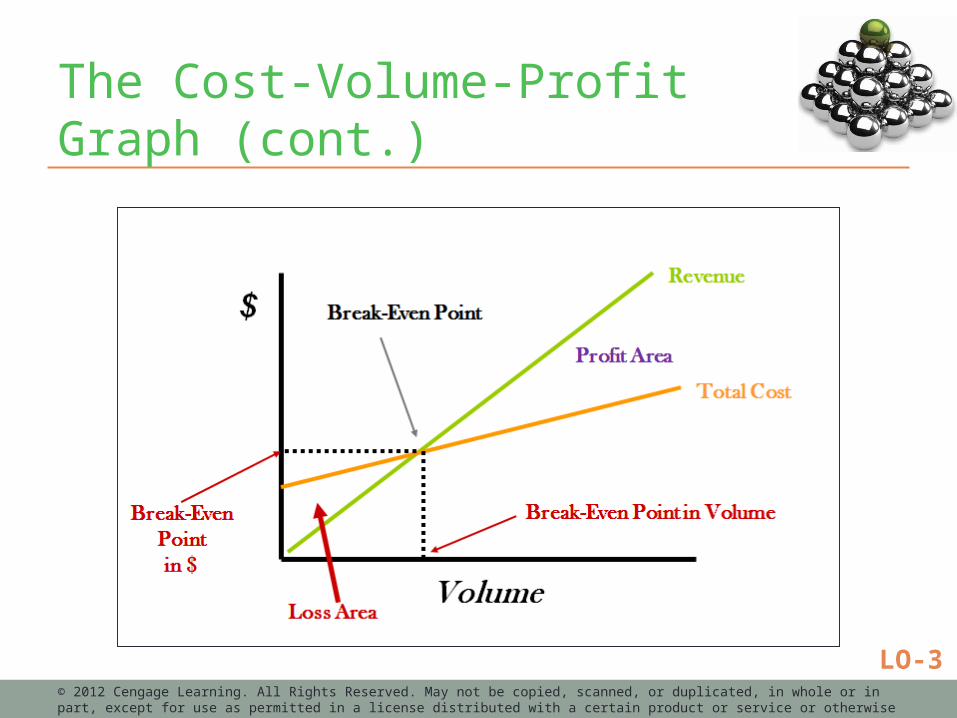
The Cost-Volume-Profit Graph
The cost-volume-profit graph depicts the relationships among cost, volume, and profits (operating income).
LO-3© 2014 Cengage Learning. All Rights Reserved. May not be copied, scanned, or duplicated, in whole or in part, except for use as permitted in a license distributed with a certain product or service or otherwise on a password-protected website for classroom use.
Page 22
The Cost-Volume-Profit Graph (cont.)
© 2012 Cengage Learning. All Rights Reserved. May not be copied, scanned, or duplicated, in whole or in part, except for use as permitted in a license distributed with a certain product or service or otherwise on a password-protected website for classroom use.
LO-3
Page 23
CVP Analysis Assumptions
© 2014 Cengage Learning. All Rights Reserved. May not be copied, scanned, or duplicated, in whole or in part, except for use as permitted in a license distributed with a certain product or service or otherwise on a password-protected website for classroom use.
Major assumptions of CVP analysis include:
Linear revenue and cost functions remain constant over the
relevant range.
Sales mix is known with certainty for multiple-product break-even
settings.
Selling prices and costs are known with
certainty.
All units produced are sold; no finished goods
inventories remain.
1 2
3 4
LO-3
Page 24
Multiple-Product Analysis
Cost-volume-profit analysis is simple in the single-product setting. However, most firms produce and sell a number of products or services.
How do we adapt the formulas used in a single-product setting to a multiple-product setting?
© 2014 Cengage Learning. All Rights Reserved. May not be copied, scanned, or duplicated, in whole or in part, except for use as permitted in a license distributed with a certain product or service or otherwise on a password-protected website for classroom use.
LO-4
Page 25
Multiple-Product Analysis (cont.)
One important distinction is to separate direct fixed expenses from common fixed expenses. Direct fixed expenses are those fixed costs that can
be traced to each segment and would be avoided if the segment did not exist.
Common fixed expenses are the fixed costs that are not traceable to the segments and would remain even if one of the segments was eliminated.
© 2014 Cengage Learning. All Rights Reserved. May not be copied, scanned, or duplicated, in whole or in part, except for use as permitted in a license distributed with a certain product or service or otherwise on a password-protected website for classroom use.
LO-4
Page 26
Break-Even Calculations for Multiple ProductsWhen more than one product is produced and sold, managers must estimate the sales mix and calculate a package contribution margin.
Sales mix is the relative combination of products being sold by a firm.
© 2014 Cengage Learning. All Rights Reserved. May not be copied, scanned, or duplicated, in whole or in part, except for use as permitted in a license distributed with a certain product or service or otherwise on a password-protected website for classroom use.
LO-4
Page 27
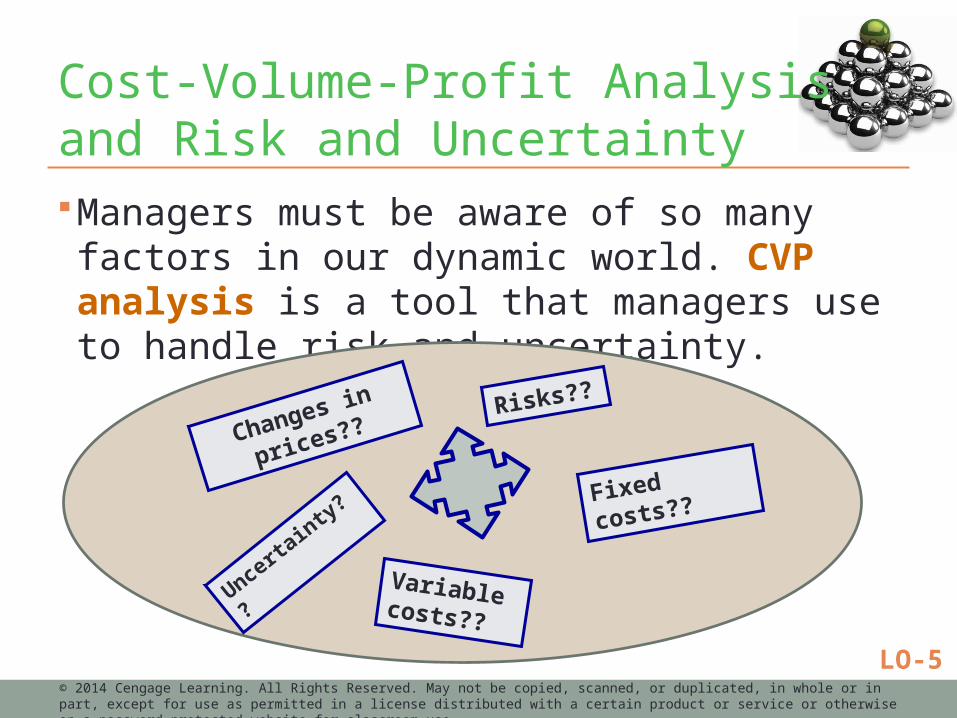
Cost-Volume-Profit Analysis and Risk and UncertaintyManagers must be aware of so many factors in our dynamic world. CVP analysis is a tool that managers use to handle risk and uncertainty.
© 2014 Cengage Learning. All Rights Reserved. May not be copied, scanned, or duplicated, in whole or in part, except for use as permitted in a license distributed with a certain product or service or otherwise on a password-protected website for classroom use.
Variable costs??
Fixed
costs??
Changes in
prices??Risks??
Uncertainty??
LO-5
Page 28
Methods to Deal with Uncertainty and Risk
© 2014 Cengage Learning. All Rights Reserved. May not be copied, scanned, or duplicated, in whole or in part, except for use as permitted in a license distributed with a certain product or service or otherwise on a password-protected website for classroom use.
LO-5
Page 29
Margin of Safety
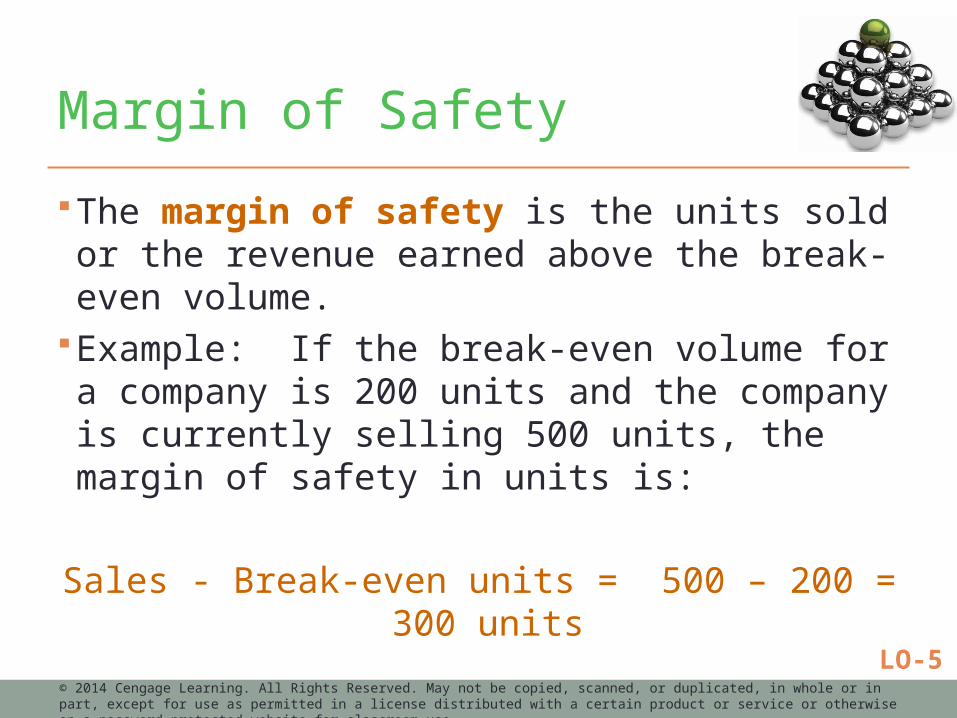
The margin of safety is the units sold or the revenue earned above the break-even volume.
Example: If the break-even volume for a company is 200 units and the company is currently selling 500 units, the margin of safety in units is:
Sales - Break-even units = 500 – 200 = 300 units
© 2014 Cengage Learning. All Rights Reserved. May not be copied, scanned, or duplicated, in whole or in part, except for use as permitted in a license distributed with a certain product or service or otherwise on a password-protected website for classroom use.
LO-5
Page 30
Margin of Safety (cont.)
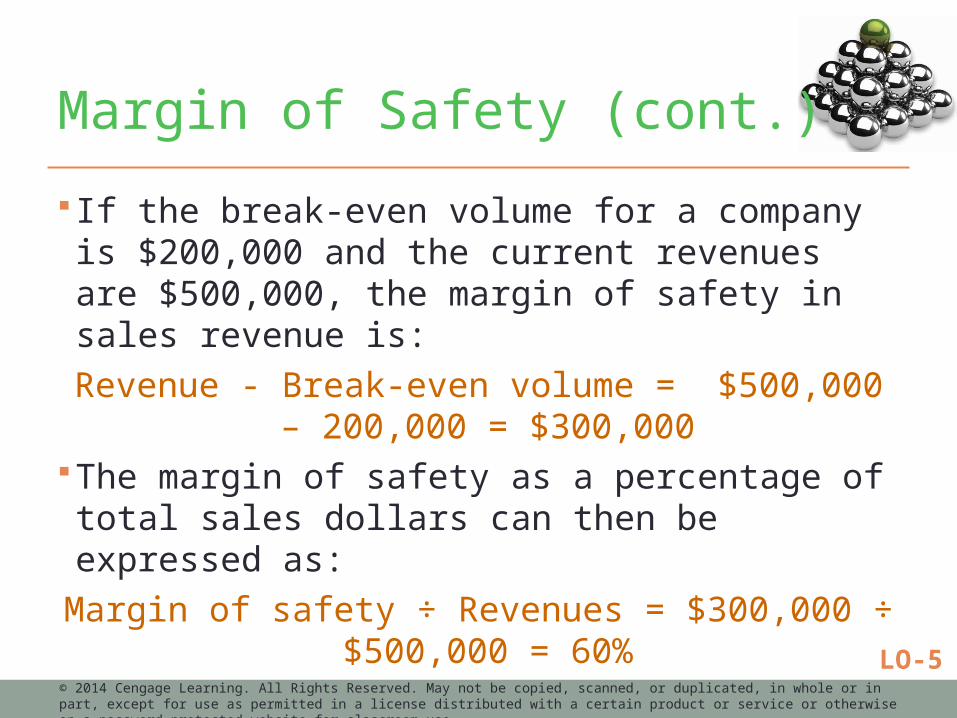
If the break-even volume for a company is $200,000 and the current revenues are $500,000, the margin of safety in sales revenue is:
Revenue - Break-even volume = $500,000 – 200,000 = $300,000
The margin of safety as a percentage of total sales dollars can then be expressed as:
Margin of safety ÷ Revenues = $300,000 ÷ $500,000 = 60%
© 2014 Cengage Learning. All Rights Reserved. May not be copied, scanned, or duplicated, in whole or in part, except for use as permitted in a license distributed with a certain product or service or otherwise on a password-protected website for classroom use.
LO-5
Page 31
Operating Leverage
Operating leverage is the use of fixed costs to extract higher percentage changes in profits as sales activity changes. Measure of the proportion of fixed costs in a company’s
cost structure. Used as an indicator of how sensitive profit is to
changes in sales volume.
© 2014 Cengage Learning. All Rights Reserved. May not be copied, scanned, or duplicated, in whole or in part, except for use as permitted in a license distributed with a certain product or service or otherwise on a password-protected website for classroom use.
LO-5
Page 32
Operating Leverage (cont.)
The degree of operating leverage (DOL) can be measured for a given level of sales by taking the ratio of contribution margin to operating income or:
Contribution margin ÷ Operating income
© 2014 Cengage Learning. All Rights Reserved. May not be copied, scanned, or duplicated, in whole or in part, except for use as permitted in a license distributed with a certain product or service or otherwise on a password-protected website for classroom use.
LO-5
Page 33
Summary of Operating Leverage
© 2014 Cengage Learning. All Rights Reserved. May not be copied, scanned, or duplicated, in whole or in part, except for use as permitted in a license distributed with a certain product or service or otherwise on a password-protected website for classroom use.
Operating LeverageHIGH LOW
% profit increase with sales increase
Large Small
% loss increase with sales decrease
Large Small
LO-5
Page 34
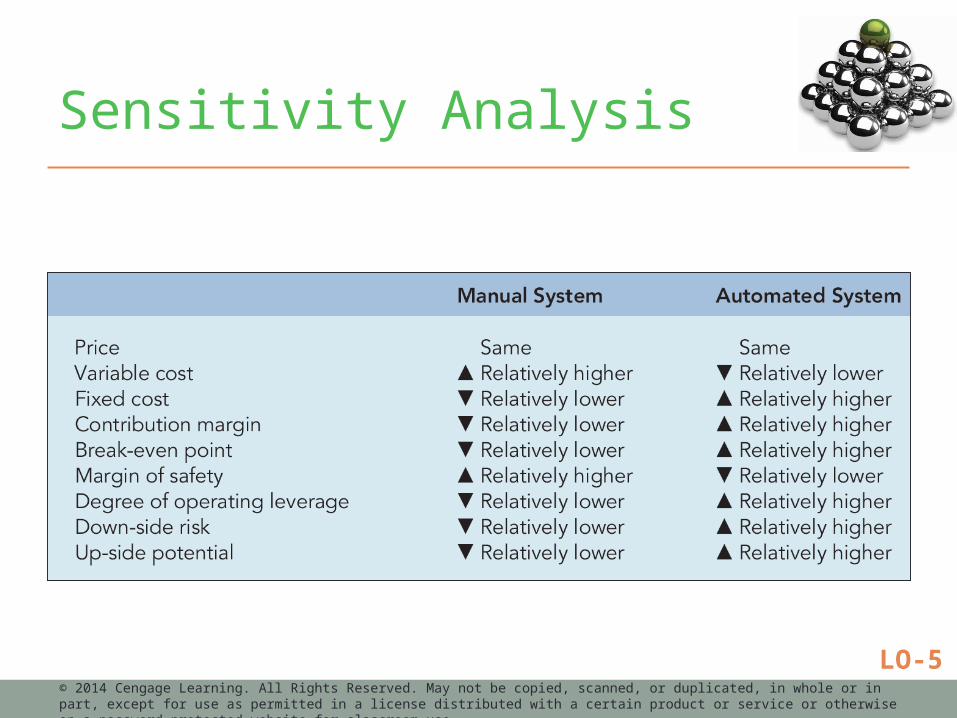
Sensitivity Analysis
© 2014 Cengage Learning. All Rights Reserved. May not be copied, scanned, or duplicated, in whole or in part, except for use as permitted in a license distributed with a certain product or service or otherwise on a password-protected website for classroom use.
LO-5