47
Neurological April 2016 Commissioning for Value Where to Look pack Cornwall and the Isles of Scilly - STP area December 2016

Cornwall and the Isles of Scilly - STP area
NHS England Publications Gateway ref:
Neurological
April 2016
Commissioning for Value Where to Look pack Cornwall and the Isles of Scilly - STP area
December 2016
2
Contents
• Introduction to your Where to Look pack
• Supporting the STP process
• NHS RightCare and Getting it Right First Time (GIRFT)
• Your data
• Next steps and actions
• Further support and information
• Useful links
• The NHS RightCare programme
• NHS RightCare and Commissioning for Value
Introduction to your Where to Look pack
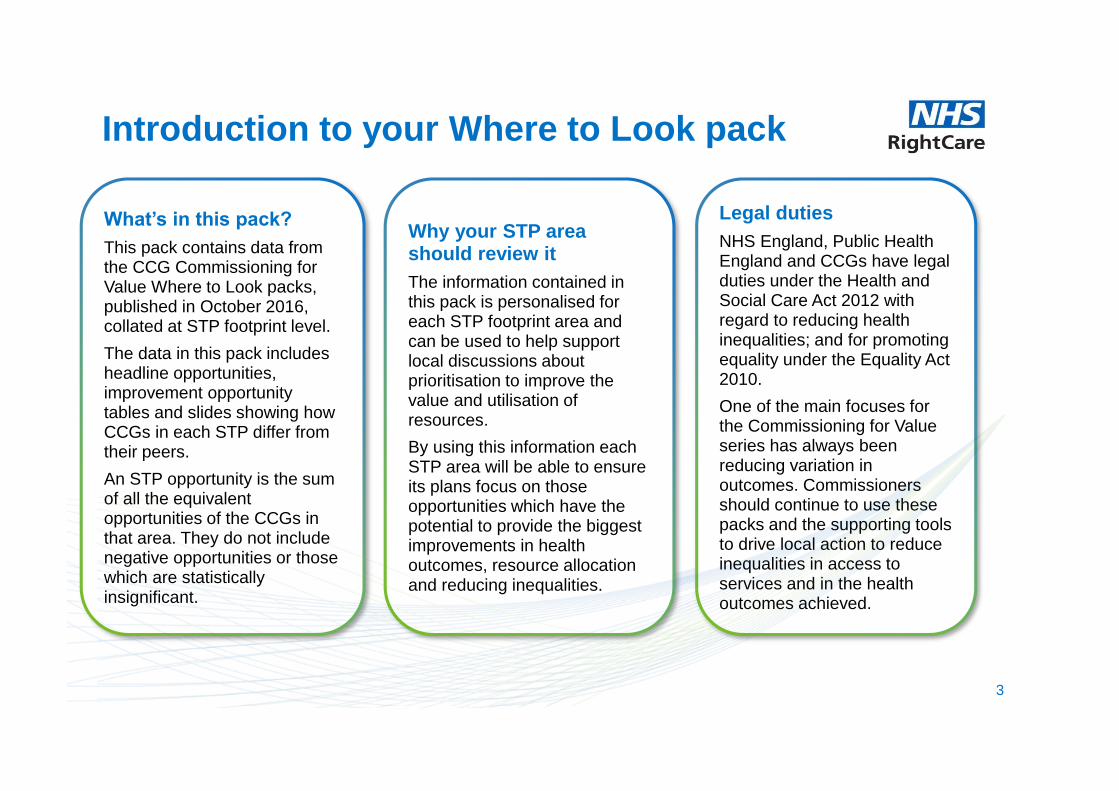
What’s in this pack?
This pack contains data from the CCG Commissioning for Value Where to Look packs, published in October 2016, collated at STP footprint level.
The data in this pack includes headline opportunities, improvement opportunity tables and slides showing how CCGs in each STP differ from their peers.
An STP opportunity is the sum of all the equivalent opportunities of the CCGs in that area. They do not include negative opportunities or those which are statistically insignificant.
Legal duties
NHS England, Public Health England and CCGs have legal duties under the Health and Social Care Act 2012 with regard to reducing health inequalities; and for promoting equality under the Equality Act 2010.
One of the main focuses for the Commissioning for Value series has always been reducing variation in outcomes. Commissioners should continue to use these packs and the supporting tools to drive local action to reduce inequalities in access to services and in the health outcomes achieved.
Why your STP area should review it
The information contained in this pack is personalised for each STP footprint area and can be used to help support local discussions about prioritisation to improve the value and utilisation of resources.
By using this information each STP area will be able to ensure its plans focus on those opportunities which have the potential to provide the biggest improvements in health outcomes, resource allocation and reducing inequalities.
3

Supporting the STP process
This pack has been created to align with the new Sustainability and Transformation Planning
(STP) process. Local service leaders in every part of England are working together for the first
time on shared plans to transform health and care in the diverse communities they serve.
Commissioning for Value (CfV) supports CCGs and STP footprint areas by providing the most
up to date data available. Expenditure data is from 2015/16. Outcomes data is the latest
available at time of publication. The time period for each pathway on a page indicator is
included on the chart. In addition the key indicators from the seven focus packs (originally
published in April/May 2016) will be refreshed in the CfV online tools in early 2017.
In the meantime, CCGs and local health economies will still be able to use the 2016 focus
packs for further investigations as an indication of what to change. Unless a CCG has taken
action along a particular pathway, their relative position is unlikely to have altered.
4
5
NHS RightCare and Getting it Right First Time (GIRFT) NHS RightCare and GIRFT are complementary programmes and should be used together to support the delivery of population healthcare improvement and financial sustainability.
NHS RightCare’s Commissioning for Value workstream supports improvement across systems by focusing on pathways of care from primary prevention to end of life care. Whilst supporting improvement in terms of access to and outcomes from the acute sector, Commissioning for Value has not focused in detail on hospital care. GIRFT provides detailed insight into variation in the acute system in a way that has not been available before. As such NHS RightCare and GIRFT collectively provide clinical improvement insight across the entire health care system. In 2017 NHS RightCare and GIRFT will be working closely together to support STPs and their local health economies. This will begin with a complementary set of analysis on orthopaedic pathways. This pack supports STP thinking on this collective agenda, including by highlighting opportunities for improvement such as by coordinating the reallocation of capacity in the acute
system, something that can only be achieved together. See pages 9 and 10.

Headline opportunity areas for Cornwall and the Isles of Scilly
The number in the grey circles below represents how many CCGs within Cornwall and the Isles of Scilly share a particular opportunity area out of 1 CCGs within the STPMental Health 1
Circulation 1
Trauma and Injuries 1
Musculoskeletal 1
Endocrine 1
Circulation 1
Cancer 1
Neurological 1
Musculoskeletal 1
Trauma and Injuries 1
Mental Health 1
Circulation 1
Trauma and Injuries 1
Neurological 1
Endocrine 1
Spend & Outcomes Outcomes Spend
These headline lists are based on the contributing CCGs which form the STP. The figure in the grey circle represents the number of times each programme appears in each individual CCG headline list. This is simply the number of CCGs in the STP with a common programme as a headline opportunity. It does not factor in the relative scale of each of the opportunities for this ranking. E.g. an STP with six CCGs may have all six CCGs with a cancer spend opportunity totalling £3m. In this example, cancer would rank above respiratory which appears in the list for five CCGs but has a total opportunity of £4m. This can be explored further in the detailed sections of this pack.
The number in the grey circles below represents how many CCGs within Cornwall and the Isles of Scilly share a particular opportunity area out of 1 CCGs within the STP
Headline opportunity areas for Cornwall and the Isles of Scilly
6
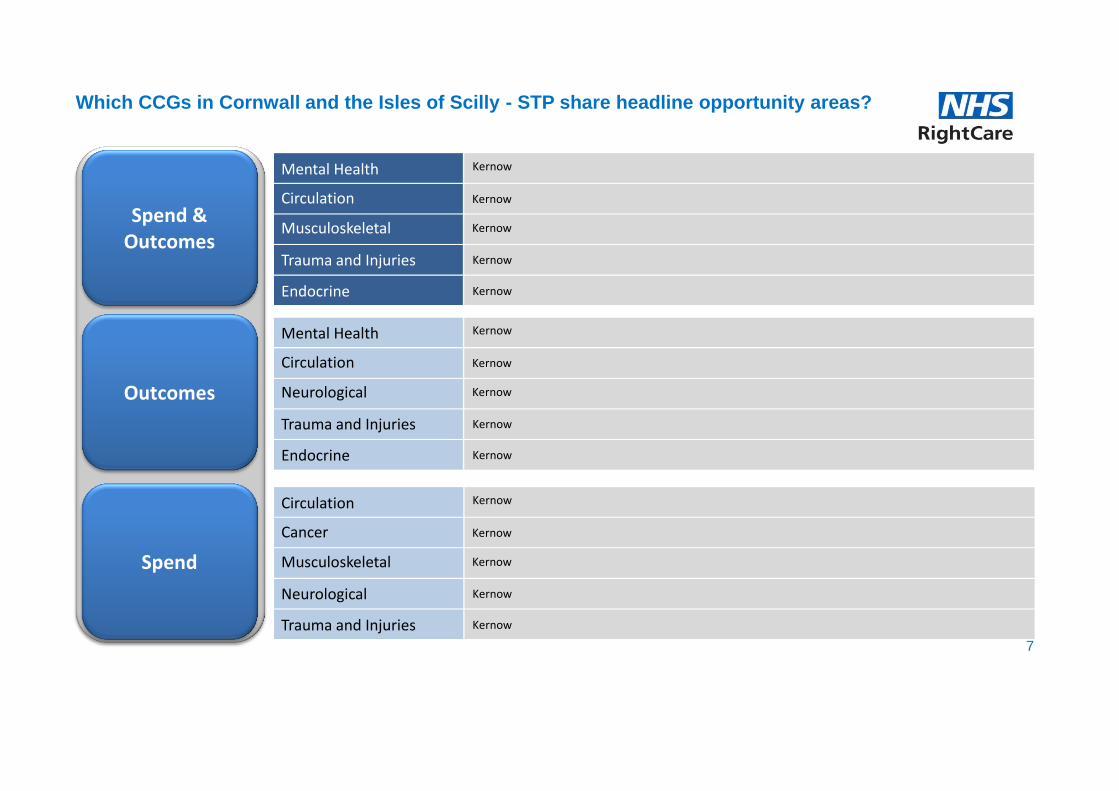
Spend & Outcomes
Outcomes
Spend
Mental Health Kernow
Musculoskeletal
Trauma and Injuries
Endocrine
Kernow
Kernow
Kernow
Kernow
Circulation
Mental Health Kernow
Neurological
Trauma and Injuries
Endocrine
Kernow
Kernow
Kernow
Kernow
Circulation
Circulation Kernow
Musculoskeletal
Neurological
Trauma and Injuries
Kernow
Kernow
Kernow
Kernow
Cancer
Which CCGs in Cornwall and the Isles of Scilly - STP share headline opportunity areas?
7

17 12
11
35
3
0 5 10 15 20 25 30 35 40
Trauma and Injuries
Gastro Intestinal
Respiratory
Circulation
Neurological
Cancer
Total Lives Saved
If the CCGs within the STP performed at the average of:
Similar 10 CCGs Best 5 of similar 10 CCGs
A value is only shown where the opportunity is statistically significant
The mortality data presented above uses Primary Care Mortality Database (PCMD) and is from 2012 to 2014. The potential lives saved opportunities are calculated on a yearly basis and are only shown where statistically significant. Lives saved only includes programmes where mortality outcomes have been considered appropria te.
What are the potential lives saved per year?
8

Coordinating the re-allocation of capacity
9
Improving a population healthcare system to become high value and optimal requires significant
change.
It requires change in the practices and perspectives of all of the professions, people and partners
engaged in the system. It requires change in how we engage with individual patients and how we
engage with our local communities, so that we inform and then seek to understand their
perspectives and their preferences. It requires change in how we operate and think about our
organisational structures, plans and asset models. And, most importantly of all, it requires us to
embrace, collectively and individually, the need to make these changes.
Variation data, as contained in the suite of Commissioning for Value packs, highlights that in
every health system in England, there exists a significant volume of overuse alongside significant
underuse. Overuse leads to waste and harm. Underuse leads to a failure to prevent disease and
inequity. Reducing both leads to a better and more sustainable system. In order to do this well,
we must work together to coordinate the re-allocation of capacity from unwarranted activity to
warranted activity, wherever in the system that may be.
Coordinating the re-allocation of capacity
10
The next page highlights the potential overuse in bed days for your STP area, as implied by
variation data for each of your constituent health economies. STP areas are able to use this
information to focus on the opportunity to free up bed capacity, and ask the questions ‘Is this
current bed use adding value?’ and ‘Where might we better use this capacity and resource?’.
In turn this will allow for discussion and consensus to be reached on where beds add more
value if re-allocated for different use. It also allows for discussion and consensus on what
current capacity a system could avoid the need for, if resources were re-allocated for non-bed
use, to deliver optimal clinical pathways and systems. Avoiding the need for capacity, in this
way, is a key component of delivering a sustainable healthcare system.
Fully integrated care is very likely to be a key part of these discussions. Identifying together
‘Where to Look’ and then designing optimal pathways and systems, that is, ‘What to Change’, by
collectively answering the question ‘What would we look like if we were doing the very best for
our population?’, is the optimal means of achieving this.
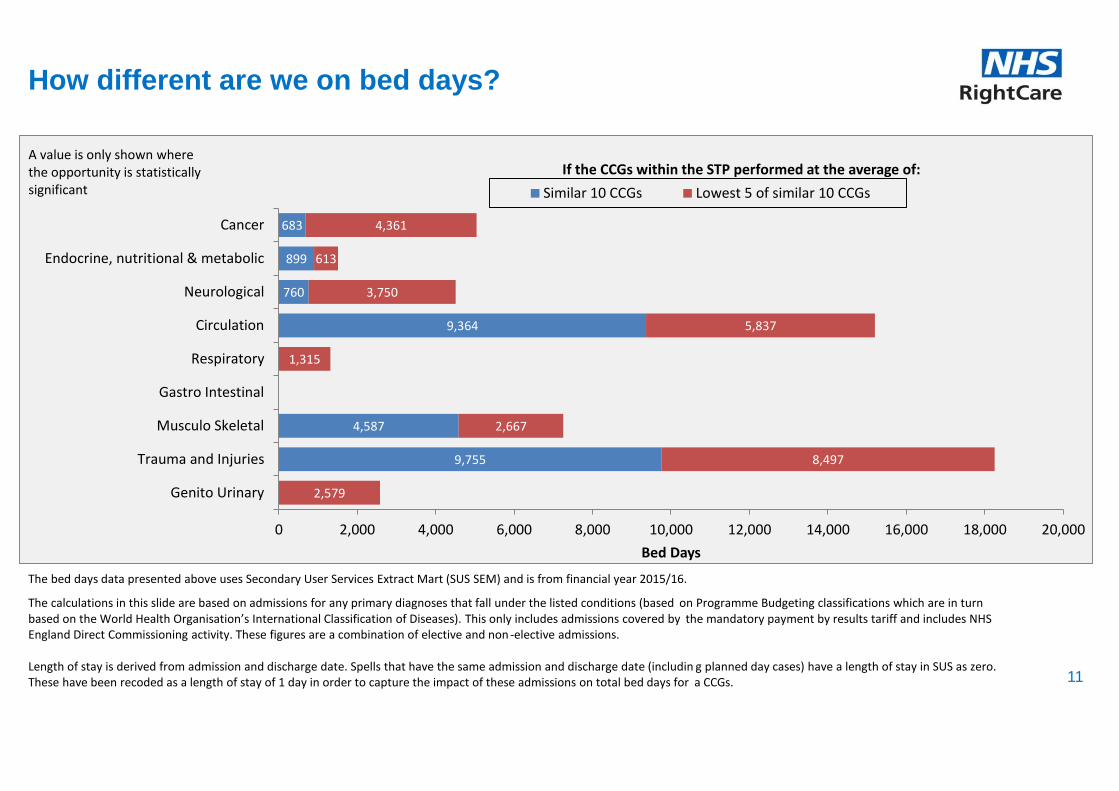
9,755
4,587
9,364
760
899
683
2,579
8,497
2,667
1,315
5,837
3,750
613
4,361
0 2,000 4,000 6,000 8,000 10,000 12,000 14,000 16,000 18,000 20,000
Genito Urinary
Trauma and Injuries
Musculo Skeletal
Gastro Intestinal
Respiratory
Circulation
Neurological
Endocrine, nutritional & metabolic
Cancer
Bed Days
If the CCGs within the STP performed at the average of:
Similar 10 CCGs Lowest 5 of similar 10 CCGs
A value is only shown where the opportunity is statistically significant
How different are we on bed days?
The bed days data presented above uses Secondary User Services Extract Mart (SUS SEM) and is from financial year 2015/16.
The calculations in this slide are based on admissions for any primary diagnoses that fall under the listed conditions (based on Programme Budgeting classifications which are in turn based on the World Health Organisation’s International Classification of Diseases). This only includes admissions covered by the mandatory payment by results tariff and includes NHS England Direct Commissioning activity. These figures are a combination of elective and non -elective admissions. Length of stay is derived from admission and discharge date. Spells that have the same admission and discharge date (includin g planned day cases) have a length of stay in SUS as zero. These have been recoded as a length of stay of 1 day in order to capture the impact of these admissions on total bed days for a CCGs. 11

1,541
3,732
1,653
57
696
526
2,611
344
866
165
1,180
0 1,000 2,000 3,000 4,000 5,000 6,000 7,000
Genito Urinary
Trauma and Injuries
Musculo Skeletal
Gastro Intestinal
Respiratory
Circulation
Neurological
Endocrine, nutritional & metabolic
Cancer
Total Difference (£000s)
If the CCGs within the STP performed at the average of:
Similar 10 CCGs Lowest 5 of similar 10 CCGs
A value is only shown where the opportunity is statistically significant
How different are we on spend on elective admissions?
The spend data presented above uses Secondary User Services Extract Mart (SUS SEM) and is from financial year 2015/16.
The calculations in this slide are based on expenditure on admissions for any primary diagnoses that fall under the listed co nditions (based on Programme Budgeting classifications which are in turn based on the World Health Organisation’s International Classification of Diseases). This only includes expenditure on admissions covered by the mandatory payment by results tariff and includes NHS England Direct Commissioning expenditure.
CCGs can explore this expenditure in more detail using the Commissioning for Value Focus Packs. For example, Neurological expenditure contains Chronic Pain, and the focus pack breaks this down by different types of Pain. CCGs should consider whether these admissions should be considered alongside other programmes e.g. CVD, Gastrointestinal, Musculoskeletal problems 12

1,439
514
673
2,333
148
1,189
983
286
1,020
594
1,543
860
151
773
0 500 1,000 1,500 2,000 2,500 3,000 3,500 4,000 4,500
Genito Urinary
Trauma and Injuries
Musculo Skeletal
Gastro Intestinal
Respiratory
Circulation
Neurological
Endocrine, nutritional & metabolic
Cancer
Total Difference (£000s)
Similar 10 CCGs Best 5 of similar 10 CCGs
If the CCGs within the STP performed at the average of: A value is only shown where the opportunity is statistically significant
How different are we on spend on non-elective admissions?
The spend data presented above uses Secondary User Services Extract Mart (SUS SEM) and is from financial year 2015/16.
The calculations in this slide are based on expenditure on admissions for any primary diagnoses that fall under the listed co nditions (based on Programme Budgeting classifications which are in turn based on the World Health Organisation’s International Classification of Diseases). This only includes expenditure on admissions covered by the mandatory payment by results tariff and includes NHS England Direct Commissioning expenditure.
CCGs can explore this expenditure in more detail using the Commissioning for Value Focus Packs. For example, Neurological expenditure contains Chronic Pain, and the focus pack breaks this down by different types of Pain. CCGs should consider whether these admissions should be considered alongside other programmes e.g. CVD, Gastrointestinal, Musculoskeletal problems 13
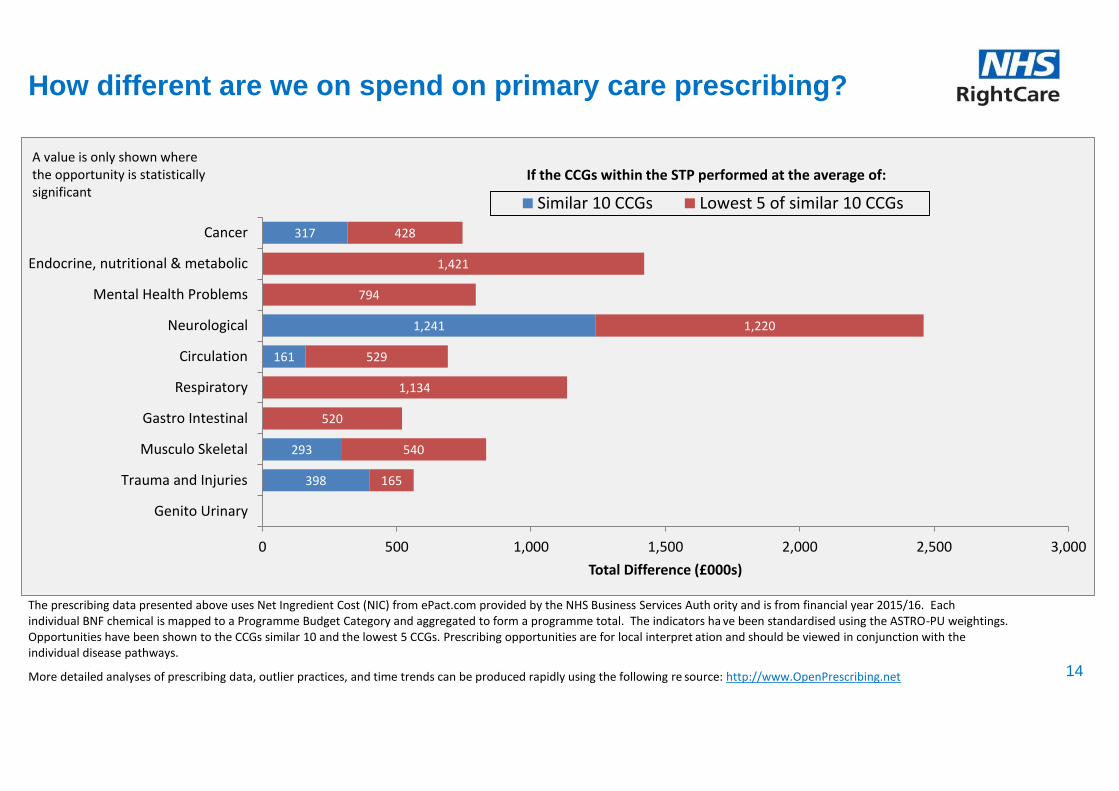
398
293
161
1,241
317
165
540
520
1,134
529
1,220
794
1,421
428
0 500 1,000 1,500 2,000 2,500 3,000
Genito Urinary
Trauma and Injuries
Musculo Skeletal
Gastro Intestinal
Respiratory
Circulation
Neurological
Mental Health Problems
Endocrine, nutritional & metabolic
Cancer
Total Difference (£000s)
Similar 10 CCGs Lowest 5 of similar 10 CCGs
If the CCGs within the STP performed at the average of: A value is only shown where the opportunity is statistically significant
How different are we on spend on primary care prescribing?
The prescribing data presented above uses Net Ingredient Cost (NIC) from ePact.com provided by the NHS Business Services Auth ority and is from financial year 2015/16. Each individual BNF chemical is mapped to a Programme Budget Category and aggregated to form a programme total. The indicators ha ve been standardised using the ASTRO-PU weightings. Opportunities have been shown to the CCGs similar 10 and the lowest 5 CCGs. Prescribing opportunities are for local interpret ation and should be viewed in conjunction with the individual disease pathways.
More detailed analyses of prescribing data, outlier practices, and time trends can be produced rapidly using the following re source: http://www.OpenPrescribing.net 14
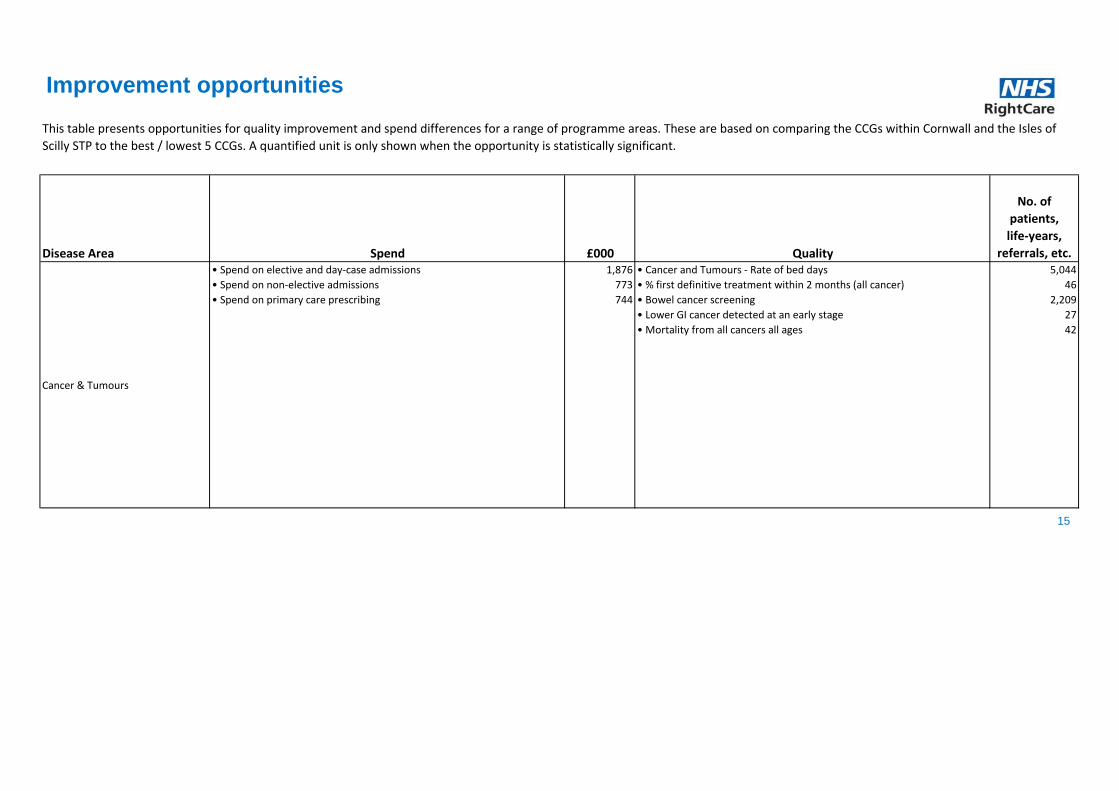
Disease Area Spend £000 Quality
No. of
patients,
life-years,
referrals, etc.
Cancer & Tumours
• Spend on elective and day-case admissions
• Spend on non-elective admissions
• Spend on primary care prescribing
1,876
773
744
• Cancer and Tumours - Rate of bed days
• % first definitive treatment within 2 months (all cancer)
• Bowel cancer screening
• Lower GI cancer detected at an early stage
• Mortality from all cancers all ages
5,044
46
2,209
27
42
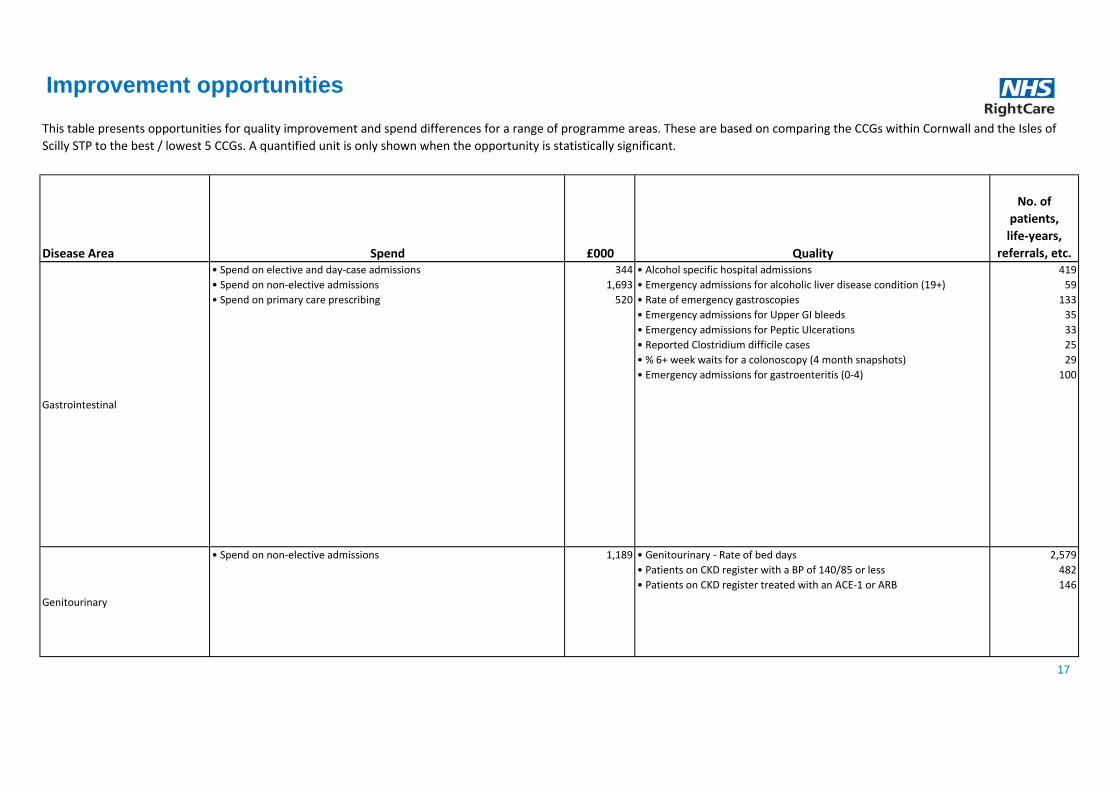
This table presents opportunities for quality improvement and spend differences for a range of programme areas. These are based on comparing the CCGs within Cornwall and the Isles of
Scilly STP to the best / lowest 5 CCGs. A quantified unit is only shown when the opportunity is statistically significant.
Improvement opportunities
15

Disease Area Spend £000 Quality
No. of
patients,
life-years,
referrals, etc.
This table presents opportunities for quality improvement and spend differences for a range of programme areas. These are based on comparing the CCGs within Cornwall and the Isles of
Scilly STP to the best / lowest 5 CCGs. A quantified unit is only shown when the opportunity is statistically significant.
Improvement opportunities
Circulation Problems (CVD)
• Spend on elective and day-case admissions
• Spend on non-elective admissions
• Spend on primary care prescribing
2,520
3,876
690
• Circulation - Rate of bed days
• Mortality from all circulatory diseases under 75 years
• Reported to estimated prevalence of CHD
• Reported to estimated prevalence of hypertension
• Patients with CHD whose cholesterol < 5 mmol/l
• Patients with hypertension whose BP < 150/90
• Mortality from CHD under 75 years
• Mortality from acute MI under 75 years
• Patients with stroke/TIA whose BP < 150/90
• Stroke patients spending 90% of their time on stroke unit
• Emergency readmissions within 28 days for stroke patients
• % patients returning home after treatment
• Mortality from stroke under 75 years
• Reported to estimated prevalence of AF
• Patients who go direct to a stroke unit (quarter)
15,201
35
4,619
10,432
179
714
25
9
231
203
14
401
12
547
85
Endocrine, Nutritional and
Metabolic Problems
• Spend on elective and day-case admissions
• Spend on non-elective admissions
• Spend on primary care prescribing
222
299
1,421
• Endocrine - Rate of bed days
• % diabetes patients whose HbA1c is <59 mmol/mol
• % diabetes patients whose blood pressure is <140/80
• % of diabetes patients receiving all three treatment targets
• % patients receiving foot examination
• Retinal screening
• % diabetes patients attending structured education
1,512
1,762
290
767
1,468
1,882
425
16
Disease Area Spend £000 Quality
No. of
patients,
life-years,
referrals, etc.
This table presents opportunities for quality improvement and spend differences for a range of programme areas. These are based on comparing the CCGs within Cornwall and the Isles of
Scilly STP to the best / lowest 5 CCGs. A quantified unit is only shown when the opportunity is statistically significant.
Improvement opportunities
Gastrointestinal
• Spend on elective and day-case admissions
• Spend on non-elective admissions
• Spend on primary care prescribing
344
1,693
520
• Alcohol specific hospital admissions
• Emergency admissions for alcoholic liver disease condition (19+)
• Rate of emergency gastroscopies
• Emergency admissions for Upper GI bleeds
• Emergency admissions for Peptic Ulcerations
• Reported Clostridium difficile cases
• % 6+ week waits for a colonoscopy (4 month snapshots)
• Emergency admissions for gastroenteritis (0-4)
419
59
133
35
33
25
29
100
Genitourinary
• Spend on non-elective admissions 1,189 • Genitourinary - Rate of bed days
• Patients on CKD register with a BP of 140/85 or less
• Patients on CKD register treated with an ACE-1 or ARB
2,579
482
146
17

Disease Area Spend £000 Quality
No. of
patients,
life-years,
referrals, etc.
This table presents opportunities for quality improvement and spend differences for a range of programme areas. These are based on comparing the CCGs within Cornwall and the Isles of
Scilly STP to the best / lowest 5 CCGs. A quantified unit is only shown when the opportunity is statistically significant.
Improvement opportunities
Maternity & Reproductive Health
• Flu vaccine take-up by pregnant women
• Smoking at time of delivery
• Infant mortality rate
• Emergency LRTI admissions rate for <1s
• % receiving 3 doses of 5-in-1 vaccine by age 2
• A&E attendance rate for <5s
• Emergency admissions rate for <5s
• Unintentional & deliberate injury admissions for <5s
• % of children aged 4-5 who are overweight or obese
• % receiving 1 dose of MMR vaccine by age 2
429
180
9
64
267
1,182
938
61
180
296
Mental Health Problems (all)
• Spend on primary care prescribing 794 • Mortality from suicide and injury undetermined all ages
• People with mental illness and or disability in settled accomodation
11
377
18

Disease Area Spend £000 Quality
No. of
patients,
life-years,
referrals, etc.
This table presents opportunities for quality improvement and spend differences for a range of programme areas. These are based on comparing the CCGs within Cornwall and the Isles of
Scilly STP to the best / lowest 5 CCGs. A quantified unit is only shown when the opportunity is statistically significant.
Improvement opportunities
Mental Health Problems (common)
• New cases of depression which have been reviewed
• Assessment of severity of depression at outset
• IAPT referrals with a wait <28days (quarter)
• IAPT: % referrals with outcome measured (6 months)
• IAPT: % 'moving to recovery' rate (quarter)
• IAPT: % achieving 'reliable improvement' (quarter)
• Emergency hospital admissions for self harm
183
766
275
145
234
109
300
Mental Health Problems (severe)
• Physical health checks for patients with SMI
• % Service users on CPA (end of quarter snapshot)
• People subject to mental health act (quarter)
• People on CPA in employment (end of quarter snapshot)
• % adults on CPA in settled accommodation (end of quarter snapshot)
• % of EIP referrals waiting >2 wks to start treatment (Incomplete) (5m)
• % of EIP referrals waiting <2 wks to start treatment (Complete) (5m)
126
2,955
47
150
452
16
13
19
Disease Area Spend £000 Quality
No. of
patients,
life-years,
referrals, etc.
This table presents opportunities for quality improvement and spend differences for a range of programme areas. These are based on comparing the CCGs within Cornwall and the Isles of
Scilly STP to the best / lowest 5 CCGs. A quantified unit is only shown when the opportunity is statistically significant.
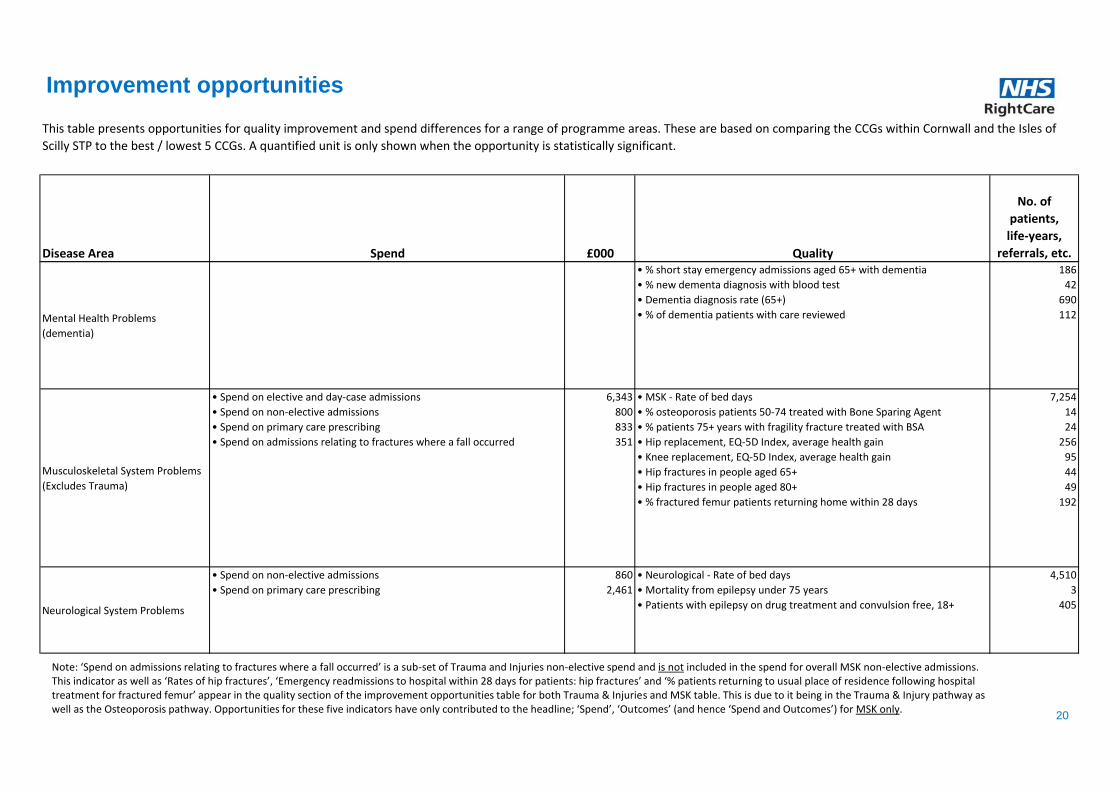
Improvement opportunities
Mental Health Problems
(dementia)
• % short stay emergency admissions aged 65+ with dementia
• % new dementa diagnosis with blood test
• Dementia diagnosis rate (65+)
• % of dementia patients with care reviewed
186
42
690
112
Musculoskeletal System Problems
(Excludes Trauma)
• Spend on elective and day-case admissions
• Spend on non-elective admissions
• Spend on primary care prescribing
• Spend on admissions relating to fractures where a fall occurred
6,343
800
833
351
• MSK - Rate of bed days
• % osteoporosis patients 50-74 treated with Bone Sparing Agent
• % patients 75+ years with fragility fracture treated with BSA
• Hip replacement, EQ-5D Index, average health gain
• Knee replacement, EQ-5D Index, average health gain
• Hip fractures in people aged 65+
• Hip fractures in people aged 80+
• % fractured femur patients returning home within 28 days
7,254
14
24
256
95
44
49
192
Neurological System Problems
• Spend on non-elective admissions
• Spend on primary care prescribing
860
2,461
• Neurological - Rate of bed days
• Mortality from epilepsy under 75 years
• Patients with epilepsy on drug treatment and convulsion free, 18+
4,510
3
405
20
Note: ‘Spend on admissions relating to fractures where a fall occurred’ is a sub-set of Trauma and Injuries non-elective spend and is not included in the spend for overall MSK non-elective admissions. This indicator as well as ‘Rates of hip fractures’, ‘Emergency readmissions to hospital within 28 days for patients: hip fractures’ and ‘% patients returning to usual place of residence following hospital treatment for fractured femur’ appear in the quality section of the improvement opportunities table for both Trauma & Injuries and MSK table. This is due to it being in the Trauma & Injury pathway as well as the Osteoporosis pathway. Opportunities for these five indicators have only contributed to the headline; ‘Spend’, ‘Outcomes’ (and hence ‘Spend and Outcomes’) for MSK only.

Disease Area Spend £000 Quality
No. of
patients,
life-years,
referrals, etc.
This table presents opportunities for quality improvement and spend differences for a range of programme areas. These are based on comparing the CCGs within Cornwall and the Isles of
Scilly STP to the best / lowest 5 CCGs. A quantified unit is only shown when the opportunity is statistically significant.
Improvement opportunities
Respiratory System Problems
• Spend on non-elective admissions
• Spend on primary care prescribing
594
1,134
• Respiratory - Rate of bed days
• Mortality from bronchitis, emphysema and COPD under 75 years
• Reported to estimated prevalence of COPD
• % of COPD patients with a record of FEV1
• % of COPD patients with review (12 months)
• % asthma patients with review (12 months)
• Emergency admission rate for children with asthma, 0-19yrs
1,315
11
2,666
124
87
913
37
Trauma & Injuries
• Spend on elective and day-case admissions
• Spend on non-elective admissions
• Spend on primary care prescribing
• Spend on admissions relating to fractures where a fall occurred
2,067
2,422
563
351
• Trauma and injuries - Rate of bed days
• Mortality from accidents all ages
• Injuries due to falls in people aged 65+
• Unintentional and deliberate injury admissions, 0-24yrs
• All fracture admissions in people aged 65+
• Hip fractures in people aged 65+
• Hip fractures in people aged 80+
• % fractured femur patients returning home within 28 days
18,252
29
100
430
683
44
49
192
21

How to read your STP pathways
22
The following slides provide a more detailed look at 19
'Pathways on a page' for each CCG within the STP.
The intention of these pathways is not to provide a
definitive view, but to help commissioners explore potential
opportunities. These slides help to understand how
performance in one part of the pathway may affect
outcomes further along the pathway.
Each row in the matrix represents a CCG in your STP
area and how it compares to its similar 10 CCGs across
that pathway. The similar 10 CCGs are not necessarily in
the same STP. These Pathways on a Page allow an STP
to examine which programmes have common
opportunities for several CCGs across the entire pathway,
or for part of a pathway (such as primary care or
detection) for several CCGs. Therefore, STPs may find it
useful to scan the charts both horizontally and vertically.
The key to the right shows how to interpret the coloured
squares and arrows.
The STP opportunities underneath each indicator
name sum the CCG opportunities benchmarked
against the average of the best 5 CCGs, unlike the
coloured squares which benchmark against the
average of the similar 10 CCGs.
Opportunities are calculated for all RAG-rated
indicators except for the stated exceptions.
p CCG is statistically significantly HIGHER
q CCG is statistically significantly LOWER
r CCG HIGHER but not statistically significant
s CCG LOWER but not statistically significant
tu CCG is equal to benchmark
r CCG WORSE/HIGHER but not statistically significant
s CCG WORSE/LOWER but not statistically significant
r CCG BETTER/HIGHER but not statistically significant
s CCG BETTER/LOWER but not statistically significant
tu CCG is equal to benchmark
CCG is statistically significantly WORSE
CCG is statistically significantly BETTER
CCG has no published data for this indicator or value is suppressed due to small
numbers

DeprivationBreast cancer
prevalence
Incidence of
breast cancer
Obesity
prevalence, 16+
Breast cancer
screening
Primary care
prescribing
spend
Urgent GP
referrals (breast
cancer)
% first definitive
treatment within
2 months (all
cancer)
Emergency
presentations for
breast cancer
Elective spend
Breast cancer
detected at an
early stage
<75 Mortality
from breast
cancer
1 year survival
(breast)
2006-2013 2015/16 2013 2012-14 2013 (2011)2015 2010 2012-14 2015/16 2014/15 2015/16 2014/15 2015/16
ss p q sp rKernow
STP opportunity
(to Best 5) 46 Pats.
Breast cancer pathway
23 Note: We do not calculate potential opportunities for emergency presentations and one-year survival rates owing to missing information in published data.

Deprivation
Colorectal
cancer
prevalence
Incidence of
colorectal cancer
Obesity
prevalence, 16+
Bowel cancer
screening
Urgent GP
referrals
(colorectal
cancer)
% first definitive
treatment within
2 months (all
cancer)
Emergency
presentations for
colorectal cancer
Elective spendNon-elective
spend
Lower GI cancer
detected at an
early stage
<75 Mortality
from colorectal
cancer
1 year survival
(colorectal)
q r s rr p p sKernow p q
2013 2012-14 2013 (2011)2010 2012-14 2015/16 2014/15 2014/15 2015/162015 2006-2013 2015/16 2015/16
£126K 27 Pats. STP opportunity
(to Best 5)2,209 Ppl. 46 Pats.
Lower gastro-intestinal cancer pathway
24 Note: We do not calculate potential opportunities for emergency presentations and one-year survival rates owing to missing information in published data.

DeprivationLung cancer
prevalence
Incidence of
lung cancer
Smoking
prevalence,
18+
Obesity
prevalence,
16+
Successful
quitters, 16+
Urgent GP
referrals (lung
cancer)
% first definitive
treatment
within 2 months
(all cancer)
Emergency
presentations
for lung cancer
Elective spendNon-elective
spend
Lung cancer
detected at an
early stage
<75 Mortality
from lung
cancer
1 year survival
(lung)
s r r rs p p spKernow p p
2013 2012-14 2013 (2011)2010 2012-14 2015/16 2014/15 2014/15 2015/162015/162015 2006-2013 2015/16 2015/16
£242K STP opportunity
(to Best 5) 46 Pats.
Lung cancer pathway
25 Note: We do not calculate potential opportunities for emergency presentations and one -year survival rates owing to missing information in published data.

Deprivation
Estimate of
people with a
psychotic
disorder
People with
SMI known to
GPs: % on
register
Primary care
prescribing
spend
Physical
health checks
% of EIP
referrals
waiting <2 wks
to start
treatment
(Complete)
% of EIP
referrals
waiting >2 wks
to start
treatment
(Incomplete)
New cases of
psychosis
served by
Early
Intervention
teams
People treated
by Early
Intervention
Teams
People on
Care
Programme
Approach
% Service
users on CPA
Mental health
hospital
admissions
People subject
to mental
health act
People on
CPA in
employment
% adults on
CPA in settled
accommodatio
n
2012 2015/16
q q p rr s s p r pKernow p q
2015/16 Q2 2015/16 Q2 2015/16 Q22015/16 2014/15April 2016-
August 2016
April 2016-
August 2016
2015/16 Q4
(Year End)2015/16 Q22015 2015/16 Q4 2015/16 Q4 2014/15
2,955 Pats. 47 Ppl. 150 Ppl. 452 Ppl.STP opportunity
(to Best 5)126 Pats. 13 Pats. 16 Pats.
Severe mental illness pathway
26
Note: There is variation in the quality of care coordination under CPA, meaning CCGs have not been ranked better/worse than their similar peers for these indicators. However, because it is recommended that more users should be offered CPA support, opportunity figures have been provided for % service users on CPA.

Deprivation% population with
LLTI or disability
Estimated
prevalence of
CMHD (% 16-74
pop)
Depression
prevalence 18+
New cases of
depression which
have been
reviewed
Antidepressant
prescribing
IAPT referrals:
Rate aged 18+
IAPT: Rate
beginning
treatment
IAPT: % waiting
<6 weeks for first
treatment
IAPT: % referrals
with outcome
measured
IAPT: % 'moving
to recovery' rate
IAPT: % achieving
'reliable
improvement'
p q pKernow p p
2015/16 Q4 2015/16 Q42011 2014/15 2015/16 2015/16 2015/16 2015/16 Q4
r
145 Pats. 234 Pats. 109 Pats.
2015 2015/16 Q4Oct 2015 - Mar
2016
Oct 2015 - Mar
2016
STP opportunity
(to Best 5)183 Pats.
Common mental health disorders pathway
27 Note: It isn’t possible to robustly calculate an opportunity of number of additional people who should be referred into IAPT.

% physically
inactive adults
Smoking
prevalence, 18+
Hypertension
prevalence, 18+
Dementia
prevalence 65+
Dementia
diagnosis rate
(65+)
% new dementa
diagnosis with
blood test
% dementia
patients with care
reviewed
Ratio of Inpatient
Service Use to
Recorded
Diagnoses
Rate of
emergency
admissions aged
65+ with dementia
% short stay
emergency
admissions aged
65+ with dementia
65+ mortality with
dementia
% dementia
deaths in usual
place of residence
(65+)
q q sKernow s p
2014 20142015/16 2015/16 Sep 2015 Aug 2016 2015/16 2015/16
r sq
186 Adm.
2014 2014/15 2014/15 2014/15
STP opportunity
(to Best 5)690 Ppl. 42 Pats. 112 Pats.
Dementia pathway
28

CHD
prevalence
Hypertension
prevalence,
18+
Reported to
estimated
prevalence of
CHD
Reported to
estimated
prevalence of
hypertension
Smoking
prevalence,
18+
Obesity
prevalence,
16+
% CHD
patients whose
BP < 150/90
% CHD
patients
cholesterol < 5
mmol/l
% hypertension
patients whose
BP < 150/90
Primary care
prescribing
spend
Elective spendNon-elective
spend
<75 Mortality
from CHD
<75 Mortality
from acute MI
p p r sp pKernow r q
2015/16 2012-14 2012-142015/16 2015/16 2015/16 2015/16 2015/16 2013/142015/162015/16 2015/16 2015/16 2015/16
714 Pats. £1180K 25 Lives 9 LivesSTP opportunity
(to Best 5)4,619 Ppl. 10,432 Ppl. 179 Pats.
Heart Disease pathway
29

Stroke or TIA
Prevalence,
18+
Smoking
prevalence,
18+
Obesity
prevalence,
16+
Reported to
estimated
prevalence
of AF
% stroke/TIA
patients
whose BP <
150/90
% stroke/TIA
patients on
antiplatelet
or
anticoagulan
t
High-risk AF
patients on
anticoagulati
on therapy
Primary care
prescribing
spend
% who go
direct to a
stroke unit
% who
receive
thrombolysis
Patients
90% of time
on stroke
unit
Elective
spend
Non-elective
spend
% treated by
early
supported
discharge
team
Emergency
readmission
s within 28
days
% patients
returning
home after
treatment
<75 Mortality
from stroke
p p s r r rp s pKernow p
2009/10 -
11/122014/15 2012-142015/16 2015/16 2015/16
Jan-Mar
2016
Jan-Mar
20162015/162015/16 2015/16 2015/16
Jan-Mar
20162015/16 2015/16 2015/16 2015/16
STP opportunity
(to Best 5)547 Ppl. 231 Pats. 85 Pats. 203 Pats. £1528K 14 Adm. 401 Pats. 12 Lives
Stroke pathway
30

Diabetes
prevalence, 17+
Obesity prevalence,
16+
% diabetes patients
cholesterol < 5
mmol/l
% diabetes patients
HbA1c is <59
mmol/mol
% diabetes patients
whose BP < 140/80
% of diabetes
patients receiving
all three treatment
targets
% patients receiving
foot examinationRetinal screening
% diabetes patients
attending structured
education
Primary care
prescribing spendNon-elective spend
Kernow q p
2015/162015/16 2015/16 2015/16 2015/16 2014/15 2015/16
q
425 Pats. £313K
2015/16 2013/14 2015/16 2015/16
STP opportunity
(to Best 5) 1,762 Pats. 290 Pats. 767 Pats. 1,468 Pats. 1,882 Pats.
Diabetes pathway
31
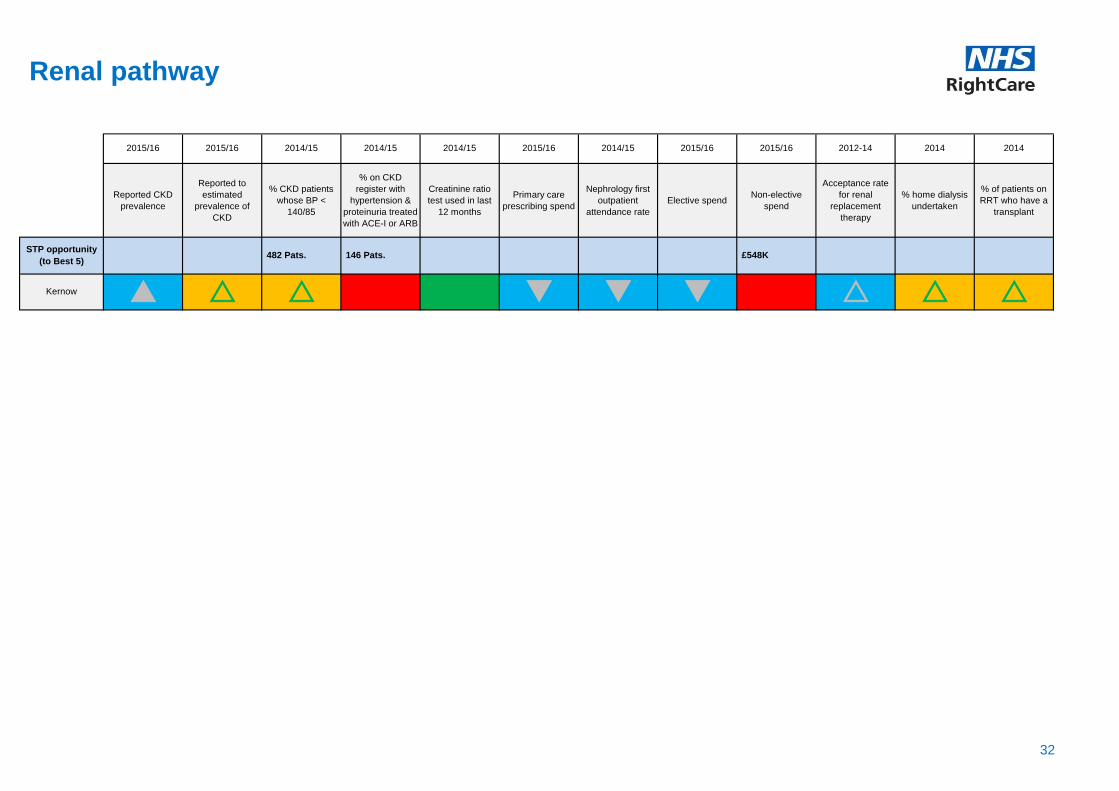
Reported CKD
prevalence
Reported to
estimated
prevalence of
CKD
% CKD patients
whose BP <
140/85
% on CKD
register with
hypertension &
proteinuria treated
with ACE-I or ARB
Creatinine ratio
test used in last
12 months
Primary care
prescribing spend
Nephrology first
outpatient
attendance rate
Elective spendNon-elective
spend
Acceptance rate
for renal
replacement
therapy
% home dialysis
undertaken
% of patients on
RRT who have a
transplant
r qKernow p r
2014 20142015/16 2014/15 2014/15 2014/15 2015/16 2014/15
r r rq q
£548K
2015/16 2015/16 2015/16 2012-14
STP opportunity
(to Best 5) 482 Pats. 146 Pats.
Renal pathway
32

COPD PrevalenceReported to estimated
prevalence of COPD
Smoking prevalence,
18+
% COPD patients
diagnosis confirmed by
spirometry
% of COPD patients with
a record of FEV1
% of COPD patients with
review (12 months)
Primary care prescribing
spendNon-elective spend
<75 mortality from
bronchitis, emphysema
and COPD
sp qKernow p
STP opportunity
(to Best 5)2,666 Ppl. 124 Pats. 87 Pats. 11 Lives
2015/16 2015/16 2012-142015/16 2015/16 2015/16 2015/16 2015/16 2015/16
COPD pathway
33
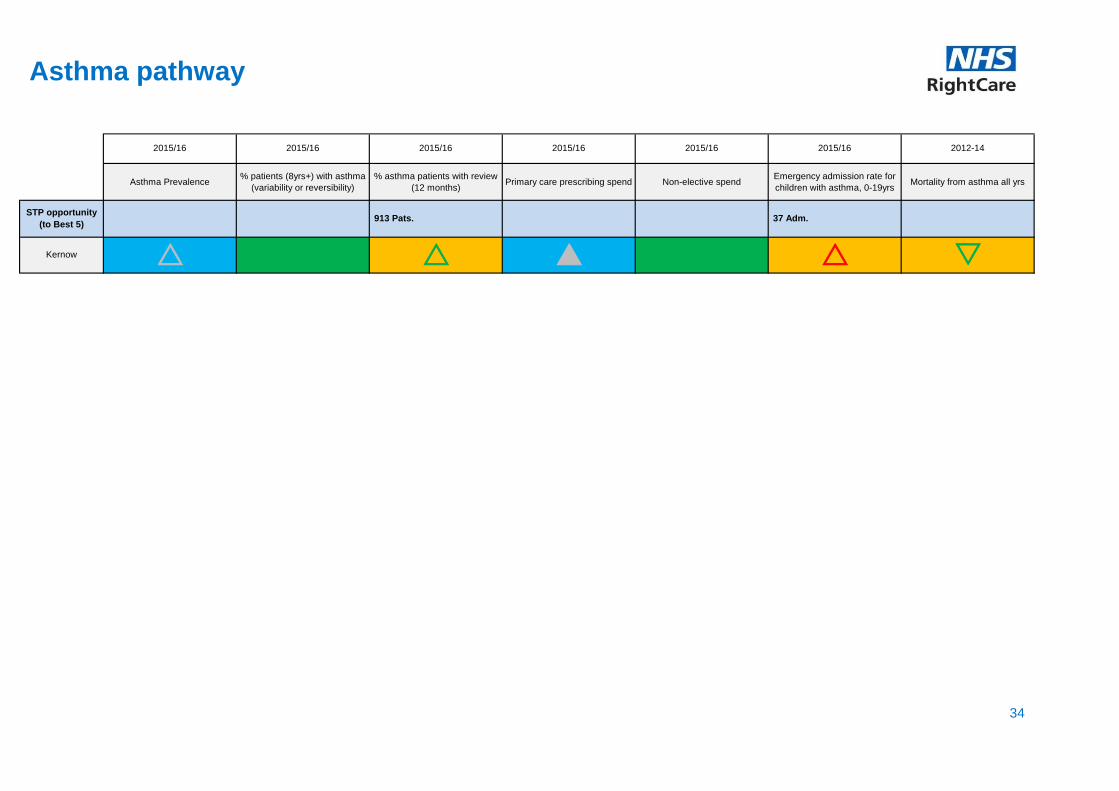
Asthma Prevalence% patients (8yrs+) with asthma
(variability or reversibility)
% asthma patients with review
(12 months)Primary care prescribing spend Non-elective spend
Emergency admission rate for
children with asthma, 0-19yrsMortality from asthma all yrs
r sKernow r
2015/16
r p
STP opportunity
(to Best 5) 913 Pats. 37 Adm.
2015/16 2015/16 2015/16 2015/16 2015/16 2012-14
Asthma pathway
34

Smoking
prevalence,
18+
Obesity
prevalence,
16+
Reported
Clostridium
difficile cases
Rate of
hemorrhoid
surgery
% hemorrhoid
surgeries
which are day
cases
Rate of
colonoscopies
% 6+ week
waits for a
colonoscopy
Primary care
prescribing
spend
Elective spendNon-elective
spend
Rate of
emergency
colonoscopies
Diverticular
disease -
Emergency
admissions
Gastroenteritis
emergency
admissions (0-
4)
Gastroenteritis
emergency
admissions
(5+)
<75 mortality
from
gastrointestina
l disease
2015/162013/14-
2015/16
p r sq q rKernow p q
2015/16 2015/16 2012-142015/16 2015/16 2015/16
2015/16
(Snapshots for 4
months)
2015/16 2015/162015/16 2015/162013/14-
2015/162015/16
100 Adm. STP opportunity
(to Best 5)25 Cases 29 Cases
Lower gastro-intestinal pathway
35
Note: Colonoscopies are one of 15 key diagnostic tests which the NHS Constitution states less than 1% of patients should wait more than 6 weeks for. CCGs which achieve good performance compared to their peers may still be missing this target. CCGs are therefore advised to examine their waiting list times in greater detail, which are available at: https://www.england.nhs.uk/statistics/statistical-work-areas/diagnostics-waiting-times-and-activity/monthly-diagnostics-waiting-times-and-activity/

Smoking
prevalence,
18+
Obesity
prevalence,
16+
Alcohol specific
hospital
admissions
Rate of bariatric
surgery
Rate of
gastroscopies
Rate of
gastroscopies
(<40)
% 6+ week waits
for a gastroscopy
Primary care
prescribing
spend
Elective
spend
Non-elective
spend
Rate of
emergency
gastroscopies
Upper GI
bleeds -
Emergency
admissions
Peptic
ulcerations -
Emergency
admissions
<75 mortality
from
gastrointestinal
disease
p r r sp q q p qKernow p
2015/16 2015/16 2012-142015
(Provisional)2015/16 2015/16 2015/16
2015/16
(Snapshots for 4
months)
2015/162015/16 2015/16 2015/16 2015/162015/16
STP opportunity
(to Best 5)419 Adm. £589K 133 Pats. 35 Adm. 33 Adm.
Upper gastro-intestinal pathway
36
Note: Gastroscopies are one of 15 key diagnostic tests which the NHS Constitution states less than 1% of patients should wait more than 6 weeks for. CCGs which achieve good performance compared to their peers may still be missing this target. CCGs are therefore advised to examine their waiting list times in greater detail, which are available at: https://www.england.nhs.uk/statistics/statistical-work-areas/diagnostics-waiting-times-and-activity/monthly-diagnostics-waiting-times-and-activity/
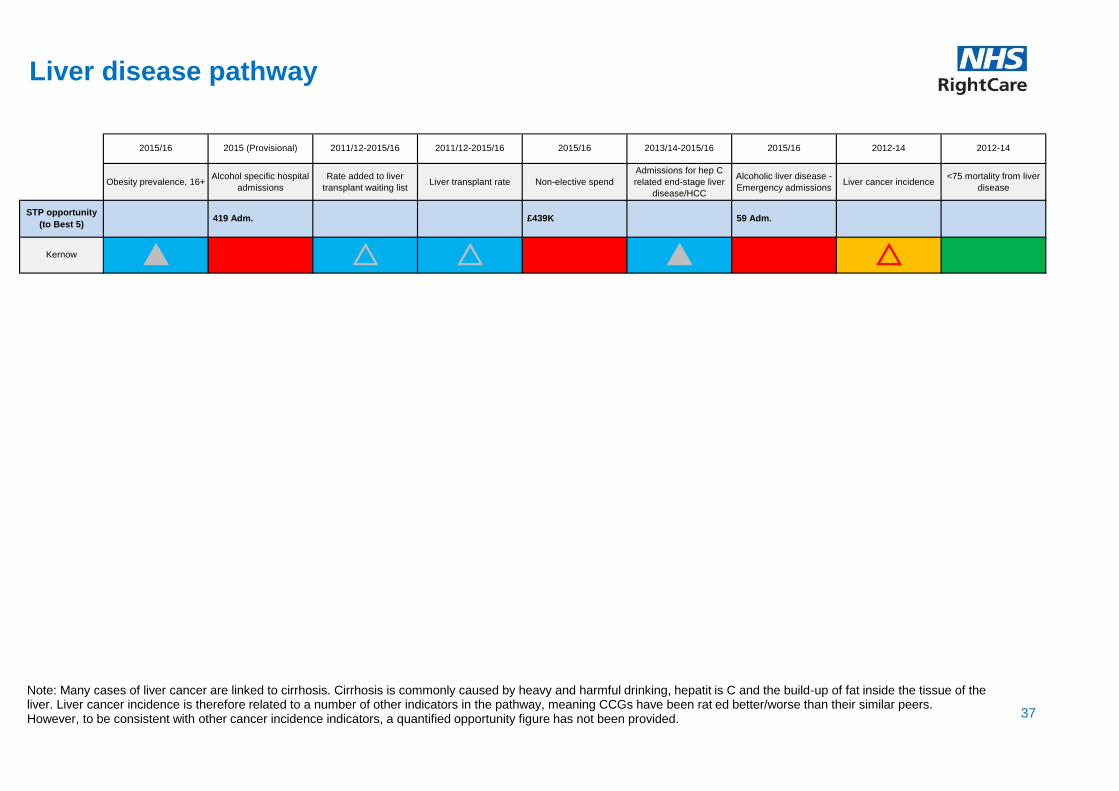
Obesity prevalence, 16+Alcohol specific hospital
admissions
Rate added to liver
transplant waiting listLiver transplant rate Non-elective spend
Admissions for hep C
related end-stage liver
disease/HCC
Alcoholic liver disease -
Emergency admissionsLiver cancer incidence
<75 mortality from liver
disease
r r p rKernow p
STP opportunity
(to Best 5)419 Adm. £439K 59 Adm.
2015/16 2012-14 2012-142015 (Provisional) 2011/12-2015/16 2011/12-2015/16 2015/16 2013/14-2015/16 2015/16
Liver disease pathway
37
Note: Many cases of liver cancer are linked to cirrhosis. Cirrhosis is commonly caused by heavy and harmful drinking, hepatit is C and the build-up of fat inside the tissue of the liver. Liver cancer incidence is therefore related to a number of other indicators in the pathway, meaning CCGs have been rat ed better/worse than their similar peers. However, to be consistent with other cancer incidence indicators, a quantified opportunity figure has not been provided.
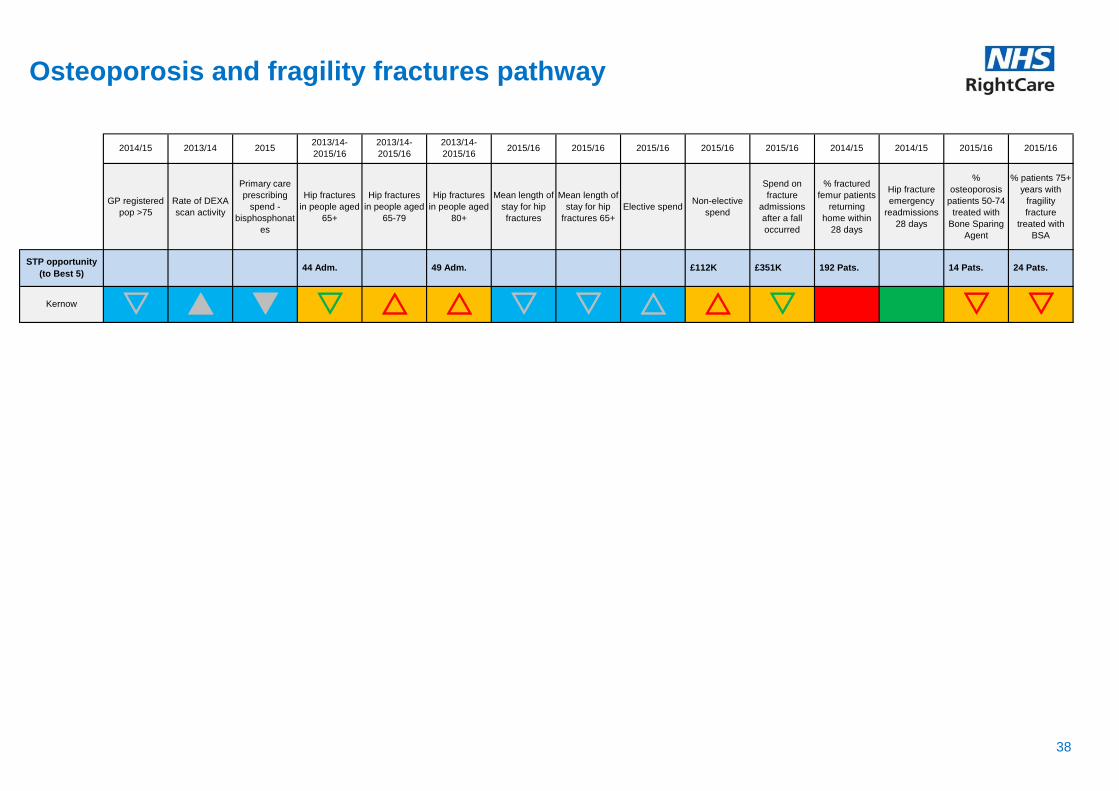
GP registered
pop >75
Rate of DEXA
scan activity
Primary care
prescribing
spend -
bisphosphonat
es
Hip fractures
in people aged
65+
Hip fractures
in people aged
65-79
Hip fractures
in people aged
80+
Mean length of
stay for hip
fractures
Mean length of
stay for hip
fractures 65+
Elective spendNon-elective
spend
Spend on
fracture
admissions
after a fall
occurred
% fractured
femur patients
returning
home within
28 days
Hip fracture
emergency
readmissions
28 days
%
osteoporosis
patients 50-74
treated with
Bone Sparing
Agent
% patients 75+
years with
fragility
fracture
treated with
BSA
2013/14 2015
p q s s sr r s s r rKernow s s
2014/15 2015/16 2015/162013/14-
2015/16
2013/14-
2015/16
2013/14-
2015/162015/16 2015/16 2015/162014/15 2015/16 2015/16 2014/15
£112K £351K 192 Pats. 14 Pats. 24 Pats.STP opportunity
(to Best 5)44 Adm. 49 Adm.
Osteoporosis and fragility fractures pathway
38

% people (over
45) who have
hip
osteoarthritis
(total)
% people (over
45) who have
knee
osteoarthritis
(total)
% people (over
45) who have
hip
osteoarthritis
(severe)
% people (over
45) who have
knee
osteoarthritis
(severe)
Rate of hip
replacements
Rate of knee
replacements
Primary care
prescribing
spend
Pre-treatment
EQ-5D Index
(hips)
Pre-treatment
EQ-5D Index
(knees)
Elective spendNon-elective
spend
EQ-5D Index
health gain
(hips)
EQ-5D Index
health gain
(knees)
Hip
replacement
emergency
readmissions
28 days
r p sr p s p p pKernow r r
2014/15 2014/15 2009/10 - 11/122012/13 2012/13 2015/16 2015/16 2015/16 2014/152012/13 2014/15 2015/16 2015/162012/13
STP opportunity
(to Best 5)£145K 256 QALYs 95 QALYs
Osteoarthritis pathway
39

Injuries due to
falls in people
aged 65+
Unintentional and
deliberate injury
admissions, 0-
24yrs
All fracture
admissions in
people aged 65+
Hip fractures in
people aged 65+
Hip fractures in
people aged 65-
79
Hip fractures in
people aged 80+
Primary care
prescribing spendElective spend
Non-elective
spend
% fractured femur
patients returning
home within 28
days
Hip fracture
emergency
readmissions 28
days
Mortality from
accidents all yrs
s r rKernow
2014/15 2012-142012/13 2015/16 2013/14-2015/16 2013/14-2015/16 2013/14-2015/16 2015/16
p p
£2422K 192 Pats. 29 Lives
2015/16 2015/16 2015/16 2014/15
STP opportunity
(to Best 5)100 Adm. 430 Adm. 683 Ppl. 44 Adm. 49 Adm.
Trauma and injury pathway
40
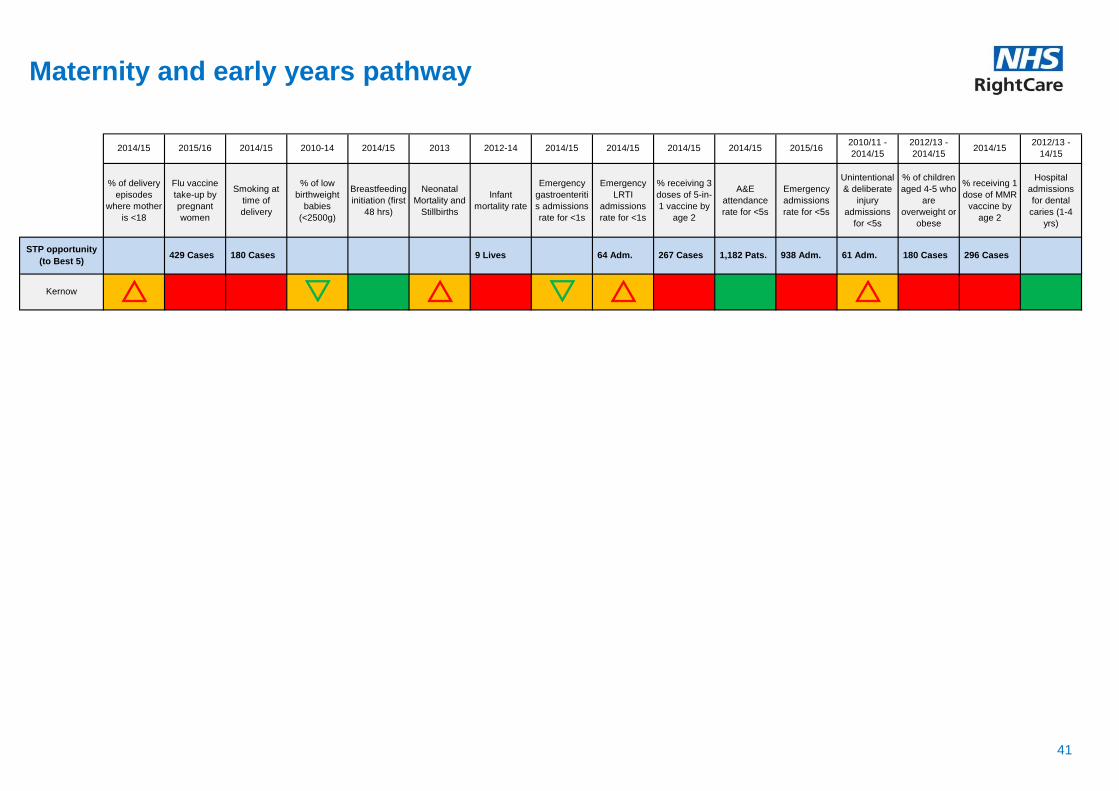
% of delivery
episodes
where mother
is <18
Flu vaccine
take-up by
pregnant
women
Smoking at
time of
delivery
% of low
birthweight
babies
(<2500g)
Breastfeeding
initiation (first
48 hrs)
Neonatal
Mortality and
Stillbirths
Infant
mortality rate
Emergency
gastroenteriti
s admissions
rate for <1s
Emergency
LRTI
admissions
rate for <1s
% receiving 3
doses of 5-in-
1 vaccine by
age 2
A&E
attendance
rate for <5s
Emergency
admissions
rate for <5s
Unintentional
& deliberate
injury
admissions
for <5s
% of children
aged 4-5 who
are
overweight or
obese
% receiving 1
dose of MMR
vaccine by
age 2
Hospital
admissions
for dental
caries (1-4
yrs)
s rr s rKernow r
2012/13 -
2014/152014/15
2012/13 -
14/152014/15 2013 2012-14 2014/15 2014/15 2014/152014/15 2014/15 2015/16
2010/11 -
2014/152015/16 2014/15 2010-14
64 Adm. 267 Cases 1,182 Pats. 938 Adm. 61 Adm. 180 Cases 296 Cases STP opportunity
(to Best 5) 429 Cases 180 Cases 9 Lives
Maternity and early years pathway
41
Next steps and actions
STP areas can take the following steps now:
• Identify the priority programmes in your locality and compare against current improvement activity and plans
• Look at the focus packs on the NHS RightCare website for those areas which are a priority for your locality
• Engage with clinicians and other local stakeholders, including public health teams in local authorities and commissioning support organisations and explore the priority opportunities further using local data
• Refer to the pages on coordinated re-allocation of capacity and discuss the wider opportunities highlighted in this pack as part of the STP planning process and consider STP wide action
• Revisit the NHS RightCare website regularly as new content, including updates to tools to support the use of the Commissioning for Value packs, is regularly added
• Discuss next steps with your local NHS RightCare Delivery Partner. If you don’t know who your Delivery Partner is, please email [email protected]
42

42
43
Further support and information
The Commissioning for Value benchmarking tool, explorer tool, full details of all the data used,
and links to other useful tools are available on the NHS RightCare website. Links are shown on
the next page.
The NHS RightCare website also offers resources to support local health economies in adopting
the Commissioning for Value approach. These include:
• Focus packs for the highest spending programmes covered in this pack
• Online videos and ‘how to’ guides
• Case studies with learning from other CCGs
If you have any questions or require any further information or support you can email the
Commissioning for Value support team direct at: [email protected]
Useful links
NHS RightCare website: https://www.england.nhs.uk/rightcare
Commissioning for Value packs and products: https://www.england.nhs.uk/rightcare/intel/cfv/
NHS RightCare casebooks: https://www.england.nhs.uk/rightcare/resources/
Five Year Forward View: https://www.england.nhs.uk/wp-content/uploads/2014/10/5yfv-web.pdf
NHS shared planning guidance for 2017/18 - 2018/19: https://www.england.nhs.uk/ourwork/futurenhs/deliver-forward-view/
44

How have the potential opportunities been calculated?
45
The potential opportunity at CCG level highlights the scale of change that would be
achieved if the CCG value moved to the benchmark value of the average of the ‘Best 5’ or
‘Lowest 5’ CCGs in its group of similar 10 CCGs.
Generally, where a high CCG value is considered ‘worse’ then it is calculated using the
formula:
Potential Opportunity = (CCG Value – Benchmark Value) * Denominator
The denominator is the most suitable population data for that indicator eg CCG registered
population, CCG weighted population, CCG patients on disease register etc. The
denominator is also scaled to match the Value. So if the CCG Value and Benchmark Value
are given in “per 1,000 population” then the denominator is expressed in thousands, ie
12,000 becomes 12.
For an indicator, adding the statistically significant opportunities from the CCG packs gives
the opportunity for the STP presented in this pack.
The NHS RightCare programme
The NHS RightCare programme is about improving population-based healthcare, through
focusing on value and reducing unwarranted variation. It includes the Commissioning for Value
packs and tools, the NHS Atlas series, and the work of the Delivery Partners.
The approach has been tested and proven successful in recent years in a number of different
health economies. As a programme it focuses relentlessly on value, increasing quality and
releasing funds for reallocation to address future demand.
NHS England has committed significant funding to rolling out the RightCare approach. All
CCGs are now working with an NHS RightCare Delivery Partner. We have also aligned
Delivery Partners to STP footprints to better support the system.
For more information visit: https://www.england.nhs.uk/rightcare
46

47
NHS RightCare and Commissioning for Value
Commissioning for Value is a partnership between NHS RightCare and Public Health England. It provides
the first phase of the NHS RightCare approach - Where to Look. The approach begins with a review of
indicative data to highlight the top priorities or opportunities for transformation
and improvement.
Value opportunities
exist where a health
economy is an outlier
and will most likely yield
the greatest
improvement to clinical
pathways and policies.
Phases two and three
then move on to
explore What to
Change and How to
Change.


