British Heart Foundation Statistics Database www.heartstats.org Coronary heart disease statistics 2007 edition Steven Allender, Viv Peto, Peter Scarborough, Anna Boxer and Mike Rayner British Heart Foundation Health Promotion Research Group Department of Public Health, University of Oxford
Transcript
British HeartFoundation
Statistics Databasewww.heartstats.org
�
Coronaryheart disease statistics
2007 edition
Steven Allender, Viv Peto, Peter Scarborough, Anna Boxer and Mike Rayner
British Heart Foundation Health Promotion Research Group
Department of Public Health, University of Oxford
British HeartFoundation
Statistics Databasewww.heartstats.org
�
Contents Page
Foreword �0Introduction ���. Mortality ��
Table 1.1 CVD mortality targets for the United Kingdom 16Figure 1.1a Death rates from CHD, stroke and all other diseases of the
circulatory system, people aged under 75, 1969 to 2005, England, with “Our Healthier Nation” milestone and target 17
Figure 1.1b Absolute gap in death rates from CHD, stroke and all other diseases of the circulatory system, between the fifth most deprived areas and the population as a whole, people aged under 75, 1993 to 2005, England, with inequalities target 17
Figure 1.1c Death rates from CHD for people aged under 65, 1969 to 2005, England 18
Figure 1.1d Death rates from CHD, for people aged 65 to 74, 1969 to 2005, England 18
Figure 1.1e Death rates from stroke for people aged under 65, 1969 to 2005, England 19
Figure 1.1f Death rates from stroke for people aged 65 to 74, 1969 to 2005, England 19
Table 1.2 Deaths by cause, sex and age, 2005, United Kingdom 20Table 1.3 All deaths and deaths under 75 by cause and sex, 2005,
England, Wales, Scotland, Northern Ireland and United Kingdom 21Figure 1.3a Deaths by cause, men, 2005, United Kingdom 22Figure 1.3b Deaths by cause, women, 2005, United Kingdom 22Figure 1.3c Deaths by cause, men under 75, 2005, United Kingdom 23Figure 1.3d Deaths by cause, women under 75, 2005, United Kingdom 23Table 1.4 Age-specific death rates per 100,000 population from CHD
by sex, 1968 to 2005, United Kingdom 24Figure 1.4a Age-specific death rates from CHD, men, 1968 to 2005,
United Kingdom, plotted as a percentage of the rate in 1968 25Figure 1.4b Age-specific death rates from CHD, women, 1968 to 2005, United
Kingdom, plotted as a percentage of the rate in 1968 25Table 1.5 Age-standardised death rates per 100,000 population from CHD,
1968 to 2002, selected countries, the World 26Figure 1.5a Death rates from CHD, men and women aged 35 to 74, 2000,
selected countries 28Figure 1.5b Changes in death rates from CHD, men and women aged 35 to 74,
between 1990 and 2000, selected countries 28Table 1.6 Age-standardised death rates from CHD per 100,000 population by
country and Standard Region, 1978 to 1996, and by country and Government Office Region, 1997 to 2005, United Kingdom 29
Table 1.7 Numbers of deaths and age-standardised death rates from CHD for men and women under 65 by local authority, 2003/05, United Kingdom 30
Key to local authorities 33Figure 1.7a Age-standardised death rates per 100,000 population from CHD for
men under 65 by local authority, 2003/05, United Kingdom 34Figure 1.7b Age-standardised death rates per 100,000 population from CHD for
women under 65 by local authority, 2003/05, United Kingdom 35Table 1.8 Age-standardised death rates from CHD and stroke by sex and social
class, 1976/81 to 1997/99, England and Wales 36
British HeartFoundation
Statistics Databasewww.heartstats.org
�
Figure 1.8 Death rates from CHD by social class, men and women aged 35 to 64, 1976/81 to 1997/99, England and Wales 36
Table 1.9 Age-standardised death rates for circulatory diseases by deprivation twentieth, sex and age, 1993 to 2003, England and Wales 37
Figure 1.9 Age-standardised death rates for CHD and stroke, adults aged 15 to 64, 1993 to 2003, England and Wales 37
Table 1.10 Deaths and standardised mortality ratios for CHD and stroke by sex and country of birth, 1989/92, England and Wales 38
Figure 1.10a Standardised mortality ratios for CHD by sex and country of birth, 1989/92, England and Wales 39
Figure 1.10b Standardised mortality ratios for stroke by sex and country of birth, 1989/92, England and Wales 39
Table 1.11 Deaths from CHD by sex, age and month, 2004/05, England and Wales 40
Figure 1.11 Deaths from CHD by sex and month, 2004/05, England and Wales 41Table 1.12 Excess winter deaths from CHD by sex, age and Government Office
Region, 2004/05, England and Wales 42
�. Morbidity 4�Table 2.1 Incidence of myocardial infarction, adults, latest available year,
UK studies compared 47Table 2.2 Coronary event rates, coronary case fatality, annual change in
coronary event rates and annual change in coronary case fatality, adults aged 35 to 64, by sex, latest available data, MONICA Project populations 48
Figure 2.2a Age-standardised coronary event rates, men aged 35 to 64, latest data, MONICA Project populations 49
Figure 2.2b Age-standardised coronary event rates, women aged 35 to 64, latest data, MONICA Project populations 49
Table 2.3 Incidence of angina, adults, latest available year, UK studies compared 50
Table 2.4 Incidence of heart failure by sex and age, 1995/96, Hillingdon, England 51
Figure 2.4 Incidence of heart failure by sex and age, 1995/96, Hillingdon, England 51
Table 2.5 Prevalence of myocardial infarction, adults aged between 55 and 74, latest available year, UK studies compared 52
Table 2.6 Percentage who have experienced cardiovascular conditions (ever and recently) by sex and age, 2003, England 53
Table 2.7 Prevalence of angina, adults aged between 55 and 74, latest available year, UK studies compared 54
Table 2.8 Prevalence of heart failure, adults aged between 45 and 84, latest available year, UK studies compared 55
Table 2.9 Prevalence of definite heart failure by sex and age, 1995/99, West Midlands, England 56
Table 2.10 Percentage reporting longstanding illness by sex, age and condition, 2005, Great Britain 57
Figure 2.10 Percentage reporting longstanding illness by sex and condition, 2005, Great Britain 58
Table 2.11 Prevalence of disease 2004/05, England, Scotland and Wales 59Figure 2.11 Prevalence of disease 2004/05, England, Scotland and Wales 60Table 2.12 Prevalence of cardiovascular conditions by sex and ethnic group,
2004, England 61Table 2.13 Prevalence of CHD, stroke and CHD or stroke by sex and age,
1994, 1998 and 2003, England 62Figure 2.13 Changes in prevalence rates in CHD, stroke and CHD or stroke by
sex between 1994 and 2003, England 62Table 2.14 Rates per 1,000 population reporting longstanding diseases of the
circulatory system by sex and age, 1988 to 2005, Great Britain 63
British HeartFoundation
Statistics Databasewww.heartstats.org
4
Figure 2.14 Rate of reporting longstanding cardiovascular disease by age, 1988 to 2005, Great Britain 64
�. Treatment 65Table 3.1 National Service Framework (NSF) for Coronary Heart Disease:
Standards and Quality requirements table, England 69Table 3.2 Prescriptions used in the prevention and treatment of all diseases
of the circulatory system, 1981 to 2005, England 71Figure 3.2 Prescriptions used in the prevention and treatment of diseases of the
circulatory system, selected BNF paragraphs, 1981 to 2005, England 72Table 3.3 Operations for CHD, 1977 to 2003, United Kingdom 72Table 3.4 Percutaneous coronary interventions, 1991 to 2005,
United Kingdom 73Figure 3.4 Number of coronary artery bypass operations and percutaneous
coronary interventions per year, 1980 to 2005, United Kingdom 73Table 3.5 Inpatient cases by main diagnosis and sex, National Health Service
hospitals, 2005/06, England 74Figure 3.5a Inpatient cases by main diagnosis, men, National Health Service
hospitals, 2005/06, England 75Figure 3.5b Inpatient cases by main diagnosis, women, National Health Service
hospitals, 2005/06, England 75Table 3.6 Rates of various procedures for treating CVD, per million population,
around 2000, Europe 76Figure 3.6a Rates of coronary artery bypass surgery, crude and adjusted for
standardised mortality rates from CHD in adults aged 35 to 74, around 2000, Europe 77
Figure 3.6b Rates of percutaneous coronary interventions, crude and adjusted for standardised mortality rates from CHD in adults aged 35 to 74, around 2000, Europe 77
Table 3.7 Rates of percutaneous coronary interventions, per million population, 1990 to 2003, Europe 78
Figure 3.7 Rates of percutaneous coronary interventions, per million population, 1990 to 2003, Europe 79
Table 3.8 Outcome at 4 weeks and use of free Nicotine Replacement Therapy in people using National Health Service smoking cessation services, 1999/00 to 2005/06, England and Northern Ireland 80
Table 3.9 Emergency calls: responses within 8 minutes by Ambulance Service, 1999/00 to 2005/06, England 81
Table 3.10 Thrombolytic treatment, use of aspirins, beta blockers, and statins after a heart attack, 2004/05 and 2005/06, England and Wales 82
Table 3.11 Percentage of patients receiving cardiac rehabilitation after hospitalisation for heart attack, coronary artery bypass surgery or percutaneous coronary interventions by Government Office Region, 2003/04, England 82
4. Smoking 8�Table 4.1 Smoking targets for the United Kingdom 87Figure 4.1a Cigarette smoking by sex, adults aged 16 and over, 1972 to 2005,
England, with “Smoking Kills” national targets 88Figure 4.1b Cigarette smoking by sex, children aged 11 to 15, 1982 to 2004,
England, with “Smoking Kills” national targets 88Table 4.2 Smoking-attributed deaths by cause, sex and age, 1995 and 2000,
England and Wales, and Scotland 89Table 4.3 Cigarette smoking by sex and age, 1972 to 2005, Great Britain 90Figure 4.3a Prevalence of cigarette smoking by sex and age, 2005, Great Britain 91Figure 4.3b Prevalence of cigarette smoking by sex, 1972 to 2005, Great Britain 91Table 4.4 Regular cigarette smoking by sex, in young people aged 11 to 15,
1982 to 2006, England, Scotland, Wales and Northern Ireland 92Table 4.5 Average daily cigarette consumption per smoker by sex and age,
1974 to 2005, Great Britain 93
British HeartFoundation
Statistics Databasewww.heartstats.org
5
Table 4.6 Cigarette smoking by sex and country of United Kingdom, 1976 to 2005, and by Government Office Region, 1998 to 2005, United Kingdom 94
Figure 4.6a Percentage of men smoking by region, 2003/05, United Kingdom 95Figure 4.6b Percentage of women smoking by region, 2003/05, United Kingdom 95Table 4.7 Cigarette smoking by sex and social class, 1992 to 2005, England 96Figure 4.7 Cigarette smoking, by sex and social class, 1992 to 2005, England 96Table 4.8 Cigarette smoking by sex and socio-economic classification, 2005,
Great Britain 97Figure 4.8 Cigarette smoking by sex and socio-economic classification, 2005,
Great Britain 97Table 4.9 Cigarette smoking by sex and ethnic group, 2004, England 98Figure 4.9 Cigarette smoking by sex and ethnic group, 2004, England 98Table 4.10 Prevalence of smoking, latest available data, 1995 to 2004,
all available countries, the World 99Figure 4.10a Prevalence of smoking, men, latest available data, 1995 to 2004,
the World 101Figure 4.10b Prevalence of smoking, women, latest available data, 1995 to 2004,
the World 102Table 4.11 Percentage regular daily smokers by country, adults aged 15 and
over, 1995 to 2005, selected European countries 103Figure 4.11 Percentage regular daily smokers by country, adults aged 15 and over,
latest year between 1997 and 2005, selected European countries 104
5. Diet �05Table 5.1 Selected dietary targets for the United Kingdom 109Table 5.2 Consumption of total fat, saturated fat, salt, sugar, fibre and
fruit and vegetables, adults aged 16 and over, 1975 to 2004/05, Great Britain 110
Figure 5.2a Consumption of total fat, saturated fat and NME sugars, adults aged 16 and over, 1975 to 2004/05, Great Britain, with “Choosing a Better Diet” targets 111
Figure 5.2b Consumption of fruit and vegetables, adults aged 16 and over, 1975 to 2004/05, Great Britain, with 5-a-day benchmark 111
Table 5.3 Food energy from fat and saturated fat, consumption of fruit and vegetables, and salt consumption by sex and age, 2000/01, Great Britain 112
Figure 5.3 Percentage of adults failing to meet daily recommended consumption targets for fruit and vegetables, and salt by sex and age, 2000/01, Great Britain 112
Table 5.4 Consumption of selected foods, adults aged 16 and over, 1942 to 2004/05, United Kingdom 113
Figure 5.4a Consumption of fats, adults aged 16 and over, 1942 to 2004/05, United Kingdom 114
Figure 5.4b Consumption of milk and milk products, adults aged 16 and over, 1942 to 2004/05, United Kingdom 114
Figure 5.4c Consumption of fresh fruit and vegetables, adults aged 16 and over, 1942 to 2004/05, United Kingdom 115
Table 5.5 Consumption of selected nutrients, adults aged 16 to 64, 1986/87 and 2000/01, Great Britain 115
Table 5.6 Consumption of fruit and vegetables by sex and age, children aged 5 to 15, 2001 to 2005, England 116
Table 5.7 Consumption of energy, fat, saturated fat, sugar, sodium and fibre from school meals in primary and secondary schools, by sex, children aged 4 to 18 years, 2003 and 2005, England 117
Table 5.8 Consumption of energy, fat, saturated fat, sugar, salt, fibre, and fruit and vegetables, by country of the United Kingdom, and by Government Office Region in England, 2002 to 2005, United Kingdom 118
Table 5.9 Consumption of energy, fat, saturated fat, sugar, salt, fibre and
British HeartFoundation
Statistics Databasewww.heartstats.org
6
fruit and vegetables, by social class, 2002 to 2005, United Kingdom 119Table 5.10 Consumption of energy, fat, saturated fat, sugar, salt, fibre and fruit
and vegetables, by income quintile, 2002 to 2005, United Kingdom 120Table 5.11 Consumption of energy, fat, saturated fat, sugar, salt, fibre and fruit
and vegetables, by ethnic group, 2002 to 2005, United Kingdom 120Table 5.12 Total energy available from fat and availability of fruit and
vegetables by country, 2003, selected European countries 121Figure 5.12a Percentage of total energy available from fat by country, 2003,
selected European countries 122Figure 5.12b Availability of fruit and vegetables, 2003, selected European
countries, with WHO target 123
6. Physical Activity ��4Table 6.1 Physical activity targets for the United Kingdom 127Figure 6.1 Physical activity levels, 1995, 1998 and 2003, Scotland, with
“Towards a healthier Scotland” national targets 128Table 6.2 Physical activity level by sex and age, England and Scotland 2003,
Wales 2004/05 and Northern Ireland, 2001 129Figure 6.2a Proportion meeting physical activity guideline by age and
country, men, latest available year 130Figure 6.2b Proportion meeting physical activity guideline by age and country,
women, latest available year 130Table 6.3 Proportion meeting the physical activity guideline by sex and age,
1997, 1998, 2003, and 2004, England 131Table 6.4 Physical activity level among children aged 2 to 15 by sex and age,
2002, England 131Table 6.5 Physical activity levels (observed and age-standardised), by
Government Office Region and sex, adults aged 16 and over, 2003, England 132
Table 6.6 Physical activity level by sex and socio-economic classification, adults aged 16 and over, 2003, England 132
Table 6.7 Physical activity level by sex and income, adults aged 16 and over, 2003, England 133
Table 6.8 Physical activity by sex and ethnic group, 2004, England 134Figure 6.8 Percentage of adults meeting physical activity guidelines by sex and
ethnic group, 2004, England 134Table 6.9 Self-reported physical activity levels, 2005, selected European
countries 135Figure 6.9 Percentage of adults who do no moderate-intensity physical activity
in a typical week, 2005, selected European countries 135
7. Alcohol ��7Table 7.1 Alcohol targets and recommendations for the United Kingdom 140Table 7.2 Alcohol consumption by sex and age, 2005, Great Britain 141Figure 7.2 Percentage exceeding daily benchmarks for alcohol consumption
by sex and age, 2005, Great Britain 142Table 7.3 Percentage of adults consuming more alcohol than the recommended
daily maximum by sex and age, 1998 to 2005, Great Britain 143Figure 7.3 Percentage consuming more alcohol than the recommended daily
maximum, adults aged 16 and over, 1998 to 2005, Great Britain 144Table 7.4 Weekly alcohol consumption by sex and age, 1992 to 2005,
Great Britain 145Table 7.5 Usual frequency of drinking alcohol by sex, children aged 11 to 15,
1988 to 2005, England 145Table 7.6 Alcohol consumption by sex, country of Great Britain and
Government Office Region in England, adults aged 16 and over, 2005, Great Britain 146
Figure 7.6a Percentage of men consuming more alcohol than the recommended daily maximum (four units) by region, 2005, Great Britain 147
British HeartFoundation
Statistics Databasewww.heartstats.org
7
Figure 7.6b Percentage of women consuming more alcohol than the recommended daily maximum (three units) by region, 2005, Great Britain 147
Figure 7.6c Percentage of men exceeding daily benchmark for heavy drinking (eight units) by region, 2005, Great Britain 148
Figure 7.6d Percentage of women exceeding daily benchmark for heavy drinking (six units) by region, 2005, Great Britain 148
Table 7.7 Alcohol consumption by sex and socio-economic classification, adults aged 16 and over, 2005, Great Britain 149
Table 7.8 Alcohol consumption by sex and ethnic group, adults aged 16 and over, 2004, England 150
Figure 7.8a Alcohol consumption by ethnic group, men aged 16 and over, 2004, England 151
Figure 7.8b Alcohol consumption by ethnic group, women aged 16 and over, 2004, England 151
Table 7.9 Alcohol consumption by country, adults aged 15 and over, 2003, Europe 152
Figure 7.9 Alcohol consumption by country, adults aged 15 and over, 2003, Europe 153
8. Psychosocial well-being �54Table 8.1 GHQ12 score by sex and age, adults aged 16 and over, 2003,
England and Scotland 156Figure 8.1a High GHQ12 score (4+) by sex and age, 2003, England 157Figure 8.1b High GHQ12 score (4+) by sex and age, 2003, Scotland 157Table 8.2 GHQ12 score by sex and household income, adults aged 16 and
over, 2003, England and Scotland 158Table 8.3 GHQ12 score by sex and Government Office Region, adults aged
16 and over, 2003, England 158Table 8.4 Prevalence of high GHQ12 score (4+) by sex and ethnic group,
adults aged 16 and over, 2004, England 159Table 8.5 Perceived social support by sex and age, adults aged 16 and over,
2003, England 159Table 8.6 Perceived social support by sex and socio-economic classification,
adults aged 16 and over, 2003, England 160Figure 8.6 Percentage perceiving severe lack of social support by sex and socio-
economic classification, adults aged 16 and over, 2003, England 160Table 8.7 Perceived social support by sex and household income, adults aged
16 and over, 2003, England 161Table 8.8 Percentage perceiving severe lack of social support by sex and
ethnic group, adults aged 16 and over, 2004, England 161Figure 8.8 Percentage perceiving severe lack of social support by sex and
ethnic group, adults aged 16 and over, 2004, England 162Table 8.9 Amount of control over work, amount of variety in work and
pace of work among adults in paid employment, by sex and age, adults aged 16 and over, l994, England 162
Table 8.10 Percentage of adults in paid employment with low control over work, high pace of work and low variety of work, by sex and social class, adults aged 16 and over, 1994, England 163
Figure 8.10 Percentage of employed adults with low control at work, by sex and social class, 1994, England 163
for the United Kingdom 167Table 9.2 Systolic and diastolic blood pressure by sex and age, adults
aged 16 and over, 1993 to 2005, England 168Figure 9.2 Mean systolic blood pressure, by sex, adults aged 16 and over.
1993 to 2005, England 169Table 9.3 Blood pressure levels by sex and age, adults aged 16 and over,
2005, England 170
British HeartFoundation
Statistics Databasewww.heartstats.org
8
Figure 9.3 Prevalence of high blood pressure by sex and age, adults aged 16 and over, 2005, England 170
Table 9.4 Prevalence of high blood pressure by sex and age, 1998 to 2005, England 171
Table 9.5 Blood pressure levels by sex and age, adults aged 16 and over, 2003, Scotland 172
Table 9.6 Blood pressure levels by sex and socio-economic classification, 2003, England 173
Table 9.7 Prevalence of high blood pressure by sex and ethnic group, adults aged 16 and over, 2004, England 173
Table 9.8 Mean systolic blood pressure estimates and projections for 2002, 2005 and 2010 by sex, adults aged 15 and over, all available countries, Europe 174
Figure 9.8a Mean systolic blood pressure estimates, men aged 15 and over, all available countries, 2002, Europe 175
Figure 9.8b Mean systolic blood pressure estimates, women aged 15 and over, all available countries, 2002, Europe 175
�0. Blood Cholesterol �76Table 10.1 Cholesterol recommendations for the United Kingdom 179Table 10.2 Total cholesterol levels by sex and age, 1994, 1998 and 2003,
England and 1995, 1998 and 2003, Scotland 180Figure 10.2 Percentage of adults with blood cholesterol levels of 5.0mmol/l
and above, 2003, England 181Table 10.3 Low HDL cholesterol by sex and age, 2003, England and Scotland 181Table 10.4 Total cholesterol levels and low HDL cholesterol levels by sex and
Government Office Region, adults aged 16 and over, 2003, England 182Table 10.5 Total cholesterol by sex and socio-economic classification, 2003,
England 182Table 10.6 Low HDL cholesterol by sex and equivalised household income,
2003, England 183Table 10.7 Total cholesterol and low HDL cholesterol by sex and ethnic group,
adults aged 16 and over, 2004, England 183Table 10.8 Blood cholesterol levels by sex, adults aged 35 to 64, latest available
data, MONICA Project populations 184Figure 10.8 Percentage of adults aged 35-64 with blood cholesterol
levels ≥7.8mmol/l, MONICA Project populations 184Table 10.9 Mean total cholesterol levels by sex, adults aged 15 and over,
2005, the World 185Figure 10.9a Mean total cholesterol levels, men aged 15 and over, 2005, Europe 186Figure 10.9b Mean total cholesterol levels, women aged 15 and over,
2005, Europe 187
��. Overweight and Obesity �88Table 11.1 Obesity targets for the United Kingdom 191Table 11.2 Body mass index by sex and age, 2004, England 192Figure 11.2 Prevalence of overweight and obesity by sex and age, 2004, England 192Table 11.3 Prevalence of a raised waist to hip ratio by sex and age, 2003,
England 193Table 11.4 Prevalence of overweight and obesity in children by sex and age,
2004, England 193Table 11.5 Prevalence of overweight and obesity by sex, adults aged 16 to 64,
1986/87 to 2004, England 194Figure 11.5 Prevalence of obesity by sex, adults aged 16 to 64, 1995 to 2004,
England 194Table 11.6 Prevalence of overweight and obesity in children by sex and age,
1995 to 2004, England 195Figure 11.6 Prevalence of obese children aged 2 to 15, 1995 to 2004, England 196Table 11.7 Prevalence of overweight and obesity by sex and age, adults
aged 16 and over, 2003 and 2010 (predicted), England 197
British HeartFoundation
Statistics Databasewww.heartstats.org
9
Figure 11.7 Prevalence of obesity by sex and age, adults aged 16 and over, 2003 and 2010 (predicted), England 197
Table 11.8 Prevalence of overweight and obese children aged 2 to 15 by sex and age, 2003 and 2010 (predicted), England 198
Figure 11.8 Prevalence of obesity by sex and age, children aged 2 to 15 years, 2003 and 2010 (predicted), England 198
Table 11.9 Prevalence of overweight and obesity by Government Office Region, by sex and age, 2003, England 199
Table 11.10 Prevalence of overweight and obesity by sex and socio-economic classification, 2003, England 200
Table 11.11 Prevalence of a raised waist to hip ratio by sex and socio-economic classification, 2003, England 200
Table 11.12 Prevalence of obesity by sex and ethnic group, 2004, England 201Figure 11.12 Prevalence of obesity by sex and ethnic group, 2004, England 201Table 11.13 Prevalence of a raised waist to hip ratio by sex and ethnic group,
2004, England 201Table 11.14 Prevalence estimates of overweight and obesity for 2002, and
projections for 2005 and 2010, by sex, adults aged 15 and over, the World 202
Figure 11.14a Prevalence of obesity, by sex, 2002, WHO European Region 204Figure 11.14b Prevalence of obesity, by sex, 2002, selected countries, the World 204Table 11.15 Prevalence of overweight and obese children by WHO Region and
country, by sex, latest available year, the World 205
��. Diabetes �06Table 12.1 Prevalence of diagnosed diabetes by sex and age, 2003, England 208Figure 12.1 Prevalence of diagnosed diabetes by sex and age, 2003, England 208Table 12.2 Prevalence of undiagnosed diabetes by sex and age, adults aged 35
and over, 2003, England 208Table 12.3 Prevalence of diagnosed diabetes by sex and age, 1991 to 2003,
England 209Figure 12.3 Prevalence of diagnosed diabetes in adults, 1991 to 2003, England 209Table 12.4 Age-standardised prevalence of diagnosed diabetes by sex and
Government Office Region, 2003, England 210Table 12.5 Age-standardised prevalence of diagnosed diabetes by sex and
socio-economic classification, 2003, England 211Table 12.6 Age-standardised prevalence of diagnosed diabetes by sex and
household income, 2003, England 211Table 12.7 Prevalence of diagnosed diabetes by sex and ethnic group, 2004,
England 212Figure 12.7 Prevalence of diagnosed diabetes by ethnic group, 2004, England 212Table 12.8 Estimated prevalence of diabetes and numbers of people with
diabetes, 2003 and 2025, selected countries, the World 213Figure 12.8 Prevalence of diabetes, 2003, the World 214
��. Economic costs ��6Table 13.1 Health care costs of CVD and CHD, 2003, United Kingdom 218Figure 13.1a Health care costs of CVD, 2003, United Kingdom 218Figure 13.1b Health care costs of CHD, 2003, United Kingdom 218Table 13.2 Total costs of CVD and CHD, 2003, United Kingdom 219Table 13.3 Healthcare costs of CVD-related diseases in the EU, by country,
2003 219Figure 13.3 Health care costs of CVD-related diseases as a proportion of
total health care expenditure in the EU, by country, 2003 220
British HeartFoundation
Statistics Databasewww.heartstats.org
�0
ForewordThe British Heart Foundation is proud to present the 2007 edition of Coronary heart disease
statistics.
Despite the gratifying, continued, downwards trend in deaths due to diseases of the heart and
circulation, cardiovascular disease remains the major cause of death and disability in the UK.
The economic impact of premature deaths and the ever rising cost of caring for the increasing
numbers of people surviving into old age with cardiovascular problems impose a huge burden
on our health and social services.
One of the most striking features of this year’s statistics is the marked difference in prevalence of
cardiovascular disease between and within communities. For example, men and women living
in the West of Scotland are nearly six times more likely to die prematurely from coronary heart
disease (CHD) than men and women living in the South West of England. There are striking
differences even within short distances, such as in London, where inhabitants of Tower Hamlets
have three times more risk of dying prematurely from CHD than their counterparts in Kensington
and Chelsea.
There are a number of reasons for these inequalities, many of which are implied by the statistics.
Social deprivation, smoking, poor diets and infrequent exercise are all reflected in the distribution
of disease. These are compounded by ethnic differences in prevalence of, and susceptibility to,
risk factors for cardiovascular disease such as hypertension, obesity and diabetes. It follows
therefore that the greatest gains in public cardiovascular health will be made by focussing on the
particular needs of the communities most at risk. This will require a diversity of approaches to
ensure the behavioural changes that have benefited the more affluent sectors of our society start
to have a similar effect on cardiovascular health in those most in need.
The BHF has recently adopted a new Prevention and Care strategy aimed at addressing the
inequalities that underlie today’s statistics. By working closely with communities that are at
greatest risk we aim to beat heart disease together.
Prof Peter Weissberg
Medical Director
British HeartFoundation
Statistics Databasewww.heartstats.org
��
IntroductionThis is the fifteenth edition of Coronary heart disease statistics produced by the British Heart
Foundation.
Coronary heart disease statistics is designed for health professionals, medical researchers and
anyone else with an interest in coronary heart disease (CHD). It aims to provide the most recent
statistics related to the incidence, causes and effects of the disease.
It is divided into 13 sections. The first two chapters on mortality and morbidity deal with
demographic trends in CHD and related diseases of the circulatory system. Following a section
on treatment on CHD there are chapters on the main modifiable risk factors for the disease:
smoking, an unhealthy diet, lack of physical activity, a high alcohol consumption, poor psychosocial
wellbeing, raised blood pressure, raised blood cholesterol, obesity and diabetes. The final chapter
provides information about the economic costs of CHD.
Each chapter contains a set of tables1 and figures to illustrate key points and a brief review of
the data presented. Where appropriate it contains tables showing the public health targets for
England, Wales, Scotland and Northern Ireland.
All data in Coronary heart disease statistic are also available on the British Heart Foundation’s
www.heartstats.org website. Further copies of this publication can be downloaded from the
website, as well as copies of recent supplements on diet, physical activity and obesity, congenital
heart disease, smoking and European cardiovascular disease.
The www.heartstats.org website aims to be the most comprehensive and up-to-date source of
statistics on cardiovascular disease in the UK. The website is updated on an ongoing basis, and
contains a wider range of tables and figures than available in the Coronary heart disease statistics
compendia and associated supplements.
�. Throughout the Coronary heart disease statistics, table column and/or row percentages may not add up to �00% because of rounding.
British HeartFoundation
Statistics Databasewww.heartstats.org
��
1. Mortality Total mortalityDiseases of the heart and circulatory system (cardiovascular disease or CVD) are the main cause
of death in the UK and account for over 208,000 deaths each year. More than one in three people
(36%) die from CVD each year. The main forms of CVD are coronary heart disease (CHD) and
stroke. About half (48%) of all deaths from CVD are from CHD and more than a quarter (28%)
are from stroke (Table 1.2).
CHD by itself is the most common cause of death in the UK. Around one in five men and one in
six women die from the disease. CHD causes around 101,000 deaths in the UK each year (Table
1.3 and Figures 1.3a and 1.3b).
Other forms of heart disease cause around 32,000 deaths in the UK each year so in total there
were just over 133,000 deaths from heart disease in the UK in 2005 (Table 1.3).
Premature mortalityCVD is one of the main causes of premature death in the UK (death before the age of 75). 31%
of premature deaths in men and 23% of premature deaths in women were from CVD in 2005
(Figures 1.3c and 1.3d). CVD caused just under 57,000 premature deaths in the UK in 2005
(Table 1.3).
CHD, by itself, is the most common cause of premature death in the UK (Figures 1.3c and 1.3d).
About one fifth (20%) of premature deaths in men and one in ten (11%) premature deaths in
women were from CHD (Figures 1.3c and 1.3d). CHD caused almost 33,000 premature deaths
in the UK in 2005 (Table 1.3).
Other forms of heart disease cause almost 8,000 premature deaths in the UK each year. In total
there were around 40,000 premature deaths from heart disease in the UK in 2005 – over one
fifth of all premature deaths.
Recent trends in death rates in the UKDeath rates from CVD have been falling in the UK since the early 1970s. For people under 75
years, they have fallen by 24% in the last ten years (Figure 1.1a).
Death rates from CHD have been falling in the UK since the late 1970s (Figures 1.1c and 1.1d).
For people under 65 years, they have fallen by 46% in the last ten years (Figure 1.1c).
In recent years, CHD death rates have been falling slower in younger age groups and fastest in
those aged 55 and over. For example, between 1995 and 2005 there was a 50% fall in the CHD
death rate for men aged 55 to 64 in the UK, compared to a 27% fall in men aged 35 to 44 years.
In women there was a 56% fall in those aged 55 to 64 years and a 20% fall in those aged 35 to
44 years (Table 1.4 and Figures 1.4a and 1.4b).
British HeartFoundation
Statistics Databasewww.heartstats.org
��
Death rates from stroke fell throughout the latter part of the twentieth century1. For people under
65 they have fallen by 23% in the last ten years (Figure 1.1e). Recently rates have declined at a
slower rate than previously, particularly in the younger age groups (Figures 1.1e and 1.1f).
A recent study aimed to explain the decline in mortality from CHD over the last two decades
of the twentieth century in Britain. Combining and analysing data on uptake and effectiveness
of cardiological treatments and risk factor trends, the authors examined how much of the
decline in CHD mortality in England and Wales between 1981 and 2000 could be attributed to
medical and surgical treatments and how much to changes in cardiovascular risk factors. They
concluded that more than half (58%) of the CHD mortality decline in Britain during the 1980s
and 1990s was attributable to reductions in major risk factors, principally smoking. Treatments
to individuals, including secondary prevention, explained the remaining two-fifths (42%) of the
mortality decline2.
International differences Despite recent improvements, internationally the death rate from CHD in the UK is relatively high
(Table 1.5 and Figure 1.5a). In countries of Eastern and Central Europe - where death rates have
been rising rapidly recently - the death rates are generally higher than in the UK but among more
developed countries only Ireland and Finland have a higher rate than the UK (Figure 1.5a).
While the death rate from CHD has been falling in the UK it has not been falling as fast as in
some other countries. For example, the death rate for men aged 35 to 74 fell by 42% between
1990 and 2000 in the UK, but it fell by 48% in Australia and 54% in Norway. For women the
death rate fell by 44% in the UK but in Australia and New Zealand the rate fell by 51% and
48% respectively (Figure 1.5b).
Over the same period, the death rates from CHD in countries of Eastern and Central Europe
(most notably countries of the former USSR) have experienced substantial increases. In the
Ukraine, for example, between 1990 and 2000 death rates rose by over 60% in both men and
women (Figure 1.5b).
National and regional differencesDeath rates from CHD are highest in Scotland, and the North of England, lowest in the South
of England, and intermediate in Wales and Northern Ireland. The premature death rate for men
living in Scotland is 70% higher than in the South West of England and 88% higher for women.
For more than 25 years these rates have been consistently highest in Scotland (Table 1.6).
Maps of CHD mortality by local authority in the UK demonstrate this North-South gradient
and show that the highest mortality rates are also concentrated in urban areas (Table 1.7 and
Figures 1.7a and 1.7b).
Socio-economic differencesSince the 1970s the premature death rate has fallen across all social groups for both men and
women. However for men the death rate has fallen faster in non-manual workers than in manual
workers and the difference in death rates increased between these groups (Figure 1.8). At the end
of the 1980s the premature death rate from CHD for male manual workers was 58% higher than
for male non-manual workers. The premature death rate from CHD for female manual workers
British HeartFoundation
Statistics Databasewww.heartstats.org
�4
was more than twice as high as that for female non-manual workers Towards the end of the
1990s the premature death rate was 50% higher for manual male workers compared with their
non-manual counterparts. During the same period the premature death rate for female manual
workers was 73% higher their non-manual counterparts (Table 1.8).
In 1997 it was estimated that each year 5,000 lives and 47,000 working years are lost in men
aged 20 to 64 years due to social class inequalities in CHD death rates. Just under one in three
of all deaths under 65 years resulting from social class inequalities are due to CHD. In England
and Wales there is a strong positive relationship between deaths from circulatory diseases and
levels of deprivation (Table 1.9). This pattern is clear in CHD and stroke for both men and
women (Figure 1.9).
To help reduce these socio-economic inequalities, CVD inequalities targets have been introduced
in England, Scotland and Wales (Table 1.1). Data from the Central Health Monitoring Unit
show that in England there has been clear progress towards this target: the absolute gap in CVD
mortality between the fifth most deprived areas and the population as a whole, in people aged
under 75, has fallen by just over 20% since the mid-1990s (Figure 1.1b).
Ethnic differencesSouth Asians living in the UK (Indians, Bangladeshis, Pakistanis and Sri Lankans), have a higher
premature death rate from CHD than average. Data from the early 1990s show that the death
rate for these groups was 46% higher for men and 51% higher for women (Table 1.10 and Figure
1.10a). Premature death rates from CHD for people born in the Caribbean and West Africa were
much lower than average – around half the rate found in the general population for men and
two-thirds of the rate found in women (Table 1.10 and Figure 1.10a).
The difference in the death rates between those born in South Asia and the general population
increased in the 1970s and 1980s. This is because the death rate from CHD was not falling as fast
in South Asian groups as it was in the rest of the population. From 1971 to 1991 the mortality
rate for 20 to 69 year olds for the whole population fell by 29% for men and 17% for women
whereas in people born in South Asia it fell by 20% for men and 7% for women3.
People born in South Asia also have a premature death rate from stroke which, in the 1990s,
was 55% higher than average for men and 41% higher for women but for those born in West
Africa and the Caribbean premature death rates for stroke were even higher. For those born in
West Africa the rate was nearly three times higher for men and 81% higher for women. For
those born in the Caribbean it was 68% higher for men and 57% higher for women (Table 1.10
and Figure 1.10b).
Excess winter mortality In the UK more people die of CHD in the winter months. In 2004/05, just under 7,000 people
died from CHD in England and Wales each month in June and July, compared to around 9,000
in December and January (Table 1.11 and Figure 1.11).
Excess winter mortality is the mortality that occurs in winter above that which occurs in the rest
of the year4. In 2004/05, in England and Wales, during the winter months there were around
19% more deaths than would be expected on the basis of the underlying mortality throughout
British HeartFoundation
Statistics Databasewww.heartstats.org
�5
the year. This percentage is higher in older age groups, with excess winter mortality more than
twice as high in the over 85s compared to the under 65s (Table 1.12).
The amount of excess winter mortality varies considerably by region – it is highest in the West
Midlands and lowest in the North East of England. Excess winter mortality also varies from year
to year. In 1999/2000, there were nearly twice as many excess winter deaths from CHD than in
2004/05 (8,960 compared to 5,450 deaths)5.
Public health targetsRecent trends indicate that the Our Healthier Nation target to reduce the death rate from CHD,
stroke and related diseases in people under 75 years by at least two fifths by 2010 will be met
(Figure 1.1a).
Progress towards the CVD inequalities target in England is also steady. If this continues, the
target to reduce the inequalities gap in premature death rates from CVD between the areas with
the worst health and deprivation indicators and the population as a whole by 40% by 2010 will
also be met (Figure 1.1b).
�. Office for National Statistics (�997) The Health of Adult Britain. The Stationery Office: London.
�. Unal B, Critchley JA, Capewell S (�004) Explaining the decline in coronary heart disease mortality in England and Wales between �98� and �000. Circulation �09: ��0�-��07.
�. Wild S, McKeigue P (�997) Cross sectional analysis of mortality by country of birth in England and Wales, �970-9�. BMJ ��4: 705-7�0.
4. Excess winter deaths are calculated by subtracting the actual number of deaths in winter (usually December to March), from the number of deaths which would have been expected for this period, calculated on the basis of the actual number of deaths occurring in the surrounding non-winter months. It is postulated that excess winter mortality is partially preventable through improvements to cold damp housing – see Olsen N (�00�) Prescribing warmer, healthier homes. BMJ ���: 748-749.
5. Office for National Statistics (�006), personal communication.
British HeartFoundation
Statistics Databasewww.heartstats.org
�6
�. Department of Health (�999) Our Healthier Nation. DH: London.
�. Department of Health (�004) National Standards, Local Action: Health and Social Care Standards and Planning Framework �005/06 and �007/08. DH: London.
�. Welsh Assembly Government (�005) See Chief Medical Officer Wales website www.cmo.wales.gov.uk/content/work/health-gain-targets/the-targets-e.htm#chd
4. Welsh Assembly Government (�005) See Chief Medical Officer Wales website www.cmo.wales.gov.uk/content/work/health-gain-targets/the-targets-e.htm#olderpeople
5. The Scottish Executive (�004) Building a better Scotland. Spending proposals �005-�008: Enterprise, Opportunity, Fairness. The Scottish Executive: Edinburgh.
6. New strategies for CVD in Northern Ireland are currently being developed by the Department of Health, Social Services and Public Safety.
Table �.� CVD mortality targets for the United Kingdom
England1,2
CVD - Target To reduce the death rate from CHD, stroke and related diseases
in people under 75 years by at least two fifths by 2010 – saving
up to 200,000 lives in total
CVD - Milestone To reduce the death rate from CHD, stroke and related diseases
in people under 75 years by at least one quarter by 2005
CVD - Inequalities To reduce the inequalities gap in death rates from CHD, stroke
target and related diseases between the fifth of areas with the worst
health and deprivation indicators and the population as a whole
in people under 75 years by 40% by 2010
Wales3,4
CHD – Health outcome To reduce CHD mortality in 65-74 year olds from 600 per
target 100,000 in 2002 to 400 per 100,000 in 2012
CHD – Health To improve CHD mortality in all groups and at the same time
inequality aim for a more rapid improvement in the most deprived
target groups
Stroke To reduce stroke mortality in 65-74 year olds by 20% by
2012
Scotland5
CHD - Target To reduce mortality rates from CHD among people under 75
years by 60% between 1995 and 2010, from the 1995 baseline
of 124.6 to 49.8 per 100,000 population
CHD - Inequalities To reduce the rate of CHD mortality (for people aged under
target 75) for the most deprived communities, by 27% between 2003
and 2008, from the 2003 baseline of 112.0 to 81.7 per 100,000
population
Stroke – Target To reduce mortality rates from stroke among people under 75
years by 50% between 1995 and 2010, from the 1995 baseline
of 37.5 to 18.8 per 100,000 population (standardised to the
European Standard Population)
Northern Ireland6 No target set
British HeartFoundation
Statistics Databasewww.heartstats.org
�7
Figure �.�a Death rates from CHD, stroke and all other diseases of the circulatory system, people aged under 75, �969 to �005, England, with “Our Healthier Nation” milestone and target
Notes: Data are three year moving averages plotted against middle year. ICD9 data have been adjusted to be comparable with ICD�0 data.
Source: Data from Office for National Statistics; analysis by Central Health Monitoring Unit, Department of Health. Data from �984-�99� have been adjusted due to the effects of coding medical enquiries and WHO Rule �.
Figure �.�b Absolute gap in death rates from CHD, stroke and all other diseases of the circulatory system, between the fifth most deprived areas and the population as a whole, people aged under 75, �99� to �005, England, with inequalities target
0
5
10
15
20
25
30
35
40
94 95 96 97 98 99 00 01 02 03 04 2010
Year% A
bso
lute
gap
in d
eath
s p
er 1
00
,00
0 (a
ge-
stan
dar
dis
ed)
Inequalitiestarget
Notes: Data are three year moving averages plotted against middle year.
There is a discontinuity in the data around year �000 due to the change to the �0th revision of the WHO International Classification of Diseases.
Source: Data from Office for National Statistics; analysis by Central Health Monitoring Unit, Department of Health.
British HeartFoundation
Statistics Databasewww.heartstats.org
�8
Figure �.�c Death rates from CHD for people aged under 65, �969 to �005, England
Notes: Data are three year moving averages plotted against middle year. There is a discontinuity in the data around year �000 due to the change to the �0th revision of the WHO International Classification of Diseases. Data from �984-�99� have been adjusted due to the effects of coding medical enquiries and WHO Rule �.
Source: Data from the Office for National Statistics; analysis by Central Health Monitoring Unit, Department of Health.
Table �.� Deaths by cause, sex and age, �005, United Kingdom
All ages Under 35 35-44 45-54 55-64 65-74 75+
All causes Men 276,644 8,990 7,408 14,140 31,497 58,674 155,935 Women 305,167 4,816 4,406 9,448 20,576 41,749 224,172 Total 581,811 13,806 11,814 23,588 52,073 100,423 380,107
All diseases of the Men 99,614 523 1,604 4,209 10,383 21,147 61,748circulatory system Women 108,615 286 646 1,577 3,983 12,198 89,925(I00-I99) Total 208,229 809 2,250 5,786 14,366 33,345 151,673
Coronary heart Men 56,127 104 878 2,790 7,046 13,331 31,978disease (I20-I25) Women 44,809 30 186 623 1,939 5,983 36,048
Total 100,936 134 1,064 3,413 8,985 19,314 68,026
Stroke Men 21,861 107 258 572 1,360 3,570 15,994(I60-I69) Women 35,785 87 215 506 1,013 3,073 30,891
Total 57,646 194 473 1,078 2,373 6,643 46,885
Diabetes Men 3,080 48 69 155 284 717 1,807(E10-E14) Women 3,532 25 50 68 195 559 2,635 Total 6,612 73 119 223 479 1,276 4,442
Cancer Men 81,313 679 1,247 4,114 12,725 22,963 39,585(C00-D48) Women 75,749 699 1,813 4,689 11,064 17,569 39,915 Total 157,062 1,378 3,060 8,803 23,789 40,532 79,500
Colo-rectal cancer Men 8,637 31 88 414 1,347 2,519 4,238(C18-C21) Women 7,455 24 107 312 828 1,628 4,556
Total 16,092 55 195 726 2,175 4,147 8,794
Lung cancer Men 19,457 12 167 947 3,476 6,150 8,705(C33, C34) Women 14,008 11 121 723 2,254 4,074 6,825
Total 33,465 23 288 1,670 5,730 10,224 15,530
Breast cancer Women 12,417 87 656 1,400 2,380 2,364 5,530(C50) Total 12,417 87 656 1,400 2,380 2,364 5,530
Respiratory disease Men 36,707 255 260 746 2,435 6,451 26,560(J00-J99) Women 44,633 176 167 507 1,701 5,081 37,001 Total 81,340 431 427 1,253 4,136 11,532 63,561
Injuries and poisoning Men 12,556 3,666 2,129 1,604 1,320 1,099 2,738(V01-Y89) Women 7,926 1,029 612 648 587 627 4,423 Total 20,482 4,695 2,741 2,252 1,907 1,726 7,161
All other causes Men 43,374 3,819 2,099 3,312 4,350 6,297 23,497 Women 64,712 2,601 1,118 1,959 3,046 5,715 50,273 Total 108,086 6,420 3,217 5,271 7,396 12,012 73,770
Notes: ICD codes in parentheses.
Source: England and Wales, Office for National Statistics (�006) personal communication.
Scotland, General Register Office (�006) personal communication.
Northern Ireland, General Register Office Statistics and Research Agency (�006) personal communication.
British HeartFoundation
Statistics Databasewww.heartstats.org
��
Table �.� All deaths and deaths under 75 by cause and sex, �005, England, Wales, Scotland, Northern Ireland and United Kingdom
All ages Under 75
England Wales Scotland Northern United England Wales Scotland Northern United Ireland Kingdom Ireland Kingdom
All causes Men 227,956 15,209 26,522 6,957 276,644 97,528 6,582 13,248 3,351 120,709 Women 251,722 16,953 29,225 7,267 305,167 65,148 4,502 9,193 2,152 80,995 Total 479,678 32,162 55,747 14,224 581,811 162,676 11,084 22,441 5,503 201,704
All diseases of the Men 81,977 5,773 9,434 2,430 99,614 30,555 2,218 4,123 970 37,866circulatory system Women 89,044 6,373 10,626 2,572 108,615 14,874 1,107 2,207 502 18,690(I00-I99) Total 171,021 12,146 20,060 5,002 208,229 45,429 3,325 6,330 1,472 56,556
All heart disease Men 56,554 4,090 6,655 1,781 69,080 23,019 1,671 3,207 754 28,651(I00-I52) Women 52,259 3,943 6,335 1,625 64,162 9,420 720 1,473 346 11,959
Men Women Map Local authority Number of Age Number of Age reference deaths standardised deaths standardised 2003-2005 death rate/ 2003-2005 death rate/ 100,000 100,000
Men Women Map Local authority Number of Age Number of Age reference deaths standardised deaths standardised 2003-2005 death rate/ 2003-2005 death rate/ 100,000 100,000
Men Women Map Local authority Number of Age Number of Age reference deaths standardised deaths standardised 2003-2005 death rate/ 2003-2005 death rate/ 100,000 100,000
Men Women Map Local authority Number of Age Number of Age reference deaths standardised deaths standardised 2003-2005 death rate/ 2003-2005 death rate/ 100,000 100,000
Men Women Map Local authority Number of Age Number of Age reference deaths standardised deaths standardised 2003-2005 death rate/ 2003-2005 death rate/ 100,000 100,000
Notes: ICD (�0th revision) codes I�0-I�5; directly standardised using the European Standard Population.
The age-adjusted death rate/�00,000 is an annual rate. The numbers of deaths �00�-�004 is the total number of deaths over the three year period.
Source: England and Wales: rates calculated in partnership with the Office for National Statistics.
Scotland: rates calculated in partnership with the General Register Office for Scotland.
Northern Ireland: rates calculated in partnership with Northern Ireland Statistics and Research Agency.
Government Office RegionsA South EastB SouthWest C East of England D East Midlands E West Midlands F North West G Yorkshire and the Humber H North East
Notes: Data from �99�/96 refer to directly age-standardised rates per �00,000 person years.
Data before �99�/96 refers to age-standardised death rates per �00,000 population.
Men and women aged �5-64.
Source: Data from �99�/96 from Office for National Statistics (�00�) Trends in social class differences in mortality by cause, �986 to �000. The Stationary Office: London.
Data before �99�/96 from Office for National Statistics (�997) Health Inequalities. The Stationery Office: London.
Figure �.8 Death rates from CHD by social class, men and women aged �5 to 64, �976/8� to �997/99, England and Wales
0
50
100
150
200
250
300
350
400
1978 1983 1988 1994 1998Year
Ag
e-st
and
ard
ised
dea
ths/
10
0,0
00
Manual men
Manual women
Non-manual men
Non-manual women
British HeartFoundation
Statistics Databasewww.heartstats.org
�7
Table �.9 Age-standardised death rates for circulatory diseases by deprivation twentieth, sex and age, �99� to �00�, England and Wales
Deprivation twentieth
Least deprived Most deprived 1 2 3 4 5 6 7 8 9 10 11 12 13 14 15 16 17 18 19 20 Total Ratio
Notes: Excess winter deaths are defined by the Office for National Statistics as the difference between the number of deaths during the four winter months (December to March) and the average number of deaths during the preceding autumn (August to November) and the following summer (April to July). The number of deaths have been rounded to the nearest �0. The excess winter deaths index is calculated as excess winter deaths divided by the average non-winter deaths, expressed as a percentage.
Source: Office for National Statistics (�006) personal communication.
British HeartFoundation
Statistics Databasewww.heartstats.org
4�
2. MorbidityMorbidity statistics are much harder to collect than mortality statistics. Sources of morbidity
data include routinely collected national data, national studies and local studies. Each source
has its pros and cons. Most sources only provide data on one or two aspects of morbidity from
CHD and related conditions. Not all sources supply data for all ages or even both sexes. Data
are collected in different ways with different degrees of validity and reliability. Sample sizes vary
considerably as do sampling methods.
In this section we present data and calculate UK estimates from studies which give the widest
coverage in terms of age, sex, geographical location, etc. and which used valid and reliable
methods of data collection. More detailed statistics on CHD morbidity and explanations of the
strengths and weaknesses of the data sources on which estimates are calculated can be found in
the Coronary heart disease statistics Morbidity supplement1, available on the www.heartstats.
org website.
Public health targetsThere are no morbidity targets for England, Wales, Scotland or Northern Ireland.
Incidence a) Myocardial infarction
The incidence of myocardial infarction (MI) or heart attack varies around the UK, but on
average the incidence rate for men aged between 30 and 69 is about 600 per 100,000 and
for women is about 200 per 100,000 (Table 2.1).
From these incidence rates we estimate there are about 91,000 heart attacks per year in
men aged under 75 living in the UK and 31,000 in women giving a total of 123,0002. A
more conservative estimate can be gained from applying the incidence rates for specific age
groups observed in the Oxford Record Linkage Study to UK population estimates across the
whole population. This procedure gives an estimate of 66,000 heart attacks per year in all
men and 45,000 in women giving a total of 111,000 heart attacks. This is almost certainly
an underestimate as we would expect the rate of heart attacks to be lower in the South of
England than in most other regions of the UK.
Table 2.1 shows that the incidence rate of heart attack for those aged between 30 and 69 is
between two and two and a half times the mortality rate. Using 2005 CHD mortality data
we estimate there are about 126,000 heart attacks in men of all ages and about 101,000 in
women, giving a total of about 227,000.
Further data from the Oxford Myocardial Infarction Incidence Study (OXMIS) show that
the incidence rate of heart attack is higher in men than in women and increases with age3.
It is highly likely that incidence rates, like mortality rates, are higher in Scotland, Northern
Ireland and the North of England than in the South of England and Table 2.1 suggests such
a trend.
British HeartFoundation
Statistics Databasewww.heartstats.org
44
The World Health Organization MONICA (monitoring trends and determinants in cardiovascular
disease) Project collected data on the incidence of heart attack in 35 populations in 21 countries
during the mid-1980s until the mid-1990s. Results showed that incidence rates in the two
UK populations included in the study, Belfast and Glasgow, were among the highest in the
world, particularly in women (Table 2.2 and Figures 2.2a and 2.2b).
b) Angina
Different studies give different estimates of the incidence of angina. Using data from Scottish
Continuous Morbidity Study we estimate there are about 52,000 new cases per year of angina
in all men living in the UK and about 43,000 in women giving a total of about 95,0002. The
incidence of angina is higher in men than women and increases with age (Table 2.3).
c) Heart failure
Studies of the incidence of heart failure are scarce and different studies use different methods,
particularly for diagnosing the condition. The Hillingdon Heart Failure Study used a combination
of clinical assessment, echocardiography and radiography to diagnose heart failure in the
study population and adhered to European Society of Cardiology guidelines for its definition
of heart failure. The study found a crude incidence rate of 140 per 100,000 for men and 120
per 100,000 for women (Table 2.4).
From the age-specific incidence rates we estimate that there are about 37,000 new cases of
heart failure in men in the UK each year and about 30,000 in women giving a total of about
67,0002.
The incidence of heart failure increases steeply in the elderly and is more common in men
than in women (Table 2.4 and Figure 2.4).
Prevalencea) Myocardial infarction
Different studies give different estimates for the prevalence of a previous heart attack (Tables
2.5 and 2.6). Combined data from these prevalence studies suggest that overall about 4% of
men and 2% of women in the UK have had a heart attack.
From the combined age-specific prevalence rates we estimate that there are about 570,000
men aged between 35 and 75 living in the UK who have had a heart attack and about 296,000
women giving a total of about 866,0002.
We estimate that for all people older than 35 there are about 640,000 men living in the UK
who have had a heart attack and about 353,000 women giving a total of almost 1 million2.
Prevalence of heart attack increases with age and is higher in men than in women (Tables 2.5
and 2.6).
b) Angina
In general different studies on the prevalence of angina in the UK give similar prevalence
rates, although the rate appears to be higher in Scotland than in England (Table 2.7).
Figures from the 2003 Health Survey for England suggest that about 8% of men and 5%
of women aged 55 to 64 and about 17% of men and 8% of women aged 65 to 74 have or
British HeartFoundation
Statistics Databasewww.heartstats.org
45
have had angina (Table 2.7). From these prevalence rates we estimate that there are about
706,000 men aged between 55 and 75 living in the UK who have or have had angina and
about 392,000 women giving a total of just under 1.1 million2.
Combined data from these prevalence studies suggest that overall about 5% of men and 3%
of women aged 35 and over have or have had angina. From these prevalence rates we estimate
that there are almost 800,000 men living in the UK who have or have had angina and almost
530,000 women giving a total of over 1.3 million2.
c) Heart failure
Different studies on the prevalence of heart failure in the community give similar estimates
of prevalence (Table 2.8).
The most recent study, the Heart of England Screening study, selected patients by systematic
random sampling of all men and women aged over 45 years registered at GP practices in the
West Midlands. Patients were screened using a combination of echocardiography and clinical
examination, and European Society of Cardiology criteria for the diagnosis of heart failure
were applied. Over 2% of patients (3% of men and 1.7% of women) screened had definite
heart failure (Table 2.9). Probable heart failure was seen in around a further 1% of patients,
which suggests that more than 3% of people aged 45 and over in the UK have definite or
probable heart failure.
From these prevalence rates we estimate that there are about 384,000 men aged 45 and over
living in the UK with definite heart failure, and 306,000 women, giving a total of around
690,0002. If probable cases of heart failure are included, there are an estimated 934,000
people aged 45 and over who have heart failure in the UK today.
Prevalence of heart failure increases steeply with age, so that while around 1% of men and
women aged under 65 have heart failure, this increases to about 7% of those aged 75 to 84
and 15% of those aged 85 and over (Table 2.9).
d) All coronary heart disease
Data from the 2003 Health Survey for England suggest the prevalence of CHD in England
was 7.4% in men and 4.5% in women. In Scotland in 2003 8% of men and 6% of women
were living with CHD. Prevalence rates increase with age, with around 1 in 4 men and 1 in
5 women aged 75 and over living with CHD.
Overall we estimate that there are just over 1.5 million men living in the UK who have had
CHD (either angina or heart attack) and about 1.1 million women, giving a total of around
2.6 million4.
Data from the General Household Survey allow comparisons to be made between the prevalence
of cardiovascular diseases (CVD) and conditions with that of other diseases and conditions.
In 2005, CVD was the second most commonly reported longstanding illness in Great Britain
(after musculoskeletal conditions) (Table 2.10 and Figure 2.10).
The Quality and Outcomes Framework (QOF) became part of general practice contracts on 1
April 2004 and provides information on the registrations for a number of different diseases.
A very high proportion of practices (>98%) participate in the scheme making the register a
good measure of prevalence for particular diseases in the population. Table 2.11 shows that
British HeartFoundation
Statistics Databasewww.heartstats.org
46
the prevalence of CHD in Britain was 3.6% of all GP registrations. The prevalence of CHD
was higher in Scotland (4.6%) than in Wales (4.3%) or England (3.6%). Within countries
there is wide variation in the prevalence of CHD. In England the prevalence ranged from 2.2%
in South West London to 5.0% in Northumberland, Tyne and Wear and Country Durham;
in Scotland the prevalence was generally higher ranging from 4.0% in Lothian and Orkney
to 8.4% in Shetland.
Data from Key Health Statistics from General Practice on the prevalence of treated CHD
(heart attack and angina) suggest that the prevalence of all CHD was higher in the North
of England and in Wales than it was in the South of England, and was also higher in lower
socio-economic groups1.
The 2004 Health Survey for England, which focused specifically on the health of minority
ethnic groups, suggests that the prevalence of heart attack and angina was higher in Indian
and Pakistani men, who were just under twice as likely to have experienced these conditions
than men in the general population. The prevalence of all CHD in Black Caribbean and
Chinese men was much lower than in the general population. In women there was less ethnic
variation in the prevalence of all CHD, with only Chinese women having levels of all CHD
which were lower than those found in women in the general population (Table 2.12).
Temporal trends Prevalence of CHD was measured in the 1994, 1998 and 2003 Health Surveys for England.
Overall, between 1994 and 2003, the prevalence of CHD increased from 6.0% to 7.4% in men
and from 4.1% to 4.5% in women. An increase in the prevalence of CHD or stroke was also
observed in the Health Survey for England, increasing from 7.1% to 9.1% in men and from 5.2%
to 6.3% in women between 1994 and 2003 (Table 2.13 and Figure 2.13). These increases were
found in the majority of age groups in both men and women, with the most consistent increase
in trend found in the oldest age group (75 years and over). However, these results are based on
unweighted prevalence rates and need to be interpreted with caution.
Longitudinal data from the General Household Survey show that since 1988 there has been
no marked change in the overall rate of self-reported morbidity from a previous heart attack.
However, rates of self-reported longstanding cardiovascular disease have increased in older age
groups since 1988; by around 15% in those aged 65 to 74 and 48% for men and 18% for women
in those aged 75 and over (Table 2.14 and Figure 2.14).
In summary, the surveys which have looked at morbidity most reliably and/or most frequently, i.e.
the Health Survey for England and the General Household Survey, suggest that, whereas mortality
from CHD is rapidly falling, morbidity, particularly in older age groups, appears to be rising.
�. Rayner M, Petersen S, Moher M, Wright L and Lampe, F (�00�) Coronary heart disease statistics: morbidity supplement. British Heart Foundation: London. See also www.heartstats.org
�. These estimates are derived from applying age-specific rates to the UK population estimates for �005, and supersede our estimates in previous publications (e.g. Petersen S, Peto V and Rayner M (�005) Coronary heart disease statistics. British Heart Foundation: London). Previous estimates for angina were based on incidence rates per person years at risk, these are based on prevalence rates per �00,000 people.
�. Volmink JA, Newton JN, Hicks NR, Sleight P, Fowler GH, Neil HAW, on behalf of the Oxford Myocardial Infarction Incidence Study Group (�998) Coronary event and case fatality rates in an English population: results of the Oxford myocardial infarction incidence study. Heart 80; 40-44. See Table �.�a Coronary heart disease statistics: morbidity supplement (above).
4. The overall CHD prevalence estimates are based on �00� Health Survey for England age-specific prevalence data for CHD (heart attack and/or angina). We can also estimate that there are about �.� million men aged under 75 living in the UK who have CHD and about 56�,000 women, giving a total of about �.6 million.
British HeartFoundation
Statistics Databasewww.heartstats.org
47
Table �.� Incidence of myocardial infarction, adults, latest available year, UK studies compared
Source Study Year Place Sex Age group Incidence/ Mortality/ Incidence/ 100,000 100,000 mortality
Volmink et al, 1998 OXMIS 1994/95 Oxfordshire Men 30-69 292 120 2.43 Women 30-69 94 44 2.14
Tunstall-Pedoe et al, 1999 MONICA 1985/94 Glasgow Men 35-64 777 365 2.13 Women 35-64 265 123 2.15
Tunstall-Pedoe et al, 1999 MONICA 1983/93 Belfast Men 35-64 695 279 2.49 Women 35-64 188 79 2.38
Lampe et al, 2000 BRHS 1983/85 Great Britain Men 45-59 950 426 2.23
Notes: See sources for methods and definitions.
Source: Goldacre M (�00�) Myocardial infarction: an investigation of measures of mortality incidence and case fatality. Personal communication.
Volmink JA, Newton JN, Hicks NR, Sleight P, Fowler GH, Neil HAW, on behalf of the Oxford Myocardial Infarction Incidence Study Group (�998) Coronary event and case fatality rates in an English population: results of the Oxford myocardial infarction incidence study. Heart 80; 40-44.
Tunstall-Pedoe H, Kuulasmaa K, Mahonen M, Tolonen H, Ruokokoski E, Amouyel P, for the WHO MONICA Project (�999). Contribution of trends in survival and coronary-event rates to changes in coronary heart disease mortality: �0 year results from �7 WHO MONICA Project populations. Lancet �5�; �547-�557.
Lampe FC, Morris RW, Whincup PH, Walker M, Ebrahim S and Shaper AG (�000) Is the prevalence of coronary heart disease falling in British men? The British Regional Heart Study, �978 to �996. Poster at Cardiovascular Disease Prevention V conference, 4th-7th April, Kensington Town Hall, London.
British HeartFoundation
Statistics Databasewww.heartstats.org
48
Tabl
e �.
� C
oron
ary
even
t ra
tes,
cor
onar
y ca
se f
atal
ity,
annu
al c
hang
e in
cor
onar
y ev
ent
rate
s an
d an
nual
cha
nge
in
coro
nary
cas
e fa
talit
y, a
dults
age
d �5
to 6
4, b
y se
x, la
test
ava
ilabl
e da
ta, M
ON
ICA
Pro
ject
pop
ulat
ions
M
EN
W
OM
EN
Cor
onar
y ev
ent
Cor
onar
y ca
se
Ann
ual c
hang
e in
A
nnua
l cha
nge
in
Cor
onar
y ev
ent
Cor
onar
y ca
se
Ann
ual c
hang
e in
A
nnua
l cha
nge
in
rate
fa
talit
y ra
te
coro
nary
eve
nt
coro
nary
cas
e r
ate
fata
lity
rate
co
rona
ry e
vent
co
rona
ry c
ase
Ev
ents
%
of f
atal
ities
r
ate
fata
lity
rate
Ev
ents
%
of f
atal
ities
r
ate
fata
lity
rate
pe
r 10
0,00
0 w
ithin
28
days
%
%
pe
r 10
0,00
0 w
ithin
28
days
%
%
MO
NIC
A p
opul
atio
n
MO
NIC
A
Surv
ey y
ears
po
pula
tion
code
Aus
tral
ia-N
ewca
stle
A
US-
NEW
19
85/9
3 47
9 40
.6
-5.1
-2
.2
153
40.9
-5
.6
-3.0
Aus
tral
ia-P
erth
A
US-
PER
19
84/9
3 38
9 36
.8
-3.1
-1
.5
92
41.7
-2
.2
-2.3
Belg
ium
-Cha
rler
oi
BEL-
CH
A
1983
/92
487
50.1
0.
3 -1
.8
118
59.3
1.
1 -1
.8Be
lgiu
m-G
hent
BE
L-G
HE
1983
/92
346
47.4
-3
.2
-1.6
77
58
.0
-3.0
-1
.8C
anad
a-H
alifa
x C
ount
y C
AN
-HA
L 19
84/9
3 52
3 37
.5
-4.7
-1
.5
139
33.6
0.
5 -4
.6C
hina
-Bei
jing
CH
N-B
EI
1984
/93
81
58.8
2.
3 1.
1 35
73
.6
-0.5
1.
3C
zech
Rep
ublic
C
ZE-
CZ
E 19
84/9
3 51
5 52
.8
-0.4
0.
7 10
1 53
.9
2.1
-1.2
Den
mar
k-G
lost
rup
DEN
-GLO
19
82/9
1 51
7 52
.5
-4.2
1.
5 14
0 58
.0
-2.5
2.
5Fi
nlan
d-K
uopi
o Pr
ovin
ce
FIN
-KU
O
1983
/92
718
45.7
-6
.0
1.0
124
38.7
-4
.5
1.0
Finl
and-
Nor
th K
arel
ia
FIN
-NK
A
1983
/92
835
48.1
-6
.5
-0.5
14
5 41
.3
-5.1
-0
.2Fi
nlan
d-Tu
rku/
Loim
aa
FIN
-TU
L 19
83/9
2 54
9 48
.5
-4.2
-0
.2
94
48.9
-4
.5
-1.9
Fran
ce-L
ille
FRA
-LIL
19
85/9
4 29
8 58
.7
-1.1
-0
.3
64
69.5
-1
.6
0.8
Fran
ce-S
tras
bour
g FR
A-S
TR
19
85/9
3 29
2 49
.0
-3.9
-1
.7
64
57.1
-6
.6
-2.3
Fran
ce-T
oulo
use
FRA
-TO
U
1985
/93
233
40.0
-2
.1
-3.8
36
59
.8
-1.7
-3
.6G
erm
any-
Aug
sbur
g G
ER-A
UG
19
85/9
4 28
6 55
.1
-3.2
1.
3 63
64
.6
0.9
-0.4
Ger
man
y-Br
emen
G
ER-B
RE
1985
/92
361
49.6
-3
.4
-0.9
81
52
.0
0.7
-2.9
Ger
man
y-Ea
st G
erm
any
GER
-EG
E 19
85/9
3 37
0 50
.0
-0.5
1.
7 78
62
.8
2.5
-2.2
Icel
and
ICE-
ICE
1981
/94
486
36.9
-4
.7
-2.1
99
34
.1
-3.7
-1
.0It
aly-
Are
a Br
ianz
a IT
A-B
RI
1985
/94
279
40.7
-2
.3
-0.8
42
52
.5
-3.5
-4
.8It
aly-
Friu
li IT
A-F
RI
1984
/93
253
45.1
-0
.9
-2.0
47
49
.9
-0.8
-2
.0Li
thua
nia-
Kau
nas
LTU
-KA
U
1983
/92
498
54.8
1.
2 1.
0 80
53
.7
2.7
-1.2
New
Zea
land
-Auc
klan
d N
EZ-A
UC
19
83/9
1 43
4 49
.5
-5.1
-0
.6
115
51.4
-3
.5
0.6
Pola
nd-T
arno
brze
g Vo
void
ship
PO
L-TA
R
1984
/93
461
82.7
1.
1 1.
2 11
0 88
.4
-0.1
-0
.7Po
land
-War
saw
PO
L-W
AR
19
84/9
4 58
6 59
.9
-0.8
-0
.4
153
59.2
1.
0 -2
.1R
ussi
a-M
osco
w (c
ontr
ol)
RU
S-M
OC
19
85/9
3 47
7 60
.7
-1.0
3.
0 92
60
.2
-6.7
1.
5R
ussi
a-N
ovos
ibir
sk (c
ontr
ol)
RU
S-N
OC
19
84/9
2 46
4 59
.9
0.9
-0.1
11
1 66
.5
2.3
0.3
Spai
n-C
atal
onia
SP
A-C
AT
1985
/94
210
36.7
1.
8 -1
.7
35
45.5
2.
0 1.
5Sw
eden
-Got
henb
urg
SWE-
GO
T
1984
/94
363
43.6
-4
.2
0.3
84
45.4
-3
.7
1.2
Swed
en-N
orth
ern
Swed
en
SWE-
NSW
19
85/9
5 50
9 36
.1
-5.1
-2
.9
119
34.4
-2
.4
0.4
Switz
erla
nd-T
icin
o SW
I-T
IC
1985
/93
290
33.5
-2
.6
-4.2
Switz
erla
nd-V
aud/
Frib
ourg
SW
I-VA
F 19
85/9
3 23
1 38
.4
-3.6
-3
.0U
nite
d K
ingd
om-B
elfa
st
UN
K-B
EL
1983
/93
695
41.0
-4
.6
-1.5
18
8 41
.5
-2.4
-1
.7U
nite
d K
ingd
om-G
lasg
ow
UN
K-G
LA
1985
/94
777
48.2
-1
.4
-1.3
26
5 46
.4
0.2
-2.1
Uni
ted
Stat
es-S
tanf
ord
USA
-STA
19
80/9
2 43
1 47
.9
-4.2
-1
.6
134
53.7
-2
.4
-0.4
Yug
osla
via-
Nov
i Sad
Y
UG
-NO
S 19
84/9
5 42
2 51
.9
0.4
-0.4
10
1 49
.9
2.8
0.5
Not
es:
Rat
es a
re fo
r M
ON
ICA
eve
nt d
efini
tion
� w
hich
incl
udes
fata
l defi
nite
MI,
fata
l pos
sibl
e M
I, u
ncla
ssifi
able
dea
th a
nd n
onfa
tal d
efini
te M
I. A
ge-s
tand
ardi
sed
rate
s: s
ee s
ourc
e fo
r de
tails
and
how
tren
ds w
ere
calc
ulat
ed.
Sour
ce:
Tuns
tall-
Pedo
e H
, Kuu
lasm
aa K
, Mah
onen
M, T
olon
en H
, Ruo
koko
ski E
, Am
ouye
l P, f
or th
e W
HO
MO
NIC
A P
roje
ct (�
999)
. Con
trib
utio
n of
tren
ds in
surv
ival
and
cor
onar
y-ev
ent r
ates
to c
hang
es in
cor
onar
y he
art d
isea
se m
orta
lity:
�0-
year
resu
lts fr
om �
7 M
ON
ICA
Pr
ojec
t pop
ulat
ions
. Lan
cet �
5�; �
547-
�557
.
British HeartFoundation
Statistics Databasewww.heartstats.org
49
Figure �.�a Age-standardised coronary event rates, men aged �5 to 64, latest data, MONICA Project populations
0
100
200
300
400
500
600
700
800
900
Fin
lan
d-N
ort
h K
arel
ia
Un
ited
Kin
gd
om
-Gla
sgo
w
Fin
lan
d-K
uo
pio
Pro
vin
ce
Un
ited
Kin
gd
om
-Bel
fast
Pola
nd
-War
saw
Fin
lan
d-T
urk
u/L
oim
aa
Can
ada
Den
mar
k-G
lost
rup
Cze
ch R
epu
blic
Swed
en-N
ort
her
n S
wed
en
Lith
uan
ia-K
aun
as
Bel
giu
m-C
har
lero
i
Icel
and
Au
stra
lia-N
ewca
stle
Russ
ia-M
osc
ow
(co
ntr
ol)
Russ
ia-N
ovo
sib
irsk
(co
ntr
ol)
Pola
nd
-Tar
no
brz
eg V
ovo
idsh
ip
New
Zea
lan
d-A
uck
lan
d
Un
ited
Sta
tes-
Stan
ford
Yug
osl
avia
-Nov
i Sad
Au
stra
lia-P
erth
Ger
man
y-Ea
st G
erm
any
Swed
en-G
oth
enb
urg
Ger
man
y-B
rem
en
Bel
giu
m-G
hen
t
Fran
ce-L
ille
Fran
ce-S
tras
bo
urg
Swit
zerl
and
-Tic
ino
Ger
man
y-A
ug
sbu
rg
Ital
y-A
rea
Bri
anza
Ital
y-Fr
iuli
Fran
ce-T
ou
lou
se
Swit
zerl
and
-Vau
d/F
rib
ou
rg
Spai
n-C
atal
on
ia
Ch
ina-
Bei
jing
MONICA population
Co
ron
ary
even
t ra
te p
er 1
00
,00
0 p
op
ula
tio
n
Figure �.�b Age-standardised coronary event rates, women aged �5 to 64, latest data, MONICA Project populations
MONICA population
0
50
100
150
200
250
300
Un
ited
Kin
gd
om
-Gla
sgo
w
Un
ited
Kin
gd
om
-Bel
fast
Au
stra
lia-N
ewca
stle
Pola
nd
-War
saw
Fin
lan
d-N
ort
h K
arel
ia
Den
mar
k-G
lost
rup
Can
ada
Un
ited
Sta
tes-
Stan
ford
Fin
lan
d-K
uo
pio
Pro
vin
ce
Swed
en-N
ort
her
n S
wed
en
Bel
giu
m-C
har
lero
i
New
Zea
lan
d-A
uck
lan
d
Russ
ia-N
ovo
sib
irsk
(co
ntr
ol)
Pola
nd
-Tar
no
brz
eg V
ovo
idsh
ip
Cze
ch R
epu
blic
Yug
osl
avia
-Nov
i Sad
Icel
and
Fin
lan
d-T
urk
u/L
oim
aa
Au
stra
lia-P
erth
Russ
ia-M
osc
ow
(co
ntr
ol)
Swed
en-G
oth
enb
urg
Ger
man
y-B
rem
en
Lith
uan
ia-K
aun
as
Ger
man
y-Ea
st G
erm
any
Bel
giu
m-G
hen
t
Fran
ce-L
ille
Fran
ce-S
tras
bo
urg
Ger
man
y-A
ug
sbu
rg
Ital
y-Fr
iuli
Ital
y-A
rea
Bri
anza
Fran
ce-T
ou
lou
se
Ch
ina-
Bei
jing
Spai
n-C
atal
on
ia
Co
ron
ary
even
t ra
te p
er 1
00
,00
0 p
op
ula
tio
n
British HeartFoundation
Statistics Databasewww.heartstats.org
50
Table �.� Incidence of angina, adults, latest available year, UK studies compared
Source Study Year Place Sex Age group Incidence/ 100,000
Murphy et al, 2006 Scottish Continuous Moribidity 2001/02 Scotland Men <45 10 Study 45-54 240 55-64 490 65-74 650 75-84 610 >85 310 Total 180
Women <45 10 45-54 150 55-64 300 65-74 440 75-84 580 >85 320 Total 140
Royal College of General 4th National Study of Morbidity 1991/92 England and Wales Men <25 0Practitioners et al, 1995 Statistics from General Practice 25-44 90 45-64 1,080 65-74 2,250 75-84 2,730 >85 2,020 Total 550
Women <25 0 25-44 40 45-64 660 65-74 1,760 75-84 2,240 >85 2,150 Total 490
Ghandi et al, 1995 Southampton Chest Pain Clinic 1990/92 Southampton Men 31-40 40 Survey 41-50 63 51-60 147 61-70 262 Total 113
Women 31-40 6 41-50 47 51-60 85 61-70 91 Total 53
Gill et al, 1999 One general practice in Oxford 1989/91 Oxford Men 45-54 830 55-64 1,353 65-74 930 Total 1,043
Women 45-54 643 55-64 1,257 65-74 827 Total 903
Notes: Incidence of angina from Scottish Continuous Morbidity Study (SCMS) relates to first ever diagnosis of angina.
Total population for SCMS was �6�,�55; total number of cases was 570 (��5 for men and �55 for women).
Total population for Southampton Chest Pain Clinic Survey was �9�,677; total number of cases were ��0 (70 for men and 40 for women).
Total population for Oxford study was �,984; total number of cases was 58 (�� for men, �7 for women).
Source: Murphy NF, Simspon CR, MacIntyre K, McAlister FA, Chalmers J, McMurray JJV (�006) Prevalence, incidence, primary care burden and medical treatment of angina in Scotland: age, sex and socioeconomic disparities: a population-based study. Heart; 9�: �047-
�054.
Ghandhi MM, Lampe FA, Wood DA (�995) Incidence, clinical characteristics, and short term prognosis of angina pectoris. British Heart Journal; 7�: �9�-�98.
Gill D, Mayou R, Dawes M, Mant D (�999) Presentation, management and course of angina and suspected angina in primary care. Journal of Psychosomatic Research; 46: �49-�58.
Royal College of General Practitioners, the Office of Population Censuses and Surveys and the Department of Health (�995) Morbidity Statistics from General Practice, Fourth National Study �99�-�99�. HMSO:London.
British HeartFoundation
Statistics Databasewww.heartstats.org
5�
Table �.4 Incidence of heart failure by sex and age, �995/96, Hillingdon, England
Age group Population Number of cases Incidence/1000 population
Source: Cowie MR, Wood DA, Coats AJS, Thompson SG, Poole-Wilson PA, Suresh V and Sutton GC (�999) Incidence and aetiology of heart failure. A population-based study. European Heart Journal �0; 4��-4�8.
Figure �.4 Incidence of heart failure by sex and age, �995/96, Hillingdon, England
MenWomen
0
2
4
6
8
10
12
14
16
18
25-34 35-44 45-54 55-64 65-74 75-84 85 & over TotalAge group
Inci
den
ce o
f hea
rt fa
ilure
- ca
ses/
1,0
00
po
pu
lati
on
/yea
r
British HeartFoundation
Statistics Databasewww.heartstats.org
5�
Table �.5 Prevalence of myocardial infarction, adults aged between 55 and 74, latest available year, UK studies compared
MEN WOMEN
Source Study Year Place 55-64 65-74 55-64 65-74
% % % %
Joint Health Surveys Unit, 2004 HSE 2003 England 6.7 12.1 2.1 4.2
Joint Health Surveys Unit, 1999 HSE 1998 England 8.4 11.6 2.4 5.5
Personal communication ASSIST 1997/98 Warwickshire 4.7 7.8 0.9 2.7
Royal College of General 4th National Study of 1991/92 England and Wales 0.7** 1.6 0.2** 0.7Practitioners et al, 1995 Morbidity Statistics from General Practice
Personal communication BRHS 1992 Great Britain 8.0 13.1
Notes: Data from the 4th National Study of Morbidity Statistics from General Practice is for adults aged between 45 and 74.
** for those aged 45-64.
As �998 Health Survey for England data is unweighted and �00� Health Survey for England data is weighted, comparisons between surveys are problematic.
Source: Department of Health (�999) Health Survey for England �998. The Stationery Office: London.
Department of Health (�004) Health Survey for England �00�. The Stationery Office: London.
M Moher on behalf of the ASSIST trial team, Department of Primary Health Care, University of Oxford, personal communication. Royal College of General Practitioners, the Office of Population Censuses and Surveys and the Department of Health (�995).
Morbidity Statistics from General Practice, Fourth National Study �99�-�99�. HMSO: London.
F Lampe on behalf of the BRHS team, Department of Primary Care and Population Sciences, Royal Free and University College Medical School, London, personal communication.
British HeartFoundation
Statistics Databasewww.heartstats.org
5�
Table �.6 Percentage who have experienced cardiovascular conditions (ever and recently) by sex and age, �00�, England
Source: Davies MK, Hobbs FDR, Davis RC, Kenkre JE, Roalfe AK, Hare R, Wosornu D, Lancashire RJ (�00�) Prevalence of left-ventricular systolic dysfunction and heart failure in the Echocardiographic Heart of England Screening study: a population based study. The Lancet �58:4�9-444.
British HeartFoundation
Statistics Databasewww.heartstats.org
57
Table �.�0 Percentage reporting longstanding illness by sex, age and condition, �005, Great Britain
All ages 16-44 45-64 65-74 75+
Heart and circulatory system (VII) Men 11.4 1.5 16.7 28.8 32.9 Women 10.8 2.0 12.3 26.0 31.3 Total 11.1 1.7 14.5 27.4 32.0
Heart attack Men 2.1 0.1 3.0 6.2 6.5 Women 1.7 0.0 1.4 4.8 7.0
Other heart complaints Men 3.4 0.5 4.7 8.1 11.8 Women 2.7 0.7 2.5 6.0 8.9
Hypertension Men 4.1 0.6 6.6 10.4 8.5 Women 5.0 0.9 7.0 12.6 10.8
Other blood vessel/ Men 0.9 0.2 1.1 2.2 2.6embolic disorders Women 0.7 0.3 0.9 1.1 1.4
Stroke Men 0.8 0.1 1.0 1.8 3.5 Women 0.6 0.1 0.4 1.5 3.0
Musculoskeletal system (XIII) Men 12.6 6.1 16.8 23.2 24.1 Women 17.0 6.7 20.7 35.3 35.1 Total 14.9 6.4 18.8 29.6 30.8
Arthritis and rheumatism Men 5.1 1.1 7.2 12.4 13.3 Women 8.9 1.8 11.0 22.8 21.4
Back problems Men 3.8 2.6 5.5 4.5 3.3 Women 3.8 3.1 5.2 3.6 2.9
Other bone and joint problems Men 3.7 2.4 4.1 6.3 7.6 Women 4.3 1.8 4.5 8.9 10.8
Respiratory system (VIII) Men 6.3 5.2 5.6 10.4 10.6 Women 6.2 5.3 6.4 8.9 7.5 Total 6.3 5.3 6.0 9.6 8.7
Asthma Men 4.0 4.3 3.6 4.1 4.4 Women 4.6 4.4 4.7 6.1 3.7
Bronchitis and emphysema Men 0.8 0.0 0.9 3.2 2.9 Women 0.6 0.1 0.7 1.2 1.4
Hay fever Men 0.4 0.6 0.1 0.4 0.1 Women 0.2 0.4 0.1 0.1 0.0
Other respiratory complaints Men 1.0 0.4 1.1 2.6 3.2 Women 0.8 0.3 0.9 1.5 2.4
Endocrine and metabolic (III) Men 4.6 1.4 6.5 10.7 9.9 Women 5.7 2.1 7.8 12.3 9.4 Total 5.2 1.8 7.1 11.5 9.6
Digestive system (IX) Men 2.4 1.2 3.6 3.6 4.3 Women 3.0 1.7 3.1 6.3 5.1 Total 2.7 1.5 3.4 5.0 4.7
Nervous system (VI) Men 2.8 1.8 3.8 3.6 3.6 Women 3.0 2.5 3.7 3.6 3.1 Total 2.9 2.2 3.7 3.6 3.3
Any longstanding illness Men 32.0 22.0 44.0 58.0 65.0 Women 33.0 24.0 43.0 61.0 64.0 Total 33.0 23.0 43.0 60.0 64.0
Weighted base (000s) Men ��,087 ��,�6� 7,0�5 �,�06 �,604 Women ��,774 ��,5�6 7,��8 �,557 �,46�
Unweighted base Men ��,�67 5,406 �,7�� �,�9� 9�7 Women ��,�8� 5,8�8 �,9�5 �,46� �,�89
Notes: �005 data includes last quarter of �004/5 data due to survey change from financial year to calendar year
ICD chapters in parentheses.
Data are weighted for non-response.
Source: Office for National Statistics (�006) Results from the �005 General Household Survey. www.ons.gov.uk/ghs
British HeartFoundation
Statistics Databasewww.heartstats.org
58
Figure �.�0 Percentage reporting longstanding illness by sex and condition, �005, Great Britain
Source: Department of Health (�004) Health Survey for England �00�. The Stationery Office: London
Figure �.�� Changes in prevalence rates in CHD, stroke and CHD or stroke by sex between �994 and �00�, England
MenWomen
0
10
20
30
40
50
60
CHD Stroke CHD or stroke
% c
han
ge
in r
ates
19
94
to
20
03
British HeartFoundation
Statistics Databasewww.heartstats.org
6�
Table �.�4 Rates per �,000 population reporting longstanding diseases of the circulatory system by sex and age, �988 to �005, Great Britain All ages 16-44 45-64 65-74 75+
Notes: From �000 data are weighted for non-response. See source for details.
Source: Office for National Statistics (�006) �005 General Household Survey www.ons.gov.uk/ghs.
Office for National Statistics (�004) Living in Britain. Results from the �00� General Household Survey. The Stationery Office: London and previous editions.
British HeartFoundation
Statistics Databasewww.heartstats.org
64
Figure �.�4 Rate of reporting longstanding cardiovascular disease by age, �988 to �005, Great Britain
3. TreatmentNational Service Framework for Coronary Heart Disease in EnglandThe National Service Framework for Coronary Heart Disease1 was announced in March 2000,
and sets national standards for the prevention, diagnosis and treatment of CHD in England
(Table 3.1).
PrescriptionsThere has been a significant increase in the number of prescriptions for the treatment and prevention
of CVD in the last twenty years. In 2005, around 220 million prescriptions were issued for diseases
of the circulatory system in England, over four times as many as issued in 1985, and an increase
of nearly 10% on the number of prescriptions in 2004 (Table 3.2).
In the last ten years, the number of prescriptions for antiplatelet drugs has increased around four
fold (and more than thirty fold in the last twenty years). The number of prescriptions of lipid
lowering drugs has increased around sixteen fold (nearly one hundred and fifty fold in the last
20 years) (Table 3.2 and Figure 3.2).
In 2005, the cost of prescriptions for lipid lowering drugs, including statins, was £625 million, a
decrease of £144 million since 2004, despite the increased number of prescriptions. Lipid lowering
drugs continue to cost the NHS more than any other class of drug2.
The cost of prescriptions for antihypertensive therapy decreased by £126 million to £484 million
between 2004 and 2005, despite an increase in the number of prescriptions by over 10%2. The
use of both statins and antihypertensive drugs for the secondary prevention of coronary heart
disease is recommended in the National Service Framework for Coronary Heart Disease, so it is
likely there will continue to be increases in their use.
OperationsThe number of operations carried out to treat CHD has increased. The amount of coronary artery
bypass surgery (CABG) has increased six fold since 1980 and by around a third between 1993 and
2003. Just under 29,000 operations for CABG were carried out in the UK in 2003 (Table 3.3).
The number of percutaneous coronary interventions (PCI) is increasing at an even faster rate and
over 70,000 are now carried out annually in the UK. This represents a four fold increase over
the last decade and a 12% increase between 2004 and 2005 (Table 3.4 and Figure 3.4).
Rates of CABG and PCI vary substantially across the UK. Maps of coronary revascularisation rates
for men and women by local authority in England in 2002 show a greater than six fold difference
between the lowest and highest rates. These rates varied in men from 57 per 100,000 population
in the Isle of Wight to 342 per 100,000 in Watford and in women from 21 per 100,000 in the
Isle of Wight to 137 per 100,000 in Teesdale3. These maps and associated tables are available
at www.heartstats.org/chd_atlas.
British HeartFoundation
Statistics Databasewww.heartstats.org
66
In addition to coronary revascularisation operations, there were 128 heart transplants carried
out in 2002/03 and 19 heart and lung transplants4.
Inpatient hospital casesOverall, there were around 428,000 inpatient cases treated for CHD in National Health Service
hospitals in 2005/06 (Table 3.5). These represent 5% of all inpatient cases in men and 2% in
women (Figures 3.5a and 3.5b).
The number of inpatient cases treated for CHD has increased by over 13% in the last five
years5.
Staffing levelsIn 2002, a report on the provision of services for patients with heart disease in the UK claimed
a shortage of all types of health care professionals involved in cardiovascular care6. However,
since then the numbers of consultant cardiologists and cardiothoracic surgeons have increased
considerably. The number of cardiologists working in the NHS increased by just under 50%
between September 1999 and March 2004, from 467 to 685. Over the same period the number
of consultant cardiothoracic surgeons increased by 19%, from 182 to 2177. It is estimated that
between 1200 and 1500 consultant cardiologists will be needed by 20106.
International differencesRates of coronary revascularisation and other procedures for CHD vary widely across Europe.
Data from the European Society of Cardiology from around 2000 show that rates of procedures
for CHD were lower in the UK than in many other European countries. For example, in Finland
the rate of CABG was over twice as high and in Germany the rate of PCI around four times as
high as those found in the UK (Table 3.6). When the rates of coronary procedures in 2000 were
adjusted for incidence of CHD, the UK had a lower rate of PCI and a slightly higher rate of
CABG than might be expected (Figures 3.6a and 3.6b).
While rates of PCI have increased significantly across Europe since the 1990s, in the UK this
increase has not been as rapid as in many other countries, for example, Italy, Sweden and Germany
(Table 3.7and Figure 3.7).
National Service Framework prioritiesThe National Service Framework (NSF) outlined a series of priorities, milestones and goals to be
achieved to improve service quality, tackle variations in care and reduce the number of deaths
over a ten-year period.
The NSF for CHD set three immediate priorities to be achieved by April 2001. These were the
introduction of specialist smoking cessation clinics by health authorities to help 150,000 people
quit smoking; the setting up of 50 rapid-access chest pain clinics to assess people with new
symptoms for angina within two weeks of referral; and the reduction of call-to-needle times
for thrombolysis for heart attacks, by improving ambulance response times and increasing the
proportion of accident and emergency (A&E) departments able to provide thrombolysis.
Between April 2000 and March 2001, just over 132,000 people in England had set a quit date
through smoking cessation services. Around 64,000 (49%) of those setting a quit date reported
British HeartFoundation
Statistics Databasewww.heartstats.org
67
that they were not smoking four weeks after their quit date. The numbers attending smoking
cessation clinics have risen to over 600,000 in 2005/06, with around 330,000 (55%) reporting
success at four weeks (Table 3.8)8,9. There has been £138 million invested in smoking cessation
between 2003/04 and 2005/06, with a target of 800,000 successful quitters at the four-week follow
up during this three-year period8. This target was achieved, with over 830,000 successful quitters
during this period. Statistics from 2004/05 and 2005/06 show that around half of Northern Irish
smokers who set a quit date have successfully quit at the four-week follow up (Table 3.8).
By June 2001, 150 rapid-access chest pain clinics were open across England10.
In 2000/01, of the 32 ambulance services in England, just three achieved the goal set in the NSF,
that is 75% of category A (immediately life threatening) calls responded to within 8 minutes11.
By 2005/06, 25 out of 31 ambulance services (81%) had achieved this goal (Table 3.9).
The NSF further outlined a number of priorities to be achieved by April 2002. These were to
increase to 75% the proportion of heart attack patients receiving thrombolysis within 30 minutes of
arriving at hospital; to improve the use of effective medicines after heart attack so that 80 to 90%
of people discharged from hospital following a heart attack are prescribed aspirin, beta-blockers
and statins; and to increase the total number of revascularisation procedures by 3,000.
Data from the National Audit of Myocardial Infarction Project (MINAP)12 show that by April
2002, 59% of eligible heart attack patients were receiving thrombolysis within 30 minutes of
arriving in hospital. By the end of 2003 this had risen to 81% of eligible heart attack patients,
with quarter by quarter improvements7. In 2005/06, the level in England was approximately
83% (Table 3.10).
MINAP data further show that in 2005/06, at least 97% of people discharged from hospital
following a heart attack in England and Wales were prescribed aspirin, 91% beta blockers and
94% statins (Table 3.10)13,14.
The NSF also outlined the importance of cardiac rehabilitation. It set an overall goal that in every
hospital over 85% of people discharged with a primary diagnosis of heart attack or after coronary
revascularisation should be offered cardiac rehabilitation. Data from the British Association of
Cardiac Rehabilitation show that the current rate of provision is well below the goal set by the
NSF. In 2003/04, only around one third of people discharged from hospital in England after a
heart attack or coronary revascularisation received cardiac rehabilitation15. The rate of provision
varied substantially across the country with the lowest levels found in London (Table 3.11).
In 2005 the Healthcare Commission published a national review of the NSF16. This concluded
that at the half way point in its implementation, the NSF for Coronary Heart Disease has led to
significant improvements. These include faster treatment of heart attack patients, higher numbers
of revascularisation operations performed with shorter waiting times, and the setting up of
rapid access chest pain clinics across the country to improve the speed with which people with
suspected angina can be assessed. However, the review acknowledges that there are a number
of standards where progress has been slower. Three particular areas are highlighted as needing
further attention: preventing heart disease, the treatment and care of patients with heart failure
and cardiac rehabilitation. The Healthcare Commission will be developing indicators in these
areas to measure future progress.
British HeartFoundation
Statistics Databasewww.heartstats.org
68
�. Department of Health (�000) National Service Framework for Coronary Heart Disease. The Stationery Office: London.
�. Office for National Statistics (�006). Prescriptions dispensed in the community. Statistics for �995 to �005: England. The Information Centre: London.
�. Otreba P, Rayner M, Hill A, Goldacre M (�00�) An atlas of coronary heart disease mortality, hospital admissions and coronary revascularisations in South East England. SEPHO: Oxford. This publication contains maps of CHD mortality, hospital admissions and coronary revascularisations by local authority across England as well as the South East Region. See www.heartstats.org/chd_atlas
4. Society of Cardiothoracic Surgeons of Great Britain and Ireland (�004) Fifth National Adult Cardiac Surgical Database Report: Improving outcomes for patients. Dendrite Clinical Systems Ltd: Henley.
5. In �000/�00�, the number of inpatient cases for CHD was �78,5�� in National Health Service hospitals in England. See Table �.5 in Petersen S, Peto V and Rayner M (�00�) Coronary heart disease statistics. British Heart Foundation: London.
6. Fifth report on the provision of services for patients with heart disease. Heart �00�; 88(Suppl III):iii�-iii59.
7. Department of Health (�004) Winning the War on Heart Disease. The Stationery Office: London. See www.dh.gov.uk/assetRoot/04/07/7�/58/04077�58.pdf
8. Department of Health Statistical Bulletin (�005) Statistics on smoking cessation services in England, April �004 to March �005, and earlier editions. See www.dh.gov.uk/assetRoot/04/�0/4�/55/04�04�55.pdf
9. Four week self-reported quit rates only give an indication of the true short-term quit rates achieved by smoking cessation services. In �00�/04, carbon monoxide (CO) validation was offered to clients of smoking cessation services as a tool to aid smoking cessation. Around 70% of those who reported having successfully quit smoking at the 4-week follow-up had the level of carbon monoxide in their bloodstream measured. In 88% of cases this test confirmed they were not smoking at 4-weeks. Longer term success rates are currently unknown.
�0. Department of Health Heart Team, personal communication.
��. Department of Health Statistical Bulletin (�005) Ambulance services, England: �004-�005. See www.dh.gov.uk
��. Currently ��0 hospitals contribute to the MINAP database, all but one of the hospitals treating heart attacks in England and Wales. Data are collected on patients with all types of acute coronary disease.
��. These percentages have risen since �00�. The equivalent figures for January to November �00� were 8�% prescribed aspirin, 6�% beta blockers and 8�% statins. See Table �.9 in Petersen S, Peto V and Rayner M (�00�) Coronary heart disease statistics. British Heart Foundation: London.
�4. For more results from the MINAP project, including hospital level data, see Royal College of Physicians (�004) How Hospitals Manage Heart Attacks. Third Public Report of the Myocardial Infarction National Audit Project. Royal College of Physicians: London. Also available at www.rcplondon.ac.uk/pubs/books/minap04/index.htm.
�5. The British Association of Cardiac Rehabilitation Database annually surveys all centres providing cardiac rehabilitation in the UK. In �00�/04, data on cardiac rehabilitation provision were reported by ��9 of the �55 English centres. The figures in Table �.�0 have been adjusted upwards to take into account non-responders to the survey. Before adjustment, the numbers receiving cardiac rehabilitation in England in �00�/04 were �6,458, representing almost �0% of those discharged from hospital with a diagnosis of heart attack or after coronary revascularisation.
�6. Commission for Healthcare Audit and Inspection (�005) National service framework report. Getting to the heart of it. Coronary heart disease in England: a review of progress towards national standards. Summary report. Healthcare Commission: London.
British HeartFoundation
Statistics Databasewww.heartstats.org
69
Table �.� National Service Framework (NSF) for Coronary Heart Disease: Standards and Quality Requirements table, England
NSF Area NSF Standard/Quality Requirement1
Reducing heart disease 1. The NHS and partner agencies should develop, implement andin the population monitor policies that reduce the prevalence of coronary risk factors
in the population, and reduce inequalities in risks of developing heart disease.
2. The NHS and partner agencies should contribute to a reduction in the prevalence of smoking in the local population.
Preventing CHD in 3. General practitioners and primary care teams should identify allhigh risk patients people with established cardiovascular disease and offer them comprehensive advice and appropriate treatment to reduce their risks.
4. General practitioners and primary care teams should identify all people at significant risk of cardiovascular disease but who have not developed symptoms and offer them appropriate advice and treatment to reduce their risks.
Heart attack and other 5. People with symptoms of a possible heart attack should receiveacute coronary help from an individual equipped with and appropriately trainedsymptoms in the use of a defibrillator within 8 minutes of calling for help, to
maximise the benefits of resuscitation should it be necessary.
6. People thought to be suffering from a heart attack should be assessed professionally and, if indicated, receive aspirin. Thrombolysis should be given within 60 minutes of calling for professional help.
7. NHS Trusts should put in place protocols/systems of care so that people admitted to hospital with a proven heart attack are appropriately assessed and offered treatments of proven clinical and cost effectiveness to reduce their risks of disability and death.
Stable angina 8. People with symptoms of angina or suspected angina should receive appropriate investigation and treatment to relieve their pain and reduce their risk of coronary events.
Revascularisation 9. People with angina that is increasing in frequency or severity should be referred to a cardiologist urgently or, for those at greatest risk, as an emergency.
10. NHS Trusts should put in place hospital-wide systems of care so that patients with suspected or confirmed coronary heart disease receive timely and appropriate investigation and treatment to relieve their symptoms and reduce their risk of subsequent coronary events.
Heart failure 11. Doctors should arrange for people with suspected heart failure to be offered appropriate investigations (e.g. electrocardiography, echocardiography) that will confirm or refute the diagnosis. For those in whom heart failure is confirmed, its cause should be identified – treatments most likely to both relieve their symptoms and reduce their risk of death should be offered.
British HeartFoundation
Statistics Databasewww.heartstats.org
70
Cardiac rehabilitation 12. NHS Trusts should put in place agreed protocols/systems of care so that, prior to leaving hospital, people admitted to hospital suffering from coronary heart disease have been invited to participate in a multidisciplinary programme of secondary prevention and cardiac rehabilitation receive appropriate investigation and treatment to relieve their pain and reduce their risk of coronary events. The aim of the programme will be to reduce risk of subsequent cardiac problems and to promote their return to a full and normal life.
Arrhythmias and 13. People with arrhythmias should receive timely and high qualitysudden cardiac death support and information, based on an assessment of their needs.
People presenting with arrhythmias, in both emergency and elective settings, should receive timely assessment by an appropriate clinician to ensure accurate diagnosis and effective treatment and rehabilitation. When sudden cardiac death occurs, NHS services should have systems in place to identify family members at risk and provide personally tailored, sensitive and expert support, diagnosis, treatment, information and advice to close relatives.
�. An extra chapter on arrhythmias and sudden cardiac death was added to the National Service Framework in �005. This outlined three quality requirements for improving care in this area. Chapters in the original NSF document had outlined standards rather than quality requirements. This table combines the two.
Source: Department of Health (�000) Coronary Heart Disease National Service Framework. The Stationery Office: London.
Department of Health (�005) Coronary Heart Disease National Service Framework. Chapter Eight. Arrhythmias and Sudden Cardiac Death. The Stationery Office: London.
British HeartFoundation
Statistics Databasewww.heartstats.org
7�
Tabl
e �.
� Pr
escr
iptio
ns u
sed
in th
e pr
even
tion
and
trea
tmen
t of a
ll di
seas
es o
f the
cir
cula
tory
syst
em, �
98�
to �
005,
E
ngla
ndPr
escr
iptio
ns (t
hous
ands
) 19
81
1986
19
91
1992
19
93
1994
19
95
1996
19
97
1998
19
99
2000
20
01
2002
20
03
2004
20
05
Dig
oxin
and
oth
er p
ositi
ve in
otro
pic
drug
s (2
.1)
4,24
3 3,
722
3,82
2 3,
816
3,82
5 3,
848
3,86
0 3,
871
3,84
3 3,
907
3,95
4 3,
983
4,03
1 4,
029
4,04
3 4,
088
4,10
3D
iure
tics
(2.2
) 20
,678
21
,996
22
,195
22
,039
22
,115
22
,521
22
,745
23
,106
23
,602
24
,313
25
,672
27
,738
30
,203
32
,185
34
,432
36
,546
37
,619
Ant
i-arr
hyth
mic
dru
gs (2
.3)
232
334
532
568
614
673
750
840
941
1,04
7 1,
138
1,21
4 1,
292
1,33
8 1,
343
1,32
5 1,
292
Beta
-adr
enor
ecep
tor
bloc
king
dru
gs (2
.4)
9,82
7 12
,525
14
,282
14
,145
14
,018
13
,997
14
,050
14
,375
14
,693
15
,319
16
,584
18
,321
20
,439
22
,439
24
,336
26
,361
27
,460
Ant
ihyp
erte
nsiv
e th
erap
y (2
.5)
4,91
2 4,
424
6,43
1 7,
281
8,41
2 9,
668
10,6
31
12,1
25
13,5
62
15,4
50
17,9
42
21,0
75
25,0
47
29,5
91
33,7
88
38,5
80
42,8
65N
itrat
es, c
alci
um b
lock
ers
and
pota
ssiu
m a
ctiv
ator
s (2
.6)
5,15
6 10
,314
16
,718
17
,857
19
,039
20
,130
21
,083
21
,971
22
,645
23
,380
24
,316
25
,394
26
,814
27
,994
29
,156
30
,715
32
,309
Sym
path
omim
etic
s (2
.7)
15
6 19
15
12
10
8
7 6
5 4
3 2
2 3
4 4
Ant
icoa
gula
nts
and
prot
amin
e (2
.8)
629
900
1,35
6 1,
489
1,68
0 1,
976
2,26
3 2,
609
2,96
3 3,
340
3,73
1 4,
152
4,60
9 4,
975
5,38
9 5,
871
6,29
4A
ntip
late
let d
rugs
(2.9
) 28
1 1,
058
3,61
9 4,
432
5,26
4 6,
451
7,61
5 9,
002
10,3
76
12,1
73
14,6
42
16,5
52
18,8
91
21,6
01
24,4
28
27,3
56
30,2
18A
nti-fi
brin
olyt
ic d
rugs
and
hae
mos
tatic
s (2
.11)
215
242
267
282
289
300
310
311
Lipi
d re
gula
ting
drug
s (2
.12)
29
5 24
7 1,
066
1,30
8 1,
515
1,74
2 2,
216
3,13
8 4,
398
5,98
2 7,
926
10,3
31
13,5
23
17,6
04
22,6
55
29,4
44
35,5
68Lo
cal s
cler
osan
ts (2
.13)
1 1
1 1
0 0
0 0
All
pres
crip
tions
for
dise
ase
of th
e ci
rcul
ator
y sy
stem
46
,267
55
,526
70
,041
72
,951
76
,495
81
,016
85
,220
91
,044
97
,029
10
5,13
1 11
6,15
2 12
9,03
0 14
5,13
4 16
2,04
6 17
9,87
2 20
0,59
8 21
8,04
3
Not
es:
BN
F co
des
in p
aren
thes
es.
T
he d
ata
up to
�99
0 ar
e no
t con
sist
ent w
ith d
ata
from
�99
� on
war
ds.
Figu
res
up to
�99
0 ar
e ba
sed
on fe
es a
nd o
n a
sam
ple
of �
in �
00 p
resc
ript
ions
dis
pens
ed b
y co
mm
unity
pha
rmac
ists
and
app
lianc
e co
ntra
ctor
s on
ly.
Figu
res
from
�99
� ar
e ba
sed
on
item
s an
d co
ver
all p
resc
ript
ions
dis
pens
ed b
y co
mm
unity
pha
rmac
ists
, app
lianc
e co
ntra
ctor
s, d
ispe
nsin
g do
ctor
s an
d pr
escr
iptio
ns s
ubm
itted
by
pres
crib
ing
doct
ors
for
item
s pe
rson
ally
adm
inis
tere
d.
Sour
ce:
Offi
ce fo
r N
atio
nal S
tatis
tics
(�00
6). P
resc
ript
ions
dis
pens
ed in
the
com
mun
ity. S
tatis
tics
for
�995
to �
005:
Eng
land
. Lon
don:
The
Inf
orm
atio
n C
entr
e, a
nd p
revi
ous
editi
ons.
British HeartFoundation
Statistics Databasewww.heartstats.org
7�
Table �.� Operations for CHD, �977 to �00�, United Kingdom
Coronary artery CABG with Procedure Total Total Total bypass another without annual mortality surgery (CABG) procedure CABG % increase (%)
All cancer (C00-D48) 751,922 768,625 1,520,547 4,304,287Colo-rectal cancer (C18-C21) 99,558 68,529 168,087 577,329Lung cancer (C33-C34) 58,163 40,177 98,340 402,356Breast cancer (C50) 737 138,008 138,745 250,222Bladder cancer (C67) 63,061 20,301 83,362 195,720
All diseases of the nervous system (G00-G99) 136,046 158,577 294,623 1,696,587
All diseases of the respiratory system (J00-J99) 473,004 449,921 922,925 4,209,931
All diseases of the digestive system (K00-K93) 755,566 778,551 1,534,117 3,670,491
All diseases of the genitourinary system (N00-N99) 356,595 557,978 914,573 2,445,532
Complications of pregnancy and childbirth (O00-O99) 0 1,338,513 1,338,513 2,002,852
Injury and poisoning (S00-T98) 495,712 465,305 961,017 5,299,181
All other diagnoses 2,597,454 3,020,700 5,618,154 21,777,607
Notes: Finished consultant episodes; ordinary admissions and day cases combined.
ICD codes (�0th revision) in parentheses.
Source: Department of Health (�006) Hospital Episode Statistics �005/06. www.hesonline.nhs.uk
British HeartFoundation
Statistics Databasewww.heartstats.org
75
Figure �.5a Inpatient cases by main diagnosis, men, National Health Service hospitals, �005/06, England
All other causes43%
Digestive system disease12%
Genitourinary disease6% Injury and poisoning
8%
Coronary heart disease 5%
Other CVD 5%
Bladder cancer 1%Lung cancer 1%
Colo-rectal cancer 2%
Stroke 1%
Respiratory disease 8%
Other cancer 8%
Nervous system disease 2%
Figure �.5b Inpatient cases by main diagnosis, women, National Health Service hospitals, �005/06, England
All other causes38%
Digestive system disease10% Genitourinary disease
7%
Injury and poisoning6%
Coronary heart disease 2%
Other CVD 4%
Lung cancer 2%Colo-rectal cancer 1%
Stroke 1%
Respiratory disease 6%
Other cancer 7%
Nervous system disease 2%
Pregnancy andchildbirth 17%
British HeartFoundation
Statistics Databasewww.heartstats.org
76
Table �.6 Rates of various procedures for treating CVD, per million population, around �000, Europe
Coronary Percutaneous Coronary Open Valve Coronary Pacemakers Implantable Angiograms coronary stents heart surgery artery bypass cardioverter interventions surgery surgery defibrillators
Notes: Data represent crude, non-standardised numbers per � million population. Rates for coronary artery bypass grafting include operations with and without valve surgery.
Data collated by the European Society of Cardiology from national registries and reports from national cardiology societies.
Source: European Society of Cardiology (�004) Personal communication.
British HeartFoundation
Statistics Databasewww.heartstats.org
77
Figure �.6a Rates of coronary artery bypass surgery, crude and adjusted for standardised mortality rates from CHD in adults aged �5 to 74, around �000, Europe
0
100
200
300
400
500
600
700
800
900
1000
Ro
man
ia
Bu
gar
ia
Mac
edo
nia
Spai
n
Latv
ia
Lith
uan
ia
Hu
ng
ary
Port
ug
al
Pola
nd
Esto
nia
Icel
and
Fran
ce
Un
ited
Kin
gd
om
Au
stri
a
Cze
ch R
epu
blic
Swit
zerl
and
Swed
en
Isra
el
Fin
lan
d
Op
erat
ion
s/m
illio
n p
op
ula
tio
n
Crude rate
Adjusted rate
Figure �.6b Rates of percutaneous coronary interventions, crude and adjusted for standardised mortality rates from CHD in adults aged �5 to 74, around �000, Europe
Crude
Adjusted
0
500
1000
1500
2000
2500
Ro
man
ia
Bu
gar
ia
Hu
ng
ary
Latv
ia
Gre
ece
Esto
nia
Mac
edo
nia
Cro
atia
Lith
uan
ia
Pola
nd
Irel
and
Port
ug
al
Un
ited
Kin
gd
om
Spai
n
Fin
lan
d
Cze
ch R
epu
blic
Den
mar
k
Swed
en
Ital
y
Net
her
lan
ds
Au
stri
a
Swit
zerl
and
Bel
giu
m
Fran
ce
Icel
and
Ger
man
y
Isra
el
Pro
ced
ure
s/m
illio
n p
op
ula
tio
n
British HeartFoundation
Statistics Databasewww.heartstats.org
78
Tabl
e �.
7 R
ates
of p
ercu
tane
ous
coro
nary
inte
rven
tions
, per
mill
ion
popu
latio
n, �
990
to �
00�,
Eur
ope
19
90
1991
19
92
1993
19
94
1995
19
96
1997
19
98
1999
20
00
2001
20
02
2003
Aus
tria
733
832
942
1,05
9 1,
040
1,29
1 1,
482
1,68
6Be
lgiu
m
1,
133
1,37
5 1,
291
1,45
9 1,
536
1,64
7C
roat
ia
55
58
82
26
0 44
3C
zech
Rep
ublic
89
112
177
338
513
637
724
899
935
958
Den
mar
k
293
429
535
730
825
Esto
nia
15
5 23
6 26
1 32
1 43
0 38
8Fi
nlan
d 13
1 17
5 21
2 27
4 31
5 35
4 41
0 43
6 49
0 60
7 64
3 65
5 1,
032
1,27
6Fr
ance
924
1,07
4 1,
200
1,32
1 1,
426
1,56
0G
erm
any
426
550
690
857
1,06
2 1,
335
1,53
3 1,
682
1,78
8 2,
024
2,19
4 2,
368
2,43
9G
reec
e
218
216
308
397
477
359
382
Hun
gary
14
34
36
64
12
4 10
0 13
4 17
0 19
5 23
1 24
9 25
6 27
6Ic
elan
d 42
4 40
7 61
7 83
0 89
1 1,
272
1,29
0 1,
377
1,65
5 1,
670
1,60
8Is
rael
464
622
999
1,20
7 1,
299
1,40
2 1,
502
2,00
6 2,
377
Ital
y 89
12
1 16
4 18
5 22
8 27
5 34
1 47
1 63
0
962
1,14
8 1,
319
Latv
ia
21
31
45
135
193
315
365
448
520
681
Lith
uani
a
111
147
203
341
424
523
Mac
edon
ia
6
26
36
113
154
157
193
415
Net
herl
ands
53
7 58
3 69
1 72
3 79
5 85
9 90
4 94
3 97
2 1,
012
1,09
1 1,
147
1,20
5Po
land
75
129
190
281
373
527
Port
ugal
49
72
69
116
176
234
303
370
459
538
Rom
ania
8 21
18
43
68
77
148
San
Mar
ino
174
261
174
332
67
8 54
9 34
7 64
8 78
9Sp
ain
92
127
173
200
266
315
382
472
512
581
612
654
Swed
en
128
206
325
418
497
547
628
686
750
857
981
1,10
2Sw
itzer
land
953
1,09
2 1,
248
1,34
1 1,
358
1,53
7Tu
rkey
80
117
157
197
242
252
UK
14
7 16
5 20
0 21
3 23
7 29
6 34
9 38
8 42
1 47
3 56
3 66
0 75
8
Not
es:
Dat
a re
pres
ent c
rude
, non
-sta
ndar
dise
d nu
mbe
rs p
er �
mill
ion
popu
latio
n.
D
ata
colla
ted
by
the
Eur
opea
n So
ciet
y of
Car
diol
ogy
from
nat
iona
l reg
istr
ies
and
repo
rts
from
nat
iona
l car
diol
ogy
soci
etie
s.
Sour
ce:
Eur
opea
n So
ciet
y of
Car
diol
ogy
(�00
4) P
erso
nal c
omm
unic
atio
n.
British HeartFoundation
Statistics Databasewww.heartstats.org
79
Figu
re �
.7
Rat
es o
f per
cuta
neou
s co
rona
ry in
terv
entio
ns p
er m
illio
n po
pula
tion,
�99
0 to
�00
�, E
urop
e
0
50
0
1,0
00
1,5
00
2,0
00
2,5
00
3,0
00
19
90
19
91
19
92
19
93
19
94
19
95
19
96
19
97
19
98
19
99
20
00
20
01
20
02
20
03
Rates of PCI/million population
Cze
ch R
ep
ub
lic
Fra
nce
Ita
lyFi
nla
nd
Ge
rma
ny
Hu
ng
ary
0
50
0
1,0
00
1,5
00
2,0
00
2,5
00
3,0
00
19
90
19
91
19
92
19
93
19
94
19
95
19
96
19
97
19
98
19
99
20
00
20
01
20
02
20
03
Rates of PCI/million population
Ne
the
rla
nd
s
Sw
ed
en
Sp
ain
UK
Po
lan
d
Ro
ma
nia
British HeartFoundation
Statistics Databasewww.heartstats.org
80
Table �.8 Outcome at 4 weeks and use of free Nicotine Replacement Therapy in people using National Health Service smoking cessation services, �999/00 to �005/06, England and Northern Ireland
Number who had sucessfully quit at 4 week 3,771 4,119follow-up (self report)
% who had successfully quit at 4 week 51% 47%follow-up (self report)
% receiving Nicotine Replacement Therapy 71% 69%
Notes: A client is counted as having successfully quit smoking at the 4 week follow-up if he/she has not smoked at all since two weeks after the quit date.
Since �004/05 ‘% receiving Nicotine Replacement Therapy’ refers to NRT obtained by prescription, purchase or supply free of charge.
Prior to �004/05 ‘% receiving Nicotine Replacement Therapy’ refers to NRT obtained free of charge.
Source: Health and Social Care Information Centre (�006) Statistics on NHS stop smoking services in England, April �005 to March �006. London: Department of Health, and previous editions. See http://www.ic.nhs.uk/pubs/sss0506/sssbull/file
Northern Ireland Statistics & Research Agency (�006) Statistics on smoking cessation services in Northern Ireland: �005/06. Belfast: Department of Health, Social Services and Public Safety.
British HeartFoundation
Statistics Databasewww.heartstats.org
8�
Table �.9 Emergency calls: responses within 8 minutes by Ambulance Service, �999/00 to �005/06, England
Ambulance Service 1999/00 2000/01 2001/02 2002/03 2003/04 2004/05 2005/06
Notes: From �00�/04 Shropshire Ambulance Services are part of West Midlands Ambulance Service.
Category A emergency incidents only. * indicates that the accuracy of the estimate is uncertain - see source for details.
Source: Office for National Statistics (�006) Ambulance services, England: �005-06. London: NHS, and previous editions
British HeartFoundation
Statistics Databasewww.heartstats.org
8�
Table �.�� Percentage of patients receiving cardiac rehabilitation after hospitalisation for heart attack, coronary artery bypass surgery or percutaneous coronary interventions by Government Office Region, �00�/04, England
Number hospitalised Number receiving cardiac % receiving cardiac for heart attack, CABG rehabilitation post heart attack, rehabilitation post heart attack,Government Office Region or PCI* CABG or PCI** CABG or PCI
North East 12,864 6,516 51North West 30,757 11,276 37Yorkshire and the Humber 20,398 5,890 29East Midlands 16,581 4,196 25West Midlands 21,372 6,906 32East of England 21,329 5,125 24London 22,484 4,872 22South East 27,928 9,373 34South West 23,692 6,636 28
England 197,405 62,495 32
Notes: * Hospital Episode Statistics
** British Association of Cardiac Rehabilitation Database, data adjusted for non-response.
Sources: Department of Health (�005) Hospital Episode Statistics, personal communication.
British Association Cardiac Rehabilitation Database (�005), personal communication.
Table �.�0 Thrombolytic treatment, use of aspirins, beta blockers and statins after a heart attack, �004/05 and �005/06, England and Wales
Percentage of patients having Percentage of patients having Percentage of patients discharged thrombolytic treatment within thrombolytic treatment within on secondary prevention medication 30 mins of arrival at hospital 60 mins of calling for help
Target 75 75 58 68 80 80 80England National Average 84 83 54 58 97 92 96Wales National Average 70 74 28 30 98 91 94
Notes: Data are from the MINAP project, based at the Royal College of Physicians. For more details of the project see www.rcplondon.ac.uk/index.asp
Source: Royal College of Physicians (�006) Myocardial Infarction National Audit Project. How the NHS manages heart attacks. Fifth public report �006. London: UCL
British HeartFoundation
Statistics Databasewww.heartstats.org
8�
4. SmokingSmoking increases the risk of CHD. The long-term risk of smoking to individuals has been
quantified in a 50-year cohort study of British doctors. The study found that mortality from CHD
was around 60% higher in smokers (and 80% higher in heavy smokers) than in non-smokers.
Observing deaths in smokers and non-smokers over a 50-year period, the study concluded “about
half of all regular smokers will eventually be killed by their habit”1.
Second hand smoke (smoke that has been exhaled by a smoker) is also harmful to cardiovascular
health. Regular exposure to second hand smoke increases the risk of CHD by around 25%2-4.
It is estimated that smoking caused about 31,000 deaths from CVD in 2000 in the UK. Overall,
around one in eight deaths from CVD were attributable to smoking. For men, the proportion of
CVD deaths attributable to smoking fell between 1995 and 2000, from 16% to 13% in England
and Wales, and from 22% to 18% in Scotland. For women, the proportion of CVD deaths
attributable to smoking fell by 1% between 1995 and 2000, from 12% to 11% in England and
Wales, and from 19% to 18% in Scotland (Table 4.2). A higher proportion of premature deaths
from CVD, around one in five, were attributable to smoking5.
Research from the World Health Organization has estimated the impact of smoking on total
disease burden (both mortality and morbidity) in terms of disability-adjusted life years (DALYs)
lost. The World Health Report 2002 estimated that in developed countries around 12% of all
disease burden and over 20% of CVD was due to smoking6.
More recently the INTERHEART case-control study estimated that 29% of heart attacks in
Western Europe were due to smoking, and that smokers and former smokers were at almost
twice the risk of a heart attack compared to never smokers7.
A systematic review of the evidence on smoking cessation in patients with CHD concluded that,
in this group, quitting smoking reduces the risk of dying by 36%8.
Public health targetsIn England, new targets for smoking were announced in 19989 which were less ambitious than the
Health of the Nation targets they replaced10 (Table 4.1). The Smoking Kills targets for smoking
among adults are to reduce rates to 26% by 2005, and 21% by 2010.
The most recent data suggest the 2005 milestone has been met in both men and women, with
overall smoking prevalence falling to 24% in 2005. The 2010 target is likely to be achieved
(Figure 4.1a)11.
The 2005 target for smoking in children has already been met and the 2010 target is also likely
to be achieved (Figure 4.1b)12.
In 2000, an inequalities target was added to the general smoking targets in England13. This aims
to reduce smoking rates among manual groups from 32% in 1998 to 26% in 2010. The latest
smoking figures indicate some progress towards this target, although 31% of men and 28% of
British HeartFoundation
Statistics Databasewww.heartstats.org
84
women in manual groups currently smoke (Table 4.7). Scotland appears to be making progress
towards the target of a reduction in the proportion of adults smoking to 22% by 2010. Smoking
prevalence among Scottish adults has reduced from 35% in 1998 to 28% in 2005.
Overall prevalence of smokingIn 2005, 25% of men and 23% of women smoked cigarettes in Great Britain (Table 4.3).
From the age-specific smoking rates in Table 4.3, we estimate that there are over 12.0 million
adult cigarette smokers in the UK today.
Age and sex differencesOverall, smoking prevalence in 2005 was higher among men than among women for all age
groups except 16 to 19 years. The greatest difference was found in those aged 25 to 34 years
where smoking rates were 34% for men and 29% for women (Table 4.3 and Figure 4.3a).
In both men and women, the proportion of adults who smoked was highest in those aged 20
to 34 years. Rates declined steadily with age and were lowest in those aged 60 and above (14%
in men and 13% in women) (Table 4.3). This pattern has only emerged since the mid-1980s
– prior to that, smoking prevalence was similar in all but the youngest and oldest age groups.
This change reflects an increase in the number of men and women aged 35 and over who have
given up smoking.
Young people and smokingIn 2006, just under one in ten young people aged 11 to 15 in England were regular smokers
(defined as usually smoking at least one cigarette per week) (Table 4.4). As in previous years, girls
were more likely to be regular smokers than boys (10% of girls compared to 7% of boys). The
proportion of regular smokers increased sharply with age in young people: 1% of 11 year olds in
England smoked regularly compared with 21% of 15 year olds14. From the age-specific rates in
England, we estimate there are over 300,000 regular smokers aged 11 to 15 in the UK today.
Temporal trendsThe highest recorded level of smoking among men in the UK was 82%, found in the first national
survey of smoking behaviour in 1948. Among women, smoking prevalence remained fairly
constant between 1948 and 1970, peaking at 45% in 196615.
The 1970s and early 1980s saw a substantial fall in the proportion of adult smokers in Great
Britain. This decline in smoking prevalence continued at a slower rate for another decade. Results
from the General Household Survey (GHS) show that since the early 1990s the decline in smoking
prevalence has levelled off and smoking rates have remained relatively stable at between 26%
and 28% (Figure 4.1a).
The decline in smoking rates over the last 30 years has been faster in men than in women,
resulting in a major narrowing of the gap between the proportions of men and women who
smoke cigarettes (Table 4.3 and Figures 4.3a and 4.3b). In 1974, for example, men were much
more likely to be smokers than women (51% of men compared to 41% of women). By 1990 the
difference in smoking prevalence had reduced to just two percentage points (31% men compared
British HeartFoundation
Statistics Databasewww.heartstats.org
85
to 29% of women), and since then there has been an excess in male smoking rates of between
1 and 4 percentage points.
The decline in smoking prevalence since the 1970s has not occurred equally across all age groups.
Smoking rates have declined most in those aged over 35 and least in younger age groups (Table
4.3).
As well as a decline in the numbers of adults smoking cigarettes there has been an overall decline in
the average number of cigarettes smoked by men. This fall in cigarette consumption has occurred
mainly in younger smokers. The number of cigarettes smoked by those aged 50 years and over
has changed very little since the mid 1970s (Table 4.5).
In teenagers, particularly girls, rates of smoking increased in England during the 1990s, peaking in
1996 (Figure 4.1b). The most recent survey data show the prevalence of regular smoking in young
people in England in 2004 was 9%, unchanged from 2003, and down from 10% in 2002 (Table
4.4). In Scotland, trend data show that while the proportion of boys who smoke has declined
from 11% in 2002 to 9% in 2004, the proportion of girls who smoke has remained unchanged
at 16%. The most recent data from Northern Ireland show a decline in smoking prevalence in
both boys and girls (Table 4.4).
National and regional differencesIn 2005, 28% of men and 25% of women in Scotland smoked, compared to 24% of men and
21% of women in Wales, 27% of men and 25% of women in Northern Ireland and 25% of
men and 22% of women in England. Smoking rates have been consistently higher in Scotland
for over 25 years (Table 4.6).
Within England, smoking prevalence rates are generally higher in the North of the country,
although this pattern is more marked in women than men (Figures 4.6a and 4.6b). In 2005, among
men, the highest proportion of smokers was found in the North East (28%) and the lowest in
the West Midlands (23%). Among women, smoking prevalence was highest in the North West
(30%) and lowest in London (20%) (Table 4.6 and Figure 4.6).
Regional patterns of smoking among young people in the UK are unclear (Table 4.4). Surveys in
each country used different methodologies.
Socio-economic differencesThere is a strong association between cigarette smoking and socio-economic position. Cigarette
smoking is more prevalent among manual social groups than among non-manual groups (Table
4.7), and is lowest among higher managerial and professional classes (Table 4.8 and Figure
4.8). In 2005, 31% of men and 28% of women in manual households smoked compared to
19% of men and 18% of women in non-manual households (Table 4.7). This class difference
has persisted since the 1990s, and recent data suggest no narrowing of the gap. However, the
introduction of a new socio-economic classification by the Office for National Statistics in 2001
makes comparisons with earlier years problematic16.
Ethnic differencesSmoking rates vary considerably between ethnic groups in the UK. In 2004, the rates for men were
particularly high in the Bangladeshi communities (40% current smokers). With the exception of
British HeartFoundation
Statistics Databasewww.heartstats.org
86
Black Caribbean (24%) and Irish women (26%) who had similar rates to women in the general
population (23%), smoking rates in ethnic minority women were very low (10% and below)
(Table 4.9 and Figure 4.9).
Chewing tobacco is consumed more often among the Bangladeshi community where 16% of
Bangladeshi women use this form of tobacco17.
International differencesTobacco is used across the world in many forms including cigarettes, chewing tobacco and snuff.
In many countries, cigarette smoking is only a small part of tobacco use, and comparable data
on tobacco use are not widely available. Recent data from the World Health Organization show
the known prevalence of adult smoking varies among men from 65% in Kazakhstan and the
Republic of Korea to 6% in Ethiopia, and among women from 57% in Lebanon to less than
1% in Algeria, Ethiopia, Egypt and Morocco (Table 4.10). Smoking rates in the UK are, by
international standards, relatively low in men (within the second lowest quintile) and relatively
high in women (within the highest quintile) (Figures 4.10a and 4.10b).
Data from the World Health Organization’s Europe Region “Health for All Database” show
that, in 2004, the overall UK adult smoking rate of 25% was below the average for the European
Union (EU-25 30%) and for Europe (2002) as a whole (29%). The decline in smoking prevalence
in the UK since the mid 1990s has been slight (2%). Cyprus, Denmark, Kazakhstan, Kyrgyzstan
and Switzerland all showed a decline of 10% or more (Table 4.11 and Figure 4.11).
�. Doll R, Peto R, Boreham J, Sutherland I (�004) Mortality in relation to smoking: 50 years’ observations on male British doctors. BMJ; ��8: �5�9-�7.
�. Law MR, Morris JK, Wald NJ (�997) Environmental tobacco smoke exposure and ischaemic heart disease: an evaluation of the evidence. BMJ; ��5:97�-80.
�. He J, Vupputuri S, Allen K, Prerost M, Hughes J, Whelton P (�999) Passive smoking and the risk of Coronary Heart Disease – a Meta-Analysis of Epidemiological Studies. New England J Med; �40: 9�0-�6.
4. For more information and statistics on secondhand smoke, see Chapter � in Petersen S and Peto V (�004) Smoking statistics. British Heart Foundation: London (also available at www.heartstats.org/smokingstatistics ).
5. Data available at www.ctsu.ox.ac.uk/~tobacco. See Table �.� in Petersen S and Peto V (�004) Smoking statistics. British Heart Foundation: London (also available at www.heartstats.org/smokingstatistics ).
6. World Health Organization (�00�) The World Health Report �00�. Reducing Risks, Promoting Healthy Life. World Health Organization: Geneva.
7. Yusaf S, Hawken S, Ounpuu S, Dans T, Avezum A, Lanas F, McQueen M, Budaj A, Pais P, Varigo J, Lisheng A, on behalf of the INTERHEART Study Investigators (�004) Effect of potentially modifiable risk factors associated with myocardial infarction in 5� countries (the INTERHEART Study): case-control study. The Lancet; �64: 9�7-95�.
8. Critchley J, Capewell S (�00�) Mortality Risk Reduction Associated With Smoking Cessation in Patients With Coronary Heart Disease: A Systematic Review. JAMA; �90: 86-97.
9. Department of Health (�998) Smoking Kills: A White paper on Tobacco. The Stationery Office: London.
�0. The Health of the Nation outlined four smoking targets: to reduce the prevalence of smoking in adults to �0% by the year �000 (from a prevalence in �990 of ��% in men and �8% in women); to reduce the consumption of cigarettes by at least 40% by the year �000 (from 98 billion manufactured cigarettes per year in �990 to 59 billion); to reduce smoking prevalence among ��-�5 year olds by at least ��% by �994 (from 8% in �988 to less than 6%) and for at least a third of women smokers to stop smoking at the start of their pregnancy by the year �000. Department of Health (�99�) The Health of the Nation. HMSO: London.
��. Smoking Kills targets were based on un-weighted GHS baseline data, but are currently monitored using weighted data. Because of this methodological change it has been suggested by the Office for National Statistics that these targets be revised upwards by one percentage point.
��. Smoking prevalence in pregnant women is measured every five years in the Infant Feeding Survey. The latest data show the prevalence of smoking in pregnant women fell from ��% in �995 to �0% in �000. If this rate of decline continues the Smoking Kills targets for smoking in pregnant women (�8% by �005 and �5% by �0�0) should be met. See www.dh.gov.uk/PublicationsAndStatistics/PressReleases/PressReleasesNotices/fs/en?CONTENT_ID=40���68&chk=Xri4zW
��. Department of Health (�000) The NHS Cancer Plan. Department of Health: London.
�4. Department of Health (�005) Smoking, drinking and drug use among young people in England in �004: Headline Figures. See www.dh.gov.uk
�5. Wald N and Nicolaides-Bouman A (�99�) UK Smoking Statistics. �nd Edition. Oxford University Press: Oxford.
�6. Smoking prevalence is also measured in the ONS Omnibus Survey. The most recent data from this source show no narrowing between �00� and �00� of the gap between manual and non-manual classes. Office for National Statistics (�004) Smoking Related Behaviour and Attitudes, �00�. The Stationery Office: London.
�7. Department of Health (�005) Health Survey for England �004. The Health of Minority Ethnic Groups - headline tables. NHS Health and Social Care Information Centre.
British HeartFoundation
Statistics Databasewww.heartstats.org
87
Table 4.� Smoking targets for the United KingdomEngland1,2,3,4
Adults To reduce adult smoking in all social classes so that the overall rate falls from 28% in 1996 to 21% or less by the year 2010
Pregnant women To reduce the percentage of women who smoke during pregnancy from 23% in 1995 to 15% by the year 2010
Children To reduce smoking among children from 13% in 1996 to 9% or less by the year 2010
Inequalities target To reduce smoking rates among manual groups from 32% in 1998 to 26% by 2010, in order to narrow the health gap
Scotland5,6
Adults
- Target To reduce the rate of smoking among adults aged 16+ from 26.5% in 2004 to 22.0% in 2010
- Inequalities target To reduce the rate of smoking among adults aged 16+, for the most deprived areas of Scotland, from 37.3.% in 2004 to 33.2% in 2008
Pregnant women
- Target To reduce the proportion of women who smoke during pregnancy from 29% to 23% between 1995 and 2005 and to 20% by 2010
- Inequalities target To reduce the rate of smoking during pregnancy, for the most deprived communities, from 35.8% in 2003 to 32.2% in 2008
Young people
- Target To reduce smoking among young people aged 12-15 years, from 14% to 12% between 1995 and 2005 and to 11% by 2010
Wales7 No target set
Northern Ireland8
Adults To increase the proportion of the adults who do not smoke cigarettes from 73% in 2000/01 to 75% by the year 2006/07
Pregnant women To increase the proportion of pregnant women who do not smoke from 78% in 2000 to 82% by the year 2005
Children To increase the proportion of the population aged 11-16 who do not smoke cigarettes from 86.5% in 2000 to 89% by the year 2006
Inequalities target To increase the proportion of non-smokers in manual groups from 65% in 2000/01 to 69% in 2006/07
�. Department of Health (�998) Smoking Kills: A White Paper on Tobacco. HMSO: London.
�. Department of Health (�000) The NHS Cancer Plan. Department of Health: London.
4. Department of Health Public Service Agreement (�004) http://www.dh.gov.uk/assetRoot/04/08/67/8�/0408678�.pdf
5. Scottish Executive (�004) Building a Better Scotland. Spending Proposals �005-�008: Enterprise, Opportunity and, Fairness. The Scottish Executive: Edinburgh
6. Scottish Executive (�004) A Breath of Fresh Air for Scotland. Improving Scotland’s Health: the challenge tobacco control action plan. The Scottish Executive: Edinburgh
7. The Welsh Assembly Government is currently developing new determinants of health indicators. The first stage of this work is underway and includes a focus on CHD. See the Chief Medical Officer Wales website www.cmo.wales.gov.uk/content/work/health-gain-targets/determinants-of-health-e.htm
8. DHSSPSNI (�00�) Investing for Health. A five year tobacco action plan: consultation document. http://www.dhsspsni.gov.uk/publications/�00�/tobacco_plan.pdf
British HeartFoundation
Statistics Databasewww.heartstats.org
88
Figure 4.�a Cigarette smoking by sex, adults aged �6 and over, �97� to �005, England with “Smoking Kills” national targets
Source: Office for National Statistics (�006) Results from the �005 General Household Survey. The Stationery Office: London and previous editions.
Source: Office for National Statistics (�005) Smoking , drinking and drug use among young people in England in �004: Headline Figures. See www.dh.gov.uk
British HeartFoundation
Statistics Databasewww.heartstats.org
89
Table 4.� Smoking-attributed deaths by cause, sex and age, �995 and �000, England and Wales, and Scotland
Males Females
YEAR AGE All causes All Vascular All causes All Vascular cancers disease cancers disease
Notes: To be conservative, no deaths before age �5 were attributed to smoking
Source: Peto R, Lopez AD, Boreham J and Thun M. (�006) Mortality from smoking in developed countries (�nd Ed). Oxford University Press, Oxford. Also see: www.deathsfromsmoking.net
British HeartFoundation
Statistics Databasewww.heartstats.org
90
Tabl
e 4.
� C
igar
ette
sm
okin
g by
sex
and
age
, �97
� to
�00
5, G
reat
Bri
tain
19
72
1974
19
76
1978
19
80
1982
19
84
1986
19
88
1990
19
92
1994
19
96
1998
20
00
2001
20
02
2003
20
04
2005
%
%
%
%
%
%
%
%
%
%
%
%
%
%
%
%
%
%
%
%
MEN
16-1
9 43
42
39
35
32
31
29
30
28
28
29
28
26
30
30
25
22
27
23
23
20-2
4 5
5 52
47
45
44
41
40
41
37
38
39
40
43
42
35
40
37
38
36
34
25-3
4 56
56
48
48
47
40
40
37
37
36
34
34
38
37
39
38
36
38
35
34
35-4
9 55
55
50
48
45
40
39
37
37
34
32
31
30
32
31
31
29
32
31
29
50-5
9 54
53
49
48
47
42
39
35
33
28
28
27
28
27
27
26
27
26
26
25
60+
47
44
40
38
36
33
30
29
26
24
21
18
18
16
16
16
17
16
15
14
All
men
52
51
46
45
42
38
36
35
33
31
29
28
29
28
29
28
27
28
26
25
Unw
eigh
ted
base
�0
,�5�
9,
85�
�0,8
88
�0,4
80
�0,4
54
9,�9
9 8,
4�7
8,87
4 8,
67�
8,�0
6 8,
4�7
7,64
� 7,
�7�
6,57
9 6,
59�
7,05
5 6,
8�7
8,09
7 6,
868
�0,0
�8W
eigh
ted
base
(000
s)
�0,�
50
�9,9
��
�9,5
6�
�9,�
87
�9,5
6�
�9,4
96
WO
MEN
16-1
9 39
38
34
33
32
30
32
30
28
32
25
27
32
31
28
31
29
25
25
26
20-2
4 48
44
45
43
40
40
36
38
37
39
37
38
36
39
35
35
38
34
29
30
25-3
4 49
46
43
42
44
37
36
35
35
34
34
30
34
33
32
31
33
31
28
29
35-4
9 48
49
45
43
43
38
36
34
35
33
30
28
30
28
27
28
27
28
28
26
50-5
9 47
48
46
42
44
40
39
35
34
29
29
26
26
27
28
25
24
23
22
23
60+
25
26
24
24
24
23
23
22
21
20
19
17
19
16
15
17
14
14
14
13
All
wom
en
41
41
38
37
37
33
32
31
30
29
28
26
28
26
25
26
25
24
23
23
Unw
eigh
ted
base
��
,�4�
��
,480
��
,554
��
,�56
��
,�00
�0
,64�
9,
788
�0,�
04
�0,�
��
9,44
5 9,
764
9,�0
8 8,
50�
7,8�
0 7,
496
8,�9
9 7,
95�
9,��
7 8,
0�9
��,6
�7W
eigh
ted
base
(000
s)
��,0
44
��,9
87
��,�
�6
��,8
4�
��,�
96
��,�
�5
TO
TAL
16-1
9 41
40
37
34
32
30
31
30
28
30
27
27
29
31
29
28
25
26
24
24
20-2
4 51
48
46
44
42
40
38
39
37
38
38
39
39
40
35
37
38
36
32
32
25-3
4 52
51
46
45
45
38
38
36
36
35
34
32
36
35
35
34
34
34
31
31
35-4
9 51
52
47
45
44
39
37
36
36
34
31
30
30
30
29
29
28
30
29
27
50-5
9 50
51
47
45
45
41
39
35
33
29
29
27
27
27
27
26
26
25
24
24
60+
34
34
31
30
29
27
26
25
23
21
20
17
18
16
16
17
15
15
14
14
All
adul
ts
46
45
42
40
39
35
34
33
32
30
28
27
28
27
27
27
26
26
25
24
Unw
eigh
ted
base
��
,494
��
,���
��
,44�
��
,6�6
��
,554
�9
,840
�8
,�05
�9
,�78
�8
,795
�7
,55�
�8
,�8�
�6
,750
�5
,67�
�4
,409
�4
,089
�5
,�54
�4
,788
�7
,4�4
�4
,897
��
,665
Wei
ghte
d ba
se (0
00s)
4�
,�94
4�
,899
4�
,798
4�
,0�9
4�
,957
4�
,8��
Not
es:
From
�00
0 da
ta a
re w
eigh
ted
for
non-
resp
onse
. Pre
-�00
0 da
ta a
re u
nwei
ghte
d. T
he e
ffec
t of w
eigh
ting
on s
mok
ing
data
app
ears
slig
ht: i
t inc
reas
ed th
e ov
eral
l pre
vale
nce
of s
mok
ing
in �
000
by o
ne p
erce
ntag
e po
int,
from
�6%
to �
7%.
Fr
om �
000,
the
wei
ghte
d ba
se is
the
base
for
perc
enta
ges.
For
�97
�-�9
98, t
he u
nwei
ghte
d sa
mpl
e is
the
base
for
perc
enta
ges.
Sour
ce:
Offi
ce fo
r N
atio
nal S
tatis
tics
(�00
6) R
esul
ts fr
om th
e �0
05 G
ener
al H
ouse
hold
Sur
vey
(ww
w.o
ns.g
ov.u
k/gh
s) a
nd p
revi
ous
year
s.
British HeartFoundation
Statistics Databasewww.heartstats.org
9�
Figure 4.�a Prevalence of cigarette smoking by sex and age, �005, Great Britain
0
5
10
15
20
25
30
35
40
16-19 20-24 25-34 35-49 50-59 60+
Age
Cig
aret
te s
mo
kers
(%)
MenWomen
Figure 4.�b Prevalence of cigarette smoking by sex, �97� to �005, Great Britain
�005 data includes last quarter of �004/05 data due to survey change from financial year to calendar year.
From �998 data are weighted for non-response. Pre-�998 data are unweighted. This table shows weighted and unweighted figures for �998 to give an indication of the effect of the weighting.
From �998, the weighted base is the base for percentages. Up to �996, the unweighted samples are the base for percentages. Unweighted samples for earlier years are of similar size to the unweighted sample and can be found in General Household Reports for each year.
Figures for �00� to �005 are based on the new NS-SEC classification recoded to produce manual or non-manual socio-economic group and should therefore be treated with caution.
For similar trend data for Great Britain �97�-�00�, see www.heartstats.org
Source: Office for National Statistics (�006) Results from the �005 General Household Survey (www.ons.gov.uk/ghs) and previous years.
Figure 4.7 Cigarette smoking by sex and social class, �99� to �005, England
0
10
20
30
40
1992 1993 1994 1995 1996 1997 1998
Unweighted data
% s
mo
kin
g c
igar
ette
s
1998 1999 2000 2001 2002 2003 2004 2005
Weighted data
MenWomen
Manual
Non- manual
British HeartFoundation
Statistics Databasewww.heartstats.org
97
Table 4.8 Cigarette smoking by sex and socio-economic classification, �005, Great Britain
Socio-economic classification of Men Women Allthe household reference person % % %
Managerial and professional 18 16 17 Large employers and higher managerial 16 14 15 Higher professional 14 10 12 Lower managerial and professional 21 19 20
Intermediate 24 21 22 Intermediate 22 19 20 Small employers and own account 26 24 25
�005 data includes last quarter of �004/05 data due to change from financial year to calendar year.
From April �00� the National Statistics Socio-economic classification (NS-SEC) was introduced for all official statistics and surveys. It has replaced Social Class based on Occupation and Socio-economic Groups. Persons whose household reference person was a full-time student, had an inadequately described occupation, had never worked or was long term unemployed are not shown as separate categories but are included in the figure for all persons.
Source: Office for National Statistics (�006) Results from the �005 General Household Survey (www.ons.gov.uk/ghs) and previous years.
Figure 4.8 Cigarette smoking by sex and socio-economic classification, �005, Great Britain
0
5
10
15
20
25
30
35
Managerial & Professional Intermediate Routine & Manual
Socio-economic classification
% s
mo
kin
g
MenWomen
British HeartFoundation
Statistics Databasewww.heartstats.org
98
Table 4.9 Cigarette smoking by sex and ethnic group, �004, England
General Black Black Indian Pakistani Bangladeshi Chinese Irish population Caribbean African
Current cigarette smokers % % % % % % % %
MEN 24 25 21 20 29 40 21 30
Base 45,65� 47� �66 899 4�� �7� �50 �,77�
WOMEN 23 24 10 5 5 2 8 26
Base 48,�57 658 464 �,06� 490 �97 �6� �,�6�
Notes: Adults aged �6 and over.
Age-standardised percentages (standardised risk ratios x percentage in general population); see source for method of age-standardisation.
Source: Department of Health (�005) Health Survey for England �004. The Health of Minority Ethnic Groups. http://www.ic.nhs.uk/pubs/hlthsvyeng�004ethnic
Figure 4.9 Cigarette smoking by sex and ethnic group, �004, England
MenWomen
0
5
10
15
20
25
30
35
40
45
Generalpopulation
BlackCaribbean
Black African Indian Pakistani Bangladeshi Chinese Irish
% c
urr
ent
cig
aret
te s
mo
kers
British HeartFoundation
Statistics Databasewww.heartstats.org
99
Table 4.�0 Prevalence of smoking, latest available data, �995 to �004, all available countries, the World
Region Country Study year Men Women Both % % %
African Region Algeria 2003 32 <1 13 Benin 2001 3 Burundi 1995 16 11 Cameroon 2000 9 1 Congo 2004 8 Eritrea 2004 7 Ethiopia 2003 6 <1 Gambia 1996/1997 39 4 Ghana 2003 7 1 Kenya 2004 21 1 Malawi 2003 21 5 Mauritius 2003 32 1 Nigeria 2003 1 Rwanda 2000 8 Sao Tome and Principe 1997 29 14 25 South Africa 2002/2003 23 8 Swaziland 2003 11 3 Uganda 2001/2002 25 3 United Rep. of Tanzania 1998/1999 23 1 Zambia 2001/2002 26 3 Zimbabwe 2003 20 2
Region of the Americas Argentina 2004 32 25 29 Bolivia 1998 38 19 27 Brazil 2003 22 14 Canada 2003 19 16 18 Chile 2003 48 37 42 Costa Rica 2000 23 8 16 Cuba 1995 48 26 37 Dominican Republic 2003 16 11 Guatemala 2000 21 2 Haiti 2000 16 4 Jamaica 1994/1995 38 12 23 Mexico 2002/2003 13 5 Nicaragua 2001 5 Paraguay 2003 23 7 Peru 2002/2003 53 24 38 USA 2002/2003 20 16 18 Uruguay 2003 35 24 Venezuela 1997 28 24 26
European average �� �� �0 �0 �0 �0 �0 �9EU-�5 average �0 �� �0 �0 �0 �� �� �0 �� �0
Source: World Health Organization (�006) European Health for All statistical database. http://www.euro.who.int/hfadb.
Office for National Statisitics (�005) Living in Britain. Results from the �004 General Household Survey. The Stationery Office: London.
British HeartFoundation
Statistics Databasewww.heartstats.org
�04
Figu
re 4
.��
Perc
enta
ge r
egul
ar d
aily
sm
oker
s by
cou
ntry
, adu
lts a
ged
�5 y
ears
and
ove
r, la
test
ye
ar b
etw
een
�997
and
�00
5, s
elec
ted
Eur
opea
n co
untr
ies
051015202530354045
Albania (00)
Bosnia and Herzegovina (02)
Greece (00)
Andorra (02)
Macedonia, FYR (99)
Russian Federation (04)
Serbia and Montenegro (05)
Armenia (01)
Germany (03)
Hungary (03)
Ukraine (05)
Bulgaria (01)
Poland (04)
Luxembourg (04)
Netherlands (04)
Turkey (03)
France (03)
Latvia (04)
EU-25 average (04)
Austria (00)
European average (02)
Croatia (03)
Estonia (04)
Georgia (01)
Slovakia (04)
Spain (03)
Azerbaijan (97)
Belarus (03)
Lithuania (04)
Denmark (04)
Norway (04)
Czech Republic (04)
Israel (04)
United Kingdom (04)
Cyprus (03)
Ireland (05)
Italy (02)
Slovenia (01)
Finland (04)
Kazakhstan (04)
Malta (02)
Switzerland (04)
Portugal (99)
Romania (03)
Belgium (03)
Iceland (04)
Kyrgyzstan (05)
Sweden (04)
Late
st a
vaila
ble
dat
a b
etw
een
19
97
-20
05
% regular daily smokers
British HeartFoundation
Statistics Databasewww.heartstats.org
�05
5. DietIt is now universally recognised that a diet which is high in fat, particularly saturated fat, sodium
and sugar and which is low in complex carbohydrates, fruit and vegetables increases the risk of
chronic diseases – particularly cardiovascular disease (CVD) and cancer. These risks are outlined
in the World Health Organization 2003 report Diet, nutrition and the prevention of chronic
diseases1. The more recent World Health Organization Global strategy on diet, physical activity
and health emphasised further the need to improve diets in individuals and populations across
the world2.
The dietary changes which would help to reduce rates of coronary heart disease (CHD) in the
UK population were detailed in the 1994 report of the Government’s Committee on the Medical
Aspects of Food and Nutrition Policy (COMA)3. This recommended a reduction in fat intake,
particularly saturated fat intake, a reduction in sodium intake and an increase in fruit and
vegetable and complex carbohydrate intake. In the 2003 report Salt and Health, the Scientific
Advisory Committee on Nutrition (SACN) (which replaced COMA in 2000) repeated COMA’s
guidance on salt intake in adults and introduced additional guidance on reducing salt intake in
children4. In 2005 the Government dietary objectives were reiterated in Choosing a Better Diet:
a food and health action plan5.
Research from the World Health Organization and others highlight the specific importance
of low fruit and vegetable consumption as a cause of CHD. The World Health Report 2002
estimated that around 4% of all disease burden in developed countries was caused by low fruit
and vegetable consumption, and that just under 30% of CHD and almost 20% of stroke in
developed countries was due to fruit and vegetable consumption levels below 600g/day6. The
World Health Organization has yet to calculate the precise proportion of the disease burden due
to high sodium intake or high saturated fat intake.
Public health targetsThere are a number of public health targets and objectives for healthy diets in England, Wales and
Scotland, but none have been set for Northern Ireland (Table 5.1). Progress towards the targets
for saturated fat, total fat, sugar, fibre and fruit and vegetable consumption has been limited
(Table 5.2 and Figures 5.2a and 5.2b).
Overall levels of consumption – sex and age differencesLevels of consumption of food and nutrients are fairly difficult to assess. The National Diet and
Nutrition Survey (NDNS) provides data on food and nutrient consumption collected using a
seven-day food diary. The 2000/01 NDNS suggested that the percentage of food energy derived
from fat was around 36% in men and 35% in women compared with COMA’s recommendation
of 35%, and from saturated fat it was just over 13% for both men and women (compared with
the recommendation of 11%). In 2000/01 the NDNS reported that, on average, both men and
women consumed fewer than three portions of fruit and vegetables a day – 2.7 for men and 2.9
for women (Table 5.3).
British HeartFoundation
Statistics Databasewww.heartstats.org
�06
Overall, just 13% of men and 15% of women consumed the recommended five or more portions
of fruit and vegetables a day. These proportions increased with age: none of the men and just 4%
of the women aged 19 to 24 years surveyed in the NDNS consumed five or more portions of fruit
and vegetables, compared with 24% of men and 22% of women aged 50 to 64 years7.
The NDNS used 24-hour urine collections to determine salt intake. Data from 2000/01 suggest
that the average daily salt intake for men was 11.0g and for women 8.1g, both exceeding the
SACN target of no more than 6g a day (Table 5.3 and Figure 5.3).
Temporal trendsData from the National Food Survey (up to 2000) and the more recent Expenditure and Food
Survey (2001/02 onwards) allow us to look at general trends in the British diet over time.
The percentage of total energy derived from total fat in the British diet is decreasing, but only
gradually, from around 40% in 1975 to just less than 37% in 2004/05. The type of fat eaten
has changed more significantly. The proportion of total energy derived from saturated fat fell
from around 19% in 1975 to just less than 15% in 2004/05. Consumption of both non-milk
extrinsic sugars (NME sugars)8 and fibre has not changed markedly in the last ten years (Table
5.2 and Figure 5.2a).
The trends in fat consumption are associated with changes in food purchasing patterns. Since the
1970s there have been falls in the consumption of many different types of foods with a relatively
high total fat and saturated fat content, including whole milk and butter. There have also been
increases in the consumption of foods which are relatively low in total fat and/or saturated fat
such as reduced fat milks and spreads (Table 5.4 and Figures 5.4a and 5.4b).
Data from the Expenditure and Food Survey show that between 1975 and 2004/05 the combined
consumption of fruit and vegetables rose only slightly9. Data from the National Food Survey and
the Expenditure and Food Survey suggest that the total consumption of fresh fruit had increased
around fourfold since the early 1940s, but total consumption of fresh vegetables had declined
(Table 5.4 and Figure 5.4c).
Trends in the consumption of salt are harder to assess than for other nutrients. Data from the
National Food Survey suggest that the consumption of salt added to cooking and at the table
has declined considerably over the last half century. However, this does not mean that total salt
intake has declined because around 75% of dietary salt in the UK is obtained from manufactured
foods10, and the reliance on some such foods – particularly convenience foods that are often high
in salt – has increased in recent years. Between 1986 and 2001 the National Diet and Nutrition
Survey shows that there has been an increase in the average salt consumption of men (up by 9%
from 10.1g to 11.0g) and women (up by 5% from 7.7g to 8.1g) (Table 5.5).
Children and young people The 2005 Health Survey for England assessed fruit and vegetable consumption in children aged
5 to 15 years. Overall, only 17% of both boys and girls reported eating the recommended five
portions of fruit and vegetables daily. There was very little change in the amount of fruit and
vegetables consumed by children between 2001 and 2004, but results for 2005 seem more
promising (Table 5.6).
British HeartFoundation
Statistics Databasewww.heartstats.org
�07
In the UK school meals contribute significantly to the diets of children. Primary and secondary
school meals in England were recently compared with the Caroline Walker Trust guidelines for
healthy school meals11. Primary schools meals were found to be broadly in line with the guidelines.
In secondary schools, however, the average nutritional content of the consumed meals failed to
meet the guidelines for fat, saturated fat, non-milk extrinsic sugars and fibre (Table 5.7).
National and regional differencesThe 2004/05 Expenditure and Food Survey shows that people in Northern Ireland, Scotland,
Wales and the North of England consumed less fruit and vegetables than those in the South East,
South West, East or London. For example, people living in the South West consumed nearly
50% more fruit and vegetables (excluding potatoes) than people living in Northern Ireland. The
consumption of table salt varied widely in the UK. Within England salt consumption appeared to
be lower in London than in other regions. There appeared to be no regional differences in total
fat, saturated fat and non-milk extrinsic sugars consumption (Table 5.8).
Socio-economic differencesThe 2004/05 Expenditure and Food Survey suggests that while there was little difference in the
fat and saturated fat intake of different socio-economic groups, more fruit and vegetables were
consumed in higher socio-economic groups (Table 5.9). Similar patterns for fat and fruit and
vegetable consumption were shown for income quintiles; people in the highest income quintile
consumed 15% more fruit and vegetables than those in the lowest income quintile (Table
5.10).
Ethnic differences The 2004/05 Expenditure and Food Survey shows considerable variation in nutritional intake
for different ethnic groups in the UK. The percentage of food energy derived from total fat was
lower in Chinese people than in any other ethnic group. Intake of saturated fat in Asian, Black
and Chinese people was much lower than for White people (under 12% of food energy, compared
to 15%). Vegetable consumption was highest among Asian and Chinese populations while fruit
consumption was highest among Mixed and Black/British populations. Salt consumption was
below the target of 6g/day for all ethnic groups except the White population. The consumption
of non-milk extrinsic sugars was lowest in the Asian and Chinese ethnic groups (Table 5.11).
International differencesData for 2003 from the World Health Organization show that the proportion of energy available
from fat varied across European countries from 14% in Azerbaijan to 42% in France. The
proportion of energy available from fat in UK diets (just over 35%) was lower than the EU-25
average of 37% but markedly higher than the European average of 32% (Table 5.12 and Figure
5.12a).
The availability12 of fruit and vegetables was generally higher in Southern European countries than
Northern, Western, Central and Eastern European countries (Table 5.12 and Figure 5.12b).
There are no comparable international data for saturated fat and salt intakes.
British HeartFoundation
Statistics Databasewww.heartstats.org
�08
�. World Health Organization (�00�) Diet, Nutrition and the prevention of chronic diseases. Report of a Joint AHO/FAO Expert Consultation. World Health Organization: Geneva.
�. World Health Organization (�004) Global strategy on diet and physical activity. World Health Organization: Geneva.
�. Department of Health (�994) Nutritional Aspects of Cardiovascular Disease. Report of the Cardiovascular Review Group of the Committee on Medical Aspects of Food Policy. HMSO: London.
4. Scientific Advisory Committee on Nutrition (�00�) Salt and Health. The Stationery Office: London. See www.sacn.gov.uk/pdfs/sacn_salt_final.pdf
5. Department of Health (�005) Choosing a better diet: a food and health action plan. Department of Health: London. See www.dh.gov.uk/assetRoot/04/�0/57/09/04�05709.pdf
6. World Health Organization (�00�) The World Health Report �00�. Reducing Risks, Promoting Healthy Life. World Health Organization: Geneva.
7. Office of National Statistics (�00�) The National Diet and Nutrition Survey: adults aged �9 to 64 years. Volumes �–4. The Stationery Office: London.
8. Extrinsic sugars refer to sugars that are not contained within the cell walls of fruit, vegetables and plants. Non-milk extrinsic sugars refer to such sugars that are not naturally present in milk. Almost all sugar added to processed food consists of non-milk extrinsic sugars, which are more strongly associated with dental caries than all other sugars.
9. Food purchase data do not accurately describe food consumption patterns as not all food that is bought is consumed due to wastage. Levels of wastage may be different for different food types, so comparisons across food categories are tricky.
�0. Social Survey Division of the Office of National Statistics and Medical Research Council Human Nutrition Unit (�00�) The National Diet and Nutrition Survey: adults aged �9 to 64 years. Volume �. Vitamin and mineral intake and urinary analytes. The Stationery Office: London. www.food.gov.uk/multimedia/pdfs/ndnsv�.pdf
��. Crawley, H. (�005). Nutrient-based standards for school food: A summary of the standards and recommendations of the Caroline Walker Trust and the National Heart Forum. The Caroline Walker Trust: St Austell. See http://www.cwt.org.uk/pdfs/eatingwell.pdf
��. The WHO definition of food availability refers to the amount produced nationally plus imports minus exports.
British HeartFoundation
Statistics Databasewww.heartstats.org
�09
Table 5.� Selected dietary targets for the United Kingdom
England1
Total fat To maintain the average total intake of fat at 35% of food
energy
Saturated fat To reduce the average total intake of saturated fat to 11% of
food energy
Fruit and vegetables To increase the average consumption of a variety of fruit and
vegetables to at least five portions per day
Fibre To increase the average intake of dietary fibre to 18 grams per
day
Sugar To reduce the average intake of added sugar to 11% of food
energy
Salt To reduce the average intake of salt to 6 grams per day by
2010
Scotland2
Total fat Average intake of total fat to reduce to no more than 35% of
food energy
Saturated fat Average intake of saturated fat to reduce to no more than 11%
of food energy
Fruit and vegetables Average intake to double to more than 400g per day
Total complex Increase average non-sugar carbohydrates intake by 25% from
carbohydrates 124g per day, through increased consumption of fruit and
vegetables, bread, breakfast cereals, rice and pasta and through
an increase of 25% in potato consumption
Sugar Average intake of NME sugars in adults not to increase
Salt Average intake to reduce to 100mmol per day
Wales3
Total fat 35% of food energy
Saturated fat 10% of total energy
Fruit and vegetables At least five portions per day
Starchy food 37% of total dietary intake
Sugar Average intake of non-milk extrinsic sugars not to exceed 60g/day
Salt Reduce average intake to 6 grams per day
Northern Ireland No targets set
Source:
�. Department of Health (�005) Choosing a Better Diet: a food and health action plan. DH: London.
�. The Scottish Executive (�004) Eating for Health. Meeting the challenge. The Scottish Executive: Edinburgh.
�. Food Standards Agency Wales (�00�) Food and well being: reducing inequalities through a nutrition strategy for Wales. FSA Wales: Cardiff.
British HeartFoundation
Statistics Databasewww.heartstats.org
��0
Tabl
e 5.
� C
onsu
mpt
ion
of to
tal f
at, s
atur
ated
fat,
salt,
sug
ar, fi
bre
and
frui
t and
veg
etab
les,
adu
lts
aged
�6
and
over
, �97
5 to
�00
4/05
, Gre
at B
rita
inC
onsu
mpt
ion
per
pers
on p
er d
ay,
tota
l die
t (i.e
. inc
ludi
ng a
lcoh
ol)
1975
19
80
1985
19
90
19
95
1996
19
97
1998
19
99
2000
20
01/0
2 20
02/0
3 20
03/0
4 20
04/0
5
Ener
gy (k
cal)
2,48
9 2,
439
2,20
8 2,
058
2,
143
2,24
1 2,
168
2,10
2 2,
056
2,15
2 2,
089
2,09
9 2,
077
2,04
8En
ergy
(kJ)
10
.4
10.3
9.
3 8.
6
9.0
9.4
9.1
8.8
8.6
9.0
8.8
8.8
8.7
8.6
Fat (
g)
111.
7 11
2.0
102.
1 93
.5
89
.1
93.5
89
.0
85.9
82
.7
86.2
85
.7
85.4
84
.8
83.4
Fat (
% to
tal e
nerg
y)
40.4
41
.3
41.6
40
.9
37
.4
37.6
36
.9
36.8
36
.2
36.1
36
.9
36.6
36
.7
36.7
Satu
rate
d fa
t (g)
53
.4
49.1
43
.0
37.2
35.5
36
.8
35.4
34
.3
32.8
34
.6
33.9
33
.7
33.6
32
.9Sa
tura
ted
fat (
% to
tal e
nerg
y)
19.3
18
.1
17.5
16
.3
14
.9
14.8
14
.7
14.7
14
.4
14.5
14
.6
14.4
14
.6
14.5
Tota
l sug
ars
(g)
- -
- -
12
9.0
134.
0 13
0.0
125.
0 12
3.0
131.
0 12
2.3
123.
7 12
4.3
122.
5N
on-m
ilk e
xtri
nsic
sug
ars
(g)
- -
- -
87
.0
91.0
88
.0
84.0
82
.0
88.0
80
.9
82.0
81
.5
80.0
Non
-milk
ext
rins
ic s
ugar
s (%
tota
l ene
rgy)
-
- -
-
15.2
15
.2
15.2
15
.0
15.0
15
.3
14.5
14
.7
14.7
14
.7
Non
-sta
rch
poly
sacc
hari
de fi
bre
(g)
- -
- -
12
.8
13.7
13
.6
13.4
13
.2
13.9
13
.3
13.5
13
.1
13.2
Sodi
um (g
) -
- 2.
80
2.73
2.80
2.
92
2.88
2.
81
2.79
2.
90
2.87
2.
81
2.75
2.
71Sa
lt (g
) -
- 7.
00
6.83
7.00
7.
30
7.20
7.
03
6.98
7.
25
7.17
7.
03
6.87
6.
77
Purc
hase
per
per
son
per
wee
k
Frui
t and
veg
etab
les
1,81
8 2,
059
2,01
8 2,
164
2,
254
2,33
4 2,
369
2,32
9 2,
322
2,38
1 2,
248
2,30
6 2,
269
2,27
4(e
xclu
ding
pot
atoe
s) (g
)
Not
es:
Dat
a pr
e-�9
96 a
re u
nadj
uste
d N
atio
nal
Food
Sur
vey
data
. �
00�/
0� d
ata
onw
ards
are
Exp
endi
ture
and
Foo
d Su
rvey
dat
a. �
996
to �
000
data
are
adj
uste
d es
timat
es f
rom
the
Nat
iona
l Fo
od S
urve
y. B
ecau
se o
f th
e di
scon
tinui
ty b
etw
een
data
sets
, the
se tr
ends
nee
d to
be
inte
rpre
ted
with
cau
tion.
Con
sum
ptio
n as
sum
ed fr
om p
urch
ase
data
.
Sour
ce:
Offi
ce fo
r N
atio
nal S
tatis
tics
(�00
6) E
xpen
ditu
re a
nd F
ood
Surv
ey �
004/
05. T
he S
tatio
nery
Offi
ce: L
ondo
n an
d pr
evio
us e
ditio
ns.
D
epar
tmen
t fo
r E
nvir
onm
ent,
Food
and
Rur
al A
ffai
rs (�
00�)
Nat
iona
l Foo
d Su
rvey
�00
0. T
he S
tatio
nery
Offi
ce: L
ondo
n an
d pr
evio
us e
ditio
ns.
British HeartFoundation
Statistics Databasewww.heartstats.org
���
Figure 5.�a Consumption of total fat, saturated fat and NME sugars, adults aged �6 and over, �975 to �004/05, Great Britain, with “Choosing a Better Diet” targets
0
5
10
15
20
25
30
35
40
45
1975
1980
1985
1990
1995
1996
1997
1998
1999
2000
2001
/02
2002
/03
2003
/04
2004
/05
Year
% T
ota
l en
erg
y Total fat
Saturated fat
NME sugars
"Choosing a BetterDiet" targets
Figure 5.�b Consumption of fruit and vegetables, adults aged �6 and over, �975 to �004/05, Great Britain, with 5-a-day benchmark
0
500
1,000
1,500
2,000
2,500
3,000
3,500
1975
1980
1985
1990
1995
1996
1997
1998
1999
2000
2001
/02
2002
/03
2003
/04
2004
/05
Year
Co
nsu
mp
tio
n p
er p
erso
n p
er w
eek
(g)
5-a-daybenchmark
British HeartFoundation
Statistics Databasewww.heartstats.org
���
Table 5.� Food energy from fat and saturated fat, consumption of fruit and vegetables, and salt consumption by sex and age, �000/0�, Great Britain
Daily number of portions of fruit and vegetables consumedMean 1.3 2.2 3.0 3.6 2.7 1.8 2.4 2.9 3.8 2.9% eating recommended 5 or more portions a day 0 7 14 24 13 4 9 17 22 15
Base (total fat, saturated fat, fruit and vegetables) �08 ��9 �5� �5� 8�� �04 ��0 ��8 �59 89�Base (salt) 6� �5� �70 �8� 567 60 ��9 �0� �87 580
Notes: Data are weighted for non-response.
Salt consumption estimates based on �4 hour urine collection.
Source: Office for National Statistics (�00�) The National Diet and Nutrition Survey: adults aged �9 to 64 years. Volume �. Types and quantities of foods consumed. The Stationery Office: London.
Office for National Statistics (�00�) The National Diet and Nutrition Survey: adults aged �9 to 64 years. Volume �. Energy, protein, carbohydrate, fat and alcohol intake. The Stationery Office: London.
Office for National Statistics (�00�) The National Diet and Nutrition Survey: adults aged �9 to 64 years. Volume �. Vitamin and mineral intake and urinary analytes. The Stationery Office: London.
Figure 5.� Percentage of adults failing to meet daily recommended consumption targets for fruit and vegetables and salt by sex and age, �000/0�, Great Britain
0
10
20
30
40
50
60
70
80
90
100
19-24 25-34 35-49 50-64 19-24 25-34 35-49 50-64
% F
ailin
g t
o m
eet
dai
ly r
eco
mm
end
ed c
on
sum
pti
on
tar
get
s
Fruit and vegetables Salt
MenWomen
British HeartFoundation
Statistics Databasewww.heartstats.org
���
Table 5.4 Consumption of selected foods, adults aged �6 and over, �94� to �004/05, United Kingdom
Notes: Figures differ from actual food and drink consumption for a number of reasons e.g. food may be discarded during food preparation (e.g. vegetable peelings), food may be left on the plate at the end of a meal or food may become inedible before it can be consumed and is therefore thrown away.
Data for �94� to �970 from non-adjusted National Food Survey (GB only). Data for �975 to �995 from adjusted National Food Survey (GB only). Data for �996 to �000 from adjusted National Food Survey (UK). Data for �004/05 from Expenditure and Food Survey (UK). Because of the discontinuity between datasets, these trends need to be interpreted with caution.
Source: Office for National Statistics (�006) Expenditure and Food Survey �004/05 . The Stationery Office : London, and previous editions.
Department for Environment, Food and Rural Affairs (�00�) National Food Survey �000. The Stationery Office: London, and previous editions.
British HeartFoundation
Statistics Databasewww.heartstats.org
��4
Figure 5.4a Consumption of fats, adults aged �6 and over, �94� to �004/05, United Kingdom
Italicised entries are estimates using average values.
Source: Office of National Statistics (�00�) The National Diet and Nutrition Survey: adults aged �9 to 64. Volumes � and �. The Stationery Office: London.
Office of Population Censuses and Surveys (�990) The Dietary and Nutritional Survey of British Adults. The Stationery Office: London.
British HeartFoundation
Statistics Databasewww.heartstats.org
��6
Table 5.6 Consumption of fruit and vegetables by sex and age, children aged 5 to �5, �00� to �005, England
MALES AGE (YEARS) 5 6 7 8 9 10 11 12 13 14 15 All ages
Notes: Data are weighted for child selection, but not for non-response. Comparisons over time should be made with caution, due to the relatively low sample size for the �004 results.
Source: The Information Centre (�006) Health Survey for England �005. Updating of trend tables. The Information Centre: London. See http://www.ic.nhs.uk/pubs/hseupdate05
British HeartFoundation
Statistics Databasewww.heartstats.org
��7
Tabl
e 5.
7 C
onsu
mpt
ion
of e
nerg
y, fa
t, sa
tura
ted
fat,
suga
r, so
dium
and
fibr
e fr
om s
choo
l m
eals
in
prim
ary
and
seco
ndar
y sc
hool
s, b
y se
x,
child
ren
aged
4 to
�8,
�00
� an
d �0
05, E
ngla
nd
C
HIL
DR
EN (A
GED
4-1
2 Y
EAR
S)
BO
YS
(AG
ED 1
1-18
YEA
RS)
G
IRLS
(AG
ED 1
1-18
YEA
RS)
Nut
rien
t per
mea
l M
ean
CW
T g
uide
line
Mea
n C
WT
gui
delin
e M
ean
CW
T g
uide
line
Ener
gy (k
cal)
469
489
678
705
596
574
Fat (
g)
18.8
32.1
27.9
Fa
t (%
ene
rgy)
�5
.�
<�5.
0 4�
.5
<�5.
0 40
.8
<�5.
0
Satu
rate
d fa
t (g)
6.
6
10.5
9.4
Sa
tura
ted
fat (
% e
nerg
y)
��.�
<�
�.0
��.4
<�
�.0
��.7
<�
�.0
Non
-milk
ext
rins
ic s
ugar
s (g
) 14
.1
23
.4
21
.2
N
on-m
ilk e
xtri
nsic
sug
ars
(% e
nerg
y)
��.�
<�
�.0
��.4
<�
�.0
��.6
<�
�.0
Sodi
um (m
g)
699
n/a
1059
n/
a 90
6 n/
a
Non
-sta
rch
poly
sacc
hari
de fi
bre
(g)
4.1
3.9
4.0
5.6
3.7
4.6
Unw
eigh
ted
base
�,
0�5
�,
5�4
�,�6
�
Not
es:
CW
T g
uide
lines
refe
r to
the
Car
olin
e W
alke
r Tru
st g
uide
lines
for s
choo
l mea
ls. T
he g
uide
lines
pro
vide
figu
res f
or th
e re
com
men
ded
nutr
ient
con
tent
of a
n av
erag
e sc
hool
m
eal p
rovi
ded
for
child
ren
over
a o
ne-w
eek
peri
od. D
ata
com
es f
rom
a n
atio
nally
rep
rese
ntat
ive
sam
ple
of �
5� p
rim
ary
scho
ols
(�00
5) a
nd 7
9 se
cond
ary
scho
ols
in
Eng
land
(�00
�).
Sour
ce:
Nel
son
M, N
icho
las
J, S
ulei
man
S, D
avie
s O
, Pri
or G
, Hal
l L, W
refo
rd S
, Pou
lter
J (�
006)
. Sch
ool m
eals
in p
rim
ary
scho
ols
in E
ngla
nd.
D
epar
tmen
t for
Edu
catio
n an
d Sk
ills:
Lon
don.
N
elso
n M
, Bra
dbur
y J,
Pou
lter
J, M
cGee
A, M
sebe
le S
, Jar
vis
L (�
004)
. Sch
ool m
eals
in s
econ
dary
sch
ools
in E
ngla
nd. D
epar
tmen
t for
Edu
catio
n an
d Sk
ills:
Lon
don.
British HeartFoundation
Statistics Databasewww.heartstats.org
��8
Tabl
e 5.
8 C
onsu
mpt
ion
of e
nerg
y, fa
t, sa
tura
ted
fat,
suga
r, sa
lt, fi
bre
and
frui
t and
veg
etab
les,
by
coun
try
of th
e U
nite
d K
ingd
om, a
nd b
y G
over
nmen
t Offi
ce R
egio
n in
Eng
land
, �00
� to
�00
5, U
nite
d K
ingd
om
UK
cou
ntry
G
over
nmen
t Offi
ce R
egio
n in
Eng
land
Con
sum
ptio
n pe
r
ENG
LAN
D
SCO
TLA
ND
W
ALE
S N
OR
TH
ERN
N
orth
N
orth
Yo
rksh
ire
East
W
est
East
Lo
ndon
So
uth
Sout
hpe
rson
per
day
IREL
AN
D
East
W
est
and
the
Mid
land
s M
idla
nds
Eas
t W
est
H
umbe
r
Ener
gy (
kcal
/day
) 2,
320
2,17
9 2,
326
2,25
8 2,
372
2,44
5 2,
262
2,36
1 2,
266
2,30
9 2,
092
2,27
4 2,
369
Ener
gy (M
J/da
y)
9.8
9.2
9.8
9.5
10.0
10
.3
9.5
9.9
9.5
9.7
8.8
9.6
10.0
Tota
l fat
(g)
94.0
87
.0
96.0
91
.0
97
99
91
95
91
94
84
93
97To
tal f
at (%
food
ene
rgy)
�7
.6
�7.�
�8
.�
�7.4
�8
.�
�7.9
�7
.7
�7.5
�7
.6
�7.9
�7
.�
�8.�
�8
.0Sa
tura
ted
fat (
g)
36.7
34
.4
37.6
36
.2
38.5
38
.3
35.8
37
.5
35.6
36
.9
31.2
36
.6
38.3
Satu
rate
d fa
t (%
food
ene
rgy)
�4
.7
�4.7
�5
.0
�4.8
�5
.�
�4.6
�4
.8
�4.8
�4
.6
�4.8
��
.9
�5.0
�5
.�
Tota
l sug
ars
(g)
138
130
138
132
140
137
134
142
133
140
120
136
143
Non
-milk
ext
rins
ic s
ugar
s (g
) 93
89
95
89
98
93
91
96
91
94
79
90
94
Non
-milk
ext
rins
ic s
ugar
s (%
food
ene
rgy)
�5
.5
�5.8
�5
.9
�5.�
�6
.0
�4.8
�5
.7
�5.8
�5
.6
�5.7
�4
.6
�5.4
�5
.4
Non
-sta
rch
poly
sacc
hari
de fi
bre
(g)
14.5
13
.3
14.1
14
.1
14.0
14
.8
14.0
14
.7
14.1
14
.8
13.5
14
.5
15.3
Sodi
um (g
/day
) 3.
1 2.
7 3.
2 3.
0 3.
2 3.
2 3.
0 3.
1 2.
9 3.
0 2.
5 3.
0 3.
1Sa
lt (g
/day
) 7.
7 6.
8 7.
9 7.
6 8.
0 8.
2 7.
4 7.
9 7.
4 7.
6 6.
4 7.
6 7.
7
Frui
t (g
/day
) 17
4 15
1 15
1 13
3 13
8 15
6 15
8 16
9 15
2 19
4 18
3 19
4 19
4Ve
geta
bles
- ex
clud
ing
pota
toes
(g/
day)
16
1 12
8 15
2 11
9 14
3 14
2 15
0 16
5 16
0 17
1 16
2 17
0 17
6
Not
es:
Sodi
um in
take
doe
s no
t inc
lude
sod
ium
from
tabl
e sa
lt. S
alt i
ntak
e =
sodi
um x
�.5
�. C
onsu
mpt
ion
assu
med
from
pur
chas
e da
ta.
Sour
ce:
Offi
ce fo
r N
atio
nal S
tatis
tics
(�00
6) E
xpen
ditu
re a
nd F
ood
Surv
ey �
004/
05. T
he S
tatio
nery
Offi
ce: L
ondo
n.
British HeartFoundation
Statistics Databasewww.heartstats.org
��9
Tabl
e 5.
9 C
onsu
mpt
ion
of e
nerg
y, f
at,
satu
rate
d fa
t, su
gar,
salt,
fibr
e an
d fr
uit
and
vege
tabl
es,
by s
ocia
l cl
ass,
�0
0� to
�00
5, U
nite
d K
ingd
om
La
rge
empl
oyer
, Sm
all e
mpl
oyer
H
ighe
r In
term
edia
te
Low
er
Low
er
Nev
er w
orke
d R
outin
e Se
mi-r
outin
e
hi
gher
man
ager
ial
& o
wn
acco
unt
prof
essi
onal
prof
essi
onal
, su
perv
isor
y &
&
long
term
& p
rofe
ssio
nal
wor
ker
man
ager
ial,
tech
nica
l un
empl
oyed
high
er te
chni
cal
occu
patio
nsC
onsu
mpt
ion
per
pers
on p
er d
ay
& s
uper
viso
ry
Ener
gy (
kcal
/day
) 2,
217
2,26
2 2,
224
2,14
7 2,
212
2,31
2 1,
987
2,25
8 2,
246
Ener
gy (M
J/da
y)
9.3
9.5
9.4
9.0
9.3
9.7
8.3
9.5
9.4
Tota
l fat
(g)
88
93
88
85
89
94
83
92
91
Tota
l fat
(% fo
od e
nerg
y)
�7.5
�8
.�
�7.�
�7
.�
�7.5
�7
.9
�8.4
�7
.8
�7.6
Satu
rate
d fa
t (g)
34
.9
36.5
34
.7
33.1
34
.5
36.3
30
.3
35.2
35
.2
Satu
rate
d fa
t (%
food
ene
rgy)
�4
.8
�5.�
�4
.7
�4.4
�4
.6
�4.7
�4
.�
�4.5
�4
.5
Tota
l sug
ars
(g)
130
131
131
128
129
134
114
133
132
Non
-milk
ext
rins
ic s
ugar
s (g
) 85
89
84
87
86
93
82
93
93
N
on-m
ilk e
xtri
nsic
sug
ars
(% fo
od e
nerg
y)
�5.�
�5
.�
�4.9
�5
.7
�5.�
�5
.7
�5.9
�6
.0
�5.9
Non
-sta
rch
poly
sacc
hari
de fi
bre
(g)
14.3
13
.7
14.8
13
.3
14.2
13
.9
10.9
13
.4
13.2
Sodi
um (g
/day
) 3.
0 3.
0 2.
9 2.
9 3.
0 3.
1 2.
5 3.
0 2.
9Sa
lt (g
/day
) 7.
5 7.
4 7.
4 7.
3 7.
5 7.
9 6.
2 7.
6 7.
4
Frui
t (g
/day
) 20
0 15
3 21
8 15
3 18
3 13
0 10
3 12
1 12
6Ve
geta
bles
- ex
clud
ing
pota
toes
(g/
day)
16
1 15
2 17
1 14
4 15
9 14
4 11
1 13
8 13
4
Not
es:
Sodi
um in
take
doe
s no
t inc
lude
sod
ium
from
tabl
e sa
lt. S
alt i
ntak
e =
sodi
um x
�.5
�. C
onsu
mpt
ion
assu
med
from
pur
chas
e da
ta. S
ocia
l cla
ss c
ateg
oris
atio
n is
dep
ende
nt u
pon
the
occu
patio
n of
the
Hou
seho
ld R
efer
ence
Per
son.
Sour
ce:
Offi
ce fo
r N
atio
nal S
tatis
tics
(�00
6) E
xpen
ditu
re a
nd F
ood
Surv
ey �
004/
05. T
he S
tatio
nery
Offi
ce: L
ondo
n.
British HeartFoundation
Statistics Databasewww.heartstats.org
��0
Table 5.�0 Consumption of energy, fat, saturated fat, sugar, salt, fibre and fruit and vegetables, by income quintile, �00� to �005, United Kingdom
Quintile 1 Quintile 2 Quintile 3 Quintile 4 Quintile 5Consumption per person per day (Lowest income) (Highest income)
Notes: Sodium intake does not include sodium from table salt. Salt intake = sodium x �.5�.
Consumption assumed from purchase data.
Source: Office for National Statistics (�006) Expenditure and Food Survey �004/05. The Stationery Office: London.
British HeartFoundation
Statistics Databasewww.heartstats.org
���
Table 5.�� Total energy available from fat and availability of fruit and vegetables by country, �00�, selected European countries
% energy fruit and veg % energy fruit and veg from fat per person from fat per person per year (kg) per year (kg)
Albania 27.1 264.4 Lithuania 27.9 168.5Armenia 19.6 237.6 Luxembourg 40.3 199.5Austria 38.8 227.6 FYR Macedonia 29.6 235.7Azerbaijan 14.0 192.0 Malta 28.1 243.1Belarus 29.5 155.0 Netherlands 36.0 255.5Belgium 40.3 199.5 Norway 37.2 190.7Bosnia and Herzegovina 18.0 225.3 Poland 29.8 147.9Bulgaria 30.1 190.1 Portugal 34.2 297.2Croatia 28.7 199.8 Republic of Moldova 18.4 153.9Cyprus 36.3 278.5 Romania 26.3 244.3Czech Republic 31.2 151.4 Russia 24.7 144.8Denmark 35.9 248.7 Serbia 39.5 224.2Estonia 27.4 174.4 Slovakia 33.5 129.7Finland 36.2 162.6 Slovenia 32.4 215.4France 41.8 238.4 Spain 41.2 256.0Georgia 18.1 142.4 Sweden 35.5 193.6Germany 36.7 203.7 Switzerland 40.1 201.1Greece 35.6 422.7 Tajikistan 19.1 84.5Hungary * 38.0 176.3 Turkey 24.7 338.1Iceland * 36.2 167.7 Turkmenistan 23.0 136.1Ireland * 32.6 182.9 Ukraine 24.1 152.4Israel * 34.1 336.4 United Kingdom 35.1 207.4Italy 38.2 309.3 Uzbekistan 25.0 146.4Kazakhstan 25.9 146.8 Europe average 31.9 233.2Kyrgyzstan 15.6 158.4 EU-�5 average �7.9 �4�.5Latvia ��.� �5�.� EU-�5 average �6.9 ���.6
Notes: * data for these countries are for �00�. Fruit and vegetables do not include potatoes. Amount available refers to fruit and vegetables produced nationally, plus imports, minus exports.
Source: World Health Organization (�005) European Health for All statistical database. http://www.euro.who.int/hfadb
British HeartFoundation
Statistics Databasewww.heartstats.org
���
Figu
re 5
.��a
Per
cent
age
of to
tal e
nerg
y av
aila
ble
from
fat b
y co
untr
y, �
00�,
sel
ecte
d E
urop
ean
coun
trie
s,
with
WH
O ta
rget
051015202530354045
France
Spain
Belgium
Luxembourg
Switzerland
Serbia
Austria
Italy
Hungary *
EU-15 average
Norway
EU-25 average
Germany
Cyprus
Iceland *
Finland
Netherlands
Denmark
Greece
Sweden
United Kingdom
Portugal
Israel *
Slovakia
Latvia
Ireland *
Slovenia
Europe average
Czech Republic
Bulgaria
Poland
FYR Macedonia
Belarus
Croatia
Malta
Lithuania
Estonia
Albania
Romania
Kazakhstan
Uzbekistan
Russia
Turkey
Ukraine
Turkmenistan
Armenia
Tajikistan
Republic of Moldova
Georgia
Bosnia and Herzegovina
Kyrgyzstan
Azerbaijan
% total energy available from fat
WH
O t
arg
et
Not
es:
WH
O ta
rget
for
aver
age
popu
latio
n to
tal f
at in
take
is b
etw
een
�5 a
nd �
0% o
f tot
al e
nerg
y
British HeartFoundation
Statistics Databasewww.heartstats.org
���
Figu
re 5
.��b
Ava
ilabi
lity
of
frui
t an
d ve
geta
bles
by
co
untr
y,
�00�
, se
lect
ed
Eur
opea
n co
untr
ies,
w
ith
WH
O ta
rget
0
50100
150
200
250
300
350
400
450
Greece
Turkey
Israel *
Portugal
Cyprus
Albania
Spain
Netherlands
Denmark
Romania
Malta
EU-15 average
France
Armenia
FYR Macedonia
Europe average
EU-25 average
Austria
Bosnia and Herzegovina
Serbia
Slovenia
United Kingdom
Germany
Switzerland
Croatia
Belgium
Luxembourg
Sweden
Azerbaijan
Norway
Bulgaria
Ireland *
Hungary *
Estonia
Lithuania
Iceland *
Finland
Kyrgyzstan
Belarus
Republic of Moldova
Latvia
Ukraine
Czech Republic
Poland
Kazakhstan
Uzbekistan
Russia
Georgia
Turkmenistan
Slovakia
Tajikistan
kg per person per year
WH
O t
arg
et
Italy
Not
es:
WH
O in
tern
atio
nal t
arge
t is
400g
frui
t and
veg
etab
le c
onsu
mpt
ion
per
pers
on p
er d
ay. T
arge
t of �
�9 k
g of
ava
ilabl
e fr
uit a
nd v
eget
able
s pe
r pe
rson
per
yea
r ha
s be
en a
djus
ted
for
was
tage
(see
sou
rce
for
met
hod)
.
British HeartFoundation
Statistics Databasewww.heartstats.org
��4
6. Physical Activity
People who are physically active have a lower risk of CHD. To produce the maximum benefit
the activity needs to be regular and aerobic. Aerobic activity involves using the large muscle
groups in the arms, legs and back steadily and rhythmically so that breathing and heart rate are
significantly increased.
Recent research from the World Health Organization highlighted the importance of physical
inactivity as a major risk factor for CHD. The 2002 World Health Report estimated that around
3% of all disease burden in developed countries was caused by physical inactivity, and that over
20% of CHD and 10% of stroke in developed countries was due to physical inactivity (less than
2.5 hours per week moderate intensity activity or 1 hour per week vigorous activity)1.
Public health targetsSince 1996, the Government recommendation on physical activity has been that adults should
participate in a minimum of 30 minutes of at least moderate intensity activity (such as brisk
walking, cycling or climbing the stairs) on five or more days of the week. In 2004 the Chief
Medical Officer restated this recommendation in the report At least five a week, and highlighted
the importance of physical activity in the prevention of CHD, diabetes and obesity2.
Choosing Activity: a physical activity action plan was published in 20053. This document outlined
key commitments relating to physical activity contained within the White Paper Choosing Health
which aimed to increase levels of physical activity in adults and children in England4.
A target for physical activity in England was proposed in 2002 by the Government’s Strategy Unit:
to increase the proportion of the adult population who participate in 30 minutes of moderate
physical activity five or more times a week to 70% by 2020 (Table 6.1)5. This is a very ambitious
target requiring participation levels in England to more than double in just over 15 years. HM
Treasury proposed that the proportion of children who spend a minimum of two hours per week
on high quality sport should increase from 25% in 2002 to 75% by 2006 and 85% by 20086.
In 2003 the Scottish Health Executive set a target that by 2022, 50% of the adult population
should participate in 30 minutes of moderate activity on 5 or more occasions each week. The
Scottish target for children is to increase the number of children taking at least one hour a day
of moderate activity on 5 or more days a week to 80% by 20227 (Table 6.1).
There are no physical activity targets set for Wales or Northern Ireland.
British HeartFoundation
Statistics Databasewww.heartstats.org
��5
Overall levels Physical activity levels are low in the UK. Health Survey for England data show that, in 2003,
only 37% of men and 24% of women met the current physical activity guidelines suggested by the
Government (Table 6.2 and Figure 6.2a). In 2003 over one third of English adults were inactive,
that is, participated in less than one occasion of 30 minutes activity a week.
Sex and age differences Physical activity declines rapidly with increasing age for both men and women, although for women
this decline did not begin until the mid-forties (Table 6.2 and Figures 6.2b and 6.2c). In England
53% of men and 30% of women aged 16 to 24 were physically active at the recommended level
compared to 17% of men and 13% of women in the 65 to 74 age group.
Between 1997 and 2004, the Health Survey for England reported that the overall proportion of
adults meeting the recommended level of physical activity increased from 32% to 37% in men
and from 21% to 25% in women (Table 6.3).
Children and young peopleIt is recommended that all children and young people aged 5 to 18 participate in physical activity
of at least moderate intensity for one hour a day2,3. In 2002 in England, 70% of boys and 61%
of girls aged 2 to 15 were active for at least an hour a day (Table 6.4). In girls, participation rates
declined with age after about age 10. By the age of 15, only 50% of girls reached the recommended
level of activity (Figures 6.4a and 6.4b).
National and regional differencesIn 2003, levels of physical activity in Scotland were higher for men in all age groups than in England
(Table 6.2). This was particularly the case for 25 to 34 year olds, where 57% met physical activity
recommendations in Scotland compared to 44% in England. This was also the case for women:
40% of 25 to 34 year olds met recommendations in Scotland compared to 29% in England.
Within England there is some variation in the level of activity by region (Table 6.5). In 2003
men were more likely to meet the physical activity recommendations in the South West (42%),
West Midlands (41%), North East (40%) and North West (40%). Women were more likely to
meet the physical activity guidelines in the South West (27%), South East (27%), the North East
(26%) and London (26%).
Socio-economic differences Socio-economic differences in physical activity are complex. Among English men in 2003, 32%
of those in managerial or professional jobs met current recommended levels of physical activity
compared to 49% of small employers and own account workers.
In English women, the pattern was reversed: 34% of women with managerial and professional
jobs met the current recommended levels of physical activity compared to between 24% and
29% of women from other socio-economic groups (Table 6.6).
The pattern for physical activity and income group is also complex (Table 6.7).
British HeartFoundation
Statistics Databasewww.heartstats.org
��6
Ethnic differencesCompared with the general population, in 2004 Indian, Pakistani, Bangladeshi and Chinese men
and women were less likely to meet physical activity recommendations. Only 26% of Bangladeshi
men and 11% of Bangladeshi women met the current recommended physical activity levels. Irish
men and Black Caribbean women were the most likely to be physically active at the recommended
level (Table 6.8 and Figure 6.8).
International differencesLevels of activity vary across European member states, with levels of activity in the UK falling
just below the EU average (Table 6.9 and Figure 6.9).
�. World Health Organization (�00�) The World Health Report �00�. Reducing Risks, Promoting Healthy Life. World Health Organization: Geneva.
�. Department of Health (�004) At least five a week: evidence on the impact of physical activity and its relationship to health. Department of Health: London. See www.dh.gov.uk/assetRoot/04/08/09/8�/0408098�.pdf
�. Department of Health (�005) Choosing Activity: a physical activity action plan. Department of Health: London.
4. Department of Health (�004) Choosing Health: making healthy choices easier. Department of Health: London.5. Strategy Unit (�00�) Game Plan: a strategy for delivering Government’s sport and physical activity objectives. A joint Department
of Culture, Media and Sport and Strategy Unit Report. HMSO: London.
6. HM Treasury (�004) Spending Review. Department for Culture, Media and Sport. HMSO: London. See www.hm-treasury.gov.uk/media/965/FB/sr�004_ch�8.PDF
7. The Scottish Executive (�00�). Let’s Make Scotland More Active: a strategy for physical activity. The Scottish Executive: Edinburgh.
British HeartFoundation
Statistics Databasewww.heartstats.org
��7
Table 6.� Physical activity targets for the United Kingdom
England1,2
Adults1 By 2020, 70% of individuals to be undertaking 30 minutes of
physical activity on at least 5 days a week. An interim target of
50% of individuals by 2011
Children2 To increase the proportion of school children in England who
spend a minimum of two hours each week on high quality sport
from 25% in 2002, to 75% by 2006 and 85% in 2008
Scotland3
Adults - Target To increase the proportion of all adults aged over 16 years
taking the minimum recommended levels of physical activity
(30 minutes of moderate activity on 5 or more occasions each
week) to 50% by 2022. To meet this goal will need average
increases of 1% a year across the population
Children - Target To increase the proportion of all children aged 16 and under
taking the minimum recommended levels of physical activity (1
hour a day of moderate activity on 5 or more days a week) to
80% by 2022. To meet this goal will need average increases of
1% a year across the population
Wales No target set
Northern Ireland4 No target set
�. Strategy Unit (�00�). Game Plan: a strategy for delivering Government’s sport and physical activity objectives. A joint Department of Culture, Media and Sport and Strategy Unit Report. HMSO: London.
�. HM Treasury (�004) Spending review. Department for Culture, Media and Sport. HMSO: London. See www.hm-treasury.gov.uk/media/965/FB/sr�004_ch�8.PDF
�. The Scottish Executive (�00�). Let’s make Scotland more active: a strategy for physical activity. The Scottish Executive: Edinburgh.
4. New strategies for CVD in Northern Ireland are being developed by the Department of Health, Social Services and Public Safety and were issued for consultation in �004.
British HeartFoundation
Statistics Databasewww.heartstats.org
��8
Fig 6.� Physical activity levels, �995, �998 and �00�, Scotland, with “Towards a healthier Scotland” national targets
0
10
20
30
40
50
60
70
1995 2005
Year
% p
hys
ical
ly a
ctiv
e at
rec
om
men
ded
leve
l
"Towards a healthierScotland" targets
MenWomen
20101998 2003
Source: The Scottish Executive (�005) The Scottish Health Survey �00�. The Stationery Office: Edinburgh and previous editions.
Due to important differences to the relevant questions in the health survey questionnaire, comparisons of the �998 and �00� results with �995 results should be made with caution.
British HeartFoundation
Statistics Databasewww.heartstats.org
��9
Table 6.� Physical activity level by sex and age, England and Scotland �00�, Wales �004/05 and Northern Ireland �00�
Notes: High = �0 minutes or more on at least 5 days a week (above recommended level). Medium = �0 minutes or more on � to 4 days a week. Low = lower level of activity. Information on bases for Welsh Health Survey unavailable.
Source: Department of Health (�005) Health Survey for England �004. The Stationery Office: London. Scottish Health Executive (�005) The Scottish Health Survey �00�: Results. http://www.scotland.gov.uk/Publications/�005/��/�5�450�4/50�5� National Assembly for Wales (�005) Welsh Health Survey �004/05. http://new.wales.gov.uk/topics/statistics/publications/health-survey�004-05/?lang=en Northern Ireland Statistics and Research Agency (�00�) Northern Ireland Health and Social Wellbeing Survey �00�: Physical activity results - Activity level tables. http://www.csu.nisra.gov.uk/archive/Surveys/HWB/results/�00�/Physical%�0activity/Activity%�0level%�0tables.PDF
British HeartFoundation
Statistics Databasewww.heartstats.org
��0
Figure 6.�a Proportion meeting physical activity guideline by age and country, men, latest available year, England, Scotland, Wales and Northern Ireland
0
10
20
30
40
50
60
70
ENGLAND SCOTLAND WALES NORTHERN IRELAND
Pro
po
rtio
n o
f men
mee
tin
g g
uid
elin
e (%
)
16–24
25–34
35–44
45–54
55–64
65–74
75+England target 2011 Scotland target 2022
England target 2020
Figure 6.�b Proportion meeting physical activity guideline by age and country, women, latest available year, England, Scotland, Wales and Northern Ireland
0
10
20
30
40
50
60
70
ENGLAND SCOTLAND WALES NORTHERN IRELAND
Pro
po
rtio
n o
f wo
men
mee
tin
g g
uid
elin
e (%
)
16–24
25–34
35–44
45–54
55–64
65–74
75+England target 2011 Scotland target 2022
England target 2020
British HeartFoundation
Statistics Databasewww.heartstats.org
���
Table 6.� Proportion meeting the physical activity guideline by sex and age, �997, �998, �00� and �004, England
Unweighted base �,686 454 775 9�5 �,649Weighted base �,9�� 506 8�5 969 �,8�4
WOMEN
High 34 25 29 27 24Medium 39 38 35 35 33Low 36 37 36 38 43 Unweighted base �,086 790 805 9�� �,�67Weighted base �,898 7�4 75� 875 �,�5�
Notes: Age-standardised percentages. For method of age-standardisation see source.
Data are weighted for non-response.
High = �0 minutes or more on at least 5 days a week (above recommended level). Medium = �0 minutes or more on � to 4 days a week. Low = lower level of activity.
Source: Department of Health (�004) Health Survey for England �00�. The Stationery Office: London.
Table 6.5 Physical activity levels by Government Office Region and sex, adults aged �6 and over, �00�, England
Government Office Region
Summary physical North North Yorkshire East West East London South East South Westactivity level* East West & the Midlands Midlands England Humber
Notes: *High activity level = �0 minutes or more on at least 5 days a week. Medium = �0 minutes or more on � to 4 days a week. Low = lower levels of activity.
Results presented for prevalence in a standardised population only.
Source: Department of Health (�004) Health Survey for England �00�. The Stationery Office: London.
British HeartFoundation
Statistics Databasewww.heartstats.org
���
Table 6.7 Physical activity level by sex and income, adults aged �6 and over, �00�, England
Unweighted base �,4�0 �,�7� �,547 �,4�6 �,�4�Weighted base �,�76 �,��4 �,4�� �,�64 �,�7�
Notes: Age-standardised percentages. For method of age-standardisation see source.
Data are weighted for non-response.
High = �0 minutes or more on at least 5 days a week (above recommended level). Medium = �0 minutes or more on � to 4 days a week. Low = lower level of activity.
Source: Department of Health (�004) Health Survey for England �00�. The Stationery Office: London.
British HeartFoundation
Statistics Databasewww.heartstats.org
��4
Table 6.8 Physical activity by sex and ethnic group, �004, England
Summary physical General Black Black Indian Pakistani Bangladeshi Chinese Irishactivity level population Caribbean African
Weighted base 48,64� 67� 47� �,067 499 �07 �6� �,�69Unweighted base �,8�8 648 467 6�4 508 477 �75 656
Notes: Age-standardised percentages (standardised risk ratios x percentage in general population). For observed values see source.
High = �0 minutes or more physical activity on at least 5 days a week (recommended level). Medium = �0 minutes or more on � to 4 days a week. Low = lower level of activity.
Source: Department of Health (�005) Health Survey for England �004. The Stationery Office: London.
Figure 6.8 Percentage of adults meeting physical activity guidelines by sex and ethnic group, �004, England
0
5
10
15
20
25
30
35
40
45
Generalpopulation
BlackCaribbean
BlackAfrican
Indian Pakistani Bangladeshi Chinese Irish
Ethnic group
Ad
ult
s m
eeti
ng
gu
idel
ines
(%)
MenWomen
British HeartFoundation
Statistics Databasewww.heartstats.org
��5
Tabl
e 6.
9 Se
lf-re
port
ed p
hysi
cal a
ctiv
ity le
vels
, �00
5, s
elec
ted
Eur
opea
n co
untr
ies
N
umbe
r of
day
s in
last
wee
k w
alke
d fo
r N
umbe
r of
day
s in
last
wee
k N
umbe
r of
hou
rs s
pent
sitt
ing
10
min
utes
or
mor
e un
dert
ook
mod
erat
e ph
ysic
al a
ctiv
ity
on a
usu
al d
ay
Non
e 1–
3 4–
6 7
days
D
on’t
know
N
one
1–3
4–6
7 da
ys
Don
’t kn
ow
Less
than
1
1–3h
59
4–7h
59
8+
Don
’t kn
ow
EU-2
5 C
OU
NT
RIE
SA
ustr
ia
%
18
26
26
27
3 26
32
27
11
3
6 24
53
18
Belg
ium
%
23
28
14
34
0
40
28
14
18
0 2
27
42
29
1C
zech
Rep
ublic
%
10
16
21
49
5
29
30
17
18
5 0
19
37
34
9D
enm
ark
%
13
19
13
53
2 27
29
16
28
2
1 17
44
33
5
Esto
nia
%
8 15
15
61
1
26
25
17
28
2 1
26
43
24
5Fi
nlan
d %
12
24
20
44
2
34
30
16
18
2 5
25
35
31
3Fr
ance
%
15
23
13
48
1
52
22
8 15
2
4 35
40
18
3
Ger
man
y %
8
18
22
50
3 26
27
20
24
3
0 25
43
22
10
Gre
ece
%
20
22
20
38
0 27
30
18
25
0 17
48
35
0
Hun
gary
%
14
19
21
47
0
34
27
15
25
0 5
40
34
17
4Ir
elan
d %
21
19
26
33
1
57
20
14
8 2
2 30
41
17
10
Ital
y %
22
23
20
32
2
54
22
12
9 2
9 31
44
14
3
Latv
ia
%
15
18
13
50
4 29
26
14
21
9
12
30
37
20
Lith
uani
a %
14
13
17
51
5
29
21
15
28
6 11
29
30
16
13
Luxe
mbo
urg
%
15
27
16
40
1 42
31
10
16
2
3 31
37
26
2
Mal
ta
%
32
22
11
34
78
12
5
5
8 34
35
13
10
Net
herl
ands
%
8
19
16
58
1 13
21
23
43
0
0 16
40
41
2
Pola
nd
%
13
21
15
48
2 32
28
18
20
3
2 29
37
28
4
Port
ugal
%
21
12
20
43
2
48
16
15
18
3 17
45
27
11
R
epub
lic o
f Cyp
rus
%
40
26
12
23
48
22
12
18
1 24
36
33
6
Slov
akia
%
5
18
23
49
4 22
42
18
13
5
0 30
41
23
7
Slov
enia
%
13
23
18
45
2
24
31
18
26
1 0
34
37
26
2Sp
ain
%
17
11
13
50
10
60
12
9 10
8
2 37
39
15
8
Swed
en
%
12
28
20
41
0 48
32
11
9
1
26
43
28
2U
K
%
12
17
18
49
2 51
20
12
15
2
0 27
40
21
12
Tota
l EU
-25
%
14
19
18
46
3 41
24
15
18
3
3 29
41
21
6
OT
HER
CO
UN
TR
IES
Bulg
aria
%
6
10
18
64
3 33
22
15
25
5
0 34
40
17
8
Cro
atia
%
20
20
14
44
1
31
24
15
30
1 2
34
37
25
2R
oman
ia
%
13
14
21
52
1 37
17
21
24
2
32
27
25
13
2Tu
rkey
%
14
17
12
52
5
50
19
7 20
3
1 25
46
15
13
Turk
ish
Cyp
riot
Com
mun
ity
%
18
30
18
26
9 39
26
7
16
12
0 20
43
19
17
Sour
ce:
Eur
opea
n C
omm
issi
on (�
006)
Hea
lth a
nd fo
od. S
peci
al E
urob
arom
eter
�46
/Wav
e 64
.� -
TN
S O
pini
on &
Soc
ial.
ht
tp://
ec.e
urop
a.eu
/hea
lth/p
h_pu
blic
atio
n/eb
_foo
d_en
.pdf
British HeartFoundation
Statistics Databasewww.heartstats.org
��6
Figu
re 6
.9
Perc
enta
ge o
f ad
ults
who
do
no m
oder
ate-
inte
nsity
phy
sica
l ac
tivity
in
a ty
pica
l w
eek,
�0
05, s
elec
ted
Eur
opea
n co
untr
ies
01020304050607080Netherlands
Slovakia
Slovenia
Austria
Estonia
Germany
Denmark
Greece
Czech Republic
Latvia
Lithuania
Croatia
Poland
Bulgaria
Finland
Hungary
Romania
Turkish Cypriot Community
Belgium
Total EU-25
Luxembourg
Portugal
Republic of Cyprus
Sweden
Turkey
UK
France
Italy
Ireland
Spain
Malta
Adults (%)
British HeartFoundation
Statistics Databasewww.heartstats.org
��7
7. AlcoholWhile moderate alcohol consumption (one or two drinks a day) reduces the risk of CVD, at high
levels of intake – particularly in ‘binges’ – the risk of CVD is increased.
The World Health Report 2002 estimates that over 9% of all disease burden in developed
countries is caused by alcohol consumption and that 2% of CHD and almost 5% of stroke in
men in developed countries is due to alcohol. However, the impact of alcohol consumption in
women in developed countries is estimated to be positive – if no alcohol were consumed, there
would be a 3% increase in CHD and a 16% increase in stroke1.
The Government currently advises that ‘regular consumption of between three and four units a
day by men’ and ‘between two and three units a day by women of all ages will not lead to any
significant health risk’2. Consuming in excess of four units on the heaviest drinking day of the
week in men, or over three units in women, is not advised, and the Government recommendations
on sensible drinking are now based on these daily benchmarks3. This advice is consistent with
previous advice, based on weekly alcohol consumption; that men should drink less than 21 units
a week and women less than 14 units a week4 (Table 7.1).
Public health targetsThe 2004 report by the Academy of Medical Sciences, Calling Time: The Nation’s drinking as a
major health issue, presented strong evidence that the overall national consumption of alcohol
is a major determinant of national alcohol related harm, and recommended the introduction of
targets by Government to reduce per capita alcohol consumption in the UK5. The Alcohol Harm
Reduction Strategy for England, published in 2004, did not, however, include such targets3.
Currently in the UK only Scotland has targets for limiting alcohol consumption (Table 7.1).
Overall levels of alcohol consumptionIn Britain in 2005, 35% of men and 20% of women consumed more alcohol than the recommended
daily benchmarks; that is more than four units on the heaviest drinking day of the week for men
and more than three for women (Table 7.2).
Age and sex differences Overall, men were more than one and a half times as likely as women to exceed the daily
recommended levels of alcohol consumption in 2005 (Table 7.2), and over twice as likely to
binge drink6 (Table 7.2).
In 2005, alcohol consumption was higher in younger age groups, for example 43% of men and
36% of women aged 16 to 24 drank more than the recommended daily benchmarks, compared
with only 16% of men and 4% of women aged 65 and over (Table 7.2 and Figures 7.2a and
7.2b).
Similar patterns are evident for binge drinking. The prevalence of binge drinking was highest
British HeartFoundation
Statistics Databasewww.heartstats.org
��8
in the 16 to 24 years age group, with 30% of young men and 22% of young women drinking
heavily on at least one day a week (Table 7.2).
Temporal trendsIn the first half of the twentieth century per capita alcohol consumption in the UK fell rapidly,
from around 11 litres per year in 1900 to around 4 litres after the Second World War. From the
late 1950s to the end of the century alcohol consumption increased steadily, more than doubling
overall from around four to ten litres per person per year5 .
Evidence about temporal trends in binge drinking are short-term as the General Household Survey
has only included questions about the maximum daily amount consumed since 1998. Between
1998 and 2005, there have only been small fluctuations in the patterns of binge drinking in both
men and women (Table 7.3 and Figure 7.3).
Trend data from the General Household Survey show that the average weekly consumption of
alcohol remained reasonably stable between 1998 and 2005 for both men and women (Table
7.4).
Young people and drinkingData on drinking habits in 11 to 15 year olds is collected annually for the Drug use, Smoking
and Drinking in Young People survey. In 2005, around one in six boys and girls consumed an
alcoholic drink at least once a week. The number of girls drinking at this frequency had increased
by over 50% since 1988 (Table 7.5).
National and regional differencesOn a regional basis the proportions consuming more than the recommended daily level of alcohol
in 2005 were lowest in London and highest in Yorkshire and the Humber for both men and
women. In 2005 while 27% of women in Yorkshire and the Humber consumed more than three
units on the heaviest drinking day of the week, only 13% of women in London consumed more
than the recommended sensible daily level (Table 7.6 and Figures 7.6a and 7.6b).
Socio-economic differencesFor both men and women in 2005, those in managerial and professional households were the
most likely to drink and the most likely to drink on five or more days a week. However, the
amount of alcohol drunk was less clearly related to socio-economic group, especially in men.
Women in managerial and professional households were slightly more likely to exceed the daily
recommended benchmarks than those in routine or manual occupations, but binge drinking did
not vary by socio-economic group: in all socio-economic groups in 2005, about 8% of women
and 19% of men exceeded the daily benchmarks for binge drinking (Table 7.7).
Ethnic differencesLevels of alcohol consumption vary considerably with ethnicity. With the exception of the Irish,
adults from each minority ethnic group were less likely to drink alcohol than the general population.
Very low proportions of Bangladeshi (less than 5%) and Pakistani (less than 10%) adults ever
drink alcohol. Women are more likely than men to be non-drinkers in all ethnic groups (Table
7.8 and Figures 7.8a and 7.8b).
British HeartFoundation
Statistics Databasewww.heartstats.org
��9
Irish men and women are more likely than those in the general population to drink more than
the recommended daily level of alcohol on the heaviest drinking day in a typical week. About
56% of Irish men and over one third (36%) of Irish women exceeded guidelines for the heaviest
drinking day (Table 7.8 and Figures 7.8a and 7.8b).
International differencesLevels of alcohol consumption in the UK in 2003 were about average for the European Union,
and slightly higher than the European region average (Table 7.9 and Figure 7.9). In the EU as
a whole, consumption of alcoholic drinks has steadily declined since 1980, but in the UK there
has been no strong evidence of decline7.
�. World Health Organization (�00�) The World Health Report �00�. Reducing Risks, Promoting Healthy Life. World Health Organization: Geneva.
�. Department of Health (�995) Sensible Drinking. The Report of an Inter-Departmental Working Group. DH: London.
�. These guidelines were restated in March �004 in the Government’s alcohol harm reduction strategy for England, published by the Cabinet Office. Prime Minister’s Strategy Unit (�004) Alcohol harm reduction strategy for England. Cabinet Office: London. See www.strategy.gov.uk/work_areas/alcohol_misuse/index.asp.
4. In recognition of the dangers of excessive drinking in a single session, the sensible drinking recommendations were changed in �995 to focus on daily rather than weekly guideline.
5. The Academy of Medical Sciences (�004) Calling time: the nation’s drinking as a major health issue. Academy of Medical Sciences: London.
6. The General Household Survey defines heavy drinking, or binge drinking, as more than 8 units in one day for men and more than 6 units in one day for women. While people vary in their susceptibility to the effect of alcohol, these thresholds for heavy drinking were chosen as those likely to lead to intoxication.
7. World Health Organization (�006) European Health For All statistical database. See www.euro.who.int/hfadb
British HeartFoundation
Statistics Databasewww.heartstats.org
�40
Table 7.� Alcohol targets and recommendations for the United Kingdom
Recommendations for
the United Kingdom
Safe level – men No more than 4 units per day / 21 units per week
Safe level – women No more than 3 units per day / 14 units per week
Benchmark for heavy
drinking – men 8 units per day
Benchmark for heavy
drinking – women 6 units per day
England1 No target set
Scotland2
Men – Headline Target To reduce the proportion of men exceeding the weekly limit
of 21 units of alcohol from 33% to 31% between 1995 and
2005 and to 29% by 2010
Women – To reduce the proportion of women exceeding the weekly
Headline Target limit of 14 units of alcohol from 13% to 12% between 1995
and 2005 and to 11% by 2010
Young people – To reduce the frequency and level of drinking from 20% of
Second Rank Target 12-15 year olds to 18% between 1995 and 2005 and to 16%
by 2010
Wales3 No target set
Northern Ireland4 No target set
�. The Government’s Strategy Unit has recently published an alcohol strategy for England. This did not recommend the introduction of public health targets for alcohol consumption. Strategy Unit (�004) Alcohol Harm Reduction Strategy for England. Cabinet Office: London. See www.strategy.gov.uk/work_areas/alcohol_misuse/index.asp.
�. The Scottish Office (�999) Towards a Healthier Scotland. HMSO: Edinburgh.
�. The Welsh Assembly Government is currently developing new determinants of health indicators. The first stage of this work is underway and includes a focus on CHD. See the Chief Medical Officer Wales website, www.cmo.wales.gov.uk/content/work/health-gain-targets/determinants-of-health-e.htm.
4. The Department of Health, Social Services and Public Safety in Northern Ireland is currently developing a target for the next 6 years aimed at reducing the number of people who binge drink.
British HeartFoundation
Statistics Databasewww.heartstats.org
�4�
Table 7.� Alcohol consumption by sex and age, �005, Great Britain
Maximum daily alcohol All ages 16-24 25-44 45-64 65+consumption
% % % % %
MEN
Drank nothing last week 28 36 26 23 34Up to 4 units 38 21 33 42 505-8 units 16 13 17 19 12More than 8 units 19 30 25 16 4
% exceeding 4 units 35 43 42 35 16
Weighted base (000s) �9,479 �,506 6,865 6,�5� �,756Unweighted base �0,0�8 �,�04 �,406 �,�74 �,�44
WOMEN
Drank nothing last week 43 44 38 39 57Up to 3 units 37 20 35 43 394-6 units 12 14 15 14 3More than 6 units 8 22 11 4 1
% exceeding 3 units 20 36 26 18 4
Weighted base (000s) ��,�99 �,7�� 7,8�4 6,9�6 4,8�6Unweighted base ��,6�7 �,�80 4,0�8 �,75� �,548
Notes: Adults aged �6 and over.
Alcohol consumption levels are based on the number of units of alcohol consumed on the heaviest day during the previous week, the “maximum daily” amount.
Source: Office for National Statistics (�006) Smoking and drinking among adults, �005: General Household Survey �005.
Office for National Statistics: London. See www.ons.gov.uk/ghs
British HeartFoundation
Statistics Databasewww.heartstats.org
�4�
Figure 7.� Percentage exceeding daily benchmarks for alcohol consumption by sex and age, �005, Great Britain
0
5
10
15
20
25
30
35
40
45
50
16-24 25-44 45-64 65+ 16-24 25-44 45-64 65+
% e
xcee
din
g d
aily
ben
chm
arks
for
alco
ho
l co
nsu
mp
tio
n
Exceeding recommended daily benchmark Exceeding benchmark for heavy drinking
MenWomen
Note: Recommended daily benchmark is 4 units for men and � units for women. Benchmark for heavy drinking is 8 units for men and 6 units for women.
British HeartFoundation
Statistics Databasewww.heartstats.org
�4�
Table 7.� Percentage of adults consuming more alcohol than the recommended daily maximum by sex and age, �998 to �005, Great Britain
% exceeding daily benchmark for heavy drinking 8 10 10 10 9 9 8
Weighted base (000s) ��,6�5 ��,054 ��,985 ��,�0� ��,788 ��,�4� ��,�99Unweighted base 7,8�� 7,49� 8,�99 7,94� 9,�04 8,0�� ��,6�7
Source: Office for National Statistics (�006) Smoking and drinking among adults.General Household Survey �005. Office for National Statistics: London, and previous years. See www.ons.gov.uk/ghs
British HeartFoundation
Statistics Databasewww.heartstats.org
�44
Figure 7.� Percentage consuming more alcohol than the recommended daily maximum, adults aged �6 and over, �998 to �005, Great Britain
0
5
10
15
20
25
30
35
40
45
1998 2000 2001 2002 2003 2004 2005Year
% e
xcee
din
g b
ench
mar
k
Men - exceeding 4 units on heaviest drinking day
Men - exceeding 8 units on heaviest drinking day
Women - exceeding 3 units on heaviest drinking day
Women - exceeding 6 units on heaviest drinking day
British HeartFoundation
Statistics Databasewww.heartstats.org
�45
Table 7.4 Weekly alcohol consumption by sex and age, �99� to �005, Great Britain
Average weekly alcohol consumption (units)
Unweighted data Weighted data
Age 1992 1994 1996 1998 1998 2000 2001 2002 2005 Weighted base Unweighted �005 (000s) base �005
Source: Office for National Statistics (�006). Smoking and drinking among adults. General Household Survey �005. Office for National Statistics: London. See www.ons.gov.uk/ghs
Table 7.5 Usual frequency of drinking alcohol by sex, children aged �� to �5, �988 to �005, England
Notes: Respondents drawn from secondary schools (both state and independent) in England.
Source: National Centre for Social Research and National Foundation for Educational Research (�006). Drug use, smoking and drinking among young
people in England in �005. Department of Health: London.
British HeartFoundation
Statistics Databasewww.heartstats.org
�46
Table 7.6 Alcohol consumption by sex, country of Great Britain and Government Office Region in England, adults aged �6 and over, �005, Great Britain
Drinking last week
Drank Drank on 5 Drank 5 to Drank more Drank Weighted base Unweighted last week or more 8 units on than 8 units more than the (000s) sample days last at least one on at least recommended week day one day daily maximum
% % % % %
MEN
North East 73 20 21 21 42 84� 4�6North West 76 22 18 24 42 �,�69 �,�86Yorkshire and the Humber 79 22 17 25 42 �,7�� 898East Midlands 72 20 17 19 36 �,59� 8�9West Midlands 71 22 15 16 31 �,657 879East of England 72 21 16 17 33 �,857 994London 62 20 14 12 26 �,�6� �,0��South East 75 25 16 15 31 �,85� �,486South West 75 26 14 19 33 �,7�4 9�5
England 73 22 16 18 34 �6,798 8,646
Wales 75 21 16 18 34 96� 505
Scotland 68 16 16 22 38 �,708 87�
Great Britain 72 22 16 19 35 �9,468 �0,0�4
Drank Drank on 5 Drank 4 to Drank more Drank more Weighted base Unweighted last week or more 6 units on than 6 units than the (000s) base days last week at least on at least recommended one day one day daily maximum
WOMEN
North East 57 11 16 9 25 �,048 5�8North West 60 12 15 11 26 �,6�7 �,40�Yorkshire and the Humber 63 13 14 13 27 �,99� �,0�6East Midlands 57 12 12 7 19 �,7�4 9�8West Midlands 53 14 11 6 17 �,8�� 98�East of England 59 12 11 7 18 �,08� �,��9London 47 10 8 5 13 �,64� �,�88South East 61 17 12 6 18 �,�65 �,677South West 63 15 14 8 22 �,979 �,07�
England 58 13 12 8 20 �9,070 9,9��
Wales 55 11 10 8 18 �,�60 6�0
Scotland 51 9 12 9 21 �,054 �,068
Great Britain 57 13 13 8 20 ��,�84 ��,6�0
Notes: Alcohol consumption levels are based on the number of units of alcohol consumed on the heaviest drinking day during the previous week, the “maximum daily amount”.
Data are weighted for non-response.
Source: Office for National Statistics (�006) Smoking and drinking among adults, �005. General Household Survey �005. Office for National Statistics: London. See www.ons.gov.uk/ghs
British HeartFoundation
Statistics Databasewww.heartstats.org
�47
Figure 7.6a Percentage of men consuming more alcohol than the recommended daily maximum (four units) by region, �005, Great Britain
40.0 or above
36.0
33.0
32.9 or less
-
-
39.9
35.9
% drinking more thanthe recommendeddaily maximum
Figure 7.6b Percentage of women consuming more alcohol than the recommended daily maximum (three units) by region, �005, Great Britain
24.0 or above
21.0
18.0
17.9 or less
-
-
23.9
20.9
% drinking more thanthe recommendeddaily maximum
Adults aged �6 and over.
British HeartFoundation
Statistics Databasewww.heartstats.org
�48
Figure 7.6c Percentage of men exceeding daily benchmark for heavy drinking (eight units) by region, �005,
Great Britain
22.0 or above
19.0
16.0
15.9 or less
-
-
21.9
18.9
Drank more than8 units on atleast one day
Figure 7.6d Percentage of women exceeding daily benchmark for heavy drinking (six units) by region, �005, Great Britain
11.0 or above
9.0
7.0
6.9 or less
-
-
10.9
8.9
Drank more than6 units on atleast one day
Adults aged �6 and over.
British HeartFoundation
Statistics Databasewww.heartstats.org
�49
Table 7.7 Alcohol consumption by sex and socio-economic classifica-tion, adults aged �6 and over, �005, Great Britain
Drinking last week
Drank Drank on 5 Drank 5 to Drank more Drank Weighted base Unweighted last week or more 8 units on than 8 units more than the (000s) sample days last at least one on at least recommended week day one day daily maximum
% % % % %
MEN
Managerial and professional 79 26 16 18 34 8,090 4,�05
Large employers and higher managerial 82 29 17 19 36 �,407 777
Higher professional 79 29 18 14 32 �,9�4 �,0��
Lower managerial and professional 78 25 16 18 34 4,759 �,5�7
Intermediate 74 23 16 19 35 �,�66 �,7�9
Intermediate 74 22 18 19 37 �,�7� 677
Small employers and own account 74 24 16 18 34 �,995 �,04�
Drank Drank on 5 Drank 4 to Drank more Drank more Weighted base Unweighted last week or more 6 units on than 6 units than the (000s) base days last week at least on at least recommended one day one day daily maximum
WOMEN
Managerial and professional 66 16 14 8 22 8,69� 4,67�
Large employers and higher managerial 73 20 17 9 26 �,4�8 78�
Higher professional 69 18 13 8 21 �,76� 95�
Lower managerial and professional 64 15 15 7 22 5,5�� �,9�6
Intermediate 59 13 12 8 20 4,086 �,��6
Intermediate 59 12 13 8 21 �,�4� �,��9
Small employers and own account 58 14 13 7 20 �,845 997
Notes: Alcohol consumption levels are based on the number of units of alcohol consumed on the heaviest drinking day during the previous week, the “maximum daily amount”.
Data are weighted for non-response.
From April �00� the National Statistics Socio-economic classification (NS-SEC) was introduced for all official statistics and surveys. It has replaced Social Class based on Occupation and Socio-economic Groups (SEG). Persons whose household reference person was a full-time student, had an inadequately described occupation, had never worked or was long term unemployed are not shown as separate categories but are included in the figure for all persons.
Source: Office for National Statistics (�006). Smoking and drinking among adults, �005. General Household Survey �005. Office for National Statistics: London. See www.ons.gov.uk/ghs
British HeartFoundation
Statistics Databasewww.heartstats.org
�50
Table 7.8 Alcohol consumption by sex and ethnic group, adults aged �6 and over, �004, England
Alcohol consumed on the General Black Black Indian Pakistani Bangladeshi Chinese Irishheaviest drinking day population Caribbean African
% % % % % % % %
MEN
None 24 40 62 53 93 99 52 20Under 2 units 13 12 8 11 1 0 14 10Up to 4 units 55 72 83 77 96 99 81 44More than 4, up to 8 units 20 16 10 13 1 0 9 25More than 8 units 25 12 7 9 3 0 10 32
% exceeding 4 units 45 28 17 22 4 1 19 56
Unweighted base �,8�9 �97 �69 5�� 4�6 �95 ��7 490Weighted base 45,��9 465 �57 87� 406 �7� �47 �,75�
WOMEN
None 39 53 74 79 97 99 68 33Under 2 units 18 17 11 8 1 0 15 18Up to 3 units 70 81 92 92 98 99 88 64More than 3, up to 6 units 16 12 5 4 0 0 8 20More than 6 units 14 6 2 4 1 0 4 16
% exceeding 3 units 30 18 7 8 1 1 12 36
Unweighted base �,745 6�8 446 6�8 495 448 �64 64�Weighted base 47,6�� 64� 454 �,04� 488 �94 �58 �,��9
Notes: Age-standardised percentages (standardised risk ratios x percentage in general population).
Numbers may not add due to rounding.
Source: Department of Health (�005) Health Survey for England �004. The Information Centre: London
See http://www.ic.nhs.uk/pubs/healthsurvey�004ethnicfull
British HeartFoundation
Statistics Databasewww.heartstats.org
�5�
Figure 7.8a Alcohol consumption by ethnic group, men aged �6 and over, �004, England
0%
20%
40%
60%
80%
100%
Generalpopulation
BlackCaribbean
BlackAfrican
Indian Pakistani Bangladeshi Chinese Irish
Dai
ly c
on
sum
pti
on
Under 4 units
Over 4, less than8 units
8 or more units
Figure 7.8b Alcohol consumption by ethnic group, women aged �6 and over, �004, England
0%
20%
40%
60%
80%
100%
Generalpopulation
BlackCaribbean
BlackAfrican
Indian Pakistani Bangladeshi Chinese Irish
Dai
ly c
on
sum
pti
on
Under 3 units
Over 3, less than6 units
6 or more units
British HeartFoundation
Statistics Databasewww.heartstats.org
�5�
Table 7.9 Alcohol consumption by country, adults aged �5 and over, �00�, EuropeLitres pure alcohol per person per year
Albania 1.7 Lithuania 8.6Armenia 1.1 Luxembourg 14.6Austria 10.5 FYR Macedonia * 1.9Azerbaijan 3.1 Malta 5.4Belarus 4.8 Netherlands 7.8Belgium 8.9 Norway 4.8Bosnia and Herzegovina 8.3 Poland 6.7Bulgaria 5.0 Portugal 9.4Croatia 10.3 Republic of Moldova * 10.2Cyprus 9.0 Romania 7.4Czech Republic 13.7 Russia 8.9Denmark 9.8 Serbia and Montenegro * 6.8Estonia 9.7 Slovakia 9.5Finland 7.7 Slovenia 9.9France 10.0 Spain 10.0Georgia 1.3 Sweden 5.6Germany 10.7 Switzerland 9.4Greece 7.7 Tajikistan 0.3Hungary 11.6 Turkey 1.0Iceland 5.5 Turkmenistan 0.7Ireland 10.6 Ukraine 5.2Israel 1.7 United Kingdom 9.3Italy 7.6 Uzbekistan 1.0Kazakhstan 2.2 Europe average 8.8Kyrgyzstan 2.4 EU-�5 average 9.4Latvia 8.4 EU-�5 average 9.�
Notes: * data for these countries are for �00�.
Source: World Health Organization (�006) European Health for All statistical database.
http://www.euro.who.int/hfadb (accessed �� January �007)
British HeartFoundation
Statistics Databasewww.heartstats.org
�5�
Figu
re 7
.9
Alc
ohol
con
sum
ptio
n by
cou
ntry
, adu
lts a
ged
�5 a
nd o
ver,
�00�
, Eur
ope
0246810121416
Tajikistan
Turkmenistan
Turkey
Uzbekistan
Armenia
Georgia
Israel
Albania
FYR Macedonia *
Kazakhstan
Kyrgyzstan
Azerbaijan
Belarus
Norway
Bulgaria
Ukraine
Malta
Iceland
Sweden
Poland
Serbia and Montenegro *
Romania
Italy
Finland
Greece
Netherlands
Bosnia and Herzegovina
Latvia
Lithuania
Europe average
Russia
Belgium
Cyprus
EU-25 average
United Kingdom
EU-15 average
Portugal
Switzerland
Slovakia
Estonia
Denmark
Slovenia
France
Spain
Republic of Moldova *
Croatia
Austria
Ireland
Germany
Hungary
Czech Republic
Luxembourg
Litres pure alcohol per person per year
British HeartFoundation
Statistics Databasewww.heartstats.org
�54
8. Psychosocial Well-being
Four different types of psychosocial factor have been found to be most consistently associated
with an increased risk of CHD: work stress, lack of social support, depression (including anxiety)
and personality (particularly hostility)1. As yet there are no estimates of the numbers of deaths
from CHD which are due to poor psychosocial well-being or of the numbers of deaths which
could be avoided if psychosocial well-being was increased.
The Government acknowledges that ‘working in jobs which make very high demands, or in which
people have little or no control, increases the risk of coronary heart disease and premature death.
Inadequate social support or lack of social networks can also have a harmful effect on health
and on the chances of recovering from disease’2.
Depression The Health Survey for England 2003 and the Scottish Health Survey for 2003 used the General
Health Questionnaire (GHQ12) to assess levels of depression, anxiety, sleep disturbance and
happiness in the population. A GHQ12 score of 4 or more - a ‘high GHQ12 score’ - indicates a
high level of psychological distress.
Both surveys indicate that women have higher GHQ12 scores than men: 15% of women had
a high score, compared with 11% of men in England; 17% compared to 13% in Scotland. For
England, there was a tendency for men and women over the age of 75 to have higher scores than
those in younger age groups (Table 8.1 and Figure 8.1).
There was no clear relationship between GHQ12 scores and social class but there was an inverse
relationship between GHQ12 scores and income: people with low incomes tended to have higher
GHQ12 scores. For example, men with the lowest 20% of household incomes were almost three
times as likely to have a high GHQ12 score than those with the highest 20% of incomes (Table
8.2).
GHQ12 scores also vary geographically across England and were highest in men and women in
the North East. Men living in the North East of England were nearly 50% more likely to have a
high GHQ12 score than men living in other parts of the country. There was less variation among
women (Table 8.3).
GHQ12 scores vary by ethnicity in both men and women. Chinese men and women were less
likely to have a high GHQ12 score – just 9% of men and 13% of women compared to 11%
of men and 15% of women in the general population. The highest GHQ12 scores (and hence
the highest levels of psychological distress) in men were found in the Bangladeshi followed by
British HeartFoundation
Statistics Databasewww.heartstats.org
�55
the Indian communities: 18% of Bangladeshi men and 16% of Indian men had high GHQ12
scores. The highest GHQ12 scores in women were found in the Pakistani and Black African
communities: 20% of Pakistani women and 19% of Black African women had high GHQ12
scores (Table 8.4).
Social supportMen are more likely to report a lack of social support than women. The 2003 Health Survey for
England found that 17% of men but only 10% of women reported a severe lack of social support.
There was no clear pattern of reported social support in relation to age (Table 8.5).
Lack of social support is strongly associated with socio-economic classification. Both men and
women in the semi-routine and routine category were more than twice as likely to report a severe
lack of social support as those in the managerial and professional group (Table 8.6 and Figure
8.6). Furthermore those with higher incomes were less likely to report a lack of social support
than those with lower incomes (Table 8.7).
Social support also varies with ethnicity. Men and women of Pakistani and Bangladeshi origin
were more likely to report a severe lack of social support compared with the general population.
Pakistani and Bangladeshi adults were well over twice as likely to perceive a severe lack of
social support, with over one-third of Pakistani (38%) and Bangladeshi (35%) men, and about
one-third of Pakistani (30%) and Bangladeshi (33%) women experiencing little social support
(Table 8.8 and Figure 8.8).
Work-related stressThe 1994 Health Survey for England investigated levels of work-related stress in the population.
The survey examined control over work, variety of work and pace of work. The dominant ‘job
strain’ model of work-related stress suggests that a worker with low control, little variety and
high work pace is particularly exposed to work-related stress. There is a growing recognition that
control over work is more important than variety or pace in relation to risk of CHD1.
About a third of men and women reported a high pace of work. Those in the middle of the
working age-range reported the highest work pace although the difference was more marked
for men than for women. Women were more likely to report a low level of variety at work than
men. Variety at work was lowest in 16 to 24 year olds and those over 55. Women reported less
control over their work than men: 31% of women reported a low level of control compared
with 19% of men. 16 to 24 year olds reported lower levels of control than those in older age
groups (Table 8.9).
Those in social classes I and II reported higher levels of pace, variety and control than other social
classes with those in social classes IV and V reporting the lowest levels of all three. Men in social
class V were eight times more likely to report low control over work as those in social class I
and women were three times more likely (Table 8.10 and Figure 8.10). These results should be
interpreted with caution as these data are now over ten years old.
�. Hemingway H, Marmot M (�999) Psychosocial factors in the aetiology and prognosis of coronary heart disease: systematic review of prospective cohort studies. BMJ: ��8; �460-7.
�. Department of Health (�999) Saving Lives: Our Healthier Nation. DH: London.
British HeartFoundation
Statistics Databasewww.heartstats.org
�56
Table 8.� GHQ�� score by sex and age, adults aged �6 and over, �00�, England and Scotland
Unweighted base 4,�85 �9� 58� 85� 76� 7�7 5�7 4��Weighted base 4,057 547 640 78� 664 570 447 408
Notes: GHQ�� is a questionnaire containing �� questions about general level of happiness, depression, anxiety and sleep disturbance over the past four weeks. In the �00� Health Survey for England a score of 4 or more was used as a threshold to identify informants with high levels of psychological distress, and is referred to as a “high GHQ�� score”.
Source: Department of Health (�004) Health Survey for England �00�. The Stationery Office: London.
The Scottish Executive (�005). The Scottish Health Survey �00�, Vol �. The Stationery Office: Edinburgh.
British HeartFoundation
Statistics Databasewww.heartstats.org
�57
Figure 8.�a High GHQ�� score (4+) by sex and age, �00�, England
0
2
4
6
8
10
12
14
16
18
16–24 25–34 35–44 45–54 55–64 65–74 75+
Age group
% w
ith
hig
h G
HQ
12
sco
re (4
+)
MenWomen
Figure 8.�b High GHQ�� score (4+) by sex and age, �00�, Scotland
16–24 25–34 35–44 45–54 55–64 65–74 75+
Age group
MenWomen
0
2
4
6
8
10
12
16
18
20
% w
ith
hig
h G
HQ
12
sco
re 14
British HeartFoundation
Statistics Databasewww.heartstats.org
�58
Table 8.� GHQ�� score by sex and household income, adults aged �6 and over, �00�, England and Scotland
Equivalised household income quintile
Lowest 2nd 3rd 4th Highest
GHQ12 score % % % % %
ENGLAND
MEN0 54 63 67 71 681–3 23 23 23 22 244 or more 23 14 10 7 8
Unweighted base 87� 84� �,��0 �,�44 �,��8Weighted base 9�8 895 �,�09 �,�7� �,�45
WOMEN 0 54 57 62 63 621–3 27 26 24 23 274 or more 19 17 15 13 11
Unweighted base �,�9� �,�9� �,487 �,�99 �,���Weighted base �,�69 �,064 �,�65 �,��6 �,�44
SCOTLAND
MEN0 55 62 68 72 731–3 21 23 17 20 184 or more 24 15 15 8 9
Unweighted base 44� 6�� 557 6�6 747Weighted base 475 590 59� 665 8��
WOMEN0 49 59 61 65 621–3 26 21 22 22 274 or more 24 20 16 13 11
Unweighted base 655 870 7�5 69� 78�Weighted base 6�5 789 685 658 750
Notes: Data are weighted for non response. The weighted base is the base for age-standardised percentages. For method of age-standardisation see source.
Source: Department of Health (�004) Health Survey for England �00�. The Stationery Office: London. The Scottish Executive (�005) The Scottish Health Survey �00�, Vol �. The Stationery Office: Edinburgh.
Table 8.� GHQ�� score by sex and Government Office Region, �00�, England
Government Office Region
Yorkshire North North & the East West East South South East West Humber Midlands Midlands England London East WestGHQ12 score % % % % % % % % %
Notes: Data are weighted for non response. The weighted base is the base for age-standardised percentages. For method of age-standardisation see source.
Source: Department of Health (�004) Health Survey for England �00�. The Stationery Office: London.
British HeartFoundation
Statistics Databasewww.heartstats.org
�59
Table 8.4 Prevalence of high GHQ�� score (4+) by sex and ethnic group, adults aged �6 and over, �004, England
General Black Black Indian Pakistani Bangladeshi Chinese Irish population Caribbean African % % % % % % % %
MEN 11 13 11 16 15 18 9 12 Weighted base 4�,950 �7� �95 769 ��5 �04 ��5 �,6�4Unweighted base �,6�� ��5 �9� 464 ��� �46 ��0 4�7
WOMEN 15 18 19 14 20 15 13 15
Weighted base 44,845 556 �64 890 ��8 ��� ��9 �,�8�Unweighted base �,5�� 5�4 �50 5�4 ��4 �8� ��8 587
Notes: Age-standardised percentages (standardised risk ratios x percentage in general population).
Source: Department of Health (�005) Health Survey for England. The Health of Minority Ethnic Groups �004. The Stationery Office: London.
Table 8.5 Perceived social support by sex and age, �00�, England
Weighted base �,79� 68� 706 8�� �,995Unweighted base �,974 75� 757 887 �,�9�
Notes: From April �00� the National Statistics Socio-economic classification (NS-SEC) was introduced for all official statistics and surveys. It has replaced Social Class based on Occupation and Socio-economic Groups (SEG).
Data are weighted for non response. The weighted base is the base for age-standardised percentages. For method of age-standardisation see source.
Source: Department of Health (�004) Health Survey for England �00�. Volume �: Risk factors for CVD. The Stationery Office: London.
Figure 8.6 Percentage perceiving severe lack of social support by sex and socio- economic classification, adults aged �6 and over, �00�, England
0
5
10
15
20
25
30
Managerial & professional Intermediate Small employers & ownaccount workers
Lower supervisory &technical
Semi-routine & routine
NS-SEC of household reference person
%
MenWomen
British HeartFoundation
Statistics Databasewww.heartstats.org
�6�
Table 8.7 Perceived social support by sex and household income, adults aged �6 and over, �00�, England
Equivalised household income quintile
Lowest 2nd 3rd 4th HighestPerceived social support % % % % %
Weighted base �,�84 �,068 �,�78 �,��9 �,�50Unweighted base �,��0 �,�97 �,50� �,400 �,���
Notes: Data are weighted for non response. The weighted base is the base for age-standardised percentages. For method of age-standardisation see source.
Source: Department of Health (�004) Health Survey for England �00�. The Stationery Office: London.
Table 8.8 Percentage perceiving severe lack of social support by sex and ethnic group, adults aged �6 and over, �004, England
General Black Black Indian Pakistani Bangladeshi Chinese Irish population Caribbean African
% % % % % % % %
MEN 16 25 23 29 38 35 30 17
Weighted base 4�,��8 �90 �96 77� ��5 �04 ��5 �6�4Unweighted base �,6�6 ��7 �96 467 ��� �46 ��� 4��
WOMEN 11 20 23 22 30 33 26 11
Weighted base 45,��� 567 �77 907 �4� ��6 �4� ��95Unweighted base �,548 5�� �6� 54� �46 �9� ��8 597
Notes: Age-standardised percentages (standardised risk ratios x percentage in general population).
Source: Department of Health (�005) Health Survey for England. The Health of Minority Ethnic Groups �004. The Stationery Office: London.
British HeartFoundation
Statistics Databasewww.heartstats.org
�6�
Figure 8.8 Percentage perceiving severe lack of social support by sex and ethnic group, adults aged �6 and over, �004, England
0
5
10
15
20
25
30
35
40
Generalpopulation
BlackCaribbean
Black African Indian Pakistani Bangladeshi Chinese Irish
Ethnic group
%
MenWomen
Table 8.9 Amount of control over work, amount of variety in work and pace of work among adults in paid employment, by sex and age, adults aged �6 and over, �994, England
Source: Department of Health (�996) Health Survey for England �994. The Stationery Office: London.
British HeartFoundation
Statistics Databasewww.heartstats.org
�6�
Table 8.�0 Percentage of adults in paid employment with low control over work, high pace of work and low variety of work, by sex and social class, adults aged �6 and over, �994, England
Total I II IIINM IIIM IV V
% % % % % % %
MEN
Low control over work 20 6 6 21 22 40 47Low variety at work 33 9 18 35 35 62 66High pace of work 32 40 40 30 27 24 26
Base 4,4�� �99 �,�95 498 �,�7� 5�9 �79
WOMEN
Low control over work 31 14 10 36 31 50 46Low variety at work 51 8 22 56 52 74 92High pace of work 33 42 45 30 29 25 20
Base 4,070 �08 �,�4� �,5�9 �74 655 �40
Notes: Age-standardised percentages. For method of standardisation see source.
Base varied slightly between questions. Base given for ‘variety at work’.
Source: Department of Health (�996) Health Survey for England �994. The Stationery Office: London.
Figure 8.�0 Percentage of employed adults with low control at work, by sex and social class, �994, England
0
10
20
30
40
50
60
I II IIINM IIIM IV VSocial class
Emp
loye
d a
du
lts
(%)
MenWomen
British HeartFoundation
Statistics Databasewww.heartstats.org
�64
9. Blood Pressure
Risk of CHD is directly related to both systolic and diastolic blood pressure levels. Meta-analysis
of prospective data on over one million adults has shown that for adults aged 40 to 69 years, each
20mmHg increase in usual systolic blood pressure, or 10mmHg increase in usual diastolic blood
pressure, doubles the risk of death from CHD1. At older ages the increase in risk of death from
CHD is smaller, around 50% increase for every 20mmHg increase in usual systolic or 10mmHg
increase in diastolic blood pressure in adults aged 80 to 89 years.
Research from the World Health Organization suggests that the cardiovascular burden due to
raised blood pressure may be greater than previously suggested. The World Health Report 2002
estimates that around 11% of all disease burden in developed countries is caused by raised blood
pressure, and that over 50% of CHD and almost 75% of stroke in developed countries is due to
systolic blood pressure levels in excess of the theoretical minimum (115mmHg)2.
More recently the INTERHEART study estimated that 22% of heart attacks in Western Europe
and 25% of heart attacks in Central and Eastern Europe were due to a history of high blood
pressure, and that those with a history of hypertension were at just under twice the risk of a heart
attack compared to those with no history of hypertension3.
The 2004 British Hypertension Society guidelines for hypertension management recommend that
drug treatment should be considered for individuals with blood pressures of 140/90mmHg or
over, and that optimal blood pressure treatment targets are a systolic blood pressure of less than
140mmHg and a diastolic blood pressure of less than 85mmHg (and lower still, at 130/85mmHg,
in people with diabetes). People with high normal blood pressures 130-139/85-89mmHg should
be assessed yearly. The optimal blood pressure level is now classified as <120/<80mmHg4 (Table
9.1).
Both drug treatment and lifestyle changes - particularly weight loss, an increase in physical activity,
and a reduction in salt and alcohol intake - can effectively lower blood pressure.
Public health targetsThere are no blood pressure targets for England, Wales, Scotland or Northern Ireland. The blood
pressure recommendations and definition of hypertension are set out in Table 9.1.
Overall levelsIn 2005 the mean systolic blood pressure for men in England was 134mmHg, and for women
128mmHg (Table 9.2 and Figure 9.2).
In England in 2005 35% of men and 28% of women had hypertension (defined here as a systolic
British HeartFoundation
Statistics Databasewww.heartstats.org
�65
blood pressure of 140mmHg or over, or a diastolic blood pressure of 90mmHg or over) or
were being treated for hypertension. Around three-fifths (59%) of men and two-fifths (44%) of
women with hypertension were not receiving treatment. Of those that were treated, just over
50% remained hypertensive (Table 9.3).
Age and sex differencesMean systolic blood pressure increases with age in both men and women. In 2005 mean systolic
blood pressure was 128mmHg in men aged 16 to 24 compared to 141mmHg in men aged 75
and over, and 117mmHg compared to 144mmHg in women (Table 9.2).
The prevalence of hypertension increases with age in both sexes. For example, only 1% of women
aged 16 to 24 are hypertensive, compared to 42% aged 55 to 64 and two-thirds aged 65 to 74
(Table 9.3 and Figure 9.3).
Temporal trendsHealth Survey for England data show that since 1993 there has been a general tendency for
mean systolic and diastolic blood pressure to fall. This change has occurred in both men and
women, and has been more pronounced among older compared to younger age groups (Table
9.2 and Figure 9.2).
Between 1998 and 2005, the prevalence of high blood pressure in England fell slightly in men
(from 41% to 39%), and women (from 33% to 29%)5 (Table 9.4).
National and regional differencesData from the Scottish Health Survey suggest that the prevalence of high blood pressure is
similar in England and Scotland. In 2003, 34% of English men and 30% of English women were
hypertensive compared to 33% of Scottish men and 33% of Scottish women6 (Table 9.5).
Data from Wales and Northern Ireland are not comparable with those for England and Scotland,
as they are not based on direct blood pressure measurements. In Wales, the Welsh Health Survey
2004/05, showed that 19% of people reported being treated for raised blood pressure7. In
Northern Ireland, the Northern Ireland Health and Social Wellbeing Survey 2001, found that
19% of men and 27% of women reported having been informed by a health professional that
they had high blood pressure8.
Socio-economic differencesIn England in 2003, the age-standardised prevalence of high blood pressure was highest in lower
supervisory and technical households in both men and women. The prevalence ranged from 25%
in managerial and professional households to 29% in lower supervisory and technical households
in men, and from 24% to 32% in women (Table 9.6).
Ethnic differencesData from the Health Survey for England show that in 2004 the proportion of men with high
blood pressure in Bangladeshi men was half that of the general population; in Pakistani and
Chinese men the proportion was two thirds that of the general population. Pakistani and Chinese
British HeartFoundation
Statistics Databasewww.heartstats.org
�66
women were half as likely to have high blood pressure than women in the general population
(Table 9.7).
The prevalence of untreated hypertension was lower among Pakistani, Bangladeshi and Chinese
men and Indian, Pakistani, Bangladeshi and Chinese women than in the general population9.
International differencesData from the World Health Organization10 show a wide range in mean systolic blood pressure
throughout Europe. For men in 2002, the lowest systolic blood pressure was found in Turkey
(117.6mmHg) and the highest in Georgia (139.7 mmHg). For women in 2002 the lowest was
Denmark (114.8 mmHg) and the highest was Georgia (134.6 mmHg) (Table 9.8 and Figures
9.8a and 9.8b). Mean systolic blood pressure in the UK in 2002 was 132.2 mmHg for men and
121.2 mmHg for women.
Trend data from the World Health Organization’s MONICA Project show that between the mid-
1980s and mid-1990s the majority of populations included in the study experienced a decline
in average systolic blood pressure. Compared to other cities in the study, declines in average
systolic blood pressure were moderately high in Glasgow but low in Belfast, where no significant
decline occurred11.
�. Prospective Studies Collaboration (�00�) Age-specific relevance of usual blood pressure to vascular mortality: a meta analysis of individual data for one million adults in 6� prospective studies. The Lancet; �60: �90�-�9��.
�. World Health Organization (�00�) The World Health Report �00�. Reducing Risks, Promoting Healthy Life. World Health Organization: Geneva.
�. Yusaf S, Hawken S, Ounpuu S, Dans T, Avezum A, Lanas F, McQueen M, Budaj A, Pais P, Varigo J, Lisheng A, on behalf of the INTERHEART Study Investigators (�004) Effect of potentially modifiable risk factors associated with myocardial infarction in 5� countries (the INTERHEART Study): case-control study. The Lancet; �64: 9�7-95�.
4. Williams B, Poulter N, Brown M, Davis M, McInnes G, Potter J, Sever P, Thom S; the BHS guidelines working party, for the British Hypertension Society (�004) British Hypertension Society guidelines for hypertension management �004 (BHS-IV): summary. BMJ; ��8: 6�4-640.
5. These figures are the unweighted results from both surveys. While weighted data from �00� are available and provide the best estimate for this year, when looking at trends the unweighted data are more consistent with previous years.
6. The Scottish Health Survey (SHS) uses the same methods as the Health Survey for England.
7. National Assembly for Wales (�006) Welsh Health Survey �004/05. The Stationery Office: Cardiff.
8. Department of Health, Social Services and Public Safety (�00�) Northern Ireland Health and Social Wellbeing Survey �00�. National Statistics and Research Agency: Belfast.
9. See Table 7.�, page �� in The Health of Minority Ethnic Groups - headline tables (�005) Health Survey for England �004. NHS Health and Social Care Information Centre.
�0. World Health Organization (�005) The SuRF Report �. Surveillance of chronic disease Risk Factors – Country level data and comparable estimates. WHO Global Infobase (www.who.int/ncd_surveillance/infobase/web/surf�/start.html).
��. WHO MONICA Project (�00�) Monica monograph and multimedia sourcebook. Edited by Hugh Tunstall-Pedoe for the WHO MONICA Project. WHO: Geneva.
British HeartFoundation
Statistics Databasewww.heartstats.org
�67
Table 9.� Blood pressure recommendations and hypertension definition for the United Kingdom
Recommendations1
Systolic blood pressure –
general population No greater than 140mmHg
Systolic blood pressure – diabetes or
chronic renal failure sufferers No greater than 130mmHg
Diastolic blood pressure –
general population No greater than 85mmHg
Diastolic blood pressure – diabetes or
chronic renal failure sufferers No greater than 80mmHg
Hypertension1
Definition Systolic blood pressure greater than
or equal to 140mmHg, and / or
diastolic blood pressure greater than or
equal to 90mmHg
Threshold for drug treatment Sustained levels of systolic blood
pressure greater than or equal to
160mmHg, and / or diastolic blood
pressure greater than or equal to
100mmHg
�. Williams B, Poulter NR, Brown MJ et al (�004). Guidelines for management of hypertension: report of the fourth working party of the British Hypertension Society �004-BHS IV. Journal of Human Hypertension. �8; ��9-�85.
British HeartFoundation
Statistics Databasewww.heartstats.org
�68
Table 9.� Systolic and diastolic blood pressure by sex and age, adults aged �6 and over, �99� to �005, England
Notes: Weighted data provide the best estimates for �00� to �005. However, for looking at trends, unweighted data for �00� to �005 are more consistent with previous years which are also unweighted.
The sample size in �999 and �004 was not sufficient to estimate mean systolic and diastolic blood pressure levels.
Source: The Information Centre (�006) Health Survey for England �005. Latest trends. See http://www.ic.nhs.uk/pubs/hseupdate05/tabs/file
British HeartFoundation
Statistics Databasewww.heartstats.org
�69
Figure 9.� Mean systolic blood pressure by sex, adults aged �6 and over, �99� to �005, England
All with high blood pressure 28.3 1.3 4.0 10.0 21.4 41.7 61.9 72.7
Unweighted base �,�9� ��6 ��5 4�9 45� 4�� �98 �40Weighted base �,�08 �70 ��7 400 �47 �4� �57 �64
Notes: Data are weighted for non response.
Informants were classified as having high blood pressure if their systolic blood pressure was �40mmHg or over or their diastolic blood pressure was 90mmHg or over, or they were taking medicine affecting blood pressure. “Treated” means taking medication prescribed for high blood pressure.
Source: The Information Centre (�006) Health Survey for England �005. Latest trends. See http://www.ic.nhs.uk/pubs/hseupdate05/tabs/file
Figure 9.� Prevalence of high blood pressure by sex and age, �005, England
0
10
20
30
40
50
60
70
80
16–24 25–34 35–44 45–54 55–64 65–74 75+Age group
% w
ith
hig
h b
loo
d p
ress
ure
MenWomen
British HeartFoundation
Statistics Databasewww.heartstats.org
�7�
Table 9.4 Prevalence of high blood pressure by sex and age, �998 to �005, England
Notes: Adults aged �6 and over with a valid blood pressure reading and data on medication.
Informants were classified as having high blood pressure if their systolic blood pressure was �40mmHg or over or their diastolic blood pressure was 90mmHg or over, or they were taking medicine affecting blood pressure.
Weighted data provide the best estimate for �00� and �005. However, for looking at trends, unweighted data for �00� and �005 are more consistent with previous years which are also unweighted.
Source: Department of Healyh (�006) Health Survey for England �005. See Department of Health website: http://www.dh.gov.uk/assetRoot/04/09/89/�5/040989�5.xls, Table �a.
British HeartFoundation
Statistics Databasewww.heartstats.org
�7�
Table 9.5 Blood pressure levels by sex and age, adults aged �6 and over, �00�, Scotland
All with high blood pressure 32.7 1.9 5.5 16.6 27.4 49.1 68.1 77.2
Weighted base �,�8� ��5 �48 440 �7� �40 �85 �8�Unweighted base �,5�8 �8� �99 49� 454 478 �5� �8�
Notes: Adults aged �6 and over with a valid blood pressure reading and data on medication.
Informants were classified as having high blood pressure if their systolic blood pressure was �40mmHg or over or their diastolic blood pressure was 90mmHg or over, or they were taking medicine affecting blood pressure. “Treated” means taking medication prescribed for high blood pressure.
Source: The Scottish Executive (�005). The Scottish Health Survey �00�. The Stationery Office: Edinburgh
British HeartFoundation
Statistics Databasewww.heartstats.org
�7�
Table 9.6 Blood pressure levels by sex and socio- economic classification, �00�, England
NS-SEC of head of household
Small employers Lower Managerial & & own account supervisory Semi-routine professional Intermediate workers & technical & routine
All with high blood pressure 24.3 26.6 25.7 32.0 26.7
Unweighted base �,0�4 498 5�0 588 �,�5�Weighted base �,8�8 457 48� 550 �,�54
Notes: From April �00� the National Statistics Socio-economic classification (NS-SEC) was introduced for all official statistics and surveys. It has replaced Social Class based on Occupation and Socio-economic Groups (SEG).
Data are weighted for non response. The weighted base is the base for age-standardised percentages. For method of age-standardisation see source.
Source: Department of Health (�004) Health Survey for England �00�. The Stationery Office: London.
Table 9.7 Prevalence of high blood pressure by sex and ethnic group, adults aged �6 and over, �004, England
General Black Black Indian Pakistani Bangladeshi Chinese Irish population Caribbean African
High blood pressure % % % % % % % %
MEN 32 38 25 33 20 16 20 36
Weighted base 4,4�0 �69 ��6 �6� �59 5� 6� 667Unweighted base 4,�08 �55 ��� �65 �6� 99 �5� �40
WOMEN 29 32 19 18 15 19 16 29
Weighted base 4,70� �49 �8� 44� �07 8� 66 9��Unweighted base 5,075 �4� �54 ��0 �07 �44 �66 ��8
Notes: Age-standardised percentages (standardised risk ratios x percentage in general population). For observed values see source.
Adults with a valid blood pressure reading and data on medication.
Informants were classified as having high blood pressure if their systolic blood pressure was �40mmHg or over or their diastolic blood pressure was 90mmHg or over, or they were taking medication for high blood pressure.
Comparative data for the general population are not available for �004 so data have been taken from �00� survey, which was weighted for non-response. �004 survey is weighted for differential selection probabilities and individual-level non-response at each stage but not for household non-response.
Source: Department of Health (�005) Health Survey for England �004. The Health of Minority Ethnic Groups. The Stationery Office: London.
British HeartFoundation
Statistics Databasewww.heartstats.org
�74
Table 9.8 Mean systolic blood pressure estimates and projections for �00�, �005 and �0�0 by sex, adults aged �5 and over, all available countries, Europe
Notes: Values age-adjusted to the WHO Standard Population.
Mean SBP is measured in mmHg.
Standard deviation available upon request, contact [email protected].
Source: World Health Organization (�005) The SuRF Report �. Surveillance of chronic disease Risk Factors - Country-level data and comparable estimates. WHO Global InfoBase (http://infobase.who.int)
British HeartFoundation
Statistics Databasewww.heartstats.org
�75
Figure 9.8a Mean systolic blood pressure estimates, men aged �5 and over, all available countries, �00�, Europe
100
105
110
115
120
125
130
135
140
Turk
ey
Uzb
ekis
tan
Den
mar
k
Spai
n
Icel
and
Luxe
mb
ou
rg
Swit
zerl
and
Port
ug
al
Ro
man
ia
Bel
giu
m
Ukr
ain
e
Isra
el
Cyp
rus
Au
stri
a
Pola
nd
Alb
ania
Ital
y
Fran
ce
Russ
ian
Fed
erat
ion
Cze
ch R
epu
blic
Bo
snia
an
d H
erze
gov
ina
Gre
ece
Net
her
lan
ds
Swed
en
Esto
nia
Fin
lan
d
Un
ited
Kin
gd
om
Mal
ta
Bu
lgar
ia
Serb
ia a
nd
Mo
nte
neg
ro
Hu
ng
ary
Bel
aru
s
Ger
man
y
Lith
uan
ia
Geo
rgia
Mea
n s
ysto
lic B
P
Figure 9.8b Mean systolic blood pressure estimates, women aged �5 and over, all available countries, �00�, Europe
100
105
110
115
120
125
130
135
140
Mea
n s
ysto
lic B
P
Den
mar
k
Swit
zerl
and
Spai
n
Icel
and
Turk
ey
Bel
giu
m
Luxe
mb
ou
rg
Isra
el
Uzb
ekis
tan
Net
her
lan
ds
Esto
nia
Ital
y
Ro
man
ia
Au
stri
a
Cze
ch R
epu
blic
Pola
nd
Cyp
rus
Gre
ece
Port
ug
al
Fin
lan
d
Fran
ce
Swed
en
Alb
ania
Bu
lgar
ia
Ukr
ain
e
Hu
ng
ary
Un
ited
Kin
gd
om
Russ
ian
Fed
erat
ion
Mal
ta
Serb
ia a
nd
Mo
nte
neg
ro
Ger
man
y
Bo
snia
an
d H
erze
gov
ina
Lith
uan
ia
Geo
rgia
British HeartFoundation
Statistics Databasewww.heartstats.org
�76
10. Blood Cholesterol
Risk of CHD is directly related to blood cholesterol levels. Blood cholesterol levels can be reduced
by drugs, physical activity and by dietary changes, in particular a reduction in the consumption
of saturated fat.
Research from the World Health Organization highlights the importance of raised blood cholesterol
as a risk factor for CHD. The World Health Report 2002 estimates that around 8% of all disease
burden in developed countries is caused by raised blood cholesterol, and that over 60% of CHD
and around 40% of ischaemic stroke in developed countries is due to total blood cholesterol
levels in excess of the theoretical minimum (3.8mmol/l)1.
More recently the INTERHEART case-control study estimated that 45% of heart attacks in
Western Europe and 35% of heart attacks in Central and Eastern Europe are due to abnormal
blood lipids, and that those with abnormal lipids are at over three times the risk of a heart attack
compared to those with normal lipids2.
Different guidelines give slightly different advice for managing high levels of blood cholesterol
(hyperlipidaemia). The National Service Framework for coronary heart disease includes guidelines
on the prevention of CHD in clinical practice and suggests a cholesterol target of less than
5.0mmol/l for both primary and secondary prevention3. More recent guidelines suggest a target
for total cholesterol of less than 4.0mmol/l for individuals with established cardiovascular disease,
diabetes, or at high risk of developing cardiovascular disease (Table 10.1).
High-density lipoprotein cholesterol (HDL-cholesterol) is the fraction of cholesterol that removes
cholesterol (via the liver) from the blood. Low levels of HDL-cholesterol are associated with an
increased risk of CHD and a worse prognosis after a heart attack. Guidelines on HDL-cholesterol
generally recommend treatment for those with concentrations below 1.0mmol/l (Table 10.1).
Overall levelsThe mean blood cholesterol level for men aged 16 and over in England in 2003 was 5.5mmol/l
and for women 5.6mmol/l4. About 70% of both men and women had blood cholesterol levels
of 5.0mmol/l and above. In Scotland, the mean blood cholesterol level in 2003 was 5.4mmol/l
for men and 5.6mmol/l for women, and 63% of both men and women aged 16 to 64 had levels
of 5.0mmol/l and above5 (Table 10.2).
The mean HDL-cholesterol level for those aged 16 and over in England in 2003 was 1.4mmol/l
for men and 1.6mmol/l for women4, and in Scotland 1.3mmol/l for men and 1.6mmol/l for
women5. Overall, about 6% of men and 2% of women had HDL-cholesterol levels of less than
1.0mmol/l in England (around 8% and 2% in Scotland) (Table 10.3).
British HeartFoundation
Statistics Databasewww.heartstats.org
�77
Age and sex differencesThe prevalence of raised cholesterol increases with age in both men and women. In 2003, the
proportion of men with cholesterol levels of 5.0mmol/l or above was 28% in those aged 16 to
24 compared to around 80% in those aged 45 to 64, and slightly lower in the two oldest age
groups. The proportion of women with cholesterol levels of 5.0mmol/l or above was 34% in
those aged 16 to 24 compared to 88% in those aged 55 to 64, and slightly lower in those over
65 years (Table 10.2 and Figure 10.2).
The prevalence of low HDL-cholesterol showed smaller age-related variation, with no clear
pattern (Table 10.3).
Rates of low HDL-cholesterol are much higher in men than women – over three times higher
overall, and between two and eight times higher in all age groups (Table 10.3).
Temporal trendsIn both England and Scotland, and for both men and women, the prevalence of raised total
cholesterol fell between 1994 and 1998, but increased slightly between 1998 and 2003. This
increase was not consistent across all age groups but was concentrated in the younger age groups.
In older age groups (55 and older in men and 65 and older in women) the prevalence of raised
total cholesterol has fallen steadily over the past decade (Table 10.2).
National and regional differencesIn 2003, the proportion of people with total cholesterol levels of 5mmol/l and above ranged
between around 60% and 70% for different regions of England, for both men and women.
London had the lowest prevalence of raised cholesterol (60% in men, 64% in women), and the
North West had the highest prevalence (71% in men, 69% in women) (Table 10.4).
This pattern was not repeated for low HDL-cholesterol. The proportion of people with HDL-
cholesterol less than 1.0mmol/l was lowest in the North West (3% in men, 1% in women), and
highest in Yorkshire and the Humber (10% in men, 3% in women) (Table 10.4).
Socio-economic differencesTotal blood cholesterol levels show little social class variation in either sex. However, low HDL-
cholesterol levels vary with income, most notably in women, where those with higher incomes
are less likely to have levels of HDL-cholesterol below 1.0mmol/l (Tables 10.5 and 10.6).
Two longitudinal cohort studies in the UK examined socio-economic variations in baseline
cholesterol levels. The West of Scotland cohort data (employed men aged 35 to 64 in 1970 to 1973
from West of Scotland) showed a slight gradient in cholesterol levels, with lower total cholesterol
levels in the lower social classes6. The Whitehall II study (male and female civil servants aged 35
to 55 in 1985 to 1988 from London) found a slight gradient with higher total cholesterol levels
in the lower social classes7.
Ethnic differencesIn 2004, the prevalence of blood cholesterol levels of 5.0mmol/l and above, was lower in all ethnic
minority groups than the general population, with the exception of the Irish (Table 10.6).
British HeartFoundation
Statistics Databasewww.heartstats.org
�78
The highest rates of HDL-cholesterol below 1.0mmol/l for both sexes in 2005 were found in
the Indian, Pakistani and Bangladeshi communities. One fifth of Bangladeshi men had an HDL-
cholesterol level of less than 1.0mmol/l compared to 6% of men in the general population. In
contrast Black Caribbean men and women had a relatively low prevalence of low HDL-cholesterol
(Table 10.7).
International differencesTotal blood cholesterol levels in the UK are high by international standards, particularly in
women. For example, data from the World Health Organization MONICA Project show that
mean blood cholesterol levels in Beijing, China were about 4.5mmol/l for men and women aged
35 to 64 in 1993; and only 20% of men aged 35 to 64 and 19% of women had levels above
5.2mmol/l (Table 10.8 and Figure 10.8).
Trend data from the MONICA Project show that between the mid-1980s and mid-1990s around
half of the populations included in the study experienced a decline in average blood cholesterol
levels. Compared to other cities in the study, declines in average blood cholesterol level were above
average in Glasgow and Belfast, where significant declines occurred in both men and women8.
The World Health Organization global database holds worldwide estimates of mean total
cholesterol levels for countries. These estimates are derived from national or sub-national surveys,
and have been adjusted to national age-standardised populations. Trend data has been used to
standardise the estimates to 2005. Their estimate suggests that mean total cholesterol levels for
both men and women in the UK in 2005 were 5.1mmol/l, around average for Europe (Table
10.9 and Figure 10.9).
�. World Health Organization (�00�) The World Health Report �00�. Reducing Risks, Promoting Healthy Life. World Health Organization: Geneva.
�. Yusaf S, Hawken S, Ounpuu S, Dans T, Avezum A, Lanas F, McQueen M, Budaj A, Pais P, Varigo J, Lisheng A, on behalf of the INTERHEART Study Investigators (�004) Effect of potentially modifiable risk factors associated with myocardial infarction in 5� countries (the INTERHEART Study): case-control study. The Lancet; �64: 9�7-95�.
�. Department of Health (�000) National Service Framework for Coronary Heart Disease. DH: London.
4. Department of Health (�004) Health Survey for England �00�. DH: London
5. Scottish Executive (�005) The Scottish Health Survey �00�. Scottish Executive: Edinburgh.
6. Blane D, Hart C, Davey Smith G (�996). Association of cardiovascular disease risk factors with socioeconomic position during childhood and during adulthood. BMJ, ���: �4�4-8.
7. Brunner E, Shipley M, Blane D (�999). When does cardiovascular risk start? Past and present socioeconomic circumstances and risk factors in adulthood. Journal of Epidemiology and Community Health, 5�; 757-64.
8. WHO MONICA Project (�00�) Monica monograph and multimedia sourcebook. Edited by Hugh Tunstall-Pedoe for the WHO MONICA Project. WHO: Geneva.
British HeartFoundation
Statistics Databasewww.heartstats.org
�79
Table �0.� Cholesterol recommendations for the United Kingdom
UNITED KINGDOM
Total cholesterol1 <4.0mmol/l in individuals with established cardiovascular disease,
diabetes, or at high risk of developing cardiovascular disease.
HDL cholesterol2 ≥ 1mmol/l in individuals with established cardiovascular disease,
and those at high risk of the disease.
Notes: The original recommendation for total cholesterol levels of less than 5mmol/l for individuals with cardiovascular disease, diabetes, or at high risk of developing cardiovascular disease, originally set in �998 by the Joint British Societies is retained for audit purposes.
Source: �. British Cardiac Society, British Hypertension Society, Diabetes UK, HEART UK, Primary Care Cardiovascular Society, The Stroke Association (�005). JBS�: Joint British Societies’ guidelines on prevention of cardiovascular diseases in clinical practices. Heart. 9� (suppl V): v�-v5�.
�. Sacks FM, for the expert group on HDL-cholesterol (�00�). The role of high density lipoprotein (HDL) cholesterol on the prevention of coronary heart disease; Expert group recommendations. American Journal of Cardiology. 90: ��9-�4�.
British HeartFoundation
Statistics Databasewww.heartstats.org
�80
Table �0.� Total cholesterol levels by sex and age, �994, �998 and �00�, England and �995, �998 and �00�, Scotland
>=5.0mmol/l total cholesterol All ages 16-24 25-34 35-44 45-54 55-64 65-74 75+ % % % % % % % %
Notes: From �00� onwards Health Survey for England used weighted data to adjust for non-response. English data presented here are unweighted for comparison with earlier estimates. Scottish data are all weighted for non-response.
The Scottish Health Survey for �995 only covered �6-64 year olds. The survey for �998 only covered �6-74 year olds. For comparability, all of the Scottish all age estimates (marked with asteriskes) are for �6-64 year olds only.
Source: Department of Health (�004) Health Survey for England �00�. London: The Stationery Office
The Scottish Executive (�005) The Scottish Health Survey �00�. Edinburgh: Scottish Executive
British HeartFoundation
Statistics Databasewww.heartstats.org
�8�
Figure �0.� Percentage of adults with blood cholesterol levels of 5.0mmol/l and above, �00�, England
0
10
20
30
40
50
60
70
80
90
100
16–24 25–34 35–44 45–54 55–64 65–74 75+
%
MenWomen
Table �0.� Low HDL cholesterol by sex and age, �00�, England and Scotland
≤1.0mmol/l total HDL cholesterol All ages 16-24 25-34 35-44 45-54 55-64 65-74 75+
Notes: Data are weighted for non-response and age-standardised. For method of age-standardisation see source.
Source: Department of Health (�006) Health Survey for England �004. The Health of Minortiy Ethnic Groups. London: The Stationery Office
British HeartFoundation
Statistics Databasewww.heartstats.org
�84
Table �0.8 Blood cholesterol levels by sex, adults aged �5 to 64, latest available data, MONICA Project populations
Total cholesterol (mmol/l) MEN WOMENMONICA population MONICA Year of 5.2 - <7.8 ≥7.8 Mean 5.2 - <7.8 ≥7.8 Mean population code survey % % mmol/l % % mmol/l
Notes: Age-standardised levels; consult WHO MONICA Project for details of measurement and age-standardisation.
Source: WHO MONICA Project database. http://www.ktl.fi/publications/monica
Figure �0.8 Percentage of adults aged �5 to 64 with blood cholesterol levels ≥7.8 mmol/l, latest available data, MONICA Project populations
0
2
4
6
8
10
12
14
16
Ch
ina-
Bei
jing
Russ
ia-N
ovo
sib
irsk
(co
ntr
ol)
Can
ada-
Hal
ifax
Co
un
ty
Russ
ia-M
osc
ow
(co
ntr
ol)
Pola
nd
-Tar
no
brz
eg V
oiv
od
ship
Un
ited
Sta
tes-
Stan
ford
Au
stra
lia-P
erth
Spai
n-C
atal
on
ia
Au
stra
lia-N
ewca
stle
Pola
nd
-War
saw
New
Zea
lan
d-A
uck
lan
d
Fran
ce-L
ille
Fran
ce-T
ou
lou
se
Ger
man
y-Ea
st G
erm
any
Fin
lan
d-T
urk
u/L
oim
aa
Swed
en-G
oth
enb
urg
Ital
y-Fr
iuli
Den
mar
k-G
lost
rup
Fran
ce-S
tras
bo
urg
Ital
y-A
rea
Bri
anza
Un
ited
Kin
gd
om
-Bel
fast
Un
ited
Kin
gd
om
-Gla
sgo
w
Ger
man
y-A
ug
sbu
rg (r
ura
l)
Bel
giu
m-G
hen
t
Fin
lan
d-N
ort
h K
arel
ia
Fin
lan
d-K
uo
pio
Pro
vin
ce
Lith
uan
ia-K
aun
as
Bel
giu
m-C
har
lero
i
Ger
man
y-B
rem
en
Icel
and
Ger
man
y-A
ug
sbu
rg (u
rban
)
Swit
zerl
and
-Vau
d/F
rib
ou
rg
Cze
ch R
epu
blic
Swed
en-N
ort
her
n S
wed
en
Yug
osl
avia
-Nov
i Sad
Swit
zerl
and
-Tic
ino
%
Men Women
British HeartFoundation
Statistics Databasewww.heartstats.org
�85
Table �0.9 Mean total cholesterol levels by sex, adults aged �5 and over, �005, the World
MEN WOMEN MEN WOMEN MEN WOMEN
Mean total cholesterol (mmol/l)
Afghanistan 4.6 4.6 Gabon 4.6 4.6 Oman 5.0 5.0Albania 5.2 5.1 Gambia 4.1 4.6 Pakistan 4.7 4.5Algeria 4.6 4.7 Georgia 5.0 5.0 Palau 5.4 5.4Andorra 5.4 5.4 Germany 5.7 5.7 Panama 5.2 5.2Angola 4.3 4.3 Ghana 4.3 4.3 Papua New Guinea 5.5 5.3Antigua and Barbuda 5.4 5.4 Greece 4.8 4.7 Paraguay 5.1 5.1Argentina 5.4 5.3 Grenada 5.3 5.3 Peru 5.1 5.1Armenia 5.1 5.1 Guatemala 4.6 4.9 Philippines 4.4 4.4Australia 5.5 5.5 Guinea 4.3 4.3 Poland 5.2 5.1Austria 5.4 5.5 Guinea-Bissau 4.2 4.2 Portugal 5.2 5.1Azerbaijan 5.0 5.0 Guyana 5.1 5.1 Qatar 5.3 5.3Bahamas 5.6 5.6 Haiti 4.9 4.9 Rep. of Korea 4.8 4.9Bahrain 5.1 5.1 Honduras 5.0 5.0 Rep. of Moldova 5.0 5.0Bangladesh 4.1 4.3 Hungary 5.4 5.1 Romania 5.1 5.0Barbados 5.4 5.4 Iceland 5.6 5.4 Russian Fed. 4.9 4.9Belarus 6.0 5.3 India 5.1 5.2 Rwanda 4.2 4.2Belgium 5.5 5.5 Indonesia 4.5 4.5 Saint Kitts and Nevis 5.4 5.4Belize 5.2 5.2 Iran (Islamic Rep. of) 4.6 4.8 Saint Lucia 5.2 5.2Benin 4.2 4.2 Iraq 4.7 4.7 Saint Vincent & Grenadines 5.2 5.2Bhutan 4.7 4.7 Ireland 5.5 5.4 Samoa 5.4 5.4Bolivia 5.0 5.0 Israel 5.6 6.0 San Marino 5.3 5.3Bosnia and Herzegovina 5.1 5.1 Italy 5.2 5.1 Sao Tome and Principe 4.3 4.3Botswana 4.6 4.6 Jamaica 5.1 5.1 Saudi Arabia 4.5 4.6Brazil 4.9 5.2 Japan 5.2 5.1 Senegal 4.3 4.3Brunei Darussalam 5.3 5.3 Jordan 5.3 5.5 Serbia and Montenegro 6.2 5.9Bulgaria 5.7 5.9 Kazakhstan 5.2 5.2 Seychelles 5.7 5.8Burkina Faso 4.2 4.2 Kenya 4.3 4.3 Sierra Leone 4.2 4.2Burundi 4.2 4.2 Kiribati 5.1 5.4 Singapore 5.3 5.2Cambodia 5.0 5.0 Kuwait 5.1 5.1 Slovakia 5.0 5.1Cameroon 3.1 3.4 Kyrgyzstan 5.1 5.0 Slovenia 5.2 5.2Canada 5.2 5.0 Lao People’s Dem. Rep. 5.0 5.0 Solomon Islands 4.4 4.6Cape Verde 4.5 4.5 Latvia 5.3 5.3 Somalia 4.2 4.2Central African Rep. 4.3 4.3 Lebanon 4.4 4.6 South Africa 4.3 4.3Chad 4.2 4.2 Lesotho 4.3 4.3 Spain 5.1 5.1Chile 4.8 4.9 Liberia 4.4 4.4 Sri Lanka 5.5 5.4China 5.5 5.4 Libyan Arab Jamahiriya 5.4 6.0 Sudan 4.3 4.3Colombia 6.3 5.2 Lithuania 5.3 5.4 Suriname 5.1 5.1Comoros 4.3 4.3 Luxembourg 6.0 5.9 Swaziland 4.5 4.5Congo 4.3 4.3 Madagascar 4.3 4.3 Sweden 5.2 5.2Cook Islands 5.6 5.4 Malawi 4.2 4.2 Switzerland 5.1 5.2Costa Rica 5.3 5.4 Malaysia 5.1 5.1 Syrian Arab Rep. 4.9 4.9Cote d’Ivoire 4.4 4.4 Maldives 4.9 4.9 Tajikstan 4.9 4.9Croatia 5.5 5.3 Mali 4.2 4.2 Thailand 5.1 5.3Cuba 5.1 5.1 Malta 5.7 5.9 Togo 4.3 4.3Cyprus 6.0 5.8 Marshall Islands 5.1 5.1 Tonga 5.3 5.1Czech Rep. 5.4 5.5 Mauritania 4.0 4.2 Trindad and Tobago 6.0 5.9Dem. People’s Rep. of Korea 5.0 5.0 Mauritius 5.1 5.1 Tunisia 4.1 4.4Dem. Rep. of the Congo 4.2 4.2 Mexico 4.8 4.8 Turkey 4.5 4.6Dem. Rep. of Timor-Leste 4.7 4.7 Micronesia, Fed. States of 4.6 4.6 Turkmenistan 5.2 5.2Denmark 5.4 5.2 Monaco 5.3 5.3 Tuvalu 5.4 5.4Djibouti 4.3 4.3 Mongolia 5.0 5.0 Uganda 4.3 4.3Dominica 5.2 5.2 Morocco 4.7 4.7 Ukraine 5.1 5.2Dominican Rep. 4.8 5.0 Mozambique 4.2 4.2 United Arab Emirates 5.8 4.8Ecuador 5.1 5.1 Myanmar 4.9 4.9 United Kingdom 5.1 5.1Egypt 4.7 4.9 Namibia 4.5 4.5 United Rep. of Tanzania 4.7 5.1El Salvador 5.1 5.1 Nauru 5.4 5.5 United States of America 5.1 5.1Equatorial Guinea 4.5 4.5 Nepal 4.7 4.7 Uruguay 6.1 6.0Eritrea 4.2 4.2 Netherlands 4.8 4.9 Uzbekistan 5.0 5.0Estonia 5.0 5.2 New Zealand 5.6 5.4 Vanuatu 5.9 5.1Ethiopia 4.5 4.2 Nicaragua 5.0 5.0 Venezuela 4.6 4.9Fiji 5.3 5.0 Niger 4.2 4.2 Vietnam 5.4 5.2Finland 5.3 5.2 Nigeria 3.5 3.6 Yemen 4.6 4.6France 5.4 5.3 Niue 5.5 5.5 Zambia 4.2 4.2FYR Macedonia 5.1 5.1 Norway 5.6 6.0 Zimbabwe 4.4 4.4
Notes: Estimates are based on national or sub-national surveys, and are adjusted for definitions, and for non-standard age groups. Non-representative data is adjusted to national populations, and trend data is used to adjust to the standard reporting year. The estimates are then age-standardised to the WHO standard population. For details on adjustments, see source.
Overweight and obesity increase the risk of CHD. As well as being an independent risk factor,
obesity is also a major risk factor for high blood pressure, raised blood cholesterol, diabetes and
impaired glucose tolerance1.
The adverse effects of excess weight are more pronounced when fat is concentrated in the abdomen.
This is known as central or abdominal obesity and is assessed using the waist to hip ratio2.
The World Health Organization’s World Health Report 2002 estimated that over 7% of all
disease burden in developed countries was caused by raised body mass index (BMI), and that
around a third of CHD and ischaemic stroke and almost 60% of hypertensive disease in developed
countries was due to overweight3.
More recently the INTERHEART case-control study estimated that 63% of heart attacks in
Western Europe and 28% of heart attacks in Central and Eastern Europe were due to abdominal
obesity (a high waist to hip ratio), and those with abdominal obesity were at over twice the risk
of a heart attack compared to those without4. This study also found that abdominal obesity was
a much more significant risk factor for heart attack than BMI.
Public health targetsIn 2004 in England an obesity target for children was introduced to halt the year-on-year rise in
obesity in children under 11 by 2010. A more general statement has been made that increasing
rates of obesity in the population should be addressed (Table 11.1). There are currently no targets
for overweight and obesity in Scotland, Wales or Northern Ireland.
Overall prevalenceIn England around 44% of men and 35% of women were overweight (a BMI of 25-30 kg/m2),
and an additional 23% of men and 24% of women were obese (a BMI of more than 30 kg/m2)
(Table 11.2). Central obesity was also common among adults in England. Data from 2003 show
that around 33% of men and 30% of women had central obesity (Table 11.3).
Sex and age differencesOverweight and obesity increased with age, peaking in those aged 55 to 64. About 31% of men
and 38% of women aged 16 to 24 were overweight or obese compared to 78% of men and
70% of women aged 55 to 64 (Table 11.2 and Figure 11.2). The prevalence of central obesity
also increased with age, especially in men. About 4% of men and 11% of women aged 16 to
24 had central obesity but 57% of men and 45% of women aged 65 to 74 had central obesity
(Table 11.3).
Overweight and obesity in childrenThe classification of overweight and obesity in children and adolescents is more problematic than
British HeartFoundation
Statistics Databasewww.heartstats.org
�89
in adults. Constant changes in body composition during growth mean that the relationship between
BMI and adiposity during childhood is age-dependent, and further complicated by race and gender.
There is no clear agreement on the best way to define overweight and obesity in children. The
International Obesity Taskforce (IOTF) has developed a new international classification based on
age and sex-specific BMI cut-off points. UK data is sometimes reported using the National BMI
percentile classification where children are classified as overweight or obese using the 85th and
95th percentiles as cut points. These two methods of classification result in different estimates
of childhood overweight and obesity5.
The IOTF classification has been used in the 2004 Health Survey for England which found a
third of boys (33%) and more than a third of girls (35%) in England aged 2 to 15 years were
either overweight or obese (Table 11.4)6.
Temporal trendsOverweight and obesity are increasing rapidly. In England, the percentage of adults aged 16 to
64 who are obese has increased by over 50% in the last decade (Table 11.5 and Figure 11.5).
This increase in obesity was particularly marked in men among whom rates have tripled since
the mid-1980s, with men now as likely to be obese as women.
The high levels of overweight and obesity among children are likely to exacerbate the trend
towards overweight and obesity in the adult population, since compared to thin children, obese
children have a high risk of becoming overweight adults7. Between 1995 and 2004 the prevalence
of obesity almost doubled among English boys (from 11% to 19%) and increased by half in girls
(from 12% to 18%) (Table 11.6 and Figure 11.6).
Trend data from the 2003 Health Survey for England, and mid-population estimates for 2010
were used to predict the numbers and proportions of overweight and obese adults and children
in 2010.
For men, the prediction was an increase in the proportion of those obese from 22% in 2003 to
33% in 2010. For women the predicted increase was from 23% in 2003 to 28% in 2010. These
increases were largely attributable to the change in men and women aged 35 to 54 years (Table
11.7 and Figure 11.7).
For boys aged 2 to 15 years, the predicted increase in obesity was from 17% in 2003 to 19%
in 2010, and for girls aged 2 to 15 years, the predicted increase was from 16% in 2003 to 22%
in 2010 (Table 11.8).
Regional differencesIn England in 2003, about two thirds of men were overweight or obese with some variation by
Government Region. The highest prevalence was found in the East Midlands (69%) and the lowest
in London (58%). For women, the prevalence of overweight and obesity was lower and there
was slightly more regional variation. The highest prevalence was found in the West Midlands
(61%) and the lowest in London (48%) (Table 11.9).
Socio-economic differencesObesity is more common in adults employed in manual occupations, particularly in women. For
example, in 2003, 33% of women working in semi routine and routine occupations had a BMI
of more than 30 kg/m2 compared to 21% of those employed in a managerial and professional
role. (Table 11.10).
British HeartFoundation
Statistics Databasewww.heartstats.org
�90
In both men and women, the prevalence of central obesity was highest in semi-routine and routine
groups and lowest in managerial and professional groups. However, as in general obesity, the
social class patterning of central obesity was most evident in women where the prevalence of
central obesity gradually increased from 24% in managerial and professional occupations to
36% in semi-routine and routine occupations (Table 11.11).
Ethnic differences Levels of general and abdominal obesity vary with ethnicity in both men and women in England. In
2004, levels of obesity were much lower in Black African, Indian, Pakistani, and, most markedly,
Bangladeshi and Chinese men, who were around four times less likely to be obese compared to
men in the general population (Table 11.12 and Figure 11.12). Black Caribbean and Irish men
had similar levels of obesity to the general population. Despite low levels of general obesity,
Pakistani, Indian and Bangladeshi men had similar levels of raised waist to hip ratio compared
to the general population. Black Caribbean, Black African and Chinese men were less likely to
have a raised waist to hip ratio (Table 11.13).
Among women, obesity prevalence was high for Black Caribbean, Black African and Pakistani
women and low for Chinese women (Table 11.12 and Figure 11.12). Again the pattern was
different for levels of central obesity. Black Caribbean, Pakistani, and Irish women all had levels
of central obesity above that of the general female population, while Bangladeshi women were
much more likely to have a raised waist to hip ratio as women in the general population (Table
11.13).
International differencesData from the WHO SuRF Report 2 show that the prevalence of overweight and obesity in the
UK is among the highest in Europe. Worldwide prevalence of overweight and obesity in the UK
is in the highest quintile for men and the second highest for women (Table 11.14 and Figures
11.14a and 11.14b).
In 2006, the International Obesity TaskForce collated data on overweight and obesity in children
worldwide. Caution should be used in interpreting these data as the studies used different
age groups and different definitions of overweight and obesity. For boys, the countries with
overweight (including obesity) levels of 30% or more were Canada (33%), Mexico (32.3%),
Kuwait (30%), Malta (32.7%), Spain (31%) and New Zealand (30%). For girls the countries
were Mexico (31.1%), Bahrain (38.5%), Kuwait (31.8%), Malta (38.5%), Portugal (34.3%)
and New Zealand (30%). Ethiopia, Mali, Senegal and Nepal had very low levels of under 1%
for both boys and girls (Table 11.15).
�. World Health Organization (�000) Obesity – preventing and managing the global epidemic. Report of a WHO Consultation on Obesity. World Health Organization: Geneva.
�. Central obesity is commonly defined as a waist-hip ratio of 0.95 and over in men and 0.85 and over in women.
�. World Health Organization (�00�) The World Health Report �00�. Reducing Risks, Promoting Healthy Life. World Health Organization: Geneva.
4. Yusaf S, Hawken S, Ounpuu S, Dans T, Avezum A, Lanas F, McQueen M, Budaj A, Pais P, Varigo J, Lisheng A, on behalf of the INTERHEART Study Investigators (�004) Effect of potentially modifiable risk factors associated with myocardial infarction in 5� countries (the INTERHEART Study): case-control study. The Lancet; �64: 9�7-95�.
5. For details of the International classification system see Department of Health (�00�) Health Survey for England �00�. The Stationery Office: London. Because of differences in definition and measurement, direct comparison of adult (Table ��.�) and childhood (Table ��.6) tables in this chapter is inappropriate.
6. This finding should be viewed with caution since it has been suggested that the International classification may exaggerate sex differences by under-estimating prevalence for boys. Overweight and obesity estimates derived using the alternative National BMI percentiles classification showed no marked sex differences.
7. Serdula M, Ivery D, Coates R, Freedman D, Williamson D and Byers T (�99�) Do obese children become obese adults? A review of the literature. Prev Med ��:�67-�77.
British HeartFoundation
Statistics Databasewww.heartstats.org
�9�
Table ��.� Obesity targets for the United Kingdom
England1
Children To halt the year-on-year rise in obesity among children under 11
by 2010 in the context of a broader strategy to tackle obesity
in the population as a whole
Wales No target set
Scotland No target set
Northern Ireland No target set
�. Department of Health (�004) National Standards, Local Action: Health and Social Care Standards and Planning Framework �005/06 and �007/08. DH: London. PSA Target �. www.dh.gov.uk/PublicationsAndStatistics/Publications/PublicationsPolicyAndGuidance/PublicationsPAmpGBrowsableDocument/fs/en?CONTENT_ID=4096�7�&chk=V8WLUg
British HeartFoundation
Statistics Databasewww.heartstats.org
�9�
Table ��.� Body mass index by sex and age, �004, England
ENGLAND 2004 All ages 16-24 25-34 35-44 45-54 55-64 65-74 75+
% % % % % % % %
MEN
BMI (kg/m2) 20 or under 5 20 4 2 1 1 2 3 Over 20-25 29 49 37 22 22 22 22 24 Over 25-30 44 23 41 50 48 48 48 54 Over 30-40 22 7 18 25 28 28 27 19 Over 40 1 1 0 0 2 2 1 0
All over 30 (obese) 23 8 18 25 30 30 28 19
Weighted base �9,�44 5,9�0 6,806 8,��0 6,584 5,65� �,9�� �,�60 Unweighted base �,444 �55 �88 478 �90 4�4 ��9 �90
WOMEN
BMI (kg/m2) 20 or under 6 17 9 6 4 2 3 4 Over 20-25 36 46 43 41 34 29 28 30 Over 25-30 35 25 31 30 36 37 40 46 Over 30-40 21 11 16 21 23 30 24 20 Over 40 3 2 2 3 3 3 4 0
All over 30 (obese) 24 12 18 24 26 32 28 20
Weighted base �9,80� 5,�45 6,5�� 7,984 6,49� 6,0�� 4,�7� �,�7� Unweighted base �,��5 �94 45� 649 5�7 5�8 �9� �8�
Notes: Adults aged �6 and above with a valid height and weight measurement.
Data are weighted for non-response.
Source: Department of Health (�005) Health Survey for England �004. See http://www.ic.nhs.uk/pubs/hlthsvyeng�004upd
Figure ��.� Prevalence of overweight and obesity by sex and age, �004, England
0
10
20
30
40
50
60
70
80
90
MEN WOMEN
Ove
rwei
gh
t (i
ncl
ud
ing
ob
esit
y (%
)
16–24
25–34
35–44
45–54
55–64
65–74
75+
British HeartFoundation
Statistics Databasewww.heartstats.org
�9�
Table ��.� Prevalence of a raised waist to hip ratio by sex and age, �00�, England
Notes: Raised waist to hip ratio for men is defined as 0.95 and over and for women is 0.85 and over.
Source: Department of Health (�004) Health Survey for England �00�.
See www.dh.gov.uk/PublicationsAndStatistics/PublishedSurvey/HealthSurveyForEngland/fs/en
Table ��.4 Prevalence of overweight and obesity in children by sex and age, �004, England
AGE (YEARS)
2-15 2-10 11-15 % % %
BOYSOverweight 14 15 13Obese 19 16 24
Total overweight and obese 33 31 37
Base 8,8�� 5,�68 �,466
GIRLSOverweight 17 15 19Obese 19 13 27
Total overweight and obese 35 28 46
Base 8,��8 4,90� �,��8
Notes: Children were defined as overweight or obese using the International classification age and sex-specific BMI percentile cut- points. See source for details.
Source: Department of Health (�005) Health Survey for England �004. The Stationery Office: London.
British HeartFoundation
Statistics Databasewww.heartstats.org
�94
Table ��.5 Prevalence of overweight and obesity by sex, adults aged �6 to 64, �986/87 to �004, England
Body mass index (kg/m2) 1986/87 1991/92 1993 1994 1995 1996 1997 1998 1999 2000 2001 2002 2003 2004
Notes: Children were defined as overweight or obese using the 85th and 95th percentiles of the UK reference curves (known as the National BMI percentile classification).
Alternative methods of classification of childhood overweight and obesity are discussed in Health Survey for England �00�, Chapter 9, Introduction.
Source: Department of Health (�005) Health Survey for England �004, and previous surveys. See http://www.ic.nhs.uk/pubs/hsechildobesityupdate/exceltables/file
British HeartFoundation
Statistics Databasewww.heartstats.org
�96
Figure ��.6 Prevalence of obese children aged � to �5, �995 to �004, England
0
2
4
6
8
10
12
14
16
18
20
1995 1996 1997 1998 1999 2000 2001 2002 2003 2004
Ob
esit
y (%
)
BoysGirls
British HeartFoundation
Statistics Databasewww.heartstats.org
�97
Table ��.7 Prevalence of overweight and obesity by sex and age, adults aged �6 and over, �00� and �0�0 (predicted), England
Weighted base Men �00� �,�54 �,�89 �,607 �69 6,5�9 Women �00� �,996 �,�6� �,675 5�6 6,570
Unweighted base Men �00� �,648 �,�79 �,7�� 406 5,966 Women �00� �,876 �,594 �,004 6�6 7,090
Notes: �00� prevalence estimates presented are based on data weighted for non-response. The weighted bases for these estimates are also presented.
Population bases are presented in thousands. For �00�, data from the �00� mid population estimates have been used. For �0�0, forecasted midyear population estimates for �0�0 have been applied.
For �0�0 data, the total number of people either obese or overweight may differ from the cumulative total of the age groups presented. This is due to imprecision within the forecast modelling.
Source: Department of Health (�006) Joint Health Surveys Unit. Forecasting obesity to �0�0, Table �4. http://www.dh.gov.uk/PublicationsAndStatistics/Publications/PublicationsStatistics/PublicationsStatisticsArticle/fs/en?CONTENT_ID=4��86�0&chk=XVZ/60
Figure ��.7 Prevalence of obesity by sex and age, adults aged �6 and over, �00� and �0�0 (predicted), England
0
5
10
15
20
25
30
35
40
2003 2010 (predicted) 2003 2010 (predicted)
Ob
esit
y (%
)
16-34 years
35-54 years
55-74 years
75+ years
All ages
Men Women
British HeartFoundation
Statistics Databasewww.heartstats.org
�98
Table ��.8 Prevalence of overweight and obese children aged � to �5 by sex and age, �00� and �0�0 (predicted), England
Aged 2-15
BMI Status Age group Total aged 2-10 Total aged 2-15 2-5 6-10 11-15
Weighted base Boys �00� ��0 549 574 878 �,45� Girls �00� �4� 5�6 5�5 858 �,�9�Unweighted base Boys �00� ��� 5�� 55� 864 �,4�7 Girls �00� ��6 5�� 547 869 �,4�6
Notes: �00� prevalence estimates presented are based on data weighted for non-response. The weighted bases for these estimates are also presented.
Population bases are presented in thousands. For �00�, data from the �00� mid population estimates have been used. For �0�0, forecasted midyear population estimates for �0�0 have been applied.
For �0�0 data, the total number of people either obese or overweight may differ from the cumulative total of the age groups presented. This is due to imprecision within the forecast modelling.
Source: Department of Health (�006) Joint Health Surveys Unit. Forecasting obesity to �0�0, Table �5. http://www.dh.gov.uk/PublicationsAndStatistics/Publications/PublicationsStatistics/PublicationsStatisticsArticle/fs/en?CONTENT_ID=4��86�0&chk=XVZ/60
Figure ��.8 Prevalence of obesity by sex and age, children aged � to �5 years, �00� and �0�0 (predicted), England
0
5
10
15
20
25
30
35
2003 2010 (predicted) 2003 2010 (predicted)
Ob
esit
y (%
)
2-5 years
6-10 years
11-15 years
All ages
Boys Girls
British HeartFoundation
Statistics Databasewww.heartstats.org
�99
Table ��.9 Prevalence of overweight and obesity by Government Office Region, by sex and age, �00�, England
BMI status - Overweight including obesity
MEN WOMEN
Age group Age group
16-34 35-54 55-74 75+ All ages 16-34 35-54 55-74 75+ All agesGovernment Office Region % % % % % % % % % %
Notes: Population bases are presented in thousands and use data from the �00� mid population estimates
[ ] indicate that caution should be taken with these estimates due to small base sizes
Source: Department of Health (�006) Joint Health Surveys Unit. Forecasting obesity to �0�0, Tables 4 and 5. http://www.dh.gov.uk/PublicationsAndStatistics/Publications/PublicationsStatistics/PublicationsStatisticsArticle/fs/en?CONTENT_ID=4��86�0&chk=XVZ/60
British HeartFoundation
Statistics Databasewww.heartstats.org
�00
Table ��.�0 Prevalence of overweight and obesity by sex and socio-economic classification, �00�, England
NS-SEC of household reference person
Managerial Intermediate Small employers Lower supervisory Semi-routine & professional & own & technical & routine account workers
Age-standardised percentages: see source for method of age-standardisation
Source: Department of Health (�004) Health Survey for England �00�. See http://www.ic.nhs.uk/pubs/hlthsvyeng�004upd
Table ��.�� Prevalence of a raised waist to hip ratio by sex and socio-economic classification, �00�, England
NS-SEC of household reference person
Managerial Intermediate Small employers Lower supervisory Semi-routine & professional & own & technical & routine account workers
% % % % %
MEN 25 31 33 31 34
Mean waist-hip ratio 0.90 0.91 0.92 0.91 0.92
Base �,�75 �95 6�6 764 �,�8�
WOMEN 24 26 27 35 36
Mean waist-hip ratio 0.81 0.81 0.82 0.82 0.83
Base �,�57 544 594 687 �,6��
Notes: Adults aged �6 and over.
Raised waist to hip ratio for men is 0.95 and over and for women is 0.85 and over; age-standardised percentages; see source for method of age-standardisation.
Source: Department of Health (�004) Health Survey for England �00�. See www.dh.gov.uk/PublicationsAndStatistics/PublishedSurvey/HealthSurveyForEngland/fs/en
British HeartFoundation
Statistics Databasewww.heartstats.org
�0�
Table ��.�� Prevalence of obesity by sex and ethnic group, �004, England
General Black Black Indian Pakistani Bangladeshi Chinese Irish population Caribbean African
% % % % % % % %
MEN 23 25 17 14 15 6 6 25
Unweighted base �,444 ��7 �97 48� �46 ��0 �07 4�0
WOMEN 23 32 39 20 28 17 8 21
Unweighted base �,��5 459 ��� 546 �9� �5� �08 555
Notes: Adults aged �6 and over.
Obesity is defined as a BMI of over �0; age-standardised percentages; see source for method of age-standardisation.
Source: Department of Health (�005) Health Survey for England �004. See http://www.ic.nhs.uk/pubs/hlthsvyeng�004upd
Table ��.�� Prevalence of a raised waist to hip ratio by sex and ethnic group, �004, England
General Black Black Indian Pakistani Bangladeshi Chinese Irish population Caribbean African
% % % % % % % %
MEN 33 25 16 36 37 32 17 36
Unweighted base 4,69� �09 �56 ��0 �97 ��8 �8� ���
WOMEN 30 37 32 30 39 50 22 37
Unweighted base 5,995 ��4 �00 �45 ��4 �7� �85 405
Notes: Adults aged �6 and over.
A raised waist to hip ratio for men is 0.95 and over and for women is 0.85 and over; age-standardised percentages; see source for method of age-standardisation. General population figures taken from �00� Health Survey for England.
Source: Department of Health (�005) Health Survey for England �004. See http://www.ic.nhs.uk/pubs/hlthsvyeng�004upd
Figure ��.�� Prevalence of obesity by sex and ethnic group, �004, England
0
5
10
15
20
25
30
35
40
45
Generalpopulation
BlackCaribbean
Black African Indian Pakistani Bangladeshi Chinese Irish
% B
MI 3
0 o
r m
ore
MenWomen
British HeartFoundation
Statistics Databasewww.heartstats.org
�0�
Table ��.�4 Prevalence estimates of overweight and obesity for �00�, and projections for �005 and �0�0, by sex, adults aged �5 and over, the World
Prevalence of overweight Prevalence of overweight Prevalence of obesity Prevalence of obesity Male Female Male Female
Source: International Obesity TaskForce (�006). http://www.iotf.org/database/ChildhoodTablebyRegionFeb06.htm
British HeartFoundation
Statistics Databasewww.heartstats.org
�06
12. DiabetesDiabetes substantially increases the risk of CHD. Men with non-insulin dependent (Type 2) diabetes
have a two to fourfold greater annual risk of CHD, with an even higher (three to fivefold) risk
in women with Type 2 diabetes1.
Diabetes not only increases the risk of CHD but also magnifies the effect of other risk factors for
CHD such as raised cholesterol levels, raised blood pressure, smoking and obesity. There are
two main types of diabetes: Type 1 and Type 2 diabetes2.
The recent INTERHEART case-control study estimated that 15% of heart attacks in Western
Europe and 9% of heart attacks in Central and Eastern Europe are due to diagnosed diabetes,
and that people with diagnosed diabetes are at three times the risk of a heart attack compared
to those without3.
Overall prevalence of diabetesOver 4% of men and 3% of women in England have diagnosed diabetes (Table 12.1)4 .
Using the age and sex-specific prevalence rates from the Health Survey for England we estimate
that there are just over 1.9 million adults with diagnosed diabetes in the UK5.
However, not all diabetes is diagnosed. The Health Survey for England 2003 suggests that 3%
of men and 0.7% of women aged 35 and over have undiagnosed diabetes (Table 12.2).
From these prevalence rates we estimate that there are around 595,000 adults with undiagnosed
diabetes in the UK5. This means there are around 2.5 million adults in the UK with diabetes
today.
Age and sex differencesFor both men and women, the proportion of people with diabetes increases with age. The
Health Survey for England 2003 suggests that less than 0.5% of men aged 16 to 34 years have
diagnosed diabetes compared with 10% of those aged 75 and over (Table 12.1 and Figure 12.1).
This pattern is similar in women, although rates are slightly lower at most ages than for men.
Temporal trendsThe prevalence of diabetes is increasing. Since 1991, the prevalence of diagnosed diabetes has
more than doubled in men and increased by 80% in women (Table 12.3 and Figure 12.3).
Extrapolating from the Health Survey for England data (Table 12.3) it is suggested that the
prevalence of diagnosed diabetes in the UK will be about 7% for adult men and 5% for adult
women by the year 2010. This would equate to approximately three million people with diagnosed
diabetes.
British HeartFoundation
Statistics Databasewww.heartstats.org
�07
National and regional differencesThe prevalence of diagnosed diabetes varies by Government Office Region in England for both
men and women (Table 12.4). The age-standardised prevalence is highest for men (5.4%) and
women (4.4%) in London, and lowest for men in the South West (2.8%) and for women in the
North East (2.5%).
Socio-economic differencesDiabetes prevalence is also related to socio-economic position (Table 12.5). In the Health Survey
for England 2003, men and women in managerial and professional and intermediate households
had a lower prevalence of diagnosed diabetes than those from other households. In women, for
example, the prevalence was around twice as high in those living in manual compared to non-
manual households (Table 12.5). Men and women living in households with the highest incomes
had the lowest prevalence of diagnosed diabetes (Table 12.6).
Ethnic differencesThe prevalence of diabetes in 2004 was much higher among some ethnic minority communities
than in the general population. In Black Caribbean and Indian men, the prevalence of diagnosed
diabetes was more than twice that found in the general population. The prevalence for Black
Caribbean and Pakistani women was two and a half times that of the general population. However,
the prevalence for Black African and Irish women was substantially lower than for the general
population (Table 12.7 and Figure 12.7).
International differencesDiabetes is now one of the most common non-communicable diseases globally. The International
Diabetes Federation estimates that there are currently about 194 million people aged 20 to 79
with diabetes worldwide and that this will increase to 333 million by 2025 (Table 12.8).
Prevalence rates in the UK are average for developed countries (Table 12.8 and Figure 12.8).
In general developed countries currently have higher rates than developing countries (Figure
12.8).
�. Garcia MJ, McNamara PM, Gordon T, Kannell WB (�974). Morbidity and mortality in the Framingham population. Sixteen year follow-up. Diabetes; ��:�05-���.
�. Diabetes is characterised by high blood glucose levels. It arises when the pancreas fails to make enough insulin or when the body cannot effectively make use of the insulin produced or both. The chronic high blood glucose levels (hyperglycaemia) that result are associated with long-term damage, dysfunction and failure of various organs, especially the eyes, kidneys, nerves, heart and blood vessels. Type � diabetes results from an autoimmune destruction of the cells in the pancreas which produce insulin. People with Type � diabetes must take daily injections of insulin for survival. Type � diabetes, which accounts for about 90% of all diabetes, is characterised by an inability on the part of the body to respond to insulin (insulin resistance) and/or abnormal insulin secretion. People with Type � diabetes are not usually treated with insulin. There are a number of other less common types of diabetes including gestational diabetes. This occasionally occurs during pregnancy in women not previously diagnosed with diabetes and is a marker of greater risk of developing Type � diabetes in later life.
�. Yusaf S, Hawken S, Ounpuu S, Dans T, Avezum A, Lanas F, McQueen M, Budaj A, Pais P, Varigo J, Lisheng A, on behalf of the INTERHEART Study Investigators (�004) Effect of potentially modifiable risk factors associated with myocardial infarction in 5� countries (the INTERHEART Study): case-control study. The Lancet; �64: 9�7-95�.
4. Determining the prevalence of diabetes in the population is difficult. The best source of data on the prevalence of diabetes is the Health Survey for England and this relies on self reports of doctor diagnosed diabetes (Type � and Type � combined). These national survey data are likely to underestimate the true prevalence of diabetes, as those people who have the disease but have not yet been diagnosed will be omitted from the figures. For further data on overall prevalence, together with data on mortality from diabetes, morbidity from diabetes, prevalence of risk factors for CVD in people with diabetes, and the treatment and prevention of CVD in people with diabetes, see the British Heart Foundation’s Diabetes supplement. Rayner M, Petersen S, Buckley C and Press V (�00�) Coronary heart disease statistics: diabetes supplement, BHF: London. See www.heartstats.org
5. These estimates are derived from applying age-specific rates to the UK population estimates for �005, and supersede our estimates in previous publications (e.g. Petersen S, Peto V and Rayner M (�004) Coronary heart disease statistics. British Heart Foundation: London).
British HeartFoundation
Statistics Databasewww.heartstats.org
�08
Table ��.� Prevalence of diagnosed diabetes by sex and age, �00�, England
Notes: Self-reported diagnosis of either Type I or Type � diabetes.
Weighted data provide the best estimate for �00�. However, for looking at trends, unweighted data for �00� are more consistent with previous years which are also unweighted.
Source: Department of Health (�004) Health Survey for England �00�. The Stationery Office: London.
Figure ��.� Prevalence of diagnosed diabetes in adults, �99� to �00�, England
Notes: Numbers may not add exactly due to rounding. Type � diabetes defined as doctor-diagnosed diabetes with diagnosis age <�5 and currently on insulin.
General Population data taken from Health Survey for England �00�.
Source: Department of Health (�005) Health Survey for England �004. See http://www.ic.nhs.uk/pubs/hlthsvyeng�004upd
Figure ��.7 Prevalence of diagnosed diabetes by ethnic group, �004, England
0
2
4
6
8
10
12
Generalpopulation
(2003)
Black Carribean Black African Indian Pakistani Bangladeshi Chinese Irish
Ethnic group
Pre
vale
nce
of d
iab
etes
(%) Men
Women
British HeartFoundation
Statistics Databasewww.heartstats.org
���
Table ��.8 Estimated prevalence of diabetes and number of people with diabetes, �00� and �0�5, selected countries, the World
2003 2025 Population Numbers with diabetes Crude Population Numbers with diabetes Crude Aged 20-79 Men Women Total prevalence Aged 20-79 Men Women Total prevalence (000s) (000s) (000s) (000s) % (000s) (000s) (000s) (000s) %
Notes: * Note that the Health Survey for England �00� verifies this estimate for diagnosed diabetes (types � and �), but estimates that a further �% of men and 0.7% of women aged over �5 may suffer from undiagnosed diabetes.
Source: International Diabetes Federation (�00�) The Diabetes Atlas (Second edition) International Diabetes Federation:Brussels.
2003 2025 Population Numbers with diabetes Crude Population Numbers with diabetes Crude Aged 20-79 Men Women Total prevalence Aged 20-79 Men Women Total prevalence (000s) (000s) (000s) (000s) % (000s) (000s) (000s) (000s) %
British HeartFoundation
Statistics Databasewww.heartstats.org
��5
9.0
and
ab
ove
6.8
to
8.9
4.9
to
6.7
2.6
to
4.8
2.5
and
less
Cru
de
pre
vale
nce
(%)
No
dat
a av
aila
ble
Figu
re �
�.8
Prev
alen
ce o
f dia
bete
s, �
00�,
the
Wor
ld
British HeartFoundation
Statistics Databasewww.heartstats.org
��6
13. Economic Costs
Both CVD and CHD have major economic consequences for the UK as well as human costs.
Health care costsCVD cost the health care system in the UK around £14,750 million in 20031,2 (Table 13.1). This
represents a cost per capita of just under £250. The cost of hospital care for people who have
CVD accounts for about 76% of these costs, that of drugs and of dispensing them for about
18% (Figure 13.1a).
CHD cost the health care system in the UK around £3,500 million in 20031,2 (Table 13.1). This
represents a cost per capita of just under £60. The cost of hospital care for people who have
CHD accounts for about 79% of these costs, that of drugs and of dispensing them for about
16% (Figure 13.1b).
Non-health care costsLooking only at the cost of CVD to the health care system grossly underestimates the total cost
of CVD in the UK. Production losses from death and illness in those of working age and from
the informal care of people with the disease contribute greatly to the overall financial burden.
In 2003, production losses due to mortality and morbidity associated with CVD cost the UK over
£6,200 million, with around 60% of this cost (£3,677 million) due to death and 40% (£2,556
million) due to illness in those of working age. The cost of informal care for people with CVD
in the UK was over £4,800 million3 in 2003 (Table 13.2).
In 2003, production losses due to mortality and morbidity associated with CHD cost the UK
over £3,100 million, with around 70% of this cost (£2,173 million) due to death and 30% (£961
million) due to illness in those of working age. The cost of informal care for people with CHD
in the UK was around £1,250 million3 in 2003 (Table 13.2).
Total costsOverall CVD is estimated to cost the UK economy just under £26 billion a year. This represents
an overall cost per capita of £434. Of the total cost of CVD to the UK, around 57% is due to
direct health care costs, 24% to productivity losses, and 19% to the informal care of people
with CVD (Table 13.2).
Overall CHD is estimated to cost the UK economy over £7.9 billion a year. This represents an
overall cost per capita of £133. Of the total cost of CHD to the UK, around 45% is due to direct
health care costs, 40% to productivity losses, and 16% to the informal care of people with CHD
(Table 13.2).
British HeartFoundation
Statistics Databasewww.heartstats.org
��7
�. The figures for this section are from a cost of illness study by researchers at the Health Economics Research Centre, Department of Public Health, University of Oxford. Details of the methods and data used can be found at www.heartstats.org/eucosts.
�. This figure does not include the money spent on non-clinical activities concerned with the primary prevention of CVD and CHD, for example, public anti-smoking campaigns, nutrition education etc. However, the cost of drugs prescribed in primary care for both primary and secondary prevention are included.
�. The cost of informal care is equivalent to the opportunity costs of unpaid care. It is a measure of the amount of money that carers forgo to provide unpaid care for their spouse, friend or relative living with CVD. For more details on the methods used see www.heartstats.org/eucosts
International differencesTable 13.3 shows the relative costs of cardiovascular related diseases for countries in the EU for
2003. The UK has the highest spend on CVD as a proportion of total health care costs in the
EU (Figure 13.3).
British HeartFoundation
Statistics Databasewww.heartstats.org
��8
Table ��.� Health care costs of CVD and CHD, �00�, United Kingdom
CVD CHD
£ million % of total £ million % of total
Primary care 639 4.3 101 2.9Outpatient care 184 1.2 56 1.6Accident and emergency care 51 0.3 19 0.5Inpatient care 11,229 76.2 2,773 78.6Medications 2,629 17.8 578 16.4
Total health care costs 14,732 100.0 3,527 100.0
Cost per capita £249.29 £59.49
Source: Petersen S, Peto V, Rayner M, Leal J, Luengo-Fernandez R and Gray A (�005) European cardiovascular disease statistics. British Heart Foundation: London.
Figure ��.�a Health care costs of CVD, �00�, United Kingdom
Medications 18%
Primary Care 4% A&E and outpatient care 2%
Inpatient care 76%
Figure ��.�b Health care costs of CHD, �00�, United Kingdom
Medications 16%
Primary Care 3% A&E and outpatient care 2%
Inpatient care 79%
British HeartFoundation
Statistics Databasewww.heartstats.org
��9
Table ��.� Total costs of CVD and CHD, �00�, United Kingdom
CVD CHD
£ million % of total £ million % of total
Health care costs 14,732 57.1 3527 44.6Production losses due to mortality 3,677 14.3 2,173 27.5Production losses due to morbidity 2,556 9.9 961 12.2Informal care 4,835 18.7 1,249 15.8
Total 25,799 100.0 7,910 100.0
Source: Petersen S, Peto V, Rayner M, Leal J, Luengo-Fernandez R and Gray A (�005) European cardiovascular disease statistics. British Heart Foundation: London.
Table ��.� Healthcare costs of CVD-related diseases in the EU, by country, �00�
CVDs CHD Cerebrovascular diseases
Cost per % of total Cost per % of total Cost per % of total capita health capita health capita healthCountry (€) expenditure (€) expenditure (€) expenditure
Source: Leal J, Luengo-Fernandez R, Gray A, Petersen S, Rayner M (�006) Economic burden of cardiovascular diseases in the European Union. European Heart Journal; �7(��):�6�0-9


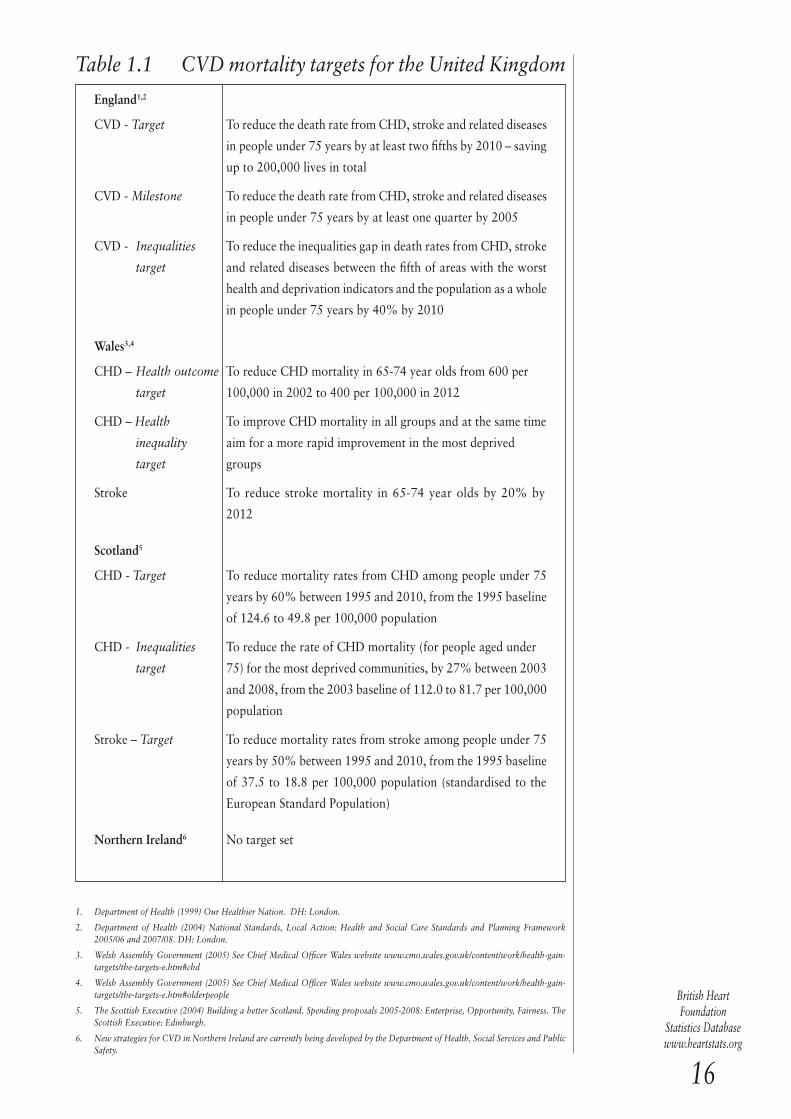

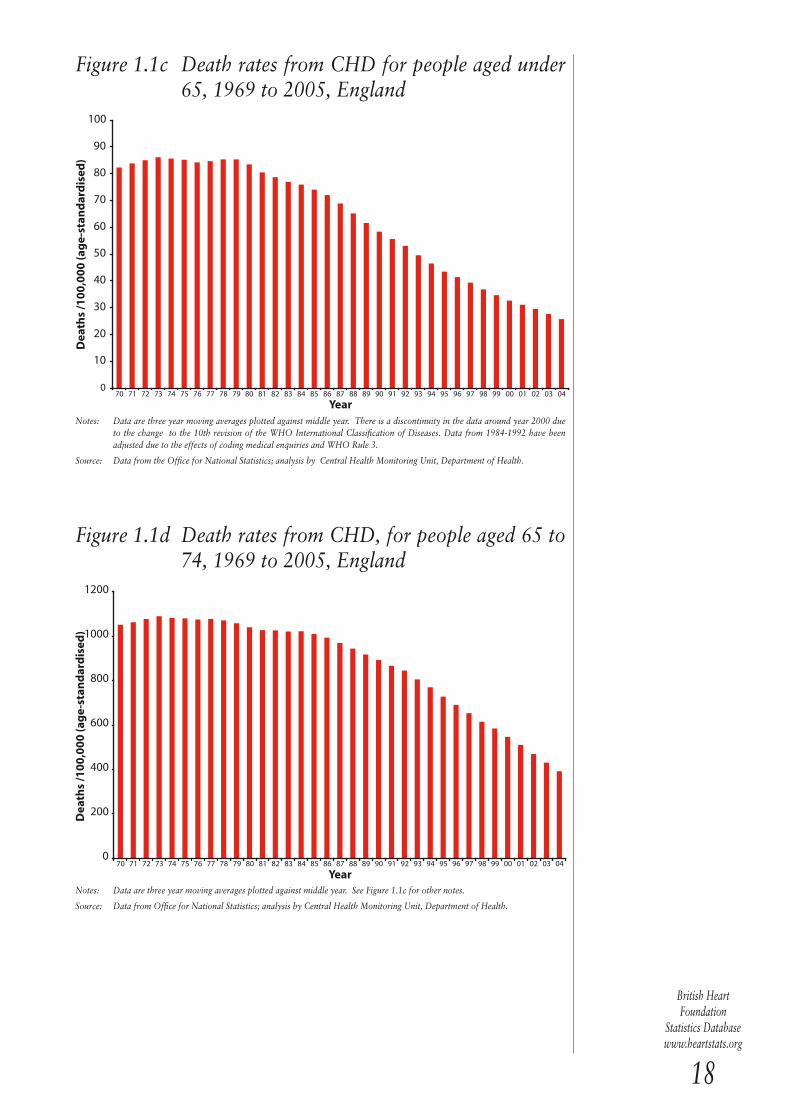


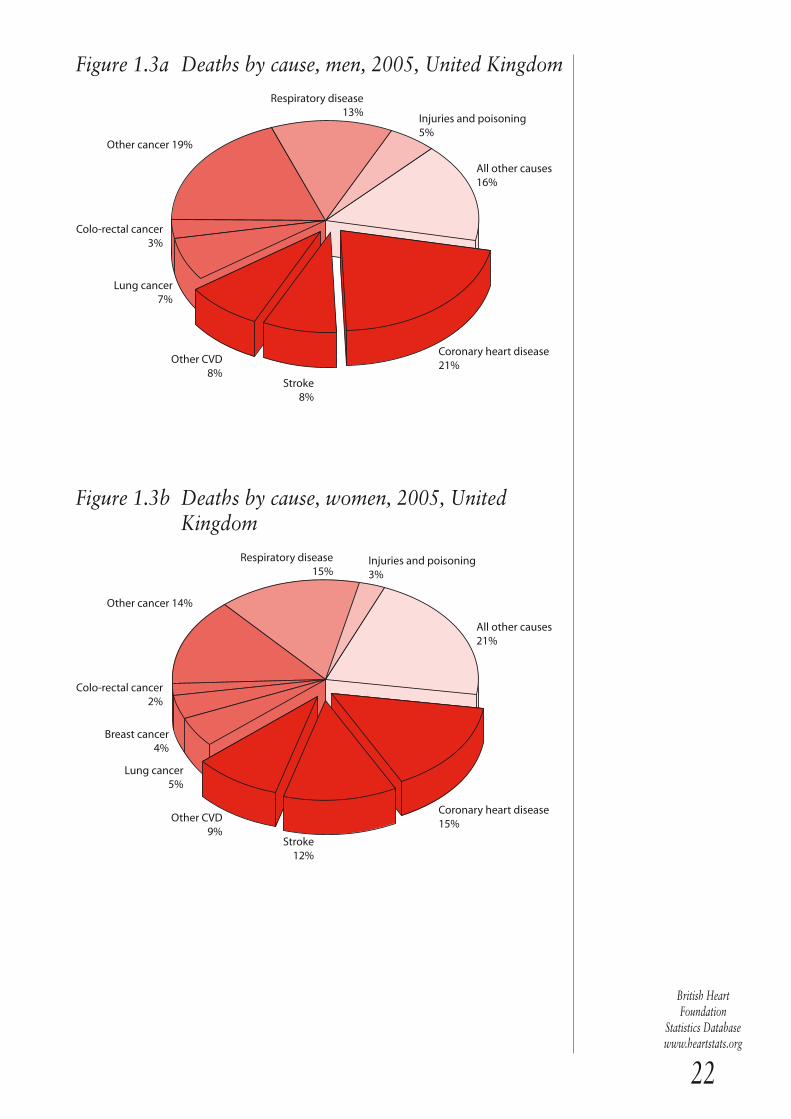

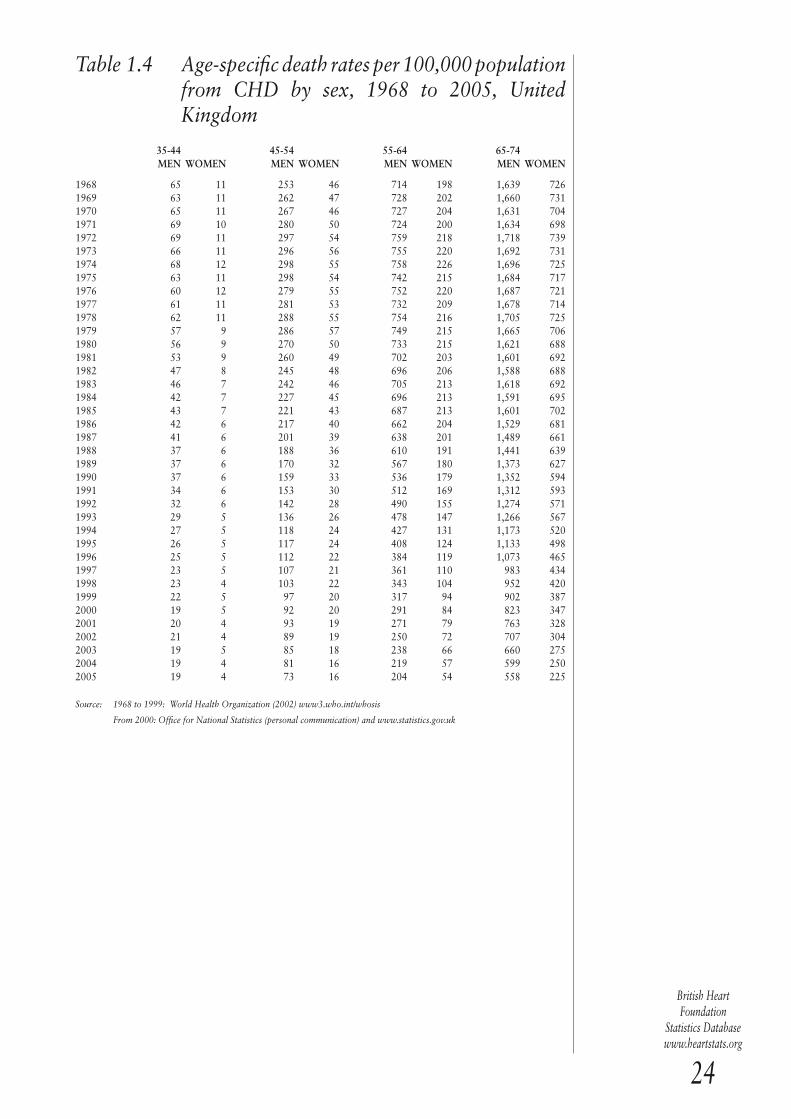


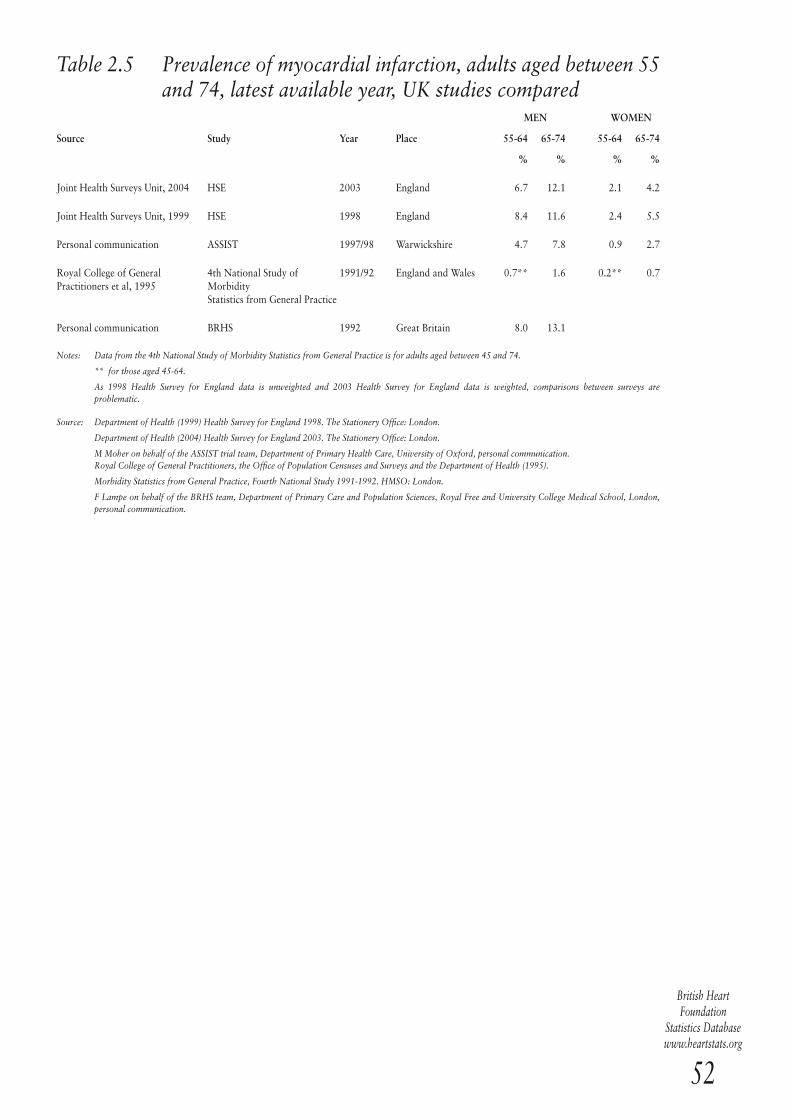


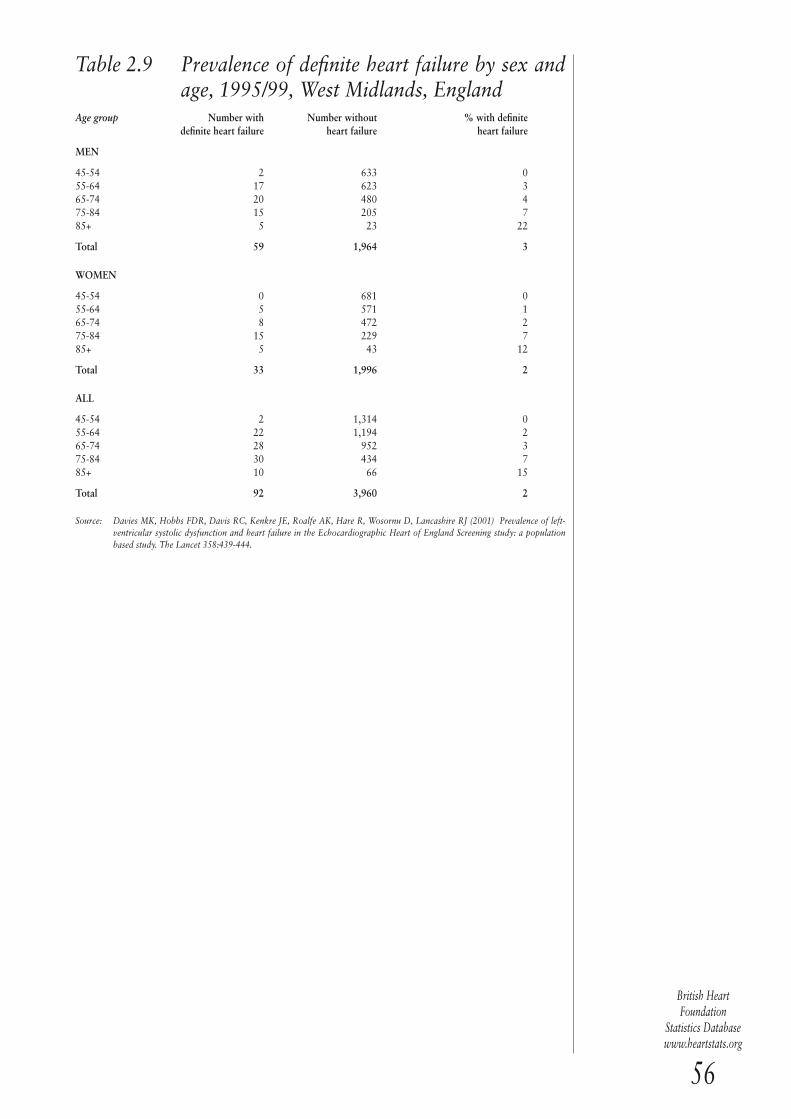


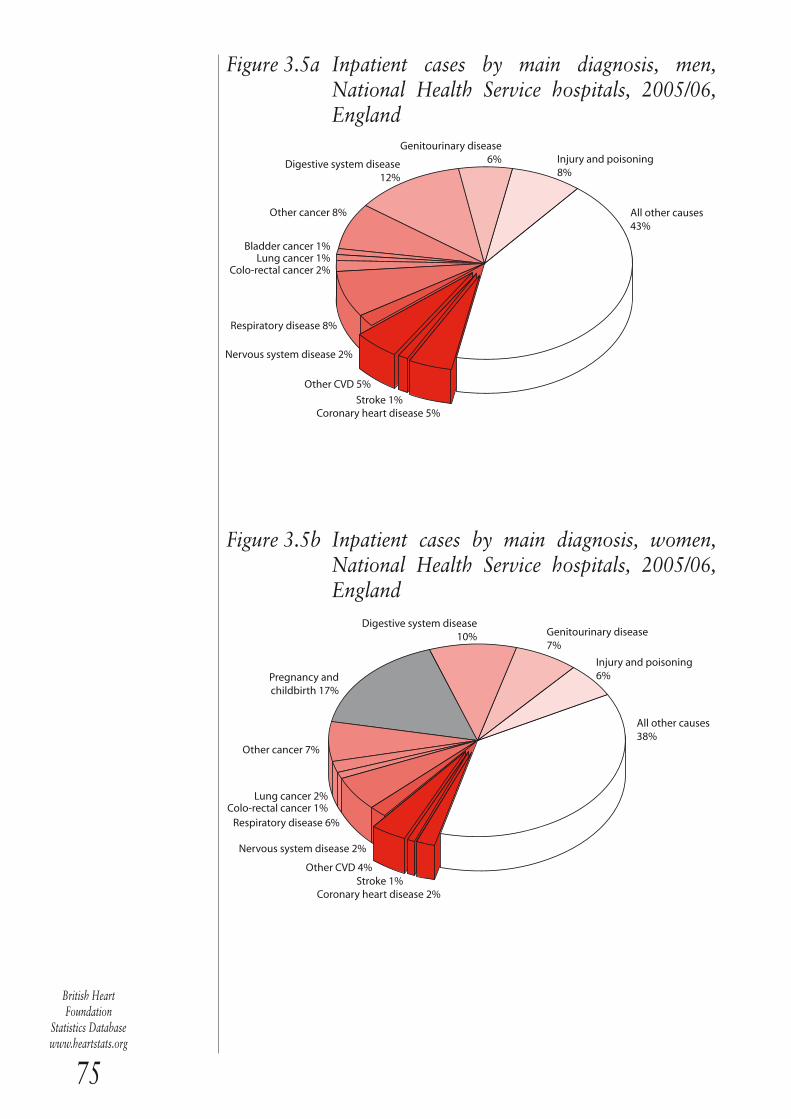

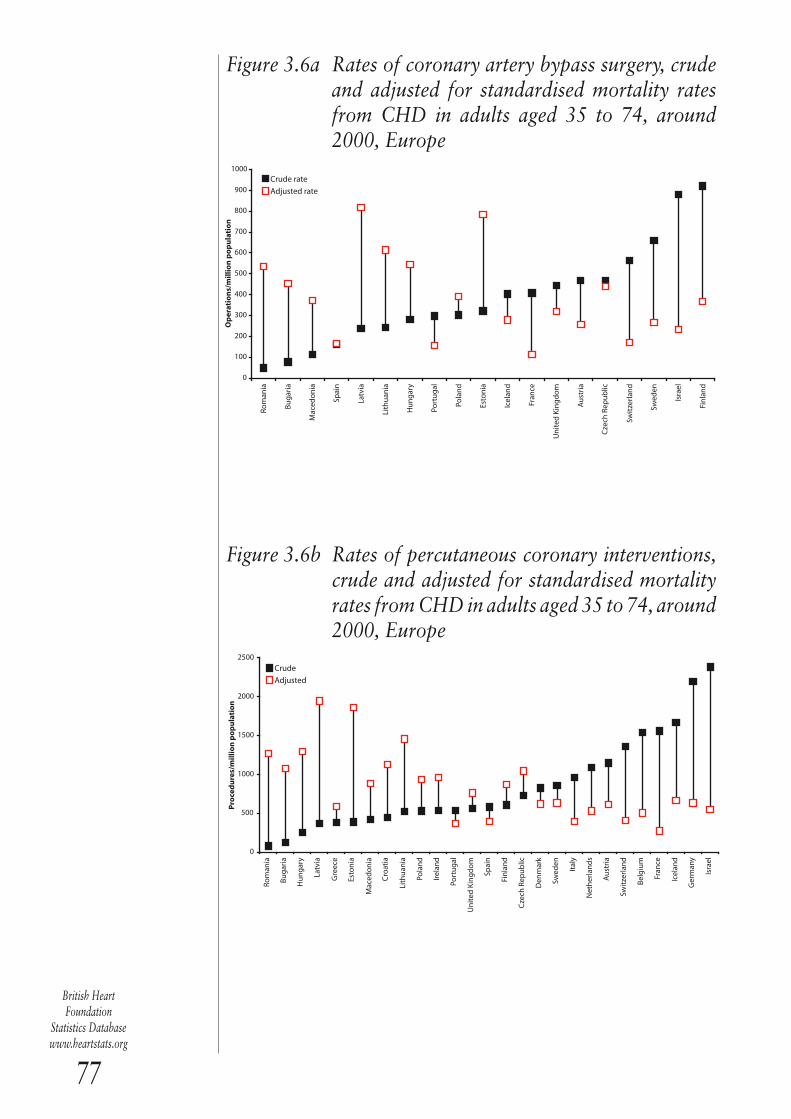


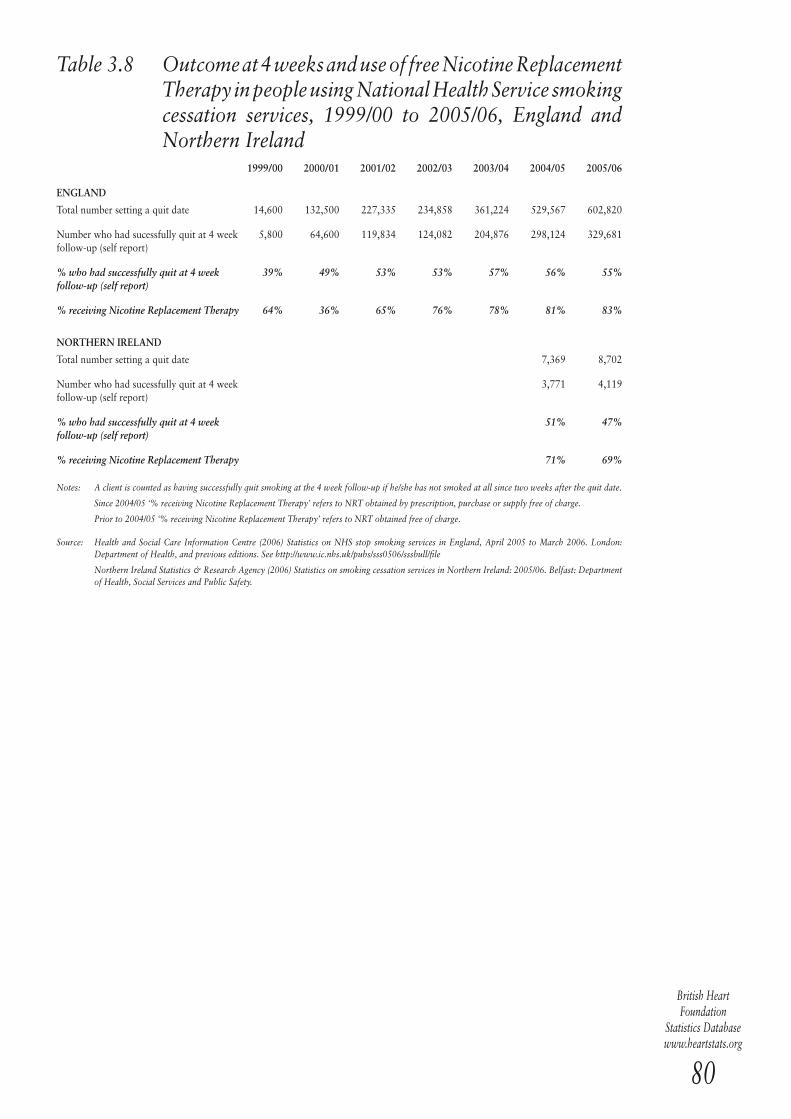


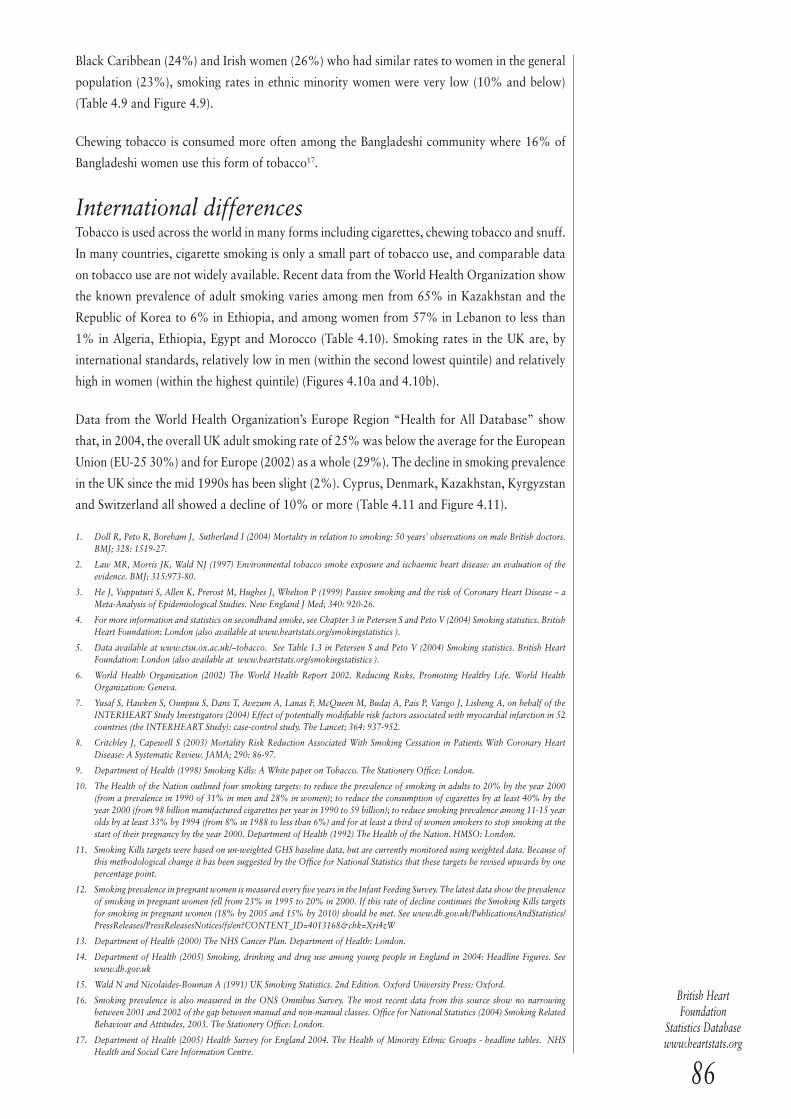
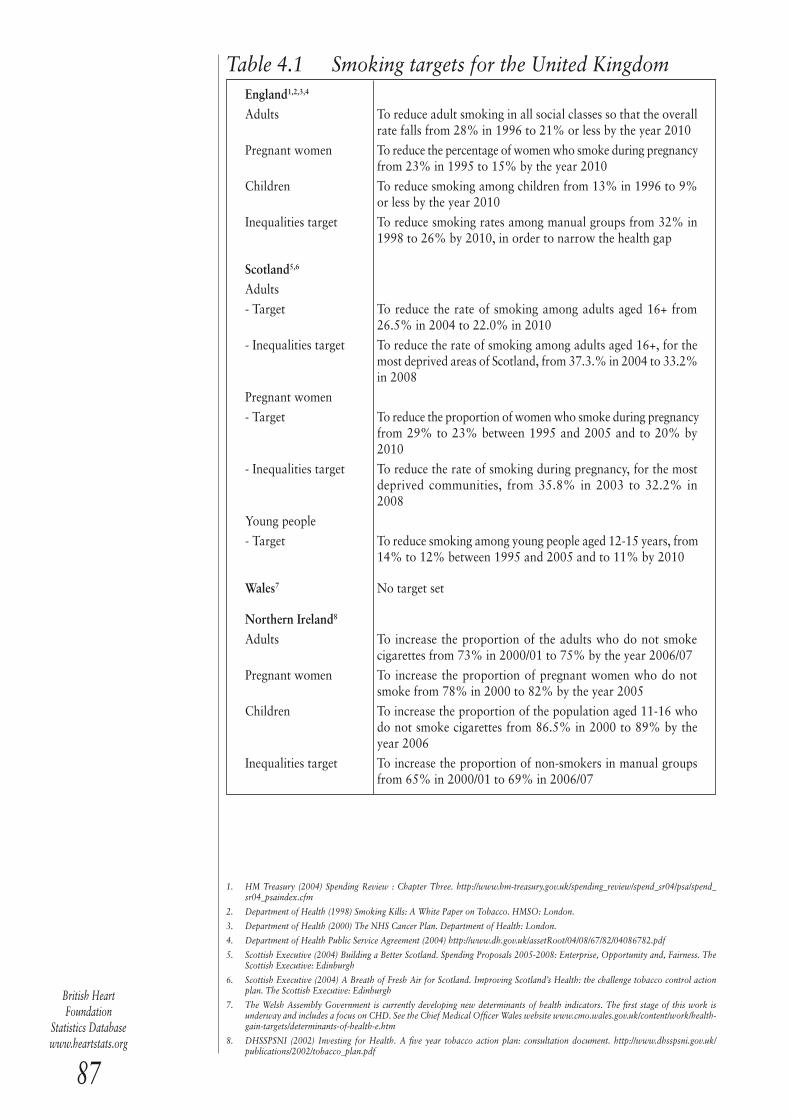


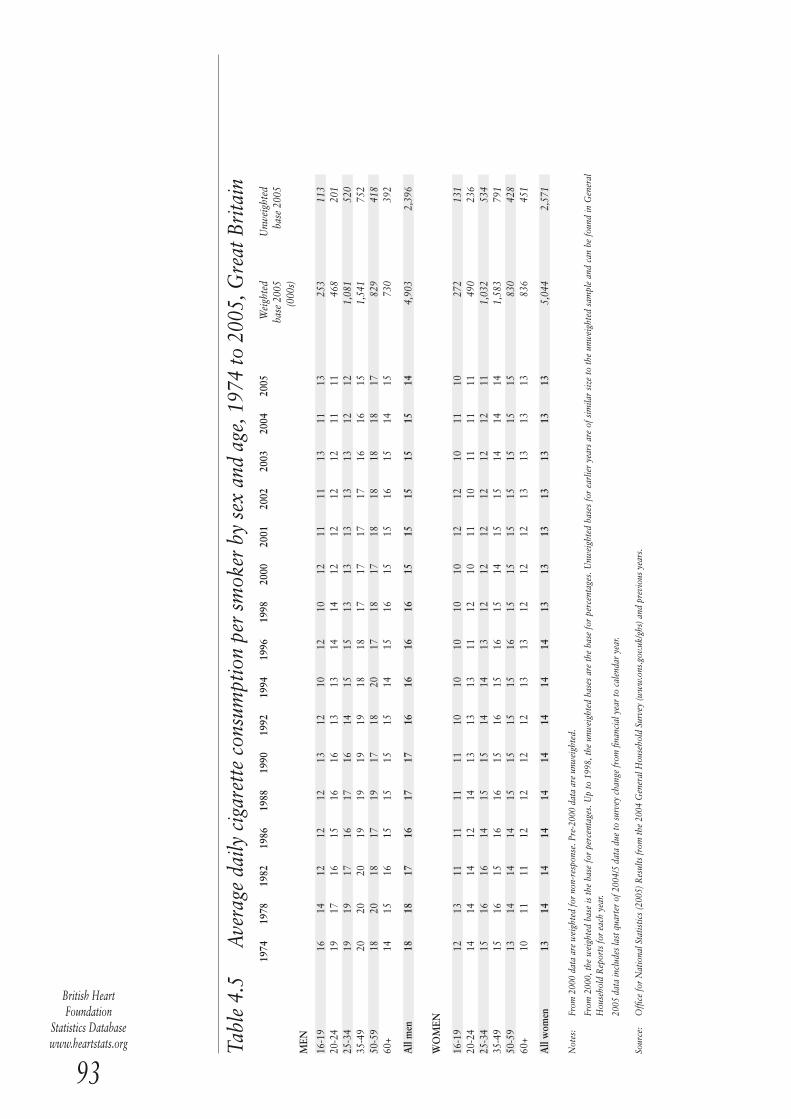


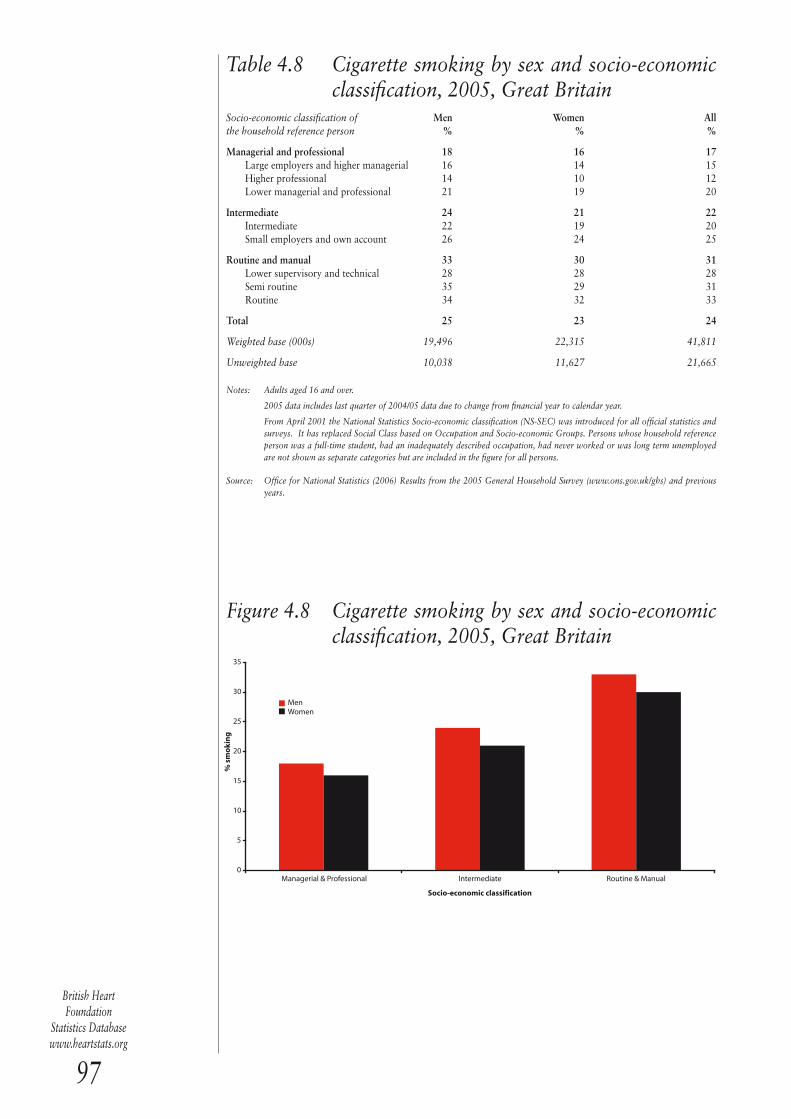


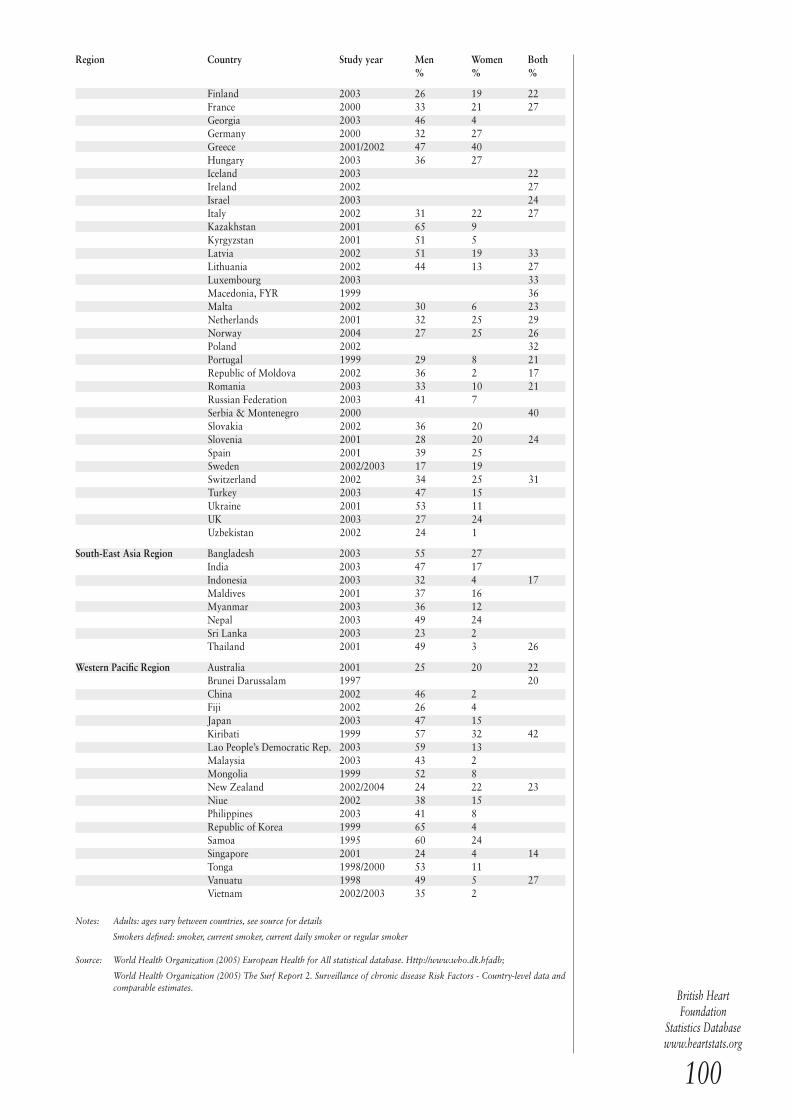


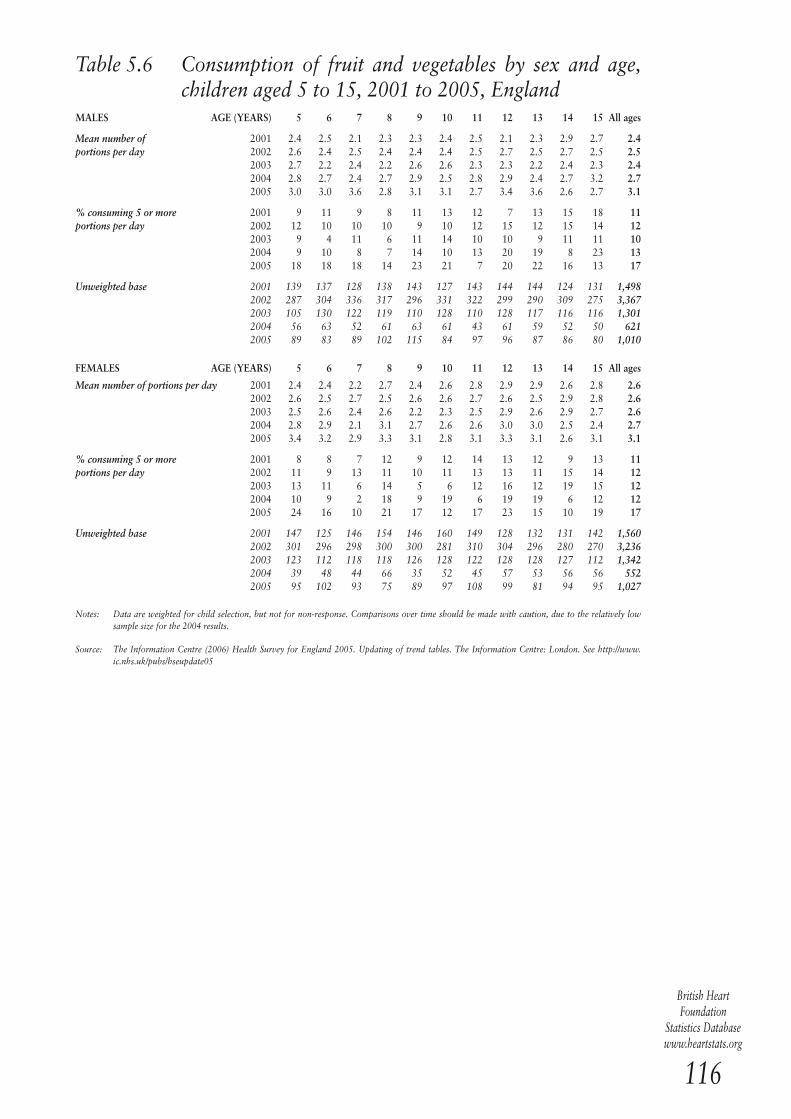


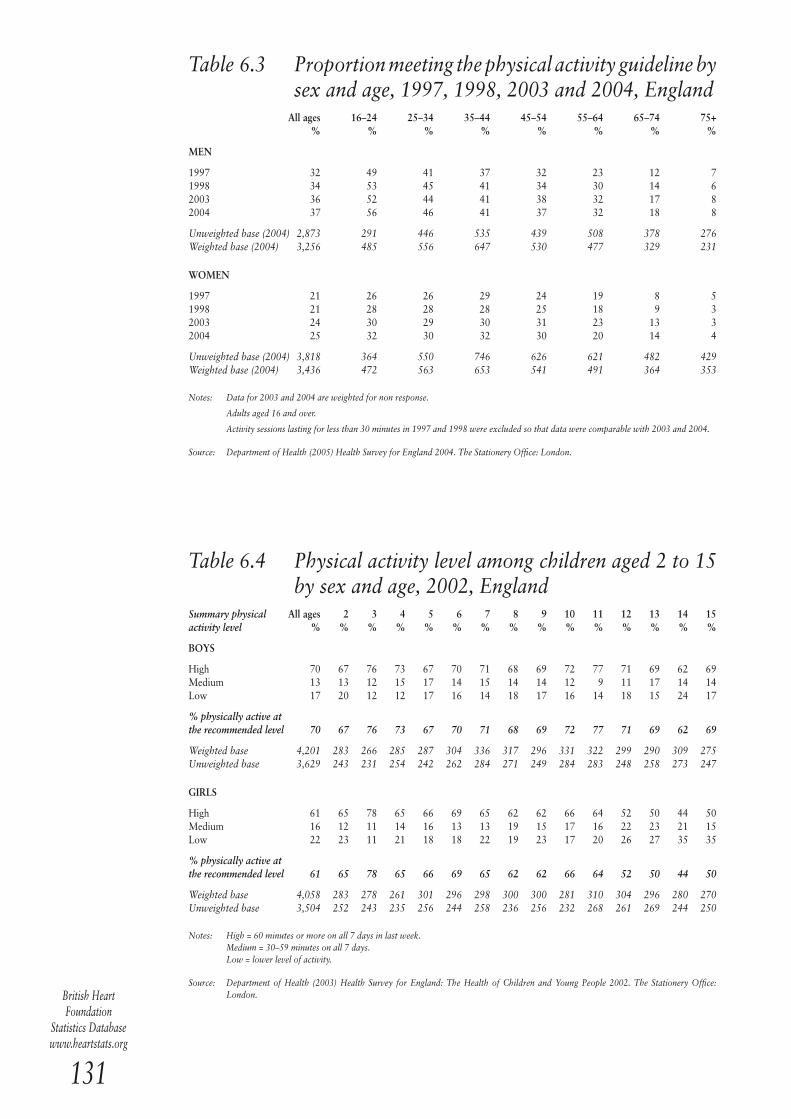


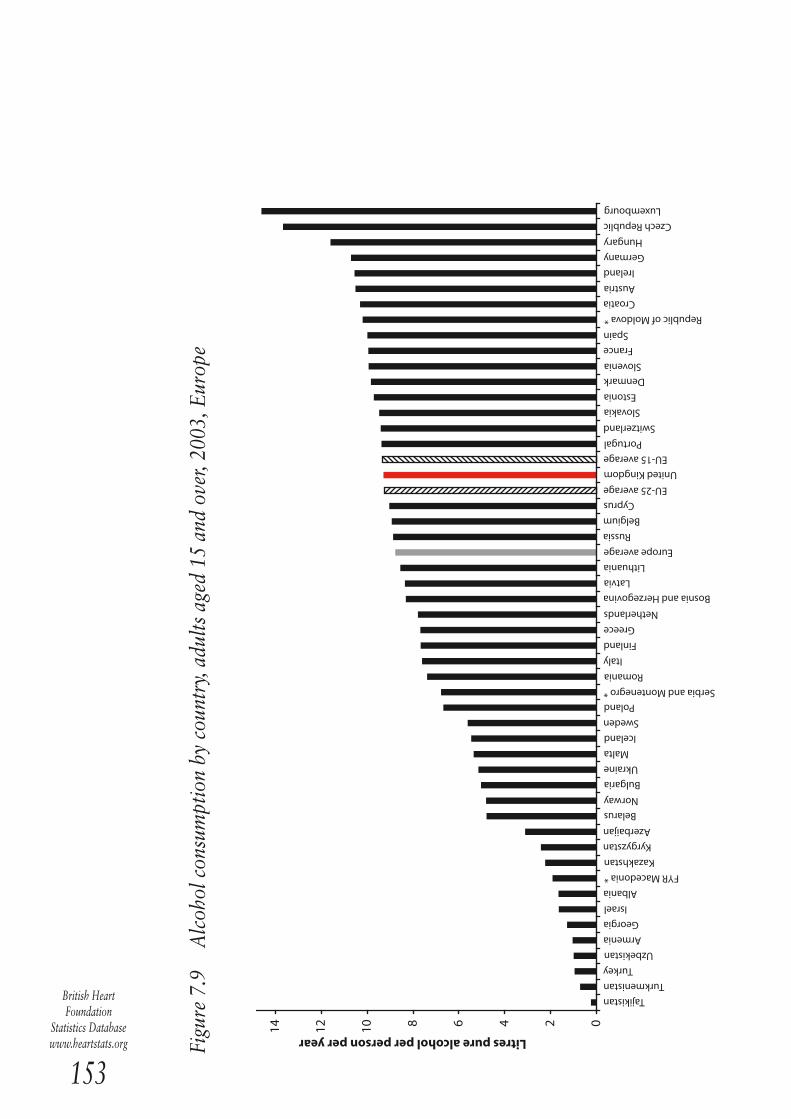


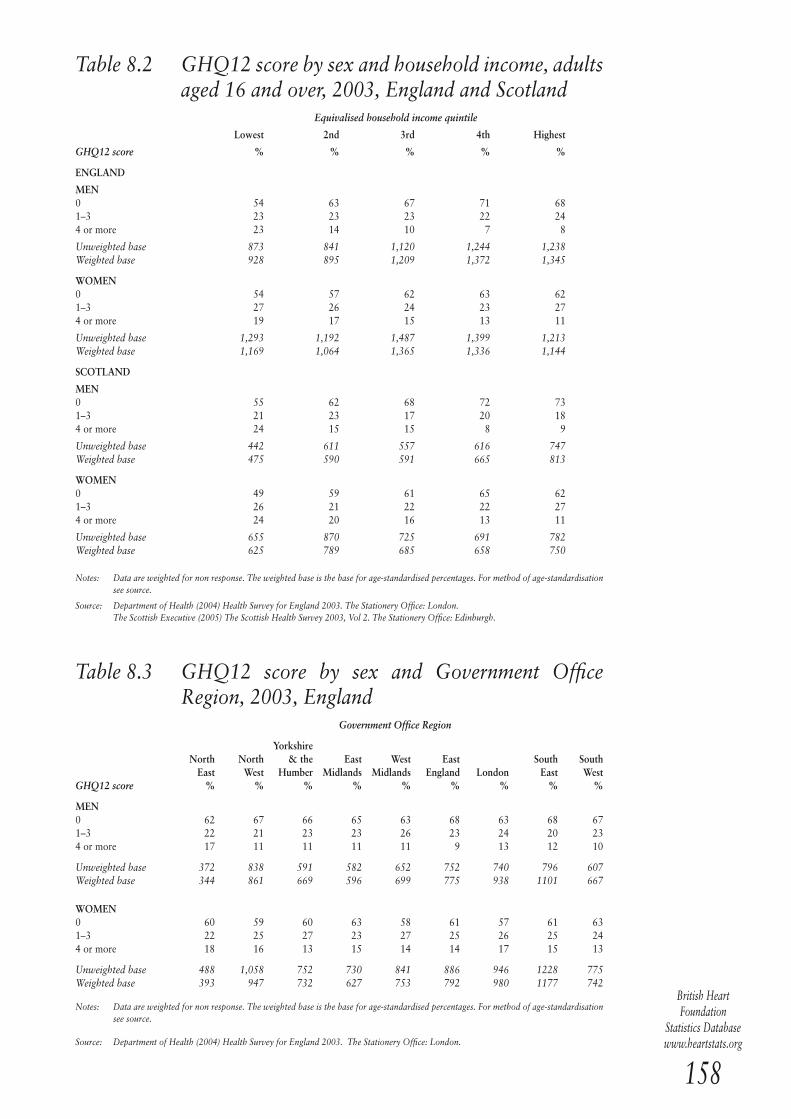


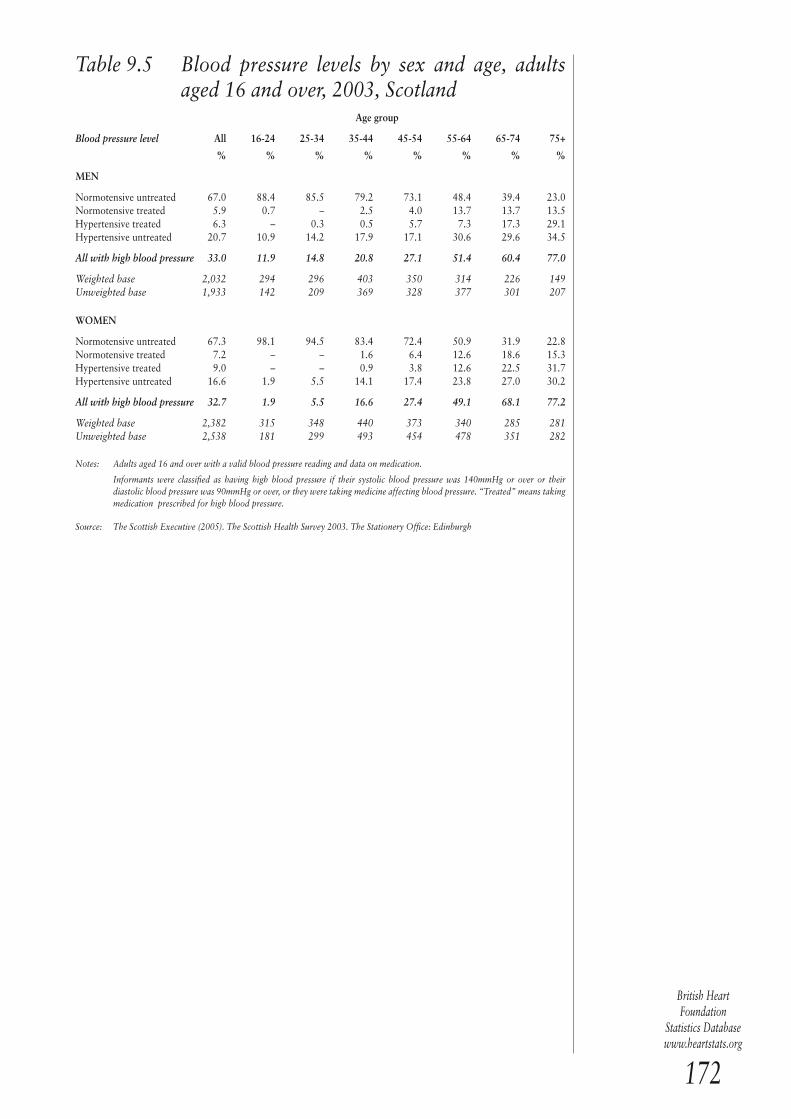


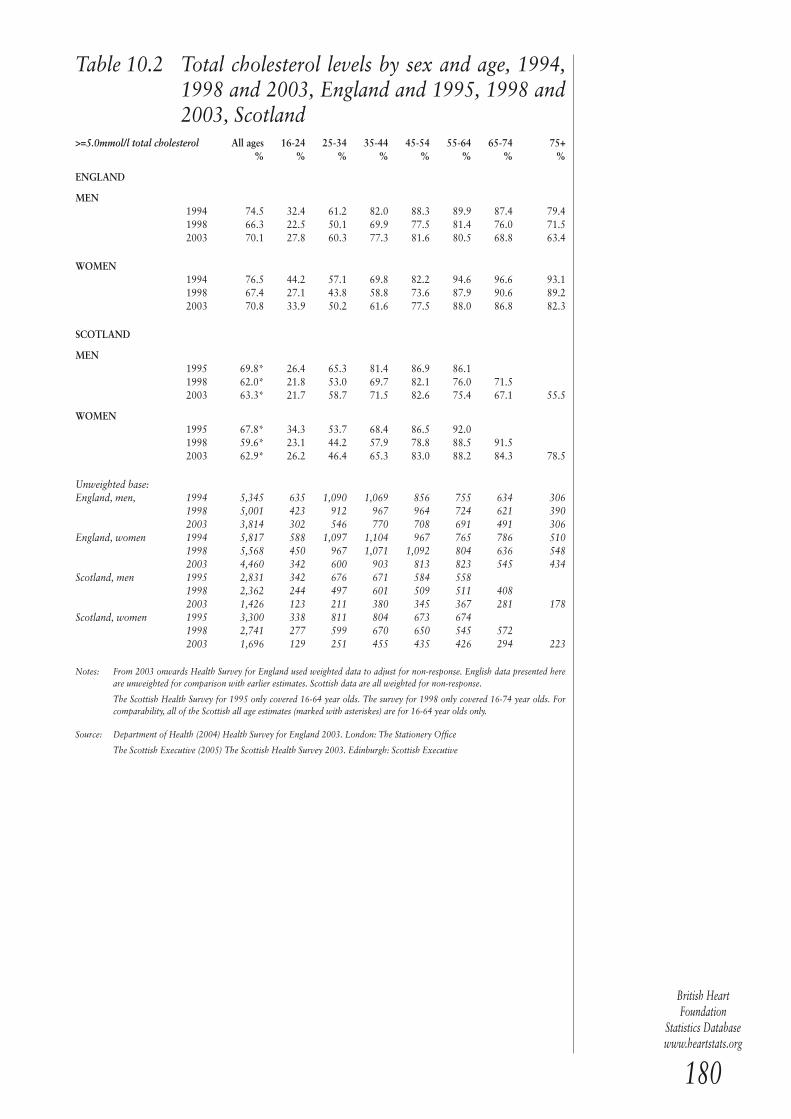
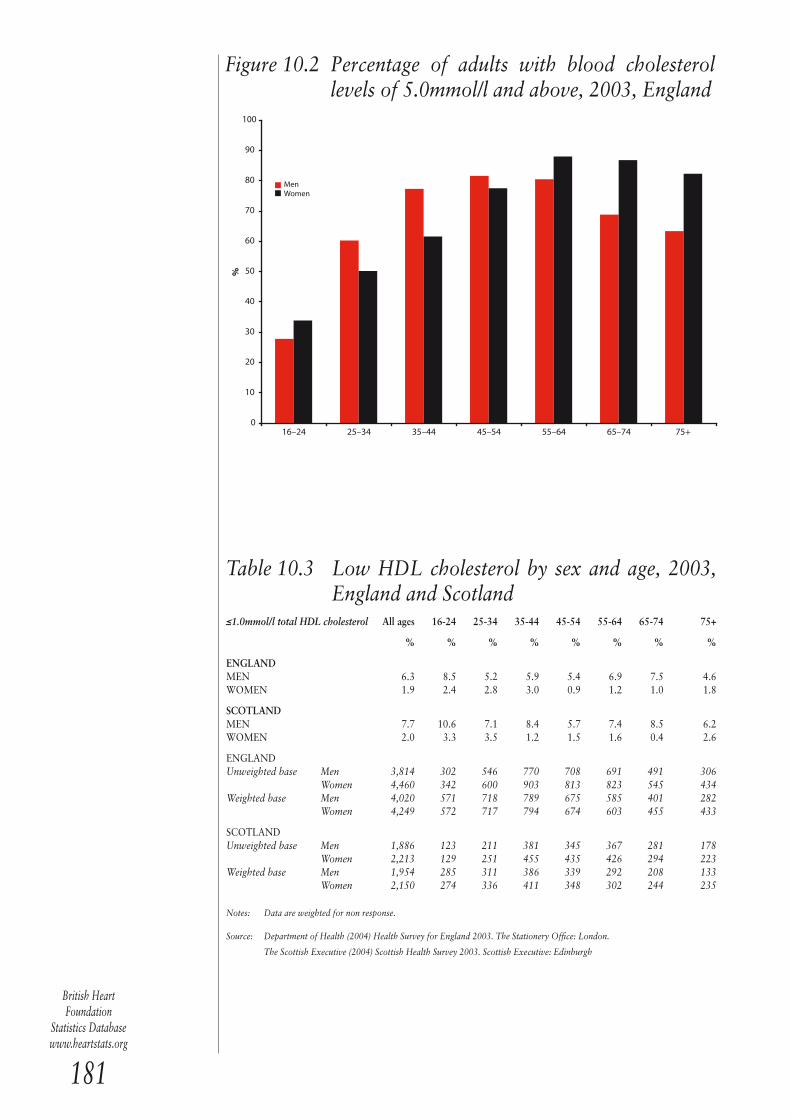


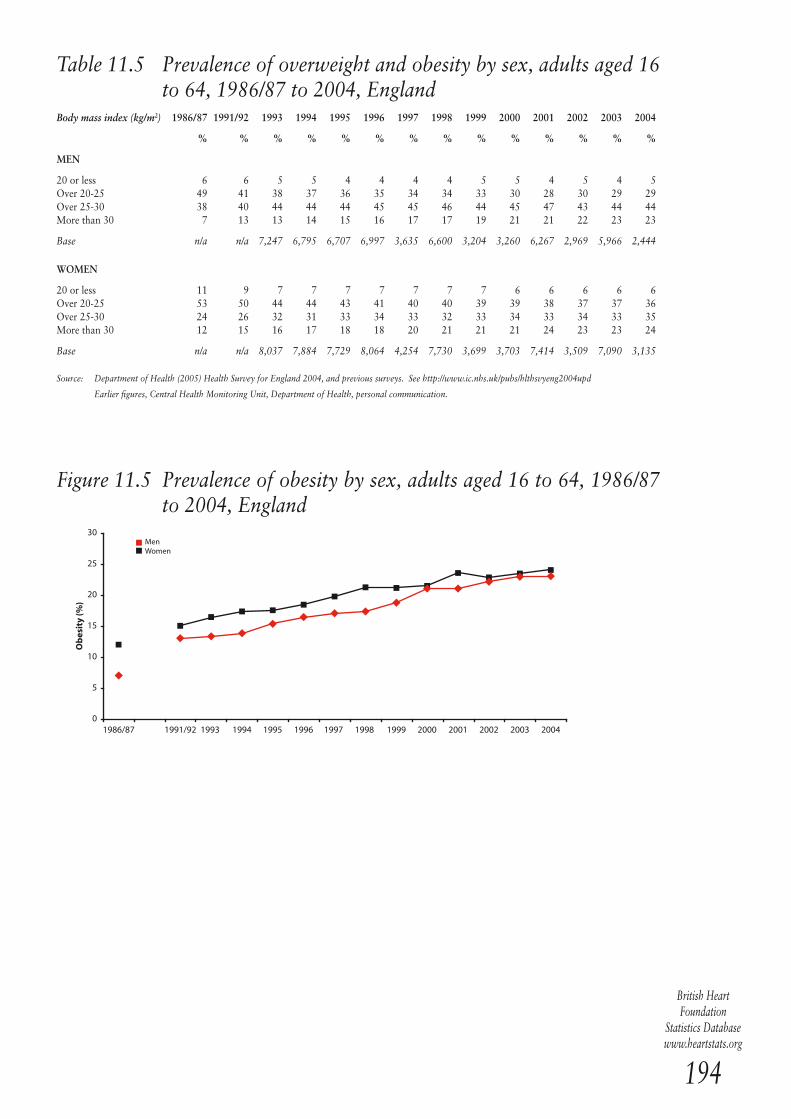


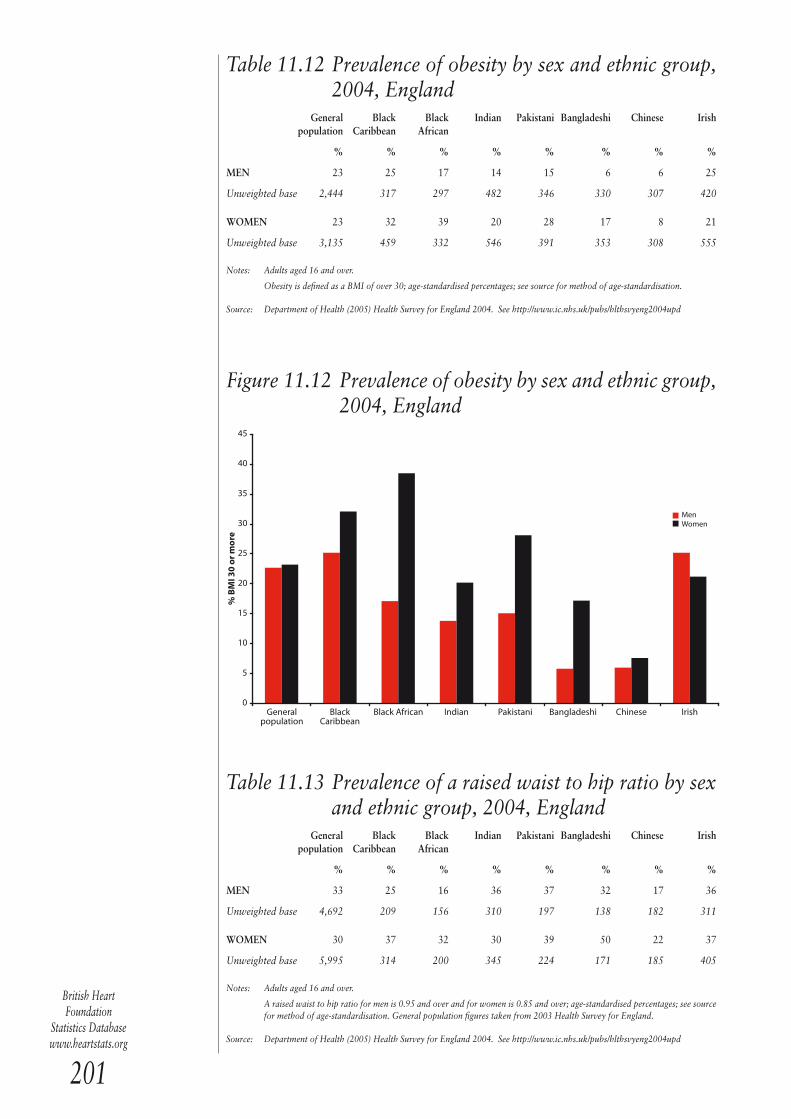


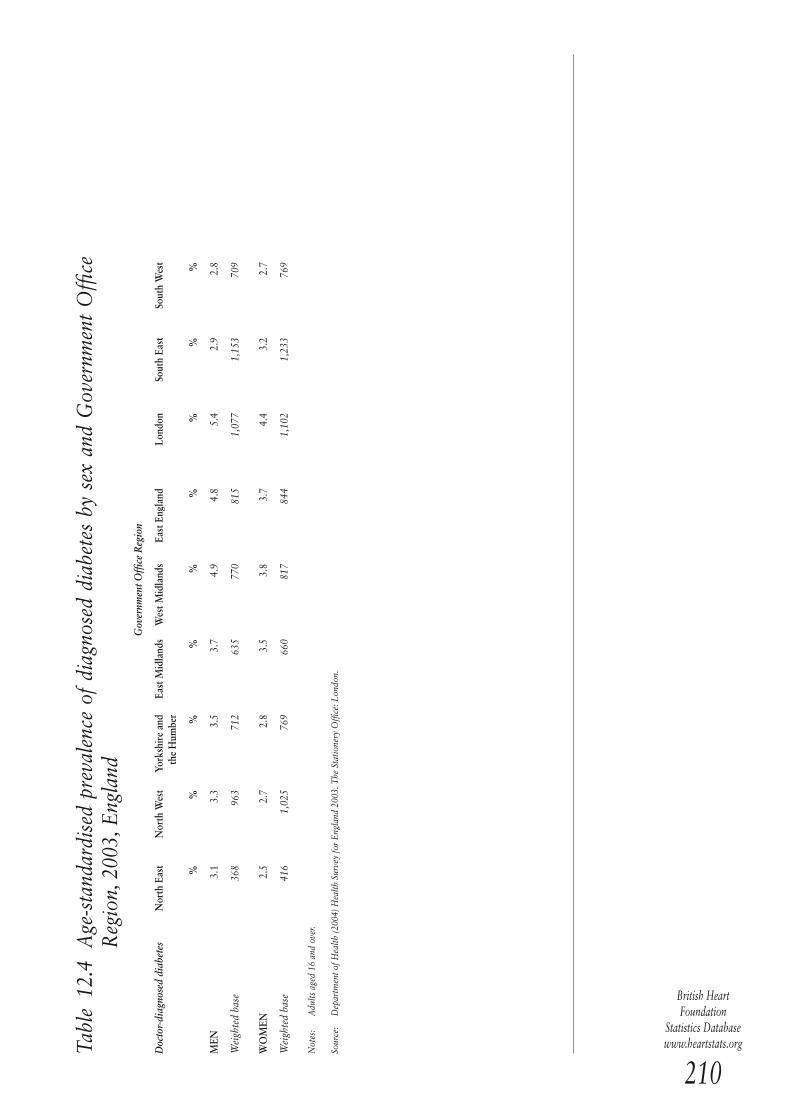


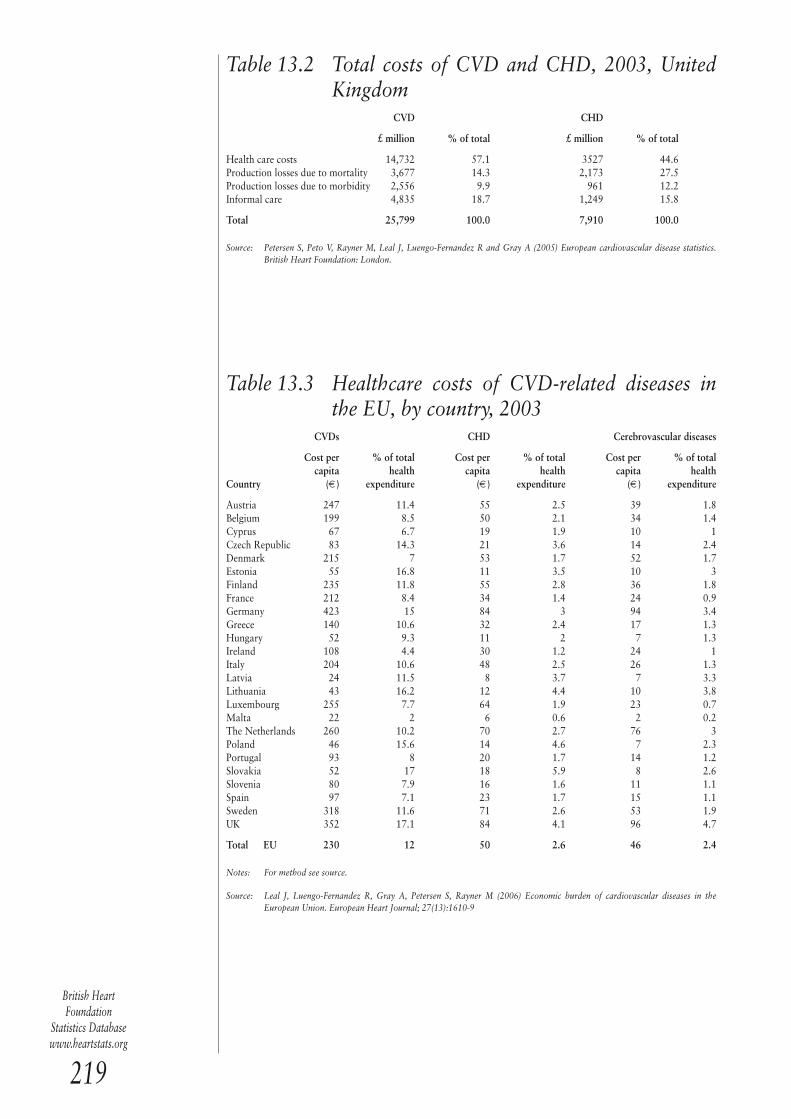
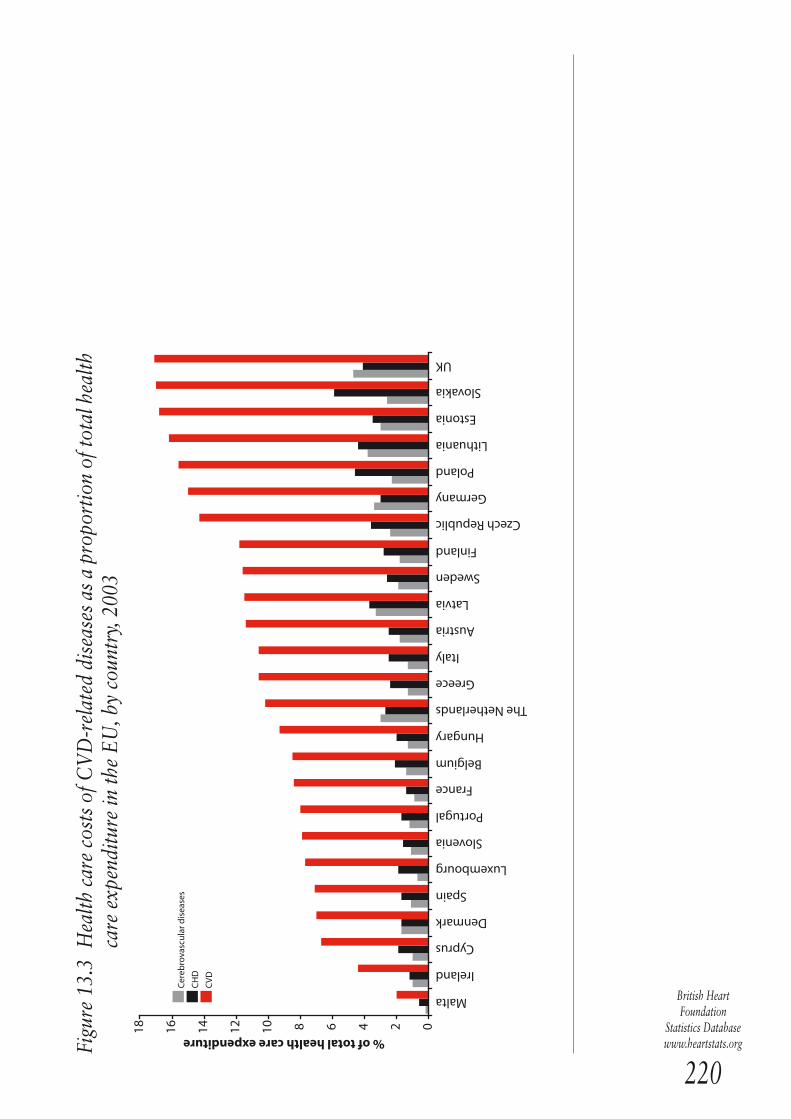
![Reducing Premature Cardiovascular Morbidity and Mortality ... › cvd...prevalent cardiovascular disease (CVD) worldwide is likely to be around 100 million[1e3].Thefive-year rate](https://static.documents.pub/doc/80x56/5f0e23587e708231d43dcb54/reducing-premature-cardiovascular-morbidity-and-mortality-a-cvd-prevalent.jpg)


