56
CORPORATE FINANCIAL THEORY Lecture 3
| Date post: | 16-Dec-2015 |
| Category: |
Documents |
| Upload: | joshua-millwood |
| View: | 216 times |
| Download: | 2 times |

CORPORATE FINANCIALTHEORY
Lecture 3
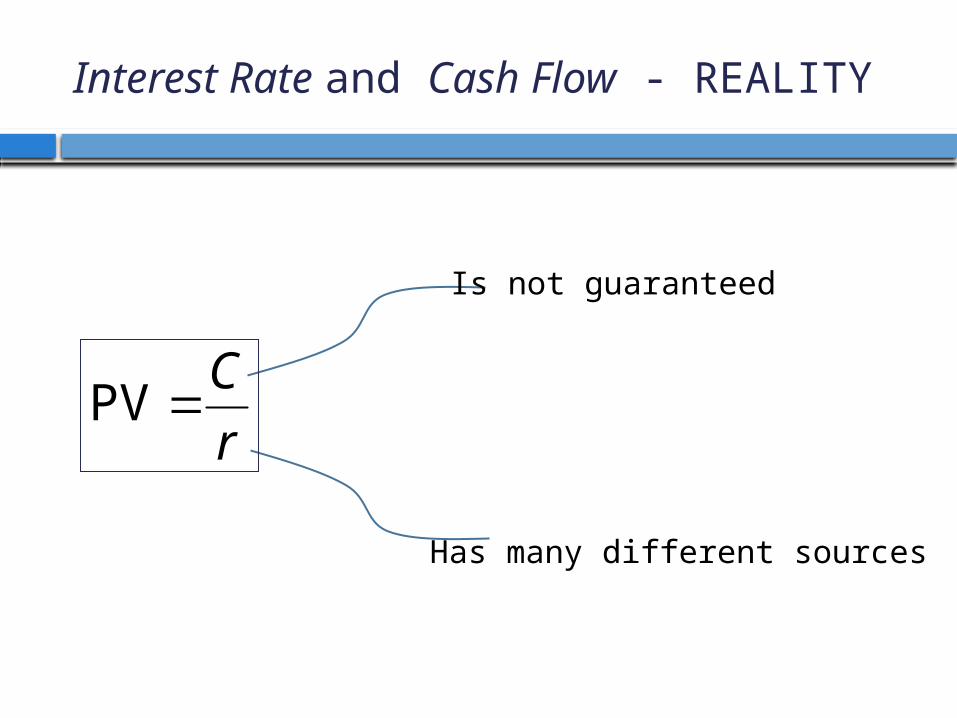
Interest Rate and Cash Flow - REALITY
r
CPV
Is not guaranteed
Has many different sources
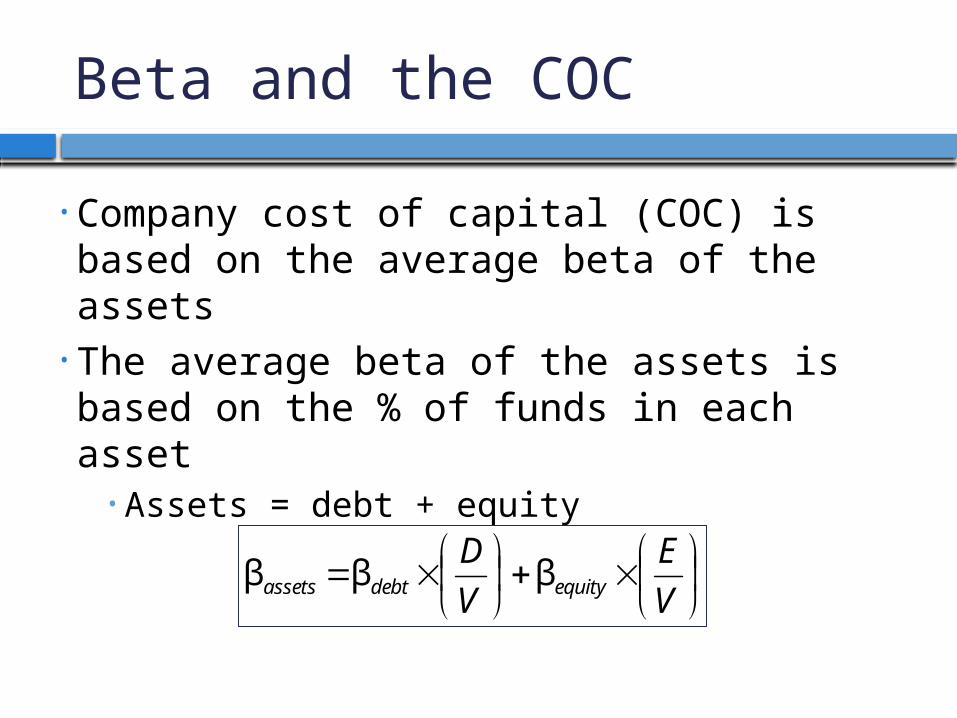
Beta and the COC
• Company cost of capital (COC) is based on the average beta of the assets
• The average beta of the assets is based on the % of funds in each asset• Assets = debt + equity
V
E
V
Dequitydebtassets βββ
0
20
0 0.2 0.8 1.2
Expected return (%)
Bdebt Bassets Bequity
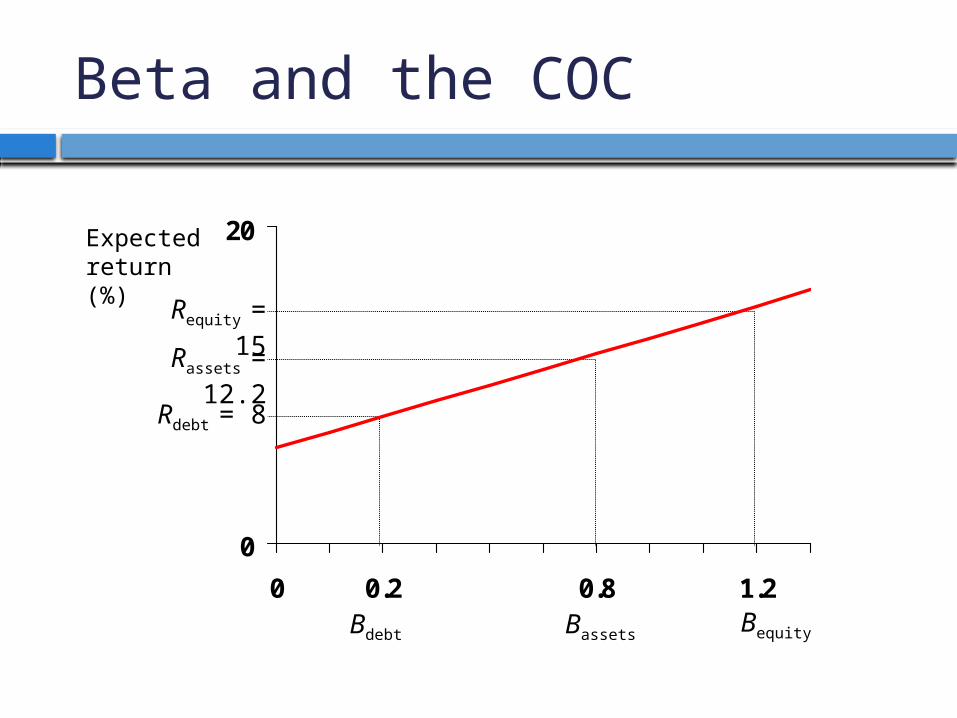
Rdebt = 8
Rassets = 12.2
Requity = 15
Beta and the COC

Company Cost of Capitalsimple approach
Company Cost of Capital (COC) is based on the average beta of the assets
The average Beta of the assets is based on the % of funds in each asset
Assets = Debt + Equity
equityequityDebtDebtassets rrr %%
COCCapital ofCost assetsr
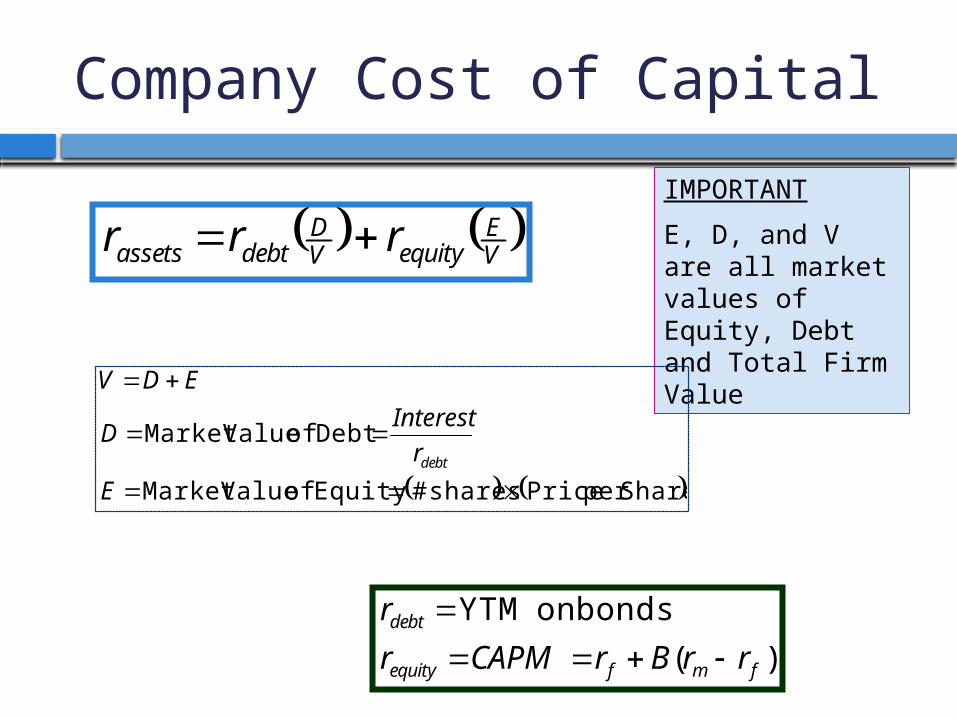
IMPORTANT
E, D, and V are all market values of Equity, Debt and Total Firm Value
Company Cost of Capital
Shareper Price shares # Equity of ValueMarket
Debt of ValueMarket
E
r
InterestD
EDV
debt
VE
equityVD
debtassets rrr
)(
bondson YTM
fmfequity
debt
rrBrCAPMr
r
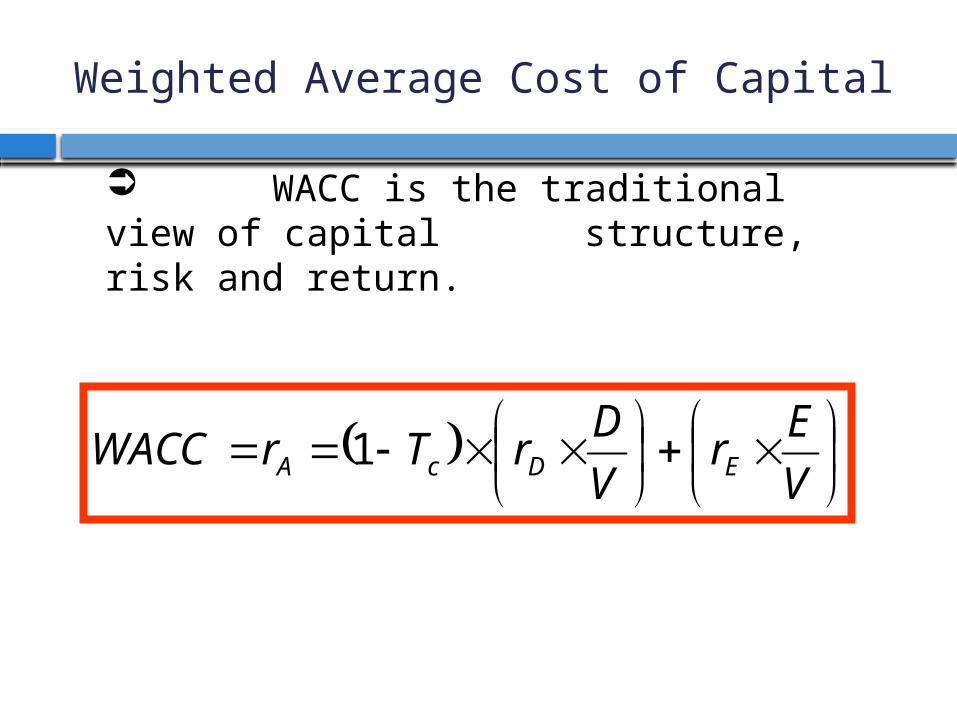
Weighted Average Cost of Capital
V
Er
V
DrTrWACC EDcA 1
WACC is the traditional view of capital structure, risk and return.

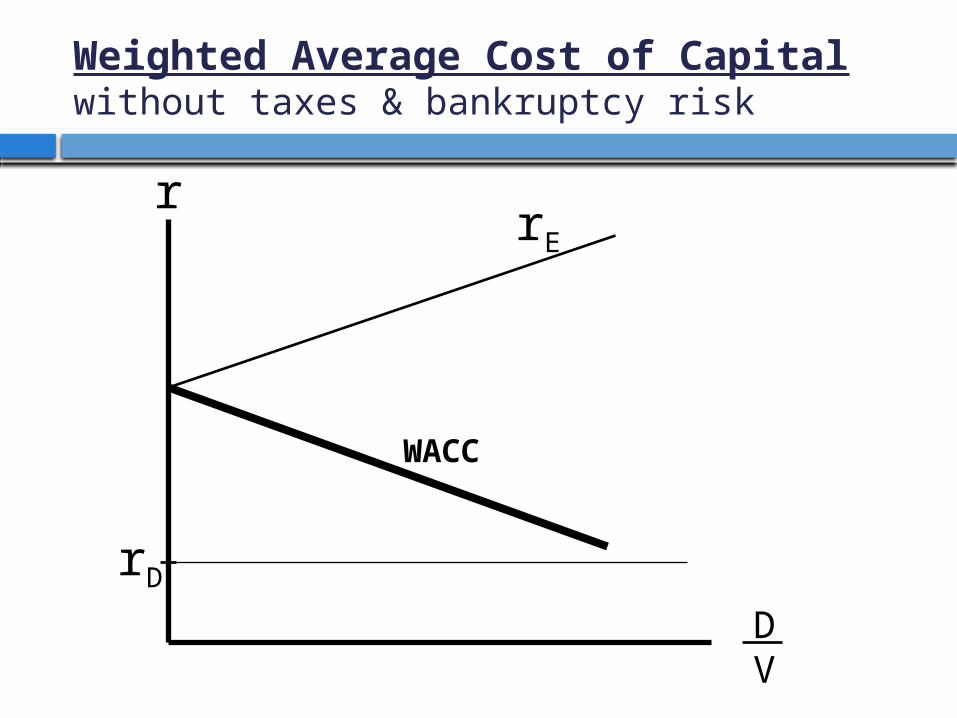
Weighted Average Cost of Capitalwithout taxes & bankruptcy risk
r
DV
rD
rE
r
DV
rD
rE
WACC
Weighted Average Cost of Capitalwithout taxes & bankruptcy risk

DV
rD
rE
Includes Bankruptcy Risk
Weighted Average Cost of Capitalwithout taxes & bankruptcy risk
r

r
DV
rD
rE
Weighted Average Cost of Capitalwithout taxes & bankruptcy risk
Includes Bankruptcy Risk

r
DV
rD
rE
WACC
Weighted Average Cost of Capitalwithout taxes & bankruptcy risk
Includes Bankruptcy Risk

r
DV
WACCr*
D*
Weighted Average Cost of Capitalwithout taxes & bankruptcy risk
Includes Bankruptcy Risk
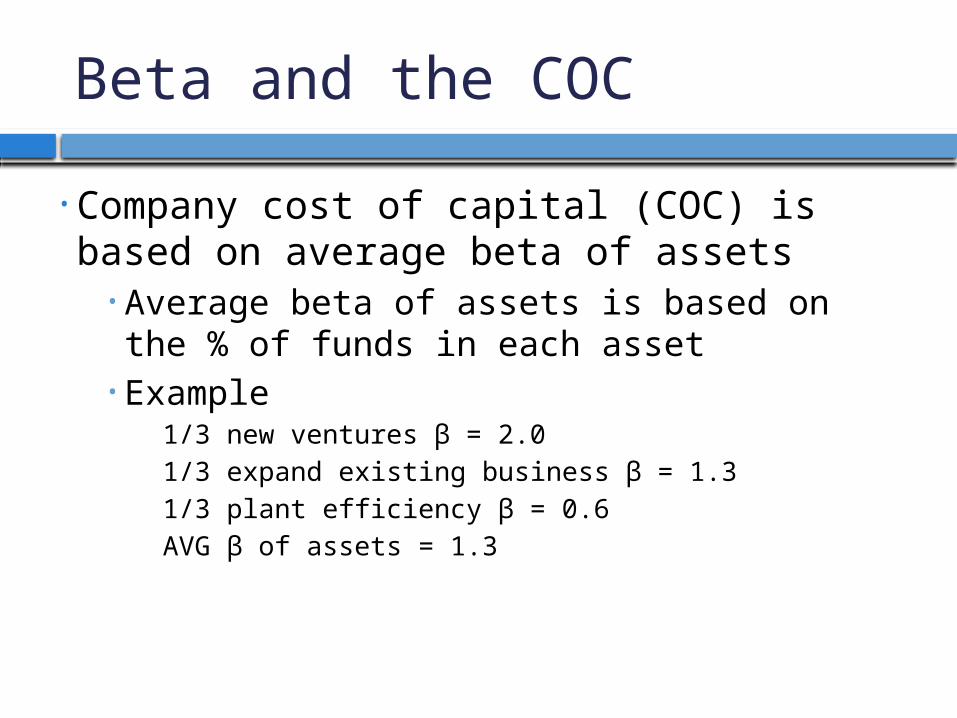
• Company cost of capital (COC) is based on average beta of assets• Average beta of assets is based on the % of funds in each asset
• Example1/3 new ventures β = 2.01/3 expand existing business β = 1.31/3 plant efficiency β = 0.6AVG β of assets = 1.3
Beta and the COC

• Company Cost of Capital
Beta and the COC
10%nologyknown tech t,improvemenCost
COC)(Company 15%business existing ofExpansion
20%products New
30% ventureseSpeculativ
RateDiscount Category

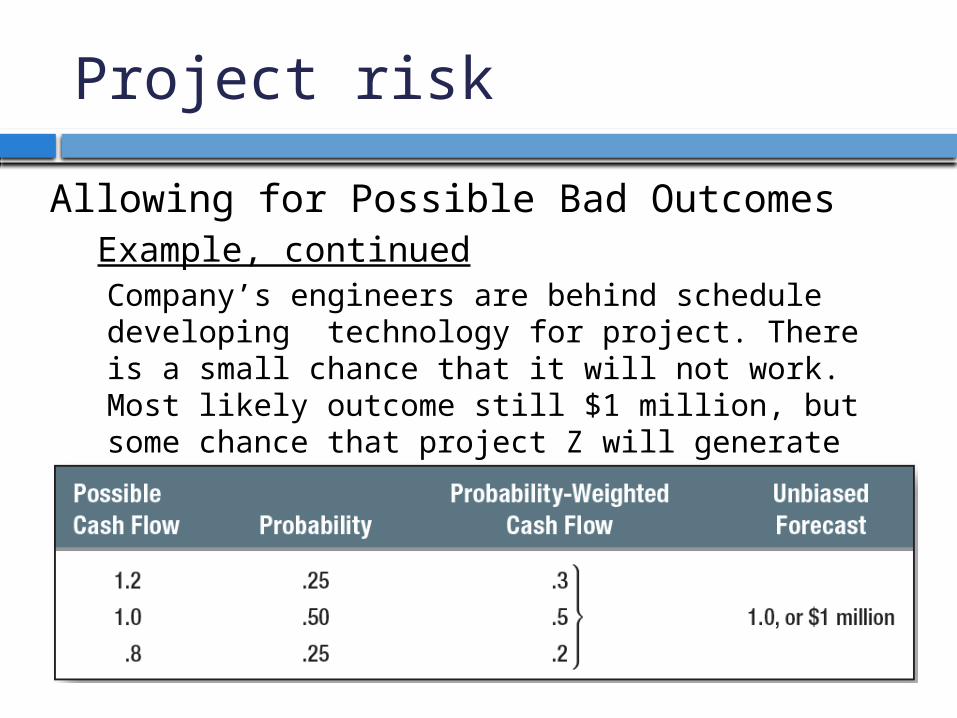
Project risk
Allowing for Possible Bad OutcomesExampleProject Z will produce one cash flow, forecasted at $1 million at year 1. It is regarded as average risk, suitable for discounting at 10% company COC:
100,909$1.1
000,000,1
1PV 1
r
C
Project risk
Allowing for Possible Bad OutcomesExample, continuedCompany’s engineers are behind schedule developing technology for project. There is a small chance that it will not work. Most likely outcome still $1 million, but some chance that project Z will generate zero cash flow next year:
Project risk
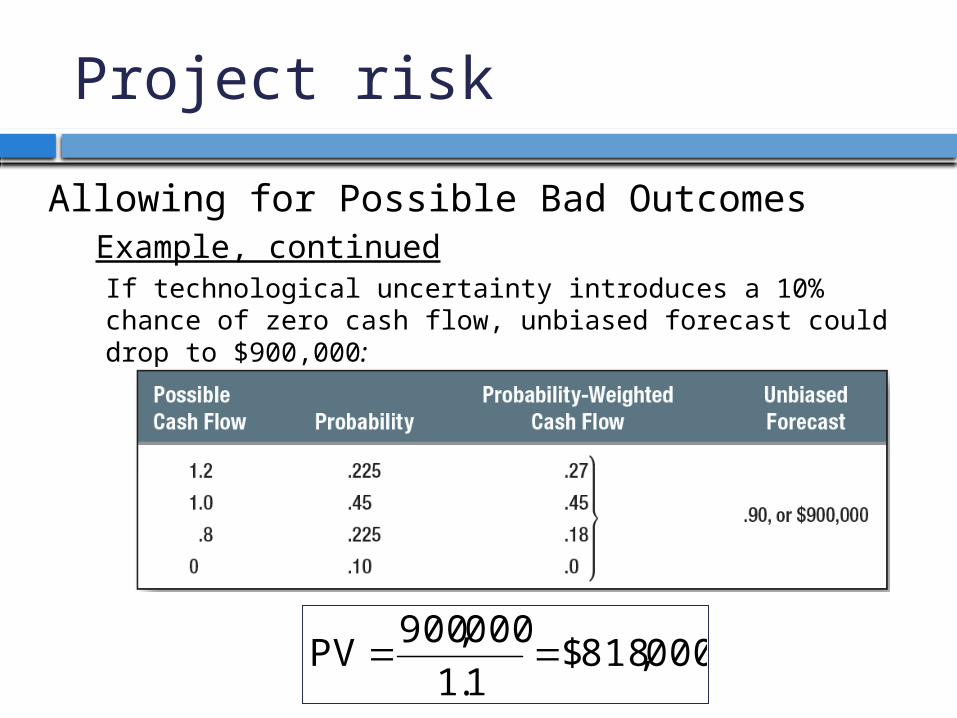
Allowing for Possible Bad OutcomesExample, continuedIf technological uncertainty introduces a 10% chance of zero cash flow, unbiased forecast could drop to $900,000:
000,818$1.1
000,900PV

Risk, DCF and CEQ
Risk, Discounted Cash Flow (DCF), and Certainty Equivalents (CEQ)
tf
tt
t
rr
C
)1(
CEQ
)1(PV
Risk,DCF and CEQ
ExampleProject A is expected to produce CF = $100 mil for each of three years. Given a risk free rate of 6%, a market premium of 8%, and beta of .75, what is the PV of the project?

Risk,DCF and CEQ
Example
Project A is expected to produce CF = $100 mil for each of three years. Given a risk free rate of 6%, a market premium of 8%, and beta of .75, what is the PV of the project?
%12
)8(75.6
)(
fmf rrBrr

Risk,DCF and CEQ
Example
Project A is expected to produce CF = $100 mil for each of three years. Given a risk free rate of 6%, a market premium of 8%, and beta of .75, what is the PV of the project?
%12
)8(75.6
)(
fmf rrBrr
240.2 PVTotal
71.21003
79.71002
89.31001
12% @ PV FlowCashYear
AProject

Risk,DCF and CEQ
Example
Project A is expected to produce CF = $100 mil for each of three years. Given a risk free rate of 6%, a market premium of 8%, and beta of .75, what is the PV of the project?
%12
)8(75.6
)(
fmf rrBrr
240.2 PVTotal
71.21003
79.71002
89.31001
12% @ PV FlowCashYear
AProject
Now assume that the cash flows change, but are RISK FREE. What is the new PV?

Risk,DCF and CEQ
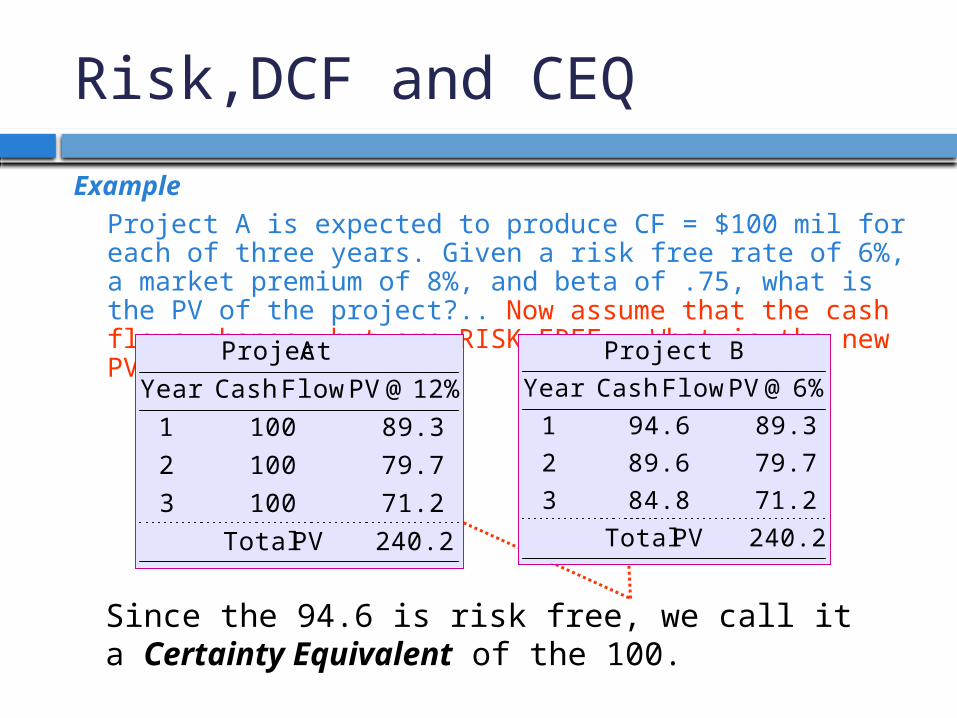
ExampleProject A is expected to produce CF = $100 mil for each of three years. Given a risk free rate of 6%, a market premium of 8%, and beta of .75, what is the PV of the project?.. Now assume that the cash flows change, but are RISK FREE. What is the new PV?
240.2 PVTotal
71.284.83
79.789.62
89.394.61
6% @ PV FlowCashYear
Project B
240.2 PVTotal
71.21003
79.71002
89.31001
12% @ PV FlowCashYear
AProject
Risk,DCF and CEQ
ExampleProject A is expected to produce CF = $100 mil for each of three years. Given a risk free rate of 6%, a market premium of 8%, and beta of .75, what is the PV of the project?.. Now assume that the cash flows change, but are RISK FREE. What is the new PV?
240.2 PVTotal
71.284.83
79.789.62
89.394.61
6% @ PV FlowCashYear
Project B
240.2 PVTotal
71.21003
79.71002
89.31001
12% @ PV FlowCashYear
AProject
Since the 94.6 is risk free, we call it a Certainty Equivalent of the 100.

Risk,DCF and CEQ
Example
Project A is expected to produce CF = $100 mil for each of three years. Given a risk free rate of 6%, a market premium of 8%, and beta of .75, what is the PV of the project? DEDUCTION FOR RISK
15.284.81003
10.489.61002
5.494.61001riskfor
DeductionCEQFlowCash Year

Risk,DCF and CEQ
ExampleProject A is expected to produce CF = $100 mil for each of three years. Given a risk free rate of 6%, a market premium of 8%, and beta of .75, what is the PV of the project?.. Now assume that the cash flows change, but are RISK FREE. What is the new PV?
The difference between the 100 and the certainty equivalent (94.6) is 5.4%…this % can be considered the annual premium on a risky cash flow
flow cash equivalentcertainty 054.1
flow cashRisky

Risk,DCF and CEQ
ExampleProject A is expected to produce CF = $100 mil for each of three years. Given a risk free rate of 6%, a market premium of 8%, and beta of .75, what is the PV of the project?.. Now assume that the cash flows change, but are RISK FREE. What is the new PV?
8.84054.1
100 3Year
6.89054.1
100 2Year
6.94054.1
100 1Year
3
2

Capital Budgeting & Risk
Invest in highest NPV project
Need Discount rate to get NPV
Use CAPM to get discount rate
Modify CAPM (account for proper risk)
Modify Cash Flows

Capital Budgeting & Risk
Sensitivity Analysis - Analysis of the effects of changes in sales, costs, etc. on a project.
Scenario Analysis - Project analysis given a particular combination of assumptions.
Simulation Analysis (Monte Carlo) - Estimation of the probabilities of different possible outcomes.
Break Even Analysis - Analysis of the level of sales (or other variable) at which the company breaks even.
Decision Trees – Binomial model in which outcomes are path dependent.
Real Options – The value of flexibility.

Sensitivity Analysis
ExampleGiven the expected cash flow forecasts for Otobai Company’s Motor Scooter project, listed on the next slide, determine the NPV of the project given changes in the cash flow components using a 10% cost of capital. Assume that all variables remain constant, except the one you are changing.

Sensitivity Analysis
Example - continuedPossible Outcomes
bil 2bil 3bil 4Cost Fixed
275,000300,000360,000CostVar Unit
380,000375,000350,000priceUnit
.16.1.04ShareMarket
mil 1.1mil 1.0mil .9SizeMarket
OptimisticExpectedcPessimistiVariable
Range

Sensitivity Analysis
Example - continuedNPV Possibilities (Billions Yen)
6.53.40.4Cost Fixed
11.13.415.0-CostVar Unit
5.03.44.2-priceUnit
17.33.410.4-ShareMarket
5.73.41.1SizeMarket
OptimisticExpectedcPessimistiVariable
Range
Sensitivity Analysis
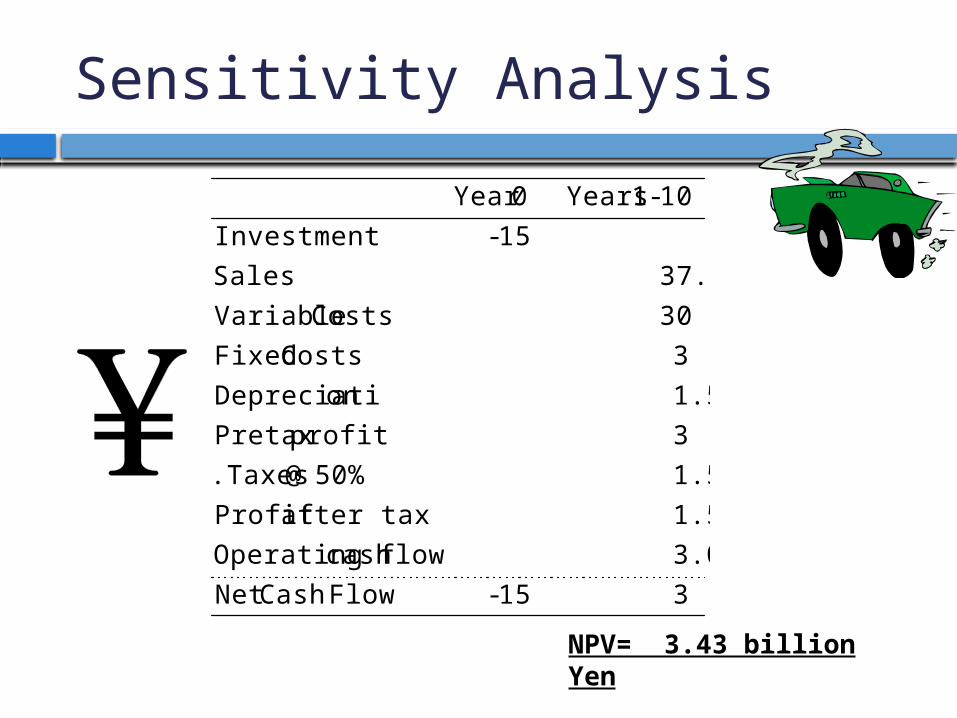
315- FlowCashNet
3.0flow cash Operating
1.5after taxProfit
1.550% @ .Taxes
3profitPretax
1.5onDepreciati
3Costs Fixed
30Costs Variable
37.5Sales
15-Investment
10-1 Years0Year
NPV= 3.43 billion Yen

Sensitivity Analysis
Example - continuedPossible Outcomes
bil 2bil 3bil 4Cost Fixed
275,000300,000360,000CostVar Unit
380,000375,000350,000priceUnit
.16.1.04ShareMarket
mil 1.1mil 1.0mil .9SizeMarket
OptimisticExpectedcPessimistiVariable
Range
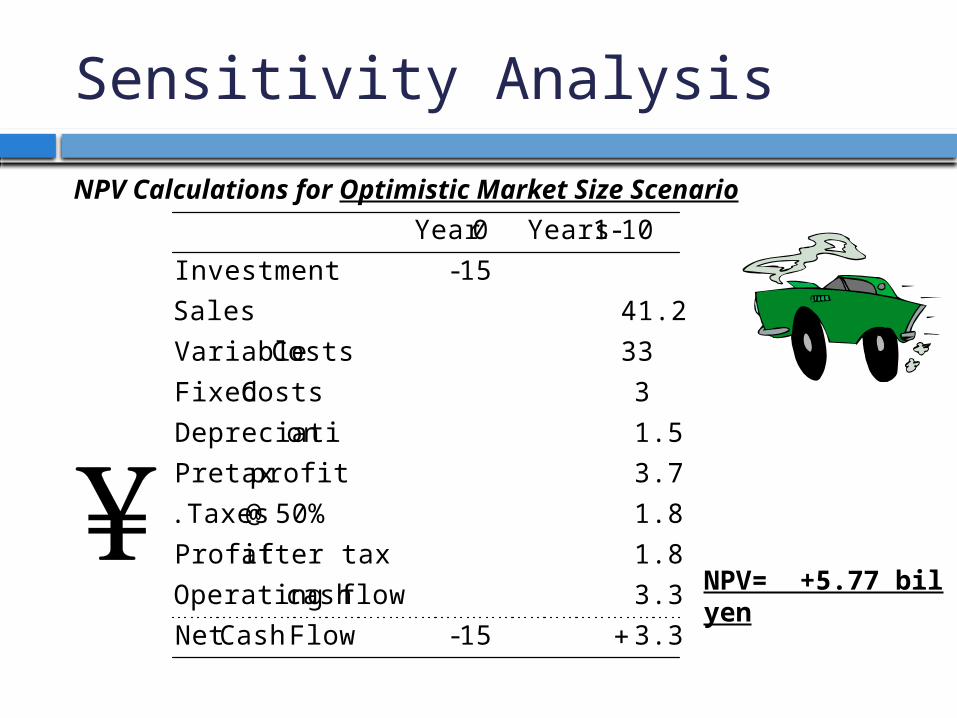
Sensitivity Analysis
NPV Calculations for Optimistic Market Size Scenario
NPV= +5.77 bil yen
3.3815- FlowCashNet
3.38flow cash Operating
1.88after taxProfit
1.8850% @ .Taxes
3.75profitPretax
1.5onDepreciati
3Costs Fixed
33Costs Variable
41.25Sales
15-Investment
10-1 Years0Year

Sensitivity Analysis
Example - continuedNPV Possibilities (Billions Yen)
6.53.40.4Cost Fixed
11.13.415.0-CostVar Unit
5.03.44.2-priceUnit
17.33.410.4-ShareMarket
5.73.41.1SizeMarket
OptimisticExpectedcPessimistiVariable
Range
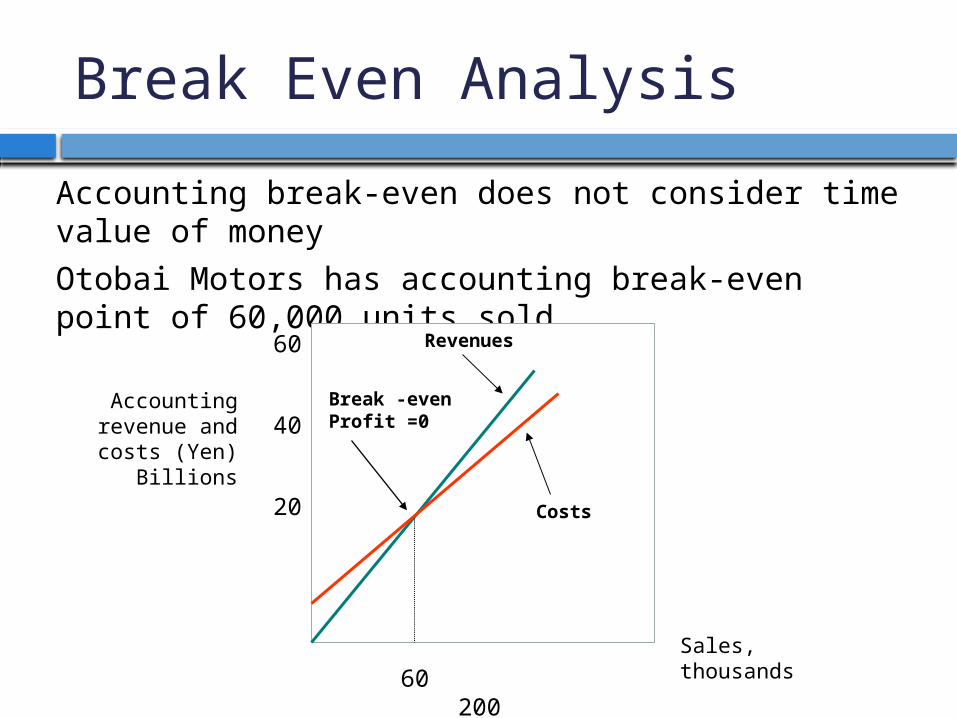
Break Even Analysis
Accounting break-even does not consider time value of money
Otobai Motors has accounting break-even point of 60,000 units sold
60 200
Sales, thousands
Accounting revenue and
costs (Yen)Billions
60
40
20
Break -evenProfit =0
Revenues
Costs

Break Even Analysis
Point at which NPV=0 is break-even point
Otobai Motors has a break-even point of 85,000 units sold
Sales, thousands
PV (Yen)Billions
400
200
19.6
85 200
Break-evenNPV = 0
PV inflows
PV Outflows
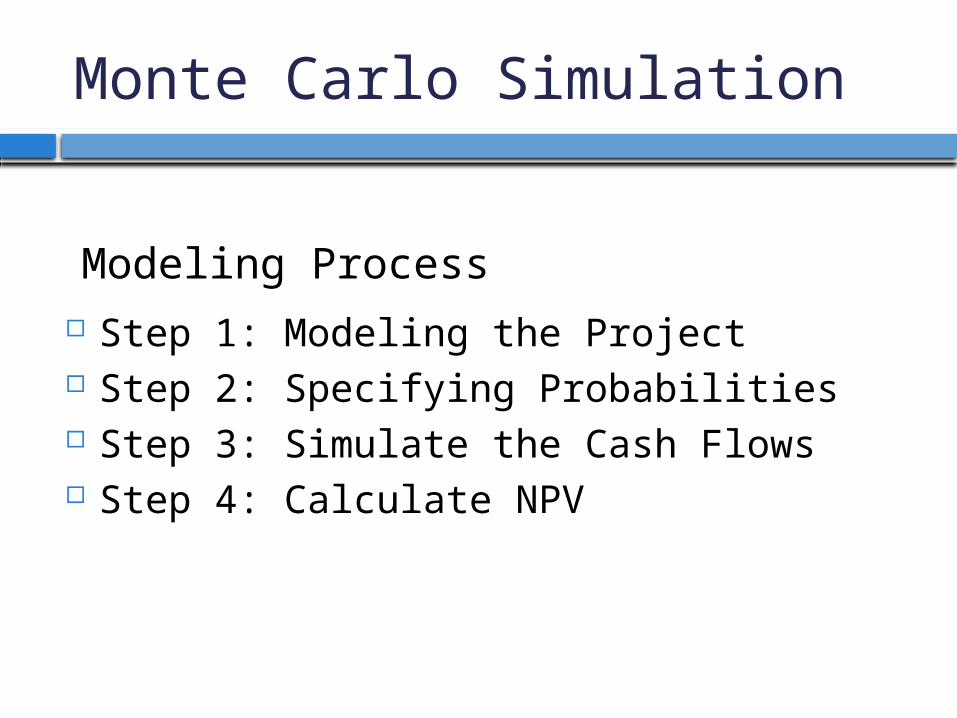
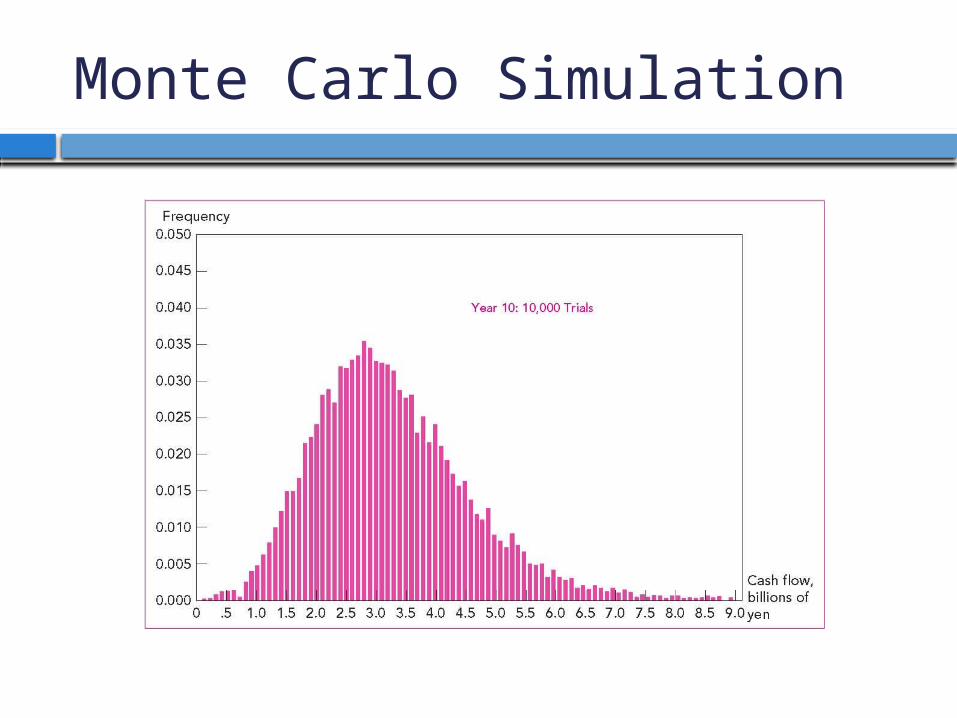
Monte Carlo Simulation
Step 1: Modeling the Project Step 2: Specifying Probabilities Step 3: Simulate the Cash Flows Step 4: Calculate NPV
Modeling Process
Monte Carlo Simulation
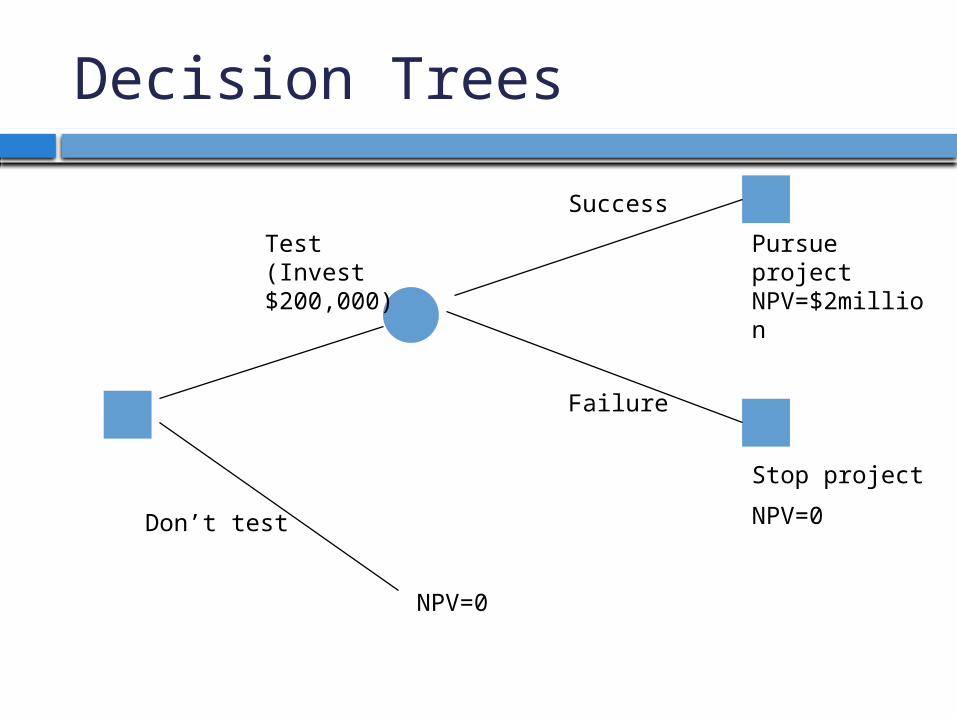
Decision Trees
NPV=0
Don’t test
Test (Invest $200,000)
Success
Failure
Pursue project NPV=$2million
Stop project
NPV=0
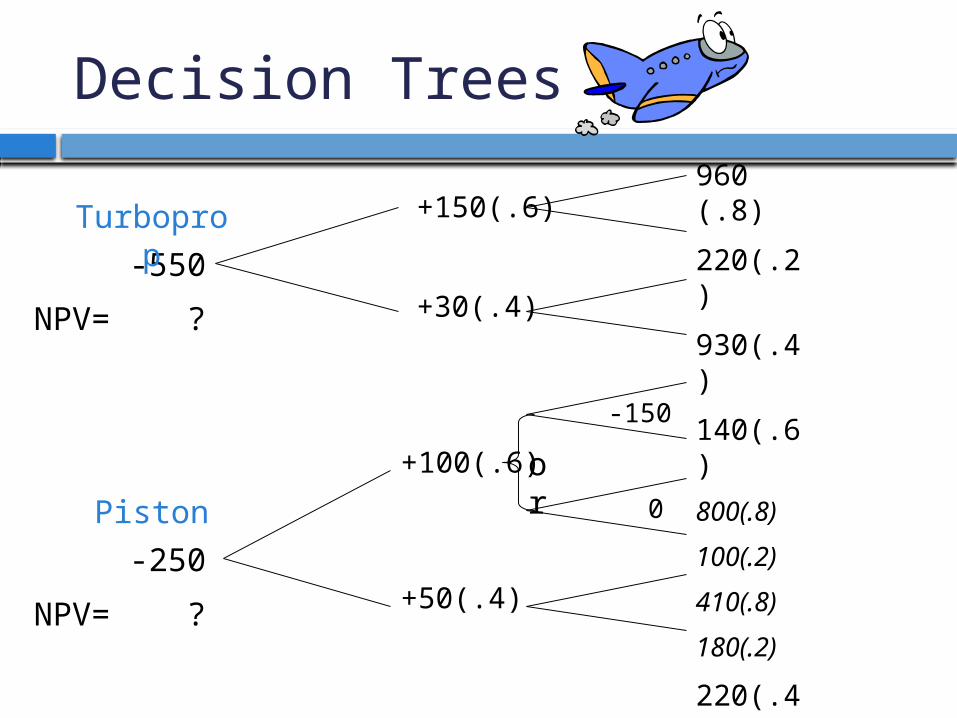
Decision Trees
960 (.8)
220(.2)
930(.4)
140(.6)
800(.8)
100(.2)
410(.8)
180(.2)
220(.4)
100(.6)
+150(.6)
+30(.4)
+100(.6)
+50(.4)
-550
NPV= ?
-250
NPV= ?
-150
0
or
Turboprop
Piston
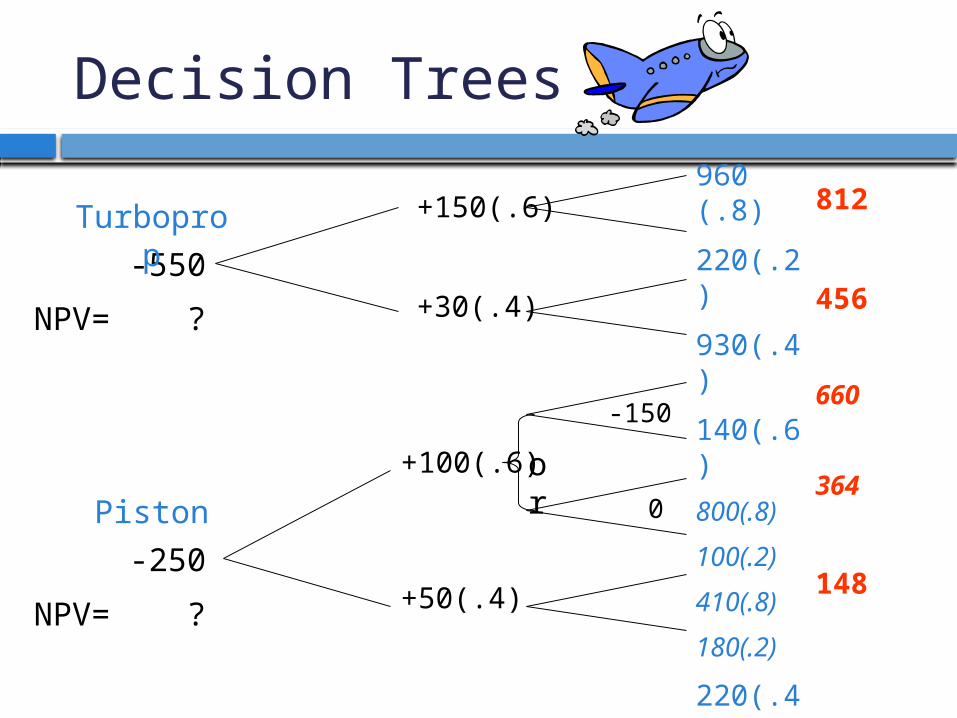
Decision Trees
960 (.8)
220(.2)
930(.4)
140(.6)
800(.8)
100(.2)
410(.8)
180(.2)
220(.4)
100(.6)
+150(.6)
+30(.4)
+100(.6)
+50(.4)
-550
NPV= ?
-250
NPV= ?
-150
0
or
812
456
660
364
148
Turboprop
Piston

Decision Trees
960 (.8)
220(.2)
930(.4)
140(.6)
800(.8)
100(.2)
410(.8)
180(.2)
220(.4)
100(.6)
+150(.6)
+30(.4)
+100(.6)
+50(.4)
-550
NPV= ?
-250
NPV= ?
-150
0
or
812
456
660
364
148 81220.22080.960
Turboprop
Piston

Decision Trees
960 (.8)
220(.2)
930(.4)
140(.6)
800(.8)
100(.2)
410(.8)
180(.2)
220(.4)
100(.6)
-550
NPV= ?
-250
NPV= ?
-150
0
or
812
456
660
364
148
+150(.6)
+30(.4)
+100(.6)
+50(.4)
NPV=444.55
NPV=888.18
NPV=550.00
NPV=184.55
*450
331
18.88815010.1
812
Turboprop
Piston

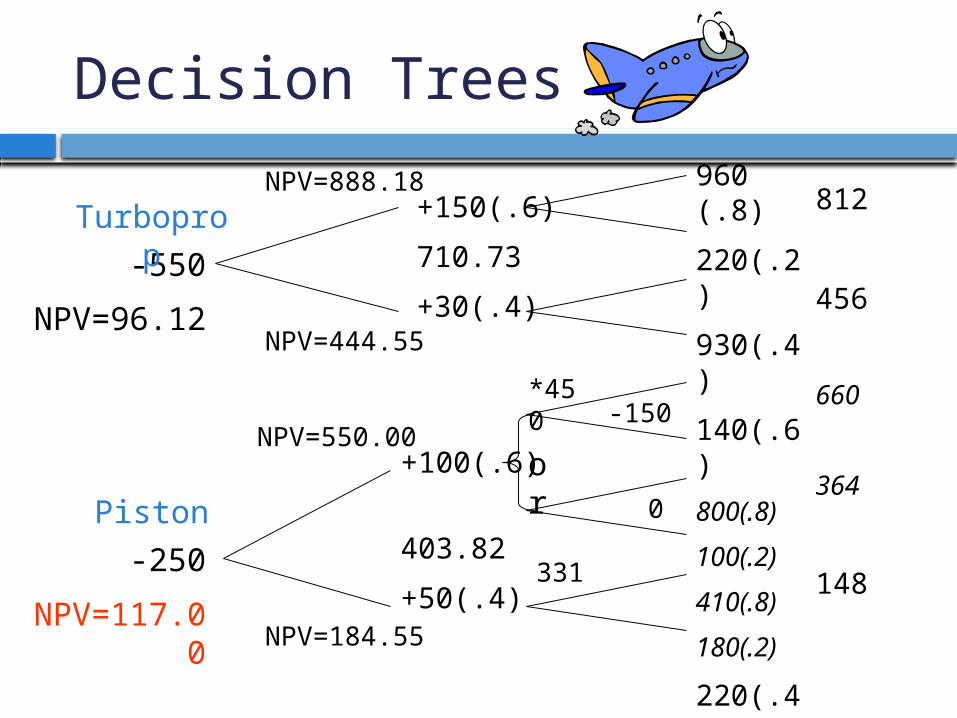
Decision Trees
960 (.8)
220(.2)
930(.4)
140(.6)
800(.8)
100(.2)
410(.8)
180(.2)
220(.4)
100(.6)
812
456
660
364
148
+150(.6)
710.73
+30(.4)
+100(.6)
403.82
+50(.4)
-150
0
*450
331
or
NPV=444.55
NPV=888.18
NPV=550.00
NPV=184.55
-550
NPV= ?
-250
NPV= ?
40.55.44460.18.888
Turboprop
Piston

Decision Trees
960 (.8)
220(.2)
930(.4)
140(.6)
800(.8)
100(.2)
410(.8)
180(.2)
220(.4)
100(.6)
812
456
660
364
148
+150(.6)
710.73
+30(.4)
+100(.6)
403.82
+50(.4)
-550
NPV=96.12
-250
NPV=117.00
-150
0
*450
331
or
NPV=444.55
NPV=888.18
NPV=550.00
NPV=184.55
12.9655010.1
73.710
Turboprop
Piston

Decision Trees
960 (.8)
220(.2)
930(.4)
140(.6)
800(.8)
100(.2)
410(.8)
180(.2)
220(.4)
100(.6)
-550
NPV= ?
-250
NPV= ?
-150
0
or
812
456
660
364
148
+150(.6)
+30(.4)
+100(.6)
+50(.4)
*450
331
45015010.1
660Turboprop
Piston
Decision Trees
960 (.8)
220(.2)
930(.4)
140(.6)
800(.8)
100(.2)
410(.8)
180(.2)
220(.4)
100(.6)
812
456
660
364
148
+150(.6)
710.73
+30(.4)
+100(.6)
403.82
+50(.4)
-550
NPV=96.12
-250
NPV=117.00
-150
0
*450
331
or
NPV=444.55
NPV=888.18
NPV=550.00
NPV=184.55
Turboprop
Piston

Flexibility & Real Options
Decision Trees - Diagram of sequential decisions and possible outcomes.
Decision trees help companies determine their Options by showing the various choices and outcomes.
The Option to avoid a loss or produce extra profit has value.
The ability to create an Option thus has value that can be bought or sold.

Corporate Real Options
1. Option to expand (make follow up investment)
2. Option to abandon3. Timing option (wait and invest later)
4. Flexible production facilities
Value = NPV with option - NPV w/o option
Value = Black Scholes approach
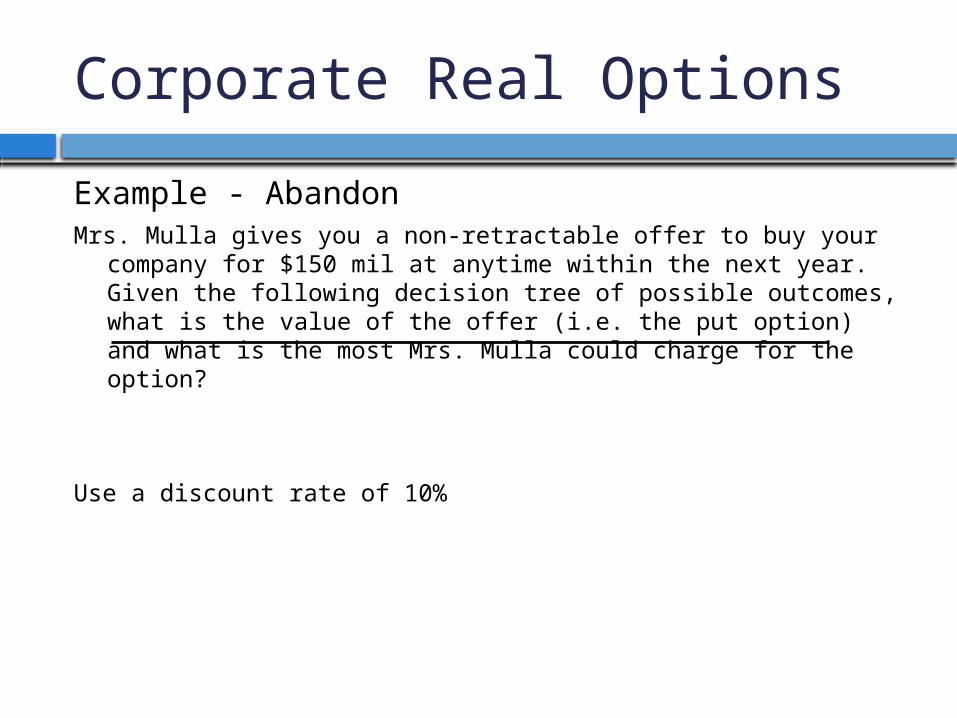
Corporate Real Options
Example - AbandonMrs. Mulla gives you a non-retractable offer to buy your company for
$150 mil at anytime within the next year. Given the following decision tree of possible outcomes, what is the value of the offer (i.e. the put option) and what is the most Mrs. Mulla could charge for the option?
Use a discount rate of 10%

Corporate Real Options
Example - AbandonMrs. Mulla gives you a non-retractable offer to buy your company for
$150 mil at anytime within the next year. Given the following decision tree of possible outcomes, what is the value of the offer (i.e. the put option) and what is the most Mrs. Mulla could charge for the option?
Year 0 Year 1 Year 2
120 (.6) 100 (.6) 90 (.4)NPV = 145 70 (.6) 50 (.4)
40 (.4)

Corporate Real Options
Example - AbandonMrs. Mulla gives you a non-retractable offer to buy your company for
$150 mil at anytime within the next year. Given the following decision tree of possible outcomes, what is the value of the offer (i.e. the put option) and what is the most Mrs. Mulla could charge for the option?
Year 0 Year 1 Year 2
120 (.6) 100 (.6) 90 (.4)NPV = 162 150 (.4) Option Value =
162 - 145 =$17 mil

Corporate Real Options
Reality
• Decision trees for valuing “real options” in a corporate setting can not be practically done by hand.
• We must introduce binomial theory & B-S models


