* Corresponding author. Tel.: 1 215 898 7781; fax: #1 215 573 2054; e-mail: holthausen@ wharton.upenn.edu. 1 The financial support of Nomura Securities and Ernst & Young LLP is gratefully acknow- ledged. We appreciate the able research assistance of Dan Nunn. We acknowledge the helpful comments of Abbie Smith (the referee), Kevin Murphy, and workshop participants at Columbia University, the University of California — Los Angeles, the University of Colorado — Boulder, Harvard University, George Washington University, Massachusetts Institute of Technology, New York University, Stanford University, and Temple University. Journal of Financial Economics 51 (1999) 371— 406 Corporate governance, chief executive officer compensation, and firm performance1 John E. Core, Robert W. Holthausen*, David F. Larcker 2400 Steinberg-Dietrich Hall, The Wharton School, University of Pennsylvania, Philadelphia, PA, 19104-6365, USA Received 19 March 1997; received in revised form 1 July 1998 Abstract We find that measures of board and ownership structure explain a significant amount of cross-sectional variation in CEO compensation, after controlling for standard eco- nomic determinants of pay. Moreover, the signs of the coefficients on the board and ownership structure variables suggest that CEOs earn greater compensation when governance structures are less effective. We also find that the predicted component of compensation arising from these characteristics of board and ownership structure has a statistically significant negative relation with subsequent firm operating and stock return performance. Overall, our results suggest that firms with weaker governance structures have greater agency problems; that CEOs at firms with greater agency problems receive greater compensation; and that firms with greater agency problems perform worse. ( 1999 Elsevier Science S.A. All rights reserved. JEL classification: G30; G32; J33; L22 Keywords: Corporate governance; CEO compensation; Board-of-directors; Ownership structure; Financial performance 0304-405X/99/$ — see front matter ( 1999 Elsevier Science S.A. All rights reserved PII: S 0 3 0 4 - 4 0 5 X ( 9 8 ) 0 0 0 5 8 - 0
1The financial support of Nomura Securities and Ernst & Young LLP is gratefully acknow-ledged. We appreciate the able research assistance of Dan Nunn. We acknowledge the helpfulcomments of Abbie Smith (the referee), Kevin Murphy, and workshop participants at ColumbiaUniversity, the University of California — Los Angeles, the University of Colorado — Boulder,Harvard University, George Washington University, Massachusetts Institute of Technology, NewYork University, Stanford University, and Temple University.
Journal of Financial Economics 51 (1999) 371—406
Corporate governance, chief executive officercompensation, and firm performance1
John E. Core, Robert W. Holthausen*, David F. Larcker2400 Steinberg-Dietrich Hall, The Wharton School, University of Pennsylvania, Philadelphia, PA,
19104-6365, USA
Received 19 March 1997; received in revised form 1 July 1998
Abstract
We find that measures of board and ownership structure explain a significant amountof cross-sectional variation in CEO compensation, after controlling for standard eco-nomic determinants of pay. Moreover, the signs of the coefficients on the board andownership structure variables suggest that CEOs earn greater compensation whengovernance structures are less effective. We also find that the predicted component ofcompensation arising from these characteristics of board and ownership structure hasa statistically significant negative relation with subsequent firm operating and stockreturn performance. Overall, our results suggest that firms with weaker governancestructures have greater agency problems; that CEOs at firms with greater agencyproblems receive greater compensation; and that firms with greater agency problemsperform worse. ( 1999 Elsevier Science S.A. All rights reserved.
JEL classification: G30; G32; J33; L22
Keywords: Corporate governance; CEO compensation; Board-of-directors; Ownershipstructure; Financial performance
0304-405X/99/$— see front matter ( 1999 Elsevier Science S.A. All rights reservedPII: S 0 3 0 4 - 4 0 5 X ( 9 8 ) 0 0 0 5 8 - 0
1. Introduction
The level of compensation and the extent of pay-for-performance for chiefexecutive officers (CEOs) has been a topic of considerable controversy in theacademic and business communities. Critics of CEO compensation practicesargue that because the board of directors is influenced by the CEO, the boarddoes not structure the CEO’s compensation package to maximize value foroutside shareholders. The purpose of this paper is to examine whether there isan association between the level of CEO compensation and the quality of firms’corporate governance, and whether firms with weaker governance structureshave poorer future performance.
We find that both board-of-director characteristics and ownership structurehave a substantive cross-sectional association with the level of CEO compensa-tion, after controlling for standard economic determinants of the level of CEOcompensation (e.g., proxies for the firm’s demand for a high-quality CEO,contemporaneous firm performance, and firm risk). In particular, with respect tothe board-of-director variables, we find that CEO compensation is higher whenthe CEO is also the board chair, the board is larger, there is a greater percentageof the board composed of outside directors, and the outside directors areappointed by the CEO or are considered ‘gray’ directors. CEO compensation isalso higher when outside directors are older and serve on more than threeother boards. With respect to ownership variables, we find that CEO compensa-tion is a decreasing function of the CEO’s ownership stake and the existenceof an external blockholder who owns at least 5% of the equity. Although wefind no association between the percentage ownership per outside director andCEO compensation, we find that the existence of a non-CEO internal boardmember who owns at least 5% of the shares is associated with lower CEOcompensation.
Given these results, the variation in pay explained by the board and owner-ship structure variables represents either: (1) an indication that we inadequatelyspecified a model for the equilibrium wage of the CEO (exclusive of the boardand ownership structure variables), or (2) an outcome due to the existence ofunresolved agency problems. In order to distinguish between these alternativeexplanations, we examine whether the predicted component of compensationarising from the board and ownership structure variables is correlated withfuture period firm operating and stock market performance. We find consistentevidence of a negative relation between the compensation predicted by theboard and ownership structure variables and subsequent performance. Thisfinding suggests that the weightings of the board and ownership variables in thecompensation equation are related to the effectiveness of the firm’s governancestructure, rather than these variables proxying for the determinants of theCEO’s equilibrium wage. As such, our results suggest that firms with weakergovernance structures have greater agency problems; that CEOs at firms with
372 J.E. Core et al./Journal of Financial Economics 51 (1999) 371—406
greater agency problems extract greater compensation; and that firms withgreater agency problems perform worse.
The remainder of this paper is organized into six sections. In Section 2, wereview the prior empirical literature on board and ownership structure, CEOcompensation, and firm performance. The sample is described and variables aredefined in Section 3. In Section 4, we document the association between thelevel of compensation and the board and ownership structure variables. Theassociation between subsequent performance and the predicted component ofcompensation arising from the board and ownership structure is presented inSection 5. Section 6 contains sensitivity tests to determine the robustness of theresults to alternative specifications. A summary and conclusion is provided inSection 7.
2. Literature review
The academic literature on corporate governance examines the efficacy ofalternative ownership structures and alternative structures for the board ofdirectors. While there is mounting evidence of the failure of certain governancestructures to motivate managers to increase firm performance, the empiricalevidence to date is mixed and gives little coherent evidence for the shape of anoptimal governance structure.
There is a growing literature suggesting that U.S. boards of directors areineffective. For example, Jensen (1993) argues that boards of directors areineffective because board culture discourages conflict, the CEO determines theagenda and information given the board, there is little equity ownership bymanagers and nonmanagers on the typical board, boards are too large, and theCEO and the board chair are frequently the same person. Crystal (1991) arguesthat boards of directors are ineffective in setting appropriate levels of compensa-tion because outside directors are essentially hired by the CEO and can beremoved by the CEO. As such, board members may be unwilling to takepositions adversarial to the CEO, especially concerning the CEO’s compensa-tion. Moreover, boards usually rely on the compensation consultants hired bythe CEO, and this may lead to compensation contracts that have been opti-mized not for the firm, but for the CEO.
The relation between top executive compensation and board composition hasbeen examined in many prior empirical papers, with mixed findings. Forexample, Lambert et al. (1993) and Boyd (1994) document a positive relationbetween CEO compensation and the percentage of the board composed ofoutside directors, whereas Finkelstein and Hambrick (1989) find that compensa-tion is unrelated to the percentage of outside directors on the board. Othercharacteristics of the board have also been explored. Hallock (1997) finds that
J.E. Core et al./Journal of Financial Economics 51 (1999) 371—406 373
CEO compensation is higher at firms with interlocked outside directors.Lambert et al. (1993) find that CEOs receive higher pay when they haveappointed a greater proportion of the board.
Other empirical research examines whether certain board structuresare associated with better firm value and performance. For example, Rosensteinand Wyatt (1990) provide evidence that shareholder wealth is affectedby the proportion of outside directors by documenting a positive stock pricereaction at the announcement of the appointment of an additional outsidedirector. Byrd and Hickman (1992) find that bidding firms on which indepen-dent outside directors hold at least 50% of the seats have higher announce-ment-date abnormal returns than other bidders, except when the independentdirectors hold a very high proportion of board seats. In contrast, Yermack(1996) finds no association between the percentage of outside directors and firmperformance. Thus, the evidence for the importance of outside directors ismixed. Yermack (1996) also provides evidence that firm value and performanceis a decreasing function of board size, while Baysinger and Butler (1985),Hermalin and Weisbach (1991), and Bhagat and Black (1997) find no meaningfulrelation between various characteristics of board composition and firmperformance.
In contrast to the analysis of board structure, there have been relatively fewstudies of the relation between ownership structure and the level of CEOcompensation. Holderness and Sheehan (1988) provide evidence that managerswho are majority shareholders (defined as individuals owning at least half butnot all of the common stock) in publicly held corporations receive marginallyhigher salaries than other officers. However, Allen (1981) finds that the level ofCEO compensation is a decreasing function of the equity held by the CEO (andhis family), as well as the extent of equity holdings by board members not relatedto the CEO. Lambert et al. (1993) find that CEO compensation is lower whenthe CEO’s ownership is higher and when there is an internal member onthe board other than the CEO who owns at least 5% of the shares. Finally,using a sample of Canadian companies (30% of which have multiple classesof voting stock), Core (1997) finds that CEO compensation is increasingin insider control of share votes and decreasing in insider ownership of sharevalue.
Other studies have examined the association between ownership structureand firm performance and value. Morck et al. (1988) demonstrate that firm valuefirst rises with increases in inside ownership as the incentive alignment effect ofshare value dominates, then falls as the entrenchment effect of insider votingcontrol becomes stronger. Shivdasani (1993) finds that hostile takeovers aremore likely when target outside directors own less equity and serve on fewerboards, and when there are unaffiliated outside blockholders. Holthausen andLarcker (1996) indicate that performance subsequent to the initial publicoffering of a previous leveraged buyout is positively associated with the change
374 J.E. Core et al./Journal of Financial Economics 51 (1999) 371—406
in the equity stake of both the significant non-management investors and theoperating management of the firm. Yermack (1996) finds that firm value issignificantly higher when officers and directors have greater ownership,although this ownership variable has an ambiguous relation with contempor-aneous measures of accounting operating performance.
Overall, the impact of board and ownership structure on executive pay andfirm performance is unclear given the mixed nature of the empirical results.In order to extend this literature, we examine the association between executivepay and a comprehensive set of board and ownership structure variables.Measuring the effectiveness of the governance system is difficult, and exam-ination of just a few characteristics in isolation ignores the fact that othercharacteristics not measured may serve as complements or substitutes.More importantly, we estimate the association between subsequent firmperformance and the predicted component of compensation arising from theboard and ownership structure variables in order to validate our interpretationof the results of the compensation equation as a manifestation of an agencyproblem, as opposed to the more benign interpretation that the corporategovernance variables are actually proxies for the quality of CEO demanded byfirms.
3. Methodological approach, sample, and variable descriptions
3.1. Methodological approach
The null hypothesis of this paper is that observed board and ownershipstructures induce optimal CEO contracting and firm performance. Under thisnull hypothesis, the shareholders choose a CEO compensation contract, whichspecifies the level of compensation as a function of performance, in order tomaximize firm value conditional on the firm’s information environment and itsdemand for a high-quality CEO. Both the firm’s governance structure and theCEO’s compensation contract are choice variables that result from maximizingfirm value given the firm’s operating and information environment and thereservation wage for a CEO of a given quality. Assuming that observed boardand ownership structures induce optimal CEO contracting, the economic deter-minants of the level of compensation (such as the size of the organization,contemporaneous firm performance, firm risk, and firm investment opportunityset) should completely describe the cross-sectional variation in the equilibriumlevel of CEO compensation. Under the null hypothesis, and assuming a properlyspecified model for the level of CEO compensation, only those variables thatdetermine the firm’s demand for a CEO of a given quality should have explana-tory power. That is, no board structure or ownership variables would be
J.E. Core et al./Journal of Financial Economics 51 (1999) 371—406 375
2Following most prior empirical research in this area, we treat the board and ownershipstructures as exogenous, when economic theory would argue that these variables are endogenous. Inaddition, theory would suggest that board and ownership structure are simultaneously determinedwith compensation. To the extent that this is true in practice, our inferences may be affected bya simultaneous equations bias if the determinants of board and ownership structure are differentfrom those for compensation.
significant in such a model, because these variables are simply noisy measures ofthe same variables that determine CEO compensation.2
We use CEO compensation as a metric for assessing the effectiveness ofcorporate governance because it is a frequent and observable board decision,and has been the subject of much of the debate regarding the effectiveness ofboards of directors. Given the amount of information available to the board oncorporate strategy, CEO characteristics and levels of CEO compensation, struc-turing an optimal CEO pay package should be a relatively straightforwarddecision for an effective board.
The first test of our null hypothesis is based on including a set of board andownership structure variables in the compensation regression, along with thehypothesized economic determinants of compensation. If the board and owner-ship structure variables are statistically significant, they provide evidence thateither: (1) the CEO compensation model is misspecified, in that our selectedeconomic determinants do not adequately capture the equilibrium level of CEOcompensation and that the board and ownership structure variables proxy forthe underlying economic determinants; or (2) the null hypothesis should berejected in favor of the alternative hypothesis that certain board and ownershipstructures are conducive to CEO entrenchment. Under the alternative hypothe-sis, the board and ownership variables proxy for the effectiveness of the firm’sgovernance structure in controlling agency problems.
One potential problem inherent in our first test of the null hypothesis is that ifthe CEO compensation model is misspecified, the board and ownership struc-ture variables, rather than proxying for the effectiveness of the governancestructure, could proxy for CEO quality, the complexity of the CEO’s position, orthe potential tradeoff the firm faces in monitoring the CEO versus providingperformance incentives to the CEO. This problem can arise because of thefunctional form of our CEO compensation model, omitted economic determi-nants in our compensation model, or measurement error in the variables whichproxy for the economic determinants. For example, if the CEO is also the boardchair, this may indicate that the CEO’s position is more complex, thus requiringgreater compensation. Alternatively, if monitoring is difficult, the firm couldchoose a riskier pay package to motivate the manager, and risk-averse managerswill require higher levels of compensation when they are paid via more riskycompensation packages. Thus, if the board and ownership structure variables
376 J.E. Core et al./Journal of Financial Economics 51 (1999) 371—406
3Mehran (1995) finds that mix of pay is negatively correlated with CEO ownership and theexistence of an outside blockholder and positively correlated with the percentage of the board thatare outside directors, which is similar to our subsequent results. He interprets these results asevidence that boards with more outside directors use greater mix of pay when monitoring is moredifficult and other incentives are not already in place through stock ownership.
proxy for monitoring effectiveness and the use of more risky pay packages, theircoefficients will show greater compensation because managers are risk averse(Mehran, 1995).3
In order to address this issue, we conduct a second test to provide evidence forthe validity of our interpretation that the observed associations between thelevel of compensation and the board and ownership structure variables areproxies for the effectiveness of the governance structure. Specifically, a secondregression between subsequent performance (the dependent variable) and pre-dicted excess compensation (the predicted component of compensation arisingfrom the board and ownership structure variables) and other control variables isestimated. This regression, which is described in detail in Section 5, allows us todistinguish among the competing explanations for the estimated coefficientsobtained on the board and ownership structure variables in the compensationequation.
3.2. Sample
The sample consists of 495 observations over a three-year period for 205publicly traded U.S. firms. Our sample is composed of large firms operating ina variety of different industries: the median firm in our sample has corporatesales (expressed in 1984 dollars) of $3101 million, and the sample includes 14different two-digit standard industrial classification (SIC) codes, with someconcentration in the food, chemical, and electrical industries. We only includeobservations for the 14 industries that have at least ten observations withcomplete data so that we can generate reasonable estimates for the industry-indicator variables in the regression models described below. These 14 industriescomprise 85% of our original sample.
The compensation data were obtained from a major compensation consultingfirm. These data were originally collected using a mail survey (with follow-up bytelephone to check response accuracy) during mid-year 1982, 1983, and 1984. Inthis study, we use survey compensation data for the corporate chief executiveofficer (CEO). There are several advantages associated with this data set. Thefirst advantage is that the data set pre-dates the controversy over corporategovernance, thereby providing a sample that is unaffected by recent shareholderactivism, and thus providing potentially more powerful tests of the importanceof governance structures. Second, we have available a long time series of
J.E. Core et al./Journal of Financial Economics 51 (1999) 371—406 377
4Simulation results (e.g., Lambert et al., 1991; McConnell, 1993) suggest that more sophisticatedoption pricing models (based on the Black-Scholes or binomial formulas) typically produce values inthis range. In addition, even if we used a potentially more sophisticated method for pricing theoptions, we would still have no comparable analytical model for valuing accounting-based long-term incentive plans (performance plans).
5 In our valuation, we are assuming that firms set performance targets equal to expectedperformance. In other words, if a performance share plan will pay out one share of stock if targetperformance is met, we assume that the expected value of this plan is the share price on the date ofgrant. This assumption is consistent with the institutional procedures by which incentive targetsseem to be set (Holthausen et al., 1995). Merchant and Manzoni (1989) provide some field studyevidence that supports this assumption for the annual bonus.
subsequent performance for these sample firms. Finally, this survey data providedetailed information on the annual bonus and the individual grants and anticip-ated target payments for all long-term components of compensation. Thus, wehave more detailed information on CEO compensation than was available inproxy statement disclosures during the 1980s, and this detail allows us to movebeyond the more typical analysis of salary and cash compensation used in mostprior research.
3.3. Measurement of the level of CEO compensation
The empirical analysis of CEO compensation is based on three differentmeasures of compensation: total compensation, cash compensation, and salary.Cash compensation is the sum of salary and annual bonus, whereas salarysimply measures the component of compensation that is fixed (or noncontin-gent) at the beginning of the year. Total compensation is the sum of salary,annual bonus, and our valuations for stock options, performance plans, phan-tom stock, and restricted stock. For example, 1984 total compensation consistsof the individual’s salary for 1984 (set at the beginning of 1984), the annualbonus paid in 1984 for performance in 1983, and long-term grants awardedthrough the beginning of 1984. Since the salary and bonus are typically paidduring a single year, the valuation of these two components is straightforward.However, the valuation of the long-term components is more problematic.Stock options are valued at 25% of their exercise price.4 Grants of restrictedstock are valued according to the price per share at the date of grant. Phantomstock grants are valued in the same way as restricted stock plans. Grants ofperformance shares are valued by multiplying the number of performance sharesby the stock price at the grant date. Grants of performance units are valuedaccording to the dollar value assigned to each unit at the grant date.5
Our choice of valuations for the components of long-term compensation maylimit the interpretation of our results. The amount of compensation that willultimately be received from long-term compensation plans is uncertain at the
378 J.E. Core et al./Journal of Financial Economics 51 (1999) 371—406
6Based on our null hypothesis that the firm will not in equilibrium reward unnecessary humancapital investment by the CEO, we concentrate on identifying proxies for the firm’s demand fora high-quality CEO. Prior empirical research has demonstrated that variables such as educationlevel, firm tenure and job tenure (proxies for human capital investment) have little explanatorypower for CEO compensation.
time the compensation is awarded, although firms make grants with the inten-tion of delivering a target amount of compensation for a target level of perfor-mance. However, as demonstrated below, our results are very similar regardlessof whether we use total compensation, cash compensation or salary, whichsuggests that the exact valuation procedure used for the long-term componentsdoes not induce our results.
Table 1 presents descriptive statistics (after pooling the observations acrossthe three survey years) for the three compensation components and theirhypothesized determinants. Compensation and sales have been transformedinto 1984 dollars using the relevant consumer price index. These CEOs’ mediancash compensation is equal to $578,205 and the median total compensation isequal to $800,000.
3.4. Economic determinants of the level of CEO compensation
Consistent with prior theory and empirical work (Rosen, 1982 and Smith andWatts, 1992), we expect that larger firms with greater growth opportunities andmore complex operations will demand higher-quality managers with higherequilibrium wages. We proxy for firm size and complexity with firm sales. Weproxy for the firm’s investment opportunity set with the firm’s year-end market-to-book ratio averaged over the previous five years. Finally, we include fourteenindustry-indicator variables as controls for industry differences in the demandfor managerial talent.6
The results of standard agency models suggest that the level of pay is anincreasing function of firm performance. Firm performance is measured usingthe accounting return on assets (computed as the ratio of earnings beforeinterest and taxes to total assets) and the annual stock market return on thecommon stock. Firm risk, both as a measure of the firm’s information environ-ment and the risk of its operating environment, is also a potentially importantdeterminant of the level of CEO compensation. Consistent with other empiricalresearch on compensation (e.g., Smith and Watts, 1992; Core, 1997), we includemeasures of firm risk as control variables for the level of compensation. Theoret-ical models (e.g., Banker and Datar, 1989) suggest that compensation risk (andthe level of expected compensation) may either increase or decrease with firmrisk. Cyert et al. (1997) find that CEO compensation is higher at firms withgreater stock return volatility. The relevant proxies for firm risk are total
J.E. Core et al./Journal of Financial Economics 51 (1999) 371—406 379
Table 1Descriptive statistics for CEO compensation and its hypothesized determinants
The sample consists of 495 annual observations of 205 firms between 1982 and 1984. The compensa-tion data were obtained from the confidential files of a major compensation consultant. Compensa-tion amounts and sales are expressed in 1984 dollars.
Panel A: CEO compensation
Total compensation is the sum of salary, annual bonus, and our valuations for stock options,performance plans, phantom stock, and restricted stock. For example, 1983 total compensationconsists of the individual’s salary for 1984 (set at the beginning of 1984), the annual bonus paid in1984 for performance in 1983, and the long-term grants awarded through the beginning of 1984.Cash compensation is the sum of salary and annual bonus.
Sales are for the year prior (i.e., 1983) to the year in which compensation is awarded (i.e., 1984).Investment opportunities are defined as the firm’s year-end market-to-book ratio averaged over thefive years ended the year prior to the year in which CEO compensation was paid. Return on assets isthe percentage corporate return on assets or the ratio of earnings before interest and taxes to totalassets for the prior year. Stock return is the percentage stock market return for the prior year. Thestandard deviation of ROA is the standard deviation of annual percentage corporate return onassets for the prior five years. The standard deviation of RET is the standard deviation of annualpercentage stock market return for the prior five years.
Mean Median Std Dev.
Sales (millions of dollars) $6,523 $3,101 $13,090Investment opportunities 1.365 1.170 0.674Return on assets (ROA) 10.654 10.587 7.101Stock return (RET) 18.881 14.886 37.819Standard deviation of ROA 3.129 2.530 2.411Standard deviation of RET 31.812 26.363 21.890
Panel C: Board composition
CEO is board chair is an indicator variable equal to one if the CEO is also chairman of the board,and zero otherwise. Board size is the total number of directors on the board. Inside directors is thepercentage of the board who are managers, retired managers, or are relatives of current managers.Outside directors appointed by CEO is the number of outside directors on the board appointed bythe CEO as a percentage of board size. Gray outside directors is the number of outside directors whoare gray (a director is gray if he or his employer received payments from the company in excess of hisboard pay) as a percentage of board size. Interlocked outside directors is the number of outsidedirectors who are interlocked (a director is interlocked if an inside officer of the firm serves on theboard of that outside director’s company) as a percentage of board size. Outside directors over age69 is the percentage of the outside directors who are over age 69. Busy outside directors is the
380 J.E. Core et al./Journal of Financial Economics 51 (1999) 371—406
Table 1. Continued.
percentage of outside directors who serve on three or more other boards (six or more for retiredoutside directors).
Mean Median Std Dev.
CEO is board chair (indicator variable) 0.756 1.000 0.430Board size 13 13 3Inside directors 32.897 31.250 13.371
(% of board size)Outside directors appointed by CEO 33.163 30.000 22.951
(% of board size)Gray outside directors 6.862 0.000 9.264
(% of board size)Interlocked outside directors 3.274 0.000 4.838
(% of board size)Outside directors over age 69 8.314 0.000 13.108
(% of outside directors)Busy outside directors 45.169 45.455 21.067
(% of outside directors)
Panel D: Ownership structure
CEO percentage stock ownership is the percentage of outstanding shares owned by the CEO.Non-CEO insider owns 5% is an indicator variable equal to one if the firm has an internal boardmember (other than the CEO) who owns at least 5% of the outstanding shares, and zero otherwise.Percentage stock ownership per outside director is the total percentage of outstanding shares ownedby outside directors divided by the number of outside directors. Outside blockholder owns 5% is anindicator variable equal to one if the firm has an external blockholder who owns at least 5% of theoutstanding shares, and zero otherwise.
Mean Median Std Dev.
CEO percentage stock ownership 1.523 0.086 6.104Non-CEO insider owns 5%
(indicator variable)0.125 0.000 0.331
Percentage stock ownership peroutside director
0.136 0.005 0.809
Outside blockholder owns 5%(indicator variable)
0.471 0.000 0.500
7 In the results reported in Section 4, we do not control for the mix of pay (compensation risk).While compensation might be expected to increase with compensation risk for a risk-aversemanager, there is also the possibility that higher levels of CEO pay, arising from ineffectivegovernance mechanisms, primarily manifest themselves in contingent compensation because it ismore difficult for shareholders to monitor long-term pay (especially given the proxy disclosures inthe 1980s). In Section 6, we demonstrate that our results are not substantively affected by includingpay mix in the model as an economic determinant.
variance measures, and we compute the standard deviation of return on assetsand the standard deviation of common stock returns over the prior five years.7
J.E. Core et al./Journal of Financial Economics 51 (1999) 371—406 381
Definitions and descriptive statistics for the variables used to measure sales,investment opportunities, firm performance, and firm risk are provided inTable 1. The data used to compute these variables were obtained from theCompustat files. Variables proxying for the economic determinants of compensa-tion were measured as of the end of the fiscal year during which compensationamounts were earned. For example, compensation data obtained from the 1984survey are matched with sales, investment opportunities, firm performance, andfirm risk data for the 1983 fiscal year, the period for which the bonus is earned.Moreover, we assume that salary level and expected long-term compensationfor 1984 is set with regard to observed performance in 1983 and firm character-istics as of the end of 1983.
3.5. Board of director and ownership variables
We proxy for the effectiveness of monitoring by the board of directors byusing eight measures that characterize the composition of the board. Forexample, activist shareholders have argued for the separation of the board chairand CEO, and a number of empirical studies suggest that agency problems arehigher when the CEO is also the board chair (e.g., Yermack, 1996). We define thedual Chair/CEO as an indicator variable, which is equal to one if the boardchair is also the CEO, and zero otherwise. The size of the board of directors isexpected to be associated with less effective board monitoring, based on theargument that larger boards are less effective and more susceptible to theinfluence of the CEO (Jensen, 1993; Yermack 1996).
Shareholder activists consistently urge that more of the board should consistof independent, outside directors. Pfeffer (1981) argues that internal boardmembers are more loyal to management, and thus the CEO can exert relativelymore influence over internal (as opposed to outside) board members. However,as discussed above, there is mixed evidence as to whether boards are moreeffective when they consist of fewer inside directors, and accordingly we make noprediction for the sign of the coefficient of this variable. We define inside directorsas the percentage of the total directors who are insiders (i.e., directors who aremanagers, retired managers, or family members of present or past management).
We expect that outside directors who have been appointed by the CEO, whoare ‘gray’, or who are interlocked are less independent of the CEO and lesseffective monitors. Outside directors are assumed to have been appointed by theCEO if they joined the board after the CEO took office. An outside director isdefined to be ‘gray’ if he or his employer received payments from the company inexcess of his board pay (as disclosed in the proxy statement). Examples of graydirectors are an attorney who is a partner in a law firm that provides services tothe firm, or the CEO of a company that sells products to the firm. We define anoutside director to be ‘interlocked’ if an inside director of the firm serves on theboard of that outside director’s firm. An interlocked director may be less
382 J.E. Core et al./Journal of Financial Economics 51 (1999) 371—406
independent because an insider has influence over the interlocked director’s ownboard. The proxy disclosure rules enacted by the Securities and ExchangeCommission in 1992 require disclosure of director interlocks, and the NationalAssociation of Corporate Directors (NACD, 1996) Blue Ribbon Commissionguidelines urge that firms avoid gray directors and interlocked directors. Wescale all three of these measures of the independence of the outside directors bythe total number of directors on the board.
Recent discussion suggests that outside directors may become less effective asthey grow older or serve on ‘too many’ boards. Reform advocates suggestmandatory retirement ages and urge term limits for directors (e.g., NACD, 1996).Since many company boards require mandatory retirement at age 70 for direc-tors, our measure for this variable is the percentage of the outside directors whoare 70 or older. Finally, some reform advocates suggest that many directors serveon too many boards to attend to their duties adequately. Consistent with recentNACD guidelines (1996), we define an outside director to be ‘busy’ if he serves onthree or more other corporate boards (six or more other boards if the director isretired). We measure busy outside directors as a percentage of outside directors.Other researchers such as Shivdasani (1993) have employed the average numberof additional directorships as a measure of director quality and found a negativeassociation with agency problems. By concentrating on an excess number ofdirectorships, we create a variable over the range where we expect that increases inthe number of directorships do not measure increases in director quality, butinstead measure reductions in the director’s ability to attend to his duties.
We employ four measures for the ownership structure of the firm. CEOownership is measured as the percentage of outstanding shares owned by thecorporate CEO and his immediate family. Second, similar to Allen (1981), wealso determine whether there exists a non-CEO internal board member (who isalso not a member of the CEO’s family) that owns at least 5% of the outstandingshares. In general, CEO entrenchment should be reduced if another internalboard member has substantial equity holdings in the firm. As measures foroutside ownership influences, we compute the percentage ownership per outsidedirector and the existence of an external party (or blockholder) that owns atleast 5% of the outstanding shares. We expect that CEO entrenchment isa decreasing function of the holdings of outside directors and the existence of anoutside party with substantial equity holdings in the firm (e.g., Allen, 1981; Tosiand Gomez-Mejia, 1989; Finkelstein and Hambrick, 1989).
The ownership and board-of-director variables were collected from the 1984proxy statements filed by the sample firms. These proxy statements provide dataon ownership structure and composition of the board of directors as of the endof 1983 (or the middle of the survey time period). The descriptive statistics forthese variables are presented in Table 1. The CEO is also board chair in about76% of the companies. The average board consists of 13 directors, of whichapproximately 33% are insiders, 7% are gray, and 3% are interlocked. That
J.E. Core et al./Journal of Financial Economics 51 (1999) 371—406 383
8The regression analysis makes several important assumptions. First, the regression coefficientsare assumed to be the same across firms and over time. However, we partially control for potentialindustry and time period differences by incorporating indicator variables to capture mean shifts forthe dependent variable. In addition, the error terms are assumed to be independent. Since we haveapproximately two observations per firm, it is conceivable that our t-statistics are overstated.Section 6 indicates that our results are not sensitive to the independence issue.
approximately 40% of the directors are either inside or gray implies that theremaining 60% of the directors are ‘independent’, which is consistent withShivdasani (1993) and Bhagat and Black (1997). Consistent with Wade et al.(1990), outside directors appointed by the CEO comprise 33% of the averageboard. We find that on average 8% of the outside directors are age 70 or olderand 45% are busy.
Consistent with prior work, we find that the distribution of stock ownershipby the CEO is skewed, with the mean (median) CEO owning approximately1.5% (0.09%) of the outstanding equity. The percentage ownership per outsidedirector has a mean (median) of approximately 0.136% (0.005%) of the out-standing equity. This translates into stock ownership (in 1984 dollars) by themean (median) outside director of approximately $1.8 million ($57,545), whichfor the median director is approximately three years of directors’ fees. Finally,47.1% of the firms have an external party and 12.5% have an internal boardmember (other than the CEO) that owns at least 5% of the outstanding stock.The correlations between the board and ownership structure variables aregenerally small in absolute value, with the largest correlation equal to 0.31(between whether the CEO is also board chair and the number of outsidedirectors the CEO has appointed).
4. Results – the level of CEO compensation
The association between the level of CEO compensation and the firm’sdemand for a high-quality CEO, prior firm performance, firm risk, and theboard and ownership structure, is examined using a cross-sectional multipleregression. The regression equation includes as a dependent variable one ofthe three measures of CEO compensation (either total compensation, cashcompensation or salary) and includes as independent variables the variablesdefined in Table 1 as proxies for the economic determinants of CEO compensa-tion, the board structure variables, and the ownership structure variables. Theregression model also contains two indicator variables that control for the yearin which compensation was paid and fourteen indicator variables that controlfor (two-digit) industry membership.8
The regressions of CEO pay on its economic determinants, industry and yearcontrols, and board and ownership structure are presented in Table 2. The
384 J.E. Core et al./Journal of Financial Economics 51 (1999) 371—406
9 It is important to realize that the long-term components of compensation are valued using theexpected payoffs from various awards at the time they are granted. As valued, these components donot have a mechanical correlation with stock market performance.
10 In order to consider potential nonlinearities, we also estimated regression models for totalcompensation with spline variables measuring percentages of inside directors greater than either theaverage (33%) or greater than the 3rd quartile (42%). The main effect on the proportion of insidedirectors remained significantly negative but the coefficients on the spline variables were notsignificant. Thus, for this sample, there is no evidence that even a large percentage of inside directorsresults in increased CEO pay.
11Our use of the terminology ‘1%’ in Section 4 refers to a 1% change in the variable (e.g., 30% to31%). This terminology is not meant to imply a percentage change in the variable. The coefficientson the variables that are expressed as percentages (of either board size or outside directors) appearsmall relative to median total CEO compensation of $800,000. However, for a variable defined asa percentage of board size (percentage of outside directors), a change in the classification of onedirector results in a 7.7% (11.1%) change in the variable for the median board. Thus, if one wantedto estimate the predicted effect on CEO compensation of a change in the classification of onedirector for the median board associated with one of these variables which are stated as a percentageof board size or outside directors, the reported coefficient for these variables should be multiplied by7.7 or 11.1 in order to make comparable statements about the compensation effects of a change inboard structure.
dependent variable in the first column is based on total compensation, whereas thedependent variables in the second and third columns are cash compensation andsalary, respectively. The coefficients for the year and industry-indicator variables arenot reported in the tables as they are not of direct interest for this study.
The regression results presented in the first column of Table 2 demonstratethat the level of total CEO compensation is cross sectionally related to firm size,investment opportunities, prior performance, and firm risk. Larger firms andfirms with higher investment opportunities (as proxied by the market-to-bookratio) pay higher CEO compensation, which we interpret as reflecting theirdemand for higher-quality managerial talent. The coefficient on return on assets(ROA) is not significant, whereas the coefficient on the stock return variable(RET) exhibits a positive and significant association with compensation.9 Thecoefficients for the two risk proxies, the standard deviation of ROA and RET,are negative, and the standard deviation for ROA is statistically significant.
The eight variables related to the structure of the board of directors aregenerally significant at conventional levels. The significant coefficient on theindicator variable for dual CEO/Board chair indicates that a CEO who alsoserves as board chair receives additional compensation of $152,577. Board size issignificantly positive, and implies that a one member increase in the size of theboard is associated with a $30,601 increase in total CEO compensation. Contraryto many recent governance prescriptions, total compensation has a significantnegative association with the percentage of inside directors on the board.10 Themagnitude of this coefficient suggests that a 1% increase in the percentage of theboard which is internal translates into a $5639 decrease in CEO compensation.11
J.E. Core et al./Journal of Financial Economics 51 (1999) 371—406 385
Table 2Regressions of CEO compensation on its economic determinants, industry and year controls, andboard and ownership structure variables
The sample consists of 495 annual observations on 205 firms between 1982 and 1984. Thecompensation data were obtained from the confidential files of a major compensation consultant.Total compensation is the sum of salary, annual bonus, and our valuations for stock options,performance plans, phantom stock, and restricted stock. Cash compensation is the sum of salary andannual bonus. Economic determinants: Sales are for the year prior (i.e., 1983) to the year in whichcompensation is awarded (i.e., 1984). Investment opportunities are defined as the firm’s year-endmarket-to-book ratio averaged over the five years ended the year prior to the year in which CEOcompensation was paid. Return on assets is the percentage corporate return on assets or the ratio ofearnings before interest and taxes to total assets for the prior year. Stock return is the percentagestock market return for the prior year. The standard deviation of ROA is the standard deviation ofannual percentage corporate return on assets for the prior five years. The standard deviation of RETis the standard deviation of annual percentage stock market return for the prior five years. BoardStructure: CEO is board chair is an indicator variable equal to one if the CEO is also chairman of theboard, and zero otherwise. Board size is the total number of directors on the board. Inside directorsis the percentage of the board who are managers, retired managers, or are relatives of currentmanagers. Outside directors appointed by CEO is the number of outside directors on the boardappointed by the CEO as a percentage of board size. Gray outside directors is the number of outsidedirectors who are gray (a director is gray if he or his employer received payments from the companyin excess of his board pay) as a percentage of board size. Interlocked outside directors is the numberof outside directors who are interlocked (a director is interlocked if an inside officer of the firm serveson the board of that outside director’s company) as a percentage of board size. Outside directorsover age 69 is the percentage of the outside directors who are over age 69. Busy outside directors isthe percentage of outside directors who serve on three or more other boards (six or morefor retired outside directors). Ownership Structure: CEO percentage stock ownership is thepercentage of outstanding shares owned by the CEO. Non-CEO insider owns 5% is an indicatorvariable equal to one if the firm has an internal board member (other than the CEO) whoowns at least 5% of the outstanding shares, and zero otherwise. Percentage stock ownershipper outside director is the total percentage of outstanding shares owned by outside directorsdivided by the number of outside directors. Outside blockholder owns 5% is an indicatorvariable equal to one if the firm has an external blockholder who owns at least 5% of theoutstanding shares, and zero otherwise. t-statistics (in parentheses) are based on OLS standarderrors.
Incremental Adj-R2 from board andownership structure variables
14.6% 12.9% 13.3%
F 10.13 14.40 12.05
J.E. Core et al./Journal of Financial Economics 51 (1999) 371—406 387
Each of the three variables that measure the lack of independence of theoutside directors (outside directors appointed by the CEO, gray outside direc-tors, and interlocked outside directors) has a positive coefficient, implying thatless independent outside directors are associated with greater CEO compensa-tion. The significant coefficients on outside directors appointed by the CEO andgray outside directors indicate that a 1% increase in the variable leads toa $4137 and $7356 increase in CEO compensation, respectively. These resultsare similar to the conclusions of Wade et al. (1990) concerning the ability of theCEO to influence compensation decisions through his ability to influenceoutside directors. The lack of significance of the coefficient on interlockedoutside directors is consistent with the findings of Hallock (1997) on CEO totalcompensation.
Finally, each of the two variables that proxy for outside director effectiveness,the percentage of outside directors who are over age 69 and the percentage ofoutside directors who are ‘busy’, has a significantly positive coefficient, witha 1% increase in the variable leading to a $4136 and $2016 increase in CEOcompensation, respectively. These results are consistent with the reform advo-cates’ arguments for mandatory retirement ages or term limits, and with theargument that directors are less effective when they serve on too many otherboards.
Taken together, the signs of the coefficients on CEO duality, board size, grayoutside directors, interlocked outside directors, outside directors appointed bythe CEO, outside directors over age 69, and busy outside directors are consistentwith the interpretation that when corporate governance is weak, the CEO is ableto extract additional compensation from the firm. The negative coefficient onthe percentage of inside directors is consistent with the mixed empirical evidenceon the monitoring value of additional outside directors, and provides nosupport for the common contention that outside directors are better monitors ofmanagement than internal directors.
The four variables capturing ownership structure are also generally statist-ically significant at conventional levels. Consistent with Allen (1981) and Cyertet al. (1997), CEO equity ownership and the presence of another executive on theboard who owns at least 5% of the outstanding equity each have significantlynegative coefficients. A 1% increase in CEO equity ownership translates intoa $8027 reduction in CEO compensation, and while this is statistically signifi-cant, its economic significance is minor. The presence of another executive onthe board who owns at least 5% of the outstanding equity is associated witha $142,389 reduction in CEO compensation. Similar to Finkelstein andHambrick (1989), there is an insignificant association between CEO compensa-tion and the percentage ownership per outside director. Finally, there is a signifi-cantly negative association between the existence of an external party orblockholder that owns at least 5% of the outstanding shares and CEOcompensation. The point estimate indicates that the presence of this external
388 J.E. Core et al./Journal of Financial Economics 51 (1999) 371—406
blockholder leads to a decline of $86,100 in total compensation. Consideredtogether, the signs of the coefficients on the ownership structure variables arealso consistent with the interpretation that less effective governance structuresare associated with increases in CEO compensation.
In terms of explanatory power, the regression model in the first column ofTable 2 indicates that total CEO compensation has a significant associationwith the firm’s demand for a high-quality CEO, prior performance, risk, and thestructure of the board of directors and share ownership (adjusted-R2"37.2%,F"9.85, p(0.001). Estimating the regression without the board structure andownership variables provides insight into the incremental explanatory power ofthese variables. Including the board and ownership structure variables increasesthe adjusted-R2 of the regression from 22.6% to 37.2%. The incremental R2 of14.6% yields an F-statistic of 10.13 (p(0.001), which indicates that the boardstructure and ownership variables collectively add significant explanatorypower to the model for CEO total compensation. Combined with the fact thatthe board and ownership structure variables generally have signs consistentwith an interpretation of CEO entrenchment, the observation that these vari-ables collectively add a significant amount of explanatory power to the modelfor CEO compensation provides evidence against our null hypothesis of effec-tive governance.
As consistency checks on our total compensation results, we also use cashcompensation and base salary as measures of compensation in regressionmodels in Table 2. The second column of Table 2 presents the results when cashcompensation (salary plus cash bonus) is used as the dependent variable. Theseresults are virtually identical to those using total compensation, with theexceptions that the variable measuring the presence of a non-CEO insider whoowns at least 5% of the equity loses significance, and that the variable measuringthe percentage ownership per outside director changes sign, but remainsinsignificant. As expected, the magnitudes of the coefficients are smallerin absolute value because cash compensation is smaller than total compen-sation. The adjusted-R2 of this regression is 62.1%, the incremental adjusted-R2
from including the board and ownership variables is 12.9%, and the testfor the significance of the incremental R2 yields an F-statistic of 14.40(p(0.001).
The third column of Table 2 presents the results when salary is usedas the dependent variable. The coefficient on return on assets changes signand becomes negative. Relative to the regression of cash compensation,we observe that the variable inside directors loses significance, the variablegray outside directors changes sign and becomes insignificant, and thevariable indicating the presence of a non-CEO insider who owns at least 5%of the equity changes sign, but remains insignificant. The adjusted-R2 of theregression is 52.6%, the incremental adjusted-R2 from including the board andownership structure variables is 13.3%, and the F-statistic for the incremental
J.E. Core et al./Journal of Financial Economics 51 (1999) 371—406 389
12The similarity of results across the three regressions in Table 3 is not surprising given the highand significant cross-sectional correlations among the dependent variables (p(0.001 for all).Specifically, total compensation has a correlation of 0.59 with salary and 0.73 with cash compensa-tion, and cash compensation has a 0.81 correlation with salary.
R2 associated with the board and ownership structure variables is 12.05(p(0.001).12
5. Excess CEO compensation and subsequent firm performance
One interpretation of the results in Section 4 is that certain board andownership structures enable managers to exercise influence over the board andextract rents from the firm, including compensation in excess of their equilib-rium (economic) wage rate. Alternatively, the board and ownership structurevariables may proxy for some dimension of the firm’s demand for a high-qualityCEO not captured by the other economic determinants. For example, thesignificant positive coefficient on the board chair variable may indicate that thisindividual has a more complex job and merits a higher equilibrium wage.Finally, the coefficients on the board and ownership structure variables are alsoconsistent with a tradeoff between monitoring quality and the extent of incentive(riskier) pay. Since increases in compensation risk should translate into greaterlevels of compensation for risk-averse managers, in equilibrium, we might expectincreases in the level of compensation as monitoring quality falls. In this sectionand in Section 6, we attempt to distinguish between these alternative interpreta-tions of the results in Table 2.
5.1. Methodology
The regressions reported in Section 4 include a set of variables representingthe economic determinants of the level of compensation which are intended tocompletely capture the cross-sectional variation in the equilibrium level of CEOcompensation in the absence of any agency problems. The estimated coefficientsfrom the CEO compensation regressions in conjunction with each firm’s boardand ownership structure variables allow us to estimate the predicted componentof compensation for each CEO that is related to the board and ownershipstructure variables. That is, we compute the following linear combination foreach CEO:
Predicted excess compensationi"+bK
iboard structure
i
#+cLiownership structure
i, (1)
where the estimated coefficients on the board and ownership structure variables(bK
i’s and cL
i’s) are those reported in Table 2. We refer to this linear combination
390 J.E. Core et al./Journal of Financial Economics 51 (1999) 371—406
13We also considered alternative deflators such as predicted total compensation. A potentialadvantage of this measure is that it eliminates the idiosyncratic noise in the compensation decisionfrom the denominator. Using this measure, predicted excess compensation is somewhat more highlyassociated with subsequent operating performance and somewhat less highly correlated withsubsequent stock returns.
14One advantage of using predicted excess compensation in the performance regression is that thecompensation regression provides a single variable formed by the weighted linear composite of theboard and ownership variables, where the weights are derived from the covariance between the levelof compensation and each of the board and ownership structure variables after controlling for theeconomic determinants of compensation. This linear composite is likely to have considerably lessmeasurement error than the individual board and ownership structure variables that comprise it.Moreover, with our approach, we only need to examine the sign and statistical significance of thecoefficient on this single variable in the performance regression in order to examine the validity ofour interpretation of the compensation regression results. An alternative approach would be toregress subsequent firm performance on the individual board and ownership structure variables. Wecould then examine each of the coefficients for evidence of managerial entrenchment. The weaknessof this approach is that it does not incorporate any of the information gained from the compensationregression, and accordingly provides a weaker test of our hypothesis.
as ‘predicted excess compensation’ because it represents the predicted compon-ent of compensation arising from the board and ownership structure variablesin excess of our controls for the standard economic determinants of compen-sation. Since we examine the ability of predicted excess compensation toexplain cross-sectional variation in scaled return measures (return on assetsand stock returns), it is necessary to deflate predicted excess compensationfor scale differences across observations. We do this by redefining predictedexcess compensation as the ratio of the amount computed in Eq. (1) to totalcompensation.13
In order to determine whether the observed associations between the level ofcompensation and the board and ownership structure variables are proxies forthe effectiveness of the governance structure or are due to a misspecified modelof the economic determinants of the level of CEO compensation, we estimate theassociation between our measure of predicted excess compensation and sub-sequent firm financial performance.14 If the association between compensationand board and ownership structure reflects the degree of managerial entrench-ment, we expect to observe a negative association between our measure ofpredicted excess compensation and subsequent performance. We expect noassociation (or perhaps a positive association) between predicted excess com-pensation and subsequent performance if the compensation and board andownership structure reflects some dimension of the firm’s demand for ahigh-quality CEO. Thus, whether there is a negative association between thepredicted excess compensation due to board and ownership structures andsubsequent firm performance is a test of the hypothesis that the coefficients on
J.E. Core et al./Journal of Financial Economics 51 (1999) 371—406 391
15The results in this section are based on the regression analysis of total compensation. Theresults were virtually identical with cash compensation and salary, and thus we do not report theseregressions in the text.
16 In order to illustrate the timing for variable measurement, assume that we were usingcompensation data from the 1984 survey to construct excess compensation. The compensation datawould provide information on the salary for 1984, bonus paid in 1984 for 1983 performance and theexpected value of long-term components of compensation awarded at the beginning of 1984 or theend of 1983. Return on assets would be computed for either 1984, 1984 to 1986 or 1984 to 1988, saleswould be for 1983, and the standard deviation of return on assets would be measured over the fiveyears ending 1983.
the board and ownership structure variables estimated in the CEO compensa-tion model are indicative of the effectiveness of corporate governance.15
In the first set of tests, we examine the relation between predicted excesscompensation and subsequent accounting operating performance. The specificregression used in our hypothesis test is
ROAi"d
0#d
1Predicted excess compensation
i#d
2Std dev of ROA
i
#d3
Salesi#h ½ear controls
i#j Industry controls
i#e
i, (2)
where the performance measure is the average return on assets for the sub-sequent year, three years, or five years after compensation is awarded, thestandard deviation of ROA is the standard deviation of return on assets for thefive years prior to when compensation is awarded, predicted excess compensa-tion is the scaled measure defined above, and all of the other variables are aspreviously defined.16
The predictions concerning the correlation between our measure of predictedexcess compensation and subsequent performance are straightforward formeasures of accounting operating performance. However, under the alternativehypothesis of managerial entrenchment, there need be no correlation with stockmarket performance if the market fully impounds the firm’s agency problems inthe level of the stock price at the beginning of the period. The specific regressionused in our hypothesis test is
Stock returni"a
0#a
1Predicted excess compensation
i
#a2
Std dev of stock returni#a
3ln (Market value equity)
i
#a4
Market-to-booki#h ½ear controls
i
#j Industry controlsi#e
i, (3)
where stock return is the average common stock return for the subsequent fiscalyear, three fiscal years, or five fiscal years after compensation is awarded, and thestandard deviation of stock return is the annual standard deviation of return onthe common stock for the five years prior to when compensation is awarded.
392 J.E. Core et al./Journal of Financial Economics 51 (1999) 371—406
17The results presented include only industry-indicator and year-indicator variables, and thusreturns are not being measured over precisely the same period for each firm because of different fiscalyear-ends. We also estimated, but do not report, the same regressions using a different time-indicatorvariable for each month—year combination, which precisely controls for the average return in thesample among firms with the same fiscal year-end. The results are not affected by this alternative.
18 If governance structure quality is priced by investors, then the market value of equity and themarket-to-book ratio will be affected by the governance structure. Our results are not sensitive toexcluding the market value of equity and the market-to-book ratio as independent variables.
The market value of equity and the market-to-book ratio are measured as of theend of the fiscal year prior to when compensation is awarded, and all of the othervariables are as previously defined.
We chose not to calculate measures of excess returns, such as market-adjustedreturns or excess returns from the CAPM, because of the problems discussed inBarber and Lyon (1997) and Kothari and Warner (1997), and because we areconcerned here with estimating the covariance between predicted excess com-pensation and subsequent performance, as opposed to the abnormal returnsassociated with some event. As such, it is best to control for expected returnsin-sample where we can adequately measure the differences in governancestructures. The inclusion of the industry-indicator variables controls for idiosyn-cratic returns within each industry group over the relevant period, and theinclusion of time-indicator variables allows us to measure returns relative to theaverage return in the sample over the same time period.17 We also include themarket value of equity, standard deviation of return, and the market-to-bookratio as independent variables because prior studies have indicated that risk,size, and market-to-book are potentially important determinants of firm perfor-mance.18 Including these as independent variables, as opposed to relying ontypical excess return measures, allows us to conduct in-sample tests where weexplicitly control for differences in governance structure quality.
5.2. Results
Table 3 presents the estimation results for the model described by Eq. (2)(subsequent performance measured via average return on assets), and Table 4presents results for the model described by Eq. (3) (subsequent performancemeasured via average stock return). The results in Tables 3 and 4 indicate thatexcess compensation has a significant negative association with subsequent firmoperating performance and subsequent firm stock returns. Table 3 indicatesthat a 40% increase in excess compensation (the standard deviation of excesscompensation is approximately 40%) is associated with a decrease in annualreturn on assets of approximately 1% per year (the coefficient implies a per-yearloss in ROA of !1.36%, !1.19%, and !0.97%, for one-year, three-year, and
J.E. Core et al./Journal of Financial Economics 51 (1999) 371—406 393
Table 3Regressions of subsequent operating performance on predicted excess CEO compensation, thestandard deviation of ROA, sales, and industry and year controls
The sample consists of the subsample (of the original sample of 205 firms between 1982 and 1984) forwhich subsequent performance data is available in the years after CEO compensation was earned.Predicted excess compensation is the amount of compensation attributable to the board andownership structure variables (estimated with the coefficients from the total compensation regres-sion in Table 2), scaled by total compensation. The standard deviation of ROA is the standarddeviation of annual percentage corporate return on assets for the five years ending with the yearprior (i.e., 1983) to the year in which compensation is awarded (i.e., 1984). Sales are for the year priorto the year in which compensation is awarded. t-statistics are based on White standard errors whenthe White (1980) test is significant (p-value(0.05), and on OLS standard errors otherwise.
19We also estimated the accounting operating performance regression including the market-to-book ratio as a control variable, as the market-to-book ratio has been used as a proxy for risk andfor the firm’s investment opportunity set. In regressions not reported, the market-to-book ratio issignificantly positive and the predicted excess compensation remains significantly negative.
five-year ROA, respectively).19 Since the average ROA in the sample is approx-imately 10%, this implies a loss of approximately 10% of the sample averageROA. Since the coefficient on predicted excess compensation attenuates towardzero with longer prediction intervals, it implies that the negative effect on ROAis diminished somewhat at longer horizons. In particular, a 40% increase inexcess compensation is associated with a cumulative loss in ROA of 1.36%,3.56%, and 4.85% for one-year, three-year, and five-year holding periods. Thesample average cumulative ROA for these periods is 10.3%, 29.7%, and 49.0%,respectively. In other tests not reported in tables, the decline in performance inyears four and five is still statistically significant.
394 J.E. Core et al./Journal of Financial Economics 51 (1999) 371—406
Table 4Regressions of subsequent stock return on predicted excess CEO compensation, the standarddeviation of RET, ln(Market value of equity), the market-to-book ratio, and industry and yearcontrols
The sample consists of the subsample (of the original sample of 205 firms between 1982 and 1984) forwhich subsequent performance data is available in the years after CEO compensation was earned.Predicted excess compensation is the amount of compensation attributable to the board andownership structure variables (estimated with the coefficients from the total compensation regres-sion in Table 2), scaled by total compensation. The standard deviation of RET is the standarddeviation of annual percentage stock market return for the five years ending with the year prior (i.e.,1983) to the year in which compensation is awarded (i.e., 1984). ln(Market value of equity) and themarket-to-book ratio are calculated based on the market value and book value of the firm’s equity atthe end of the year prior to which compensation is awarded. t-statistics are based on OLS standarderrors.
Standard Deviation of RET !0.205 !0.226 !0.194(!2.70) (!4.98) (!5.00)
ln(Market value of equity) !3.666 !0.656 !0.464(!2.95) (!0.87) (!0.72)
Market-to-book ratio !9.446 !4.489 !3.037(!4.55) (!3.59) (!2.79)
Adj-R2 30.6% 28.2% 31.9%
F 12.39 10.50 11.29
Number of regressors 20 20 20
N 491 460 418
The coefficients on excess compensation in Table 4 indicate that a 40%increase in excess compensation is associated with a decrease in annual stockreturns per year of !4.97%, !2.82%, and !1.78%, for one-year, three-year,and five-year stock returns, respectively. Since the average common stock returnin the sample is approximately 15% per year, this implies a loss of approxim-ately 33% of the sample average return for the first year and 20% for the firstthree years. The coefficient estimates and other tests not reported in the tablesindicate that predicted excess compensation has no ability to explain returns ineither the fourth or fifth subsequent year, as all of the decline occurs by the end ofthe third year. A 40% increase in excess compensation is associated with a cumu-lative loss in the returns to common stock of 4.97%, 8.47%, and 8.88% forone-year, three-year, and five-year holding periods. The sample average cumulat-ive stock return for these periods is 15.9%, 48.6%, and 81.5%, respectively.
J.E. Core et al./Journal of Financial Economics 51 (1999) 371—406 395
20 If firms experience mean reversion in their accounting operating performance (a well-documented phenomenon for firms with extremes of good or bad performance), the negativecorrelation between predicted excess compensation and subsequent performance could simply bedriven by mean reversion in operating performance. We examined the correlation between predictedexcess compensation and contemporaneous ROA and found them to be negatively correlated,indicating that we are not simply detecting mean reversion. However, the negative correlationsuggests that we are detecting persistent poor operating performance by firms with low-qualitygovernance structures.
Overall, the predictable component of compensation due to board andownership structure variables exhibits a significant negative association withsubsequent firm operating and stock market performance.20 More importantly,these results suggest that the board and ownership variables proxy for manage-rial entrenchment (or the absence of active monitoring by the board of direc-tors), as opposed to the alternative interpretation that these variables are simplymeasures for a firm’s demand for a high-quality CEO.
6. Sensitivity tests
In this section, we test the sensitivity of the results to a number of alternativespecifications: (1) inclusion of mix of compensation as an economic determinantof CEO pay; (2) averaging individual firm observations; and (3) using log-transformed CEO compensation and sales. The results of these sensitivity testsare reported in Tables 5 and 6, where, for the purposes of comparison, the keyresults from Tables 2—4 are repeated in the first column. Table 5 reportsthe results of the alternative specifications on the compensation equation. Thetable reports only the coefficients and t-statistics on the board and ownershipstructure variables since that is the focus of the compensation regressions.Table 6 reports the results of the alternative specifications on the performanceequations, where only the coefficient on predicted excess compensation isreported because that is the key element of the performance equations.
6.1. Mix of pay as an economic determinant of compensation
The mix of pay is included as an economic determinant to provide insight intowhether controlling for compensation risk in regressions of the level of paysignificantly affects our results. If firms provide more incentives to the CEOthrough pay risk when monitoring is more difficult, and if our board-of-directorand ownership variables proxy for low monitoring quality, it is conceivable thatthe increase in pay level associated with these variables results from an increasein compensation risk. However, this would not explain why the predicted excesscompensation arising from board and ownership structure variables is
396 J.E. Core et al./Journal of Financial Economics 51 (1999) 371—406
21We also treated CEO chair as an economic determinant because if the CEO is also board chair,it may mean that the job is more complex and that the CEO is of higher quality than a non-chairCEO. Results not reported in the tables indicate that even when the variable ‘CEO is board chair’ istreated as an economic determinant, the predicted excess compensation arising from the remainingboard and ownership structure variables is significantly negatively associated with future perfor-mance.
22Notice that if the same governance structure weakness reflects itself in the mix of pay as well asthe level of compensation, we would expect that the addition of the mix of pay as an independentvariable would cause potential multicollinearity problems and reduce the significance of the boardand ownership structure variables, which is consistent with the results reported in Table 5 when paymix is included as an economic determinant.
negatively correlated with subsequent performance. Nevertheless, in order to seehow sensitive our results are to this issue, we include the mix of pay (defined asthe difference between total compensation and salary, divided by total compen-sation) as an economic determinant of pay.
The second column of Table 5 contains the regression coefficient estimates onthe board and ownership structure variables when mix of pay is included in thecompensation regression. The results indicate that most of the board andownership structure variables continue to remain significant; however, thechair/CEO variable, busy directors, CEO ownership and non-CEO insiderownership are no longer statistically significant. The results in the secondcolumn of Table 6 indicate that the predicted excess compensation arising fromthe board and ownership structure variables has a significant negative associ-ation with subsequent accounting performance and stock returns, even aftercontrolling for compensation risk (mix of pay) as an economic determinant ofcompensation.21
By including mix of pay as an economic determinant, we are implicitlyassuming that it is set by the board in order to maximize firm value. However, ifthere are unresolved agency problems embedded in the board and ownershipstructure, we would expect that mix of pay would reflect the same governancestructure weaknesses as the level of compensation, since excess compensationcould be partially disguised by using more long-term compensation.22 The valueof long-term grants (e.g., options, performance units, etc.) was not readilyobvious to shareholders in the early 1980s given the disclosure rules in force atthe time. Thus, poor governance could be associated with an increase in mix ofpay. In order to examine this issue further, we used mix of pay as the dependentvariable in the compensation regression and then examined the associationbetween predicted excess mix arising from the board and ownership structurevariables with subsequent performance. These results are contained in the lastcolumn of Tables 5 and 6.
Table 5 indicates that mix of pay and level of pay are related to the board andownership structure variables in a very similar manner; only the proportion of
J.E. Core et al./Journal of Financial Economics 51 (1999) 371—406 397
Tab
le5
Sens
itiv
ity
anal
ysis
ofC
EO
tota
lco
mpe
nsa
tion
mode
lto
alte
rnat
ive
spec
ifica
tions
Tab
leco
ntai
nson
lyth
ees
tim
ated
coeffi
cien
tsof
the
boar
dan
dow
ner
ship
stru
ctur
eva
riab
les
(OL
St-st
atistics
inpar
enth
eses
),an
ddoe
snot
repo
rtco
effici
ents
for
the
econ
om
icde
term
inan
tva
riab
les.
Tot
alco
mpe
nsat
ion
isth
esu
mof
sala
ry,an
nual
bonus
,an
dour
valu
atio
ns
for
stoc
koptions
,pe
rform
ance
pla
ns,
pha
ntom
stock
,and
rest
rict
edst
ock
.Mix
isan
nual
and
long-
term
ince
ntive
pay
and
asa
per
centa
geofto
talco
mpen
sation
.Boa
rdSt
ruct
ure:
CE
Ois
boar
dch
airis
anin
dic
atorva
riab
leeq
ualt
oon
eif
the
CEO
isal
soch
airm
anoft
heboar
d,z
ero
oth
erw
ise.
Boar
dsize
isth
eto
taln
um
ber
ofdirec
tors
on
theboa
rd.I
nsidedirec
tors
isth
epe
rcen
tage
oft
heboar
dw
ho
are
man
ager
s,re
tire
dm
anag
ers,
orar
ere
lative
sofc
urr
entm
anag
ers.
Out
side
dire
ctors
appoin
ted
by
CEO
isth
enum
ber
ofo
uts
idedirec
tors
on
thebo
ard
appoin
ted
by
theC
EO
asa
per
centa
geofb
oar
dsize
.Gra
youts
idedirec
tors
isth
enum
ber
ofo
uts
ide
dire
ctor
sw
ho
are
gray
(adirec
toris
gray
ifhe
orhis
empl
oyer
rece
ived
paym
ents
from
the
com
pany
inex
cess
ofhi
sboa
rdpay
)as
aper
cent
ageofb
oar
dsize
.Inte
rloc
ked
outs
idedirec
tors
isth
enum
berofo
uts
idedirec
tors
who
are
inte
rloc
ked
(adi
rect
oris
inte
rlock
edif
anin
side
office
rof
the
firm
serv
eson
the
boar
dof
that
outs
ide
direc
tor’s
com
pan
y)as
aper
centa
geof
boa
rdsize
.Outs
ide
direc
tors
ove
rag
e69
isth
epe
rcen
tage
ofth
eou
tsid
edi
rect
ors
who
are
ove
rag
e69
.Busy
outs
ide
dire
ctors
isth
eper
centa
geof
outs
ide
direc
tors
who
serv
eon
thre
eorm
ore
othe
rboa
rds(six
orm
ore
for
retire
dou
tsid
edi
rect
ors).O
wne
rshi
pSt
ruct
ure:
CE
Oper
centa
gest
ock
ow
ner
ship
isth
eper
centa
geof
outs
tandin
gsh
ares
ow
ned
byth
eC
EO
.N
on-
CE
Oin
side
row
ns5%
isan
indi
cato
rva
riab
leeq
ual
toon
eif
the
firm
hasan
inte
rnal
boa
rdm
embe
r(o
ther
than
the
CE
O)w
hoow
nsat
leas
t5%
ofth
eou
tsta
ndin
gsh
ares
,an
dze
root
herw
ise.
Per
centa
gest
ock
ow
ners
hip
per
outs
ide
dire
ctor
isth
eto
talper
centa
geofout
stan
din
gsh
ares
ow
ned
by
outs
idedi
rect
orsdi
vided
byth
enum
ber
ofou
tsid
edirec
tors
.Outs
idebl
ock
hold
erow
ns5%
isan
indi
cato
rva
riab
leeq
ual
tooneif
thefirm
has
anex
tern
albl
ock
hold
erw
ho
ow
ns
atle
ast5%
ofth
eout
stan
ding
shar
es,an
dze
rooth
erw
ise.
Dep
enden
tva
riab
leis
CEO
tota
lco
mpen
sation
As
report
edin
Tab
le2
Incl
udes
mix
ofpa
yas
econ
om
icde
term
inan
t
Ave
rage
obse
rvat
ions
for
each
firm
Dep
enden
tva
riab
leis
ln(tot
al)an
dln
(sal
es)is
use
das
econ
om
icde
term
inan
t
Dep
enden
tva
riab
leis
mix
ofpay
Boa
rdst
ruct
ure
CEO
isbo
ard
chai
r15
2,57
738
,177
152,
586
0.14
120.
0612
(2.8
6)(1
.10)
(2.0
5)(2
.89)
(2.8
1)
Boar
dsize
30,6
0111
,971
34,0
340.
0091
0.01
00(3
.51)
(2.1
0)(2
.78)
(1.0
7)(2
.80)
398 J.E. Core et al./Journal of Financial Economics 51 (1999) 371—406
Inside
direc
tors
!5,
639
!2,
011
!5,
464
!0.
0047
!0.
0019
(!3.
22)
(!1.
76)
(!2.
21)
(!2.
93)
(!2.
71)
Outs
ide
dire
ctors
appo
inte
dby
CEO
4,13
71,
558
4,76
10.
0044
0.00
14(4
.14)
(2.3
8)(3
.30)
(4.9
3)(3
.38)
Gra
ydirec
tors
7,35
63,
978
7,14
40.
0023
0.00
18(3
.19)
(2.6
5)(2
.22)
(1.1
3)(1
.92)
Inte
rloc
ked
out
side
dire
ctor
s4,
358
977
5,18
60.
0053
0.00
18(0
.99)
(0.3
4)(0
.81)
(1.3
3)(1
.01)
Outs
ide
dire
ctors
ove
rag
e69
4,13
65,
394
5,15
60.
0038
!0.
0007
(2.4
2)(4
.88)
(2.0
9)(2
.48)
(!0.
97)
Busy
outs
ide
direc
tors
2,01
675
62,
808
0.00
130.
0007
(1.8
0)(1
.04)
(1.8
3)(1
.26)
(1.4
7)
Owne
rshi
pst
ruct
ure
CEO
per
centa
gest
ock
ow
ner
ship
!8,
027
!2,
911
!4,
592
!0.
0054
!0.
0027
(!2.
21)
(!1.
23)
(!0.
96)
(!1.
64)
(!1.
84)
Non-
CE
Oin
side
row
ns
5%!
142,
389
!26
,724
!18
8,47
2!
0.07
50!
0.06
19(!
2.18
)(!
0.63
)(!
2.10
)(!
1.27
)(!
2.32
)
Per
cent
age
stock
owner
ship
per
outs
ide
direc
tor
!21
,183
30,9
36!
18,5
58!
0.01
67!
0.02
79(!
0.81
)(1
.82)
(!0.
46)
(!0.
71)
(!2.
62)
Outs
ide
block
hold
erow
ns
5%!
86,1
00!
121,
267
!10
1,62
9!
0.00
470.
0188
(!1.
98)
(!4.
23)
(!1.
61)
(!0.
11)
(1.0
6)
Adj-R
237
.2%
73.7
%39
.6%
48.2
%27
.9%
F9.
8541
.73
5.30
14.9
56.
81
J.E. Core et al./Journal of Financial Economics 51 (1999) 371—406 399
Tab
le6
Sens
itiv
ity
anal
ysis
ofsu
bse
que
ntoper
atin
gan
dst
ock
retu
rnpe
rform
ance
model
sto
alte
rnat
ive
spec
ifica
tion
softh
eC
EO
com
pen
sation
regr
ession
This
table
conta
ins
onl
yth
ees
tim
ated
coeffi
cien
ton
pre
dic
ted
exce
ssC
EO
com
pen
sation
arisin
gfrom
the
boa
rdan
dow
ner
ship
stru
cture
variab
les
(t-s
tatist
ics
inpa
rent
hes
esar
eba
sed
on
Whi
test
andar
der
rors
whe
nth
eW
hite
(198
0)te
stis
sign
ifica
nt(p
-val
ue(
0.05
),an
dO
LS
stan
dar
der
rors
other
wise)
,and
does
notre
por
tco
effici
ents
on
the
contr
olva
riab
lesde
fined
and
used
inT
able
s3
and
4.P
redic
ted
exce
ssC
EO
com
pen
sation
isba
sed
on
are
sidu
alfrom
the
corr
espo
ndin
gm
odel
inTab
le5.
Dep
enden
tva
riab
lem
easu
ring
perform
ance
is
Spe
cifica
tion
ofC
EO
tota
lco
mpen
sation
regr
ession
Dep
enden
tva
riab
lein
com
pen
sation
regr
ession
ism
ixof
pay
As
report
edin
Tab
les
3an
d4
Incl
udes
mix
of
pay
asec
ono
mic
det
erm
inan
t
Ave
rage
obse
rvat
ions
for
each
firm
Dep
ende
ntva
riab
lein
com
pens
atio
nre
gres
sion
isln
(tot
al)
and
ln(sal
es)is
use
das
econ
om
icde
term
inan
t
Ave
rage
RO
Afo
rsu
bseq
uent
period
One
year
!3.
403
!6.
835
!2.
770
!5.
138
!3.
119
(!4.
84)
(!5.
38)
(!2.
91)
(!3.
08)
(!4.
50)
Thre
eye
ar!
2.96
8!
6.89
1!
2.43
0!
4.52
1!
2.45
1(!
4.24
)(!
5.33
)(!
2.76
)(!
2.70
)(!
3.77
)
Fiv
eye
ar!
2.42
7!
6.17
1!
2.17
0!
3.60
0!
1.66
0(!
3.69
)(!
4.94
)(!
2.50
)(!
2.46
)(!
2.76
)
Ave
rage
stoc
kre
turn
for
subs
eque
ntpe
riod
One
year
!12
.432
!24
.153
!8.
364
!18
.394
!3.
591
(!3.
73)
(!3.
95)
(!2.
40)
(!2.
35)
(!1.
08)
Thre
eye
ar!
7.05
9!
16.8
85!
4.92
6!
7.27
1!
1.41
1(!
3.47
)(!
4.63
)(!
1.84
)(!
1.53
)(!
0.72
)
Fiv
eye
ar!
4.43
8!
11.9
95!
3.11
4!
6.39
40.
011
(!2.
54)
(!3.
84)
(!1.
28)
(!1.
58)
(0.0
1)
400 J.E. Core et al./Journal of Financial Economics 51 (1999) 371—406
23Mehran (1995) finds that pay is more risky as the proportion of outside directors increases, andthat contemporaneous firm performance (not future firm performance), measured by Tobin’s Q andROA, is positively correlated with mix of pay. He interprets these findings as evidence that moreeffective boards use greater pay mix, and that greater pay mix leads to higher performance. Ourresults, however, indicate that the predicted component of mix arising from board and ownershipstructure variables is negatively correlated with subsequent performance.
outside directors over 69, stockholdings of outside directors and the existence ofan outside blockholder exhibit different associations. Moreover, the results inTable 6 indicate that the predicted excess compensation from the board andownership structure variables (when using the mix of pay as the dependentvariable in the compensation equation) is significantly negatively related tosubsequent operating performance, but not significantly related to subsequentstock market returns. If the mix of pay were optimized from the firm’s perspect-ive, we would not expect a negative correlation between the predicted compon-ent of mix of pay arising from the board and ownership structure variables withsubsequent performance.23 The observed negative correlation between the pre-dicted mix of pay from board and ownership structure with subsequent perfor-mance suggests that mix of pay reflects an agency problem, and thus cannot beconsidered solely an economic determinant of the CEO’s total compensation.
6.2. Averaging individual firm observations
As indicated previously, we have multiple observations for our firms, whichsuggests that the t-statistics may be somewhat overstated. Moreover, long-termgrants may not be given every year, and this will tend to induce measurementerror in our measure of total compensation, even though the compensationconsulting firm annualizes some of the unusually large grants in the data. Tomitigate these two issues, we averaged all the observations available for a givenfirm and then used the average of the observations in the regressions (this forcedus to drop the year controls from the regressions). As can be seen from the thirdcolumn of Table 5, only the significance of CEO percentage stock ownership inthe compensation equation is affected by the averaging. Moreover, the thirdcolumn of Table 6 indicates that the predicted excess compensation still exhibitsa statistically significant negative association with subsequent operating perfor-mance, and the relation with subsequent stock market performance, thoughsomewhat diminished, is still significant one year and three years ahead.
6.3. Using log-transformed CEO compensation and sales
The results in Table 2 estimate CEO compensation using untransformeddata. However, it is also common to estimate regressions involving levels of
J.E. Core et al./Journal of Financial Economics 51 (1999) 371—406 401
24Since the predicted component arising from the board and ownership variables is alreadymeasured as a proportionate effect on compensation in this specification, we do not deflate by totalcompensation. The economic interpretation of the coefficients is similar to the other specifications.For example, a 40% increase in predicted compensation arising from the board and ownershipstructure variables results in a one-year reduction in ROA of 2.05% (0.40 times 5.138).
compensation after transforming compensation and sales via the natural logar-ithm. One justification for this practice is that the typical ‘guide charts’, whichare used by human resource consultants to set compensation levels, are con-structed by regressing the logarithm of compensation on the logarithm of firmsize (e.g., Amacom, 1975). In order to test the robustness of our results, we useln(compensation) as a dependent variable and ln(sales) as an economic determi-nant, but continue to define the other economic determinants and board andownership structure variables as previously. The advantage of this specificationis that the regression coefficients on the board and ownership structure variablesmeasure the proportionate effects of a variable on compensation, rather than thedollar value effect. Since our firms are generally large firms, the dollar valuespecification may be appropriate; nevertheless, the logarithmic transformationdirectly addresses this issue.
The results of this log-transformed specification are contained in column 4 ofTable 5. The interpretation of the coefficient on CEO is Board Chair of 0.1412 isthat a CEO who is also board chair is paid 14.12% more than a CEO who is notboard chair. In this alternative specification, the coefficients on board size, graydirectors, busy directors, non-CEO insider holding 5% and outside block-holders owning 5%, retain the same sign but fall in significance. The remainingboard and ownership structure variables retain their signs and significancelevels, and overall the board and ownership structure variables explain a signifi-cant amount of the variance in ln of compensation (incremental R2 of 8.55% andF-statistic of 7.51). Moreover, column 4 of Table 6 indicates that the predictedboard and ownership structure arising from this alternative specification stillexhibits a significantly negative association with subsequent operating andstock market performance, though the ability to predict subsequent stockmarket performance is somewhat diminished.24
6.4. Summary of sensitivity analysis
Overall these sensitivity results reinforce our findings that the board andownership variables measure managerial entrenchment. The results in Table 5suggest that the strength of the association between CEO compensation and theboard-of-director variables is more robust than the strength of the associationbetween CEO compensation and the ownership variables. If a board variable issignificant in Table 2, it is generally significant in the alternative specifications,
402 J.E. Core et al./Journal of Financial Economics 51 (1999) 371—406
which is less true for the ownership structure variables. Moreover, the results inTable 6 provide at least some assurance that the negative association betweenpredicted excess compensation and future performance is not being induced byobvious model misspecification. In addition, the results in Table 6 suggest thatprediction of subsequent accounting operating performance is more robust thanthe predictions of subsequent stock market performance. Given uncertaintyabout whether the performance effects of the governance structure would befully impounded in the level of stock price, it is not surprising that predictions ofsubsequent stock market performance with board and ownership structure areless robust to alternative specifications.
In order to further assess the relative importance of the board and ownershipstructure, we computed two different measures of predicted excess compensa-tion: the predicted excess compensation related to board structure and thepredicted excess compensation related to ownership structure. These twomeasures (both deflated by total compensation) have a statistically significantnegative correlation of !0.33 (p(0.001, two-tail), consistent with the intuitionthat the two monitoring mechanisms are substitutes. If we include bothmeasures of predicted excess compensation in the accounting performance andstock return performance regression models, we find that predicted excesscompensation arising from the board structure is significantly negatively asso-ciated with both operating and stock market performance across the alternativespecifications examined. However, the association between predicted excesscompensation arising from the ownership structure and both operating andstock market performance, while negative, exhibits varying levels of significanceacross specifications. For example, in the specification reported in Sections 4and 5, predicted excess compensation from the ownership structure is onlymarginally significant (approximately 20% level, two-tailed) in explaining sub-sequent accounting and stock market performance. However, if we include mixof pay as an economic determinant, the predicted excess compensation from theownership structure is significant in explaining subsequent accounting andstock market performance. Overall, the results suggest that board structurevariables used in our analysis are somewhat more important than the ownershipstructure variables in predicting future performance.
7. Summary and conclusions
This study documents that board and ownership structure are associated withthe level of CEO compensation, after controlling for the standard economicdeterminants of compensation (the firm’s demand for a high-quality CEO, priorfirm performance, and risk). With respect to board-of-director structure, we findthat CEO compensation is a decreasing function of the percentage of the boardcomposed of inside directors, and is an increasing function of board size, the
J.E. Core et al./Journal of Financial Economics 51 (1999) 371—406 403
percentage of the board who are outside directors appointed by the CEO, thepercentage of the board who are gray outside directors, the percentage ofoutside directors who are over age 69, the percentage of outside directors whoserve on three or more other boards (six or more other boards if retired), andwhether the CEO also is board chair. With respect to ownership structure, wefind that CEO compensation is a decreasing function of the CEO’s ownershipstake. In addition, CEO compensation is lower when there is a non-CEOinternal board member or an external blockholder who owns at least 5% of theshares. However, we find no statistical association between percentage owner-ship per outside director and CEO compensation. Overall, both board charac-teristics and ownership structure have a substantive cross-sectional associationwith the level of CEO compensation, though the results on board characteristicsare more robust to alternative specifications.
The predicted component of compensation arising from the board andownership variables exhibits a negative correlation with subsequent firm operat-ing and stock return performance. This result suggests that the estimatedcoefficients on the board-of-director and ownership structure variables from thecompensation regression reflect the relative effectiveness of various governancestructures in controlling agency problems, as opposed to the explanation thatthese variables are additional proxies for the firm’s demand for a high-qualityCEO. Thus, the board and ownership structures affect the extent to which CEOsobtain compensation in excess of the level implied by economic determinants,which we conjecture predicts the manifestation of other contracting inefficien-cies within the firm that lead to poorer subsequent performance. Finally, ourrobustness checks suggest that board and ownership structure more consistentlypredict future accounting operating performance than future stock marketperformance.
Our results are largely consistent with many of the guidelines for improvingcorporate governance that have been recently promulgated by various groups,such as the National Association of Corporate Directors (1996). In particular,calls for improving corporate governance by separating the Chairman andCEO, relying on smaller boards, imposing mandatory retirement ages or termlimits, eliminating gray directors, limiting the number of other boards on whicha board member may serve, are all consistent with our results. While our resultsindicate that, on average, these guidelines have identified substantive issues inthe creation of effective governance mechanisms, our evidence does not implythat it is appropriate to adopt strict rules for the composition of the board orownership structure. Contrary to many guidelines for improving corporategovernance, we find no evidence that independent outside directors createa more effective board than inside directors, nor do we find that greater equityownership by outside directors results in improved governance systems. Giventhe prior mixed evidence on the importance of outside directors and ourevidence that inside directors may be superior to outside directors, the attention
404 J.E. Core et al./Journal of Financial Economics 51 (1999) 371—406
focused on the importance of outside directors and their ownership stakesappears misplaced.
References
Amacom, 1975. Executive Compensation Service: Top Management Report. American Manage-ment Association, New York.
Allen, M., 1981. Power and privilege in the large corporation: corporate control and managerialcompensation. American Journal of Sociology 86, 1112—1123.
Banker, R.D., Datar, S.M., 1989. Sensitivity, precision, and linear aggregation of signals forperformance evaluation. Journal of Accounting Research 27, 21—39.
Barber, B.M., Lyon, J.D., 1997. Detecting long-run abnormal stock returns: the empirical power andspecification of test statistics. Journal of Financial Economics 43, 341—371.
Baysinger, B., Butler, H., 1985. Corporate governance and the board of directors: performanceeffects of changes in board composition. Journal of Law, Economics and Organizations 1,101—124.
Bhagat, S., Black, B., 1997. Do Independent Directors Matter? Working Paper, University ofColorado, Boulder.
Boyd, B.K., 1994. Board control and CEO compensation. Strategic Management Journal 15,335—344.
Byrd, J., Hickman, K., 1992. Do outside directors monitor managers? Evidence from Tender OfferBids. Journal of Financial Economics 32, 195—221.
Core, J.E., 1997. The directors’ and officers’ insurance premium: an outside assessment of the cost ofweak corporate governance. Working Paper, The Wharton School, University of Pennsylvania.
Crystal, G., 1991. In Search of Excess: The Overcompensation of American Executives. W.W.Norton and Company, New York.
Cyert, R., Kang, S., Kumar, P., Shah, A., 1997. Corporate governance and the level of CEOcompensation. Working Paper, Carnegie Mellon University.
Finkelstein, S., Hambrick, D., 1989. Chief executive compensation: a study of the intersection ofmarkets and political processes. Strategic Management Journal 10, 121—134.
Hallock, K.F., 1997. Reciprocally interlocking boards of directors and executive compensation.Journal of Financial and Quantitative Analysis 32, 331—344.
Hermalin, B., Weisbach, M., 1991. The effects of board composition and direct incentives on firmperformance. Financial Management 20, 101—112.
Holderness, C., Sheehan, D., 1988. The role of majority shareholders in publicly-held corporations:an exploratory analysis. Journal of Financial Economics 20, 317—346.
Holthausen, R., Larcker, D., Sloan, R., 1995. Annual bonus schemes and the manipulation ofearnings. Journal of Accounting and Economics 19, 29—74.
Holthausen, R., Larcker, D., 1996. The financial performance of reverse leveraged buyouts. Journalof Financial Economics 42, 293—332.
Jensen, M., 1993. The modern industrial revolution, exit, and the failure of internal control systems.Journal of Finance 48, 831—880.
Lambert, R., Larcker, D., Verrecchia, R., 1991. Portfolio considerations in the valuation of executivecompensation. Journal of Accounting Research 29, 129—149.
Lambert, R., Larcker, D., Weigelt, K., 1993. The structure of organizational incentives. Administra-tive Science Quarterly 38, 438—461.
J.E. Core et al./Journal of Financial Economics 51 (1999) 371—406 405
McConnell, P., 1993. Accounting for Employee Stock Options: Crystal Ball Gazing. Bear Stearnsand Co., Inc. Investment Research.
Merchant, K., Manzoni, J., 1989. The achievability of budget targets in profit centers: a field study.The Accounting Review 64, 539—558.
Mehran, H., 1995. Executive compensation, ownership, and firm performance. Journal of FinancialEconomics 38, 163—184.
Morck, R., Shleifer, A., Vishny, R.W., 1988. Management ownership and market valuation: anempirical analysis. Journal of Financial Economics 20, 293—315.
National Association of Corporate Directors, 1996. NACD Blue Ribbon Commission Report onDirector Professionalism.
Pfeffer, J., 1981. Power in Organizations. Pitman, Boston, MA.Rosen, S., 1982. Authority, control and the distribution of earnings. Bell Journal of Economics 13,
Journal of Financial Economics 26, 175—191.Shivdasani, A., 1993. Board composition, ownership structure, and hostile takeovers. Journal of
Accounting and Economics 16, 167—198.Smith, C.W., Watts, R.L., 1992. The investment opportunity set and corporate financing, dividend,
and financing policies. Journal of Financial Economics 32, 262—292.Tosi, H., Gomez-Mejia, L., 1989. The decoupling of CEO pay and performance: an agency theory
perspective. Administrative Science Quarterly 34, 169—189.Wade, J., O’Reilly, C., Chandratat, I., 1990. Golden parachutes: CEOs and the exercise of social
influence. Administrative Science Quarterly 35, 587—603.White, H., 1980. A heteroskedasticity-consistent covariance matrix estimator and a direct test for
heteroskedasticity. Econometrica 48, 817—838.Yermack, D., 1996. Higher market valuation for firms with a small board of directors. Journal of
Financial Economics 40, 185—211.
406 J.E. Core et al./Journal of Financial Economics 51 (1999) 371—406


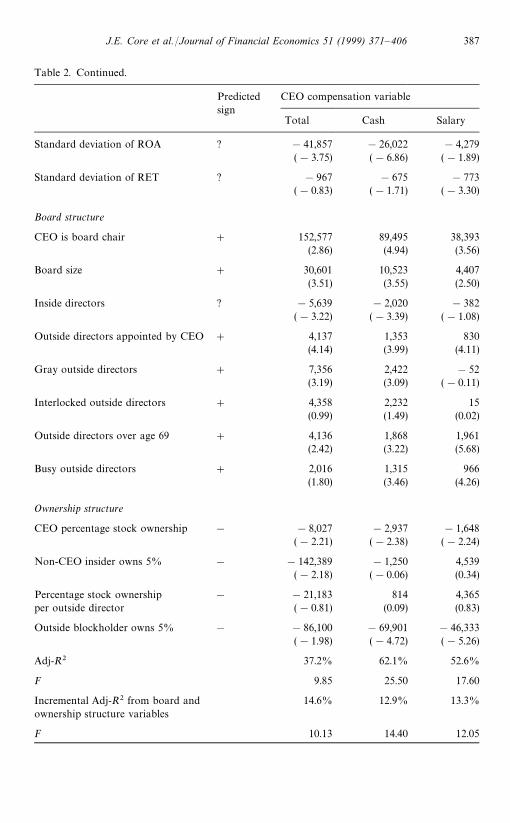


![Corporate Governance report final[7]az498215.vo.msecnd.net/static/files/corporate_governance/Corporat… · Rules for the election of employee representatives for the Board of Directors](https://static.documents.pub/doc/80x56/5f60e1041e9be82cd15117f2/corporate-governance-report-final7-rules-for-the-election-of-employee-representatives.jpg)


