Corporate Governance in an Emerging Market – What Does the Market Trust? Rajesh Chakrabarti & Subrata Sarkar http://eprints.exchange.isb.edu/270/ Working Paper Indian School of Business 2010
Transcript
Corporate Governance in an Emerging
Market – What Does the Market Trust? Rajesh Chakrabarti
Abstract The recent corporate governance scandals at the fourth largest software firm in India, Satyam Computers Limited, provide two clean and major corporate governance events, with effects on firms across the board in India (and possibly other emerging market countries). The first instance was a shock about board ineffectiveness on Dec 16, when Satyam’s board approved of an acquisition of two companies – one unlisted – where members of the Chairman’s family were the main entrepreneurs and had majority or complete shareholding; and the second, an accounting shock, occurred on January 7 when it was disclosed that the firm had been fudging its accounts for several years and its much-vaunted $1.2 billion cash holding was largely non-existent and the result of a long-drawn accounting fraud. We analyze the cross-sectional variation in the stock price reactions to these two corporate governance shocks for Indian companies. We relate the firm-specific cumulative abnormal returns on these two dates to different measures of corporate governance to find out the market perception of the validity of these measures. We show that with regard to board effectiveness, i) Board independence matters; ii) the characteristics of the independent directors also have a favorable effect on market reaction: companies with independent directors having more expertise (proxied by number of multiple directorships) do better; iii) institutional holdings have a salutary effect, but only for foreign institutions; iv) board size has a positive effect on market reaction; and v) there is a large discount for companies belonging to business groups. For the second episode, none of the board or audit committee independence related variables are significant, but indicators of quality of audit committee seem to matter. The discount of group companies becomes even more pronounced in this episode. These findings help us identify what variables among those identified by prior research are actually taken into account by investors in an emerging market to assess the corporate governance levels of companies and to what extent they affect valuation.
* We acknowledge great research support from Bhargav Kali and Sesha Sairam and useful suggestions from Sanjay Kallapur. The responsibility for the flaws that remain rests only with us.
1
Corporate Governance in an Emerging Market – What does the Market Trust?
I. Introduction
As research and practitioner interest in corporate governance soars around the world, we
have seen a proliferation of measures and indexes that seek to describe and measure the
complex and largely qualitative concept. Market returns have also been associated with
select corporate governance variables, though the debate about the impact of the latter is
not yet over. Nevertheless, there is little clarity over what market participants view as a
meaningful indicator of corporate governance (or at least one or more of its dimensions).
The divergence between now textbook measures of corporate governance and those that
investors actually care about is likely to be particularly pronounced in an emerging market
setting where institutional gaps often compromise the validity of certain measures that may
be effective in developed markets.
One way of establishing what corporate governance indicators matter to markets would be
to analyze market performance of a large number of stocks around a corporate governance
“event” that sends out a market-wide shock not confounded by any other major
development. Relating the cross-sectional variation of the reaction to such a stock by
individual firms to their respective corporate governance indicators may point out what the
markets trust as indicators of corporate governance quality. Without ascribing omniscience
to the markets, such analysis may be useful to policy makers and equity market regulators
in focusing on variables that the market bets on rather than those that appear to be
meaningful from traditional and theoretical analysis of corporate finance and governance.
It is, however, extremely difficult to come up with well-defined corporate governance
related “events” that have market-wide impact. Cases of major corporate mis-governance
typically unravel over a period of time (and are often associated with other developments,
unrelated to corporate governance) making a statistical analysis of their implications
extremely difficult.
2
The corporate governance scandal involving the fourth largest software company in India,
Satyam Computers Limited, that occurred in December 2008 and January 2009 provides
two such clean and major corporate governance events, with effects on firms across the
board in India (and possibly other emerging market countries). These events fit the bill for
several reasons. They were completely unexpected by the market, involving a firm that was
one of the most feted (decorated with awards for corporate governance to boot) with its
ADRs trading at the NYSE; in a country an industry – software in India – that enjoyed
international reputation and the image of highest professionalism and competition. Equally
importantly, the event was big enough to rock the entire Indian market on both days, and
made headline news for months afterwards. The events themselves were unquestionably
the biggest news on their respective days and major Indian market indices dipped on both
occasions. Given the fact that very transparent national level government and regulatory
enquiry was initiated into the affair, it even led to an exodus of non-executive directors
from several boards in India in the following weeks. So clearly these events can be viewed
as “corporate governance” events – as uncontaminated by other market developments as
we can hope to get them. Consequently we argue that the events served as wake up calls for
investors to review of the quality of corporate governance in the respective firms and that
the variation of market returns across firms on those days – suitably adjusted for overall
market reaction – reflects the variation in the investor perception of the quality of
governance in these firms. Consequently, associating these abnormal returns to corporate
governance indicators commonly used in the literature reveals what measures “really
matter” for the markets and which ones are largely inconsequential.
We find that on the first instance – with a shock about board effectiveness – firms with
mid-to-large boards did better in the marketplace. As for independence, a supermajority
(three-quarters or more) of independent directors mattered, but a simple majority did not.
The average board tenure of a director had a positive, not negative, effect, suggesting
experience beats familiarity in the market’s perception. Higher promoter share appeared to
instill confidence, as did size.
3
With an audit failure, neither the size nor the independence of the audit committee seemed
to matter. Promoter and FII holding had positive impact in the entire sample as well as for
group firms. Size had similar effects as well. The auditor involved did not seem to taint its
client firms significantly. In both cases, a group association seemed to flag greater
concerns for the market, markedly more so with the audit shock than the board shock.
The rest of the paper is organized as follows. The next section describes the two Satyam
related events and their overall impact on the Indian market. The following section
discusses the data and its sources. Section 4 describes the results while the last section
concludes the paper.
II. Corporate Governance at Satyam – a background
Satyam Computer Services Limited (SCL), the Hyderabad, India based software comapny
was founded in 1987 by B Ramalinga Raju and his brother B Rama Raju. Ramalinga Raju,
the driving force behind Satyam, and served as its Chairman from 1995 to January 7, 2009
and served on several corporate boards, including those belonging to the Satyam group. He
served as Chairman of the National Association of Software and Service Companies
(NASSCOM) and a member of the International Advisory Panel of Malaysia's Multimedia
Super Corridor. He was the driving force behind the Hyderabad-based Emergency
Management Research Institute (EMRI). He served as Chairman and Member of
Governing Board of Emergency Management Research Institute. Among the many awards
received by him, he was awarded the Corporate Citizen of the Year award during the Asian
Business Leadership Summit held in Hong Kong in 2002. He was also named as the IT
Man of the Year by Dataquest in 2001 and was conferred the Entrepreneur of the Year
Award (Services) by Ernst & Young, India in 2000. He holds a Master of Business
Administration degree from Ohio State University and has attended Harvard Business
School’s Advanced Management Program.
Since its foundation in 1987 Satyam grew rapidly into a four billion dollar enterprise in two
decades riding on the Indian software wave. In 1991 it became a public limited company
and went for an IPO that was oversubscribed 17 times. In 1999 Satyam Infoway became
4
the first Indian Internet company to be listed on NASDAQ and in 2001, Satyam ADR was
listed on NYSE (SAY). By 2008 it was the fourth largest Indian software and BPO
company after giants like Infosys, TCS and Wipro. It had operations in several countries
around the globe and had clients like the World Bank, partners like GE and was selected
the Official IT Services provider for FIFA World Cups 2010 (South Africa) and 2014
(Brazil). It was chosen as the first company to ring the bell by the National Stock Exchange
in 2008. Months before the scandal happened, Satyam was awarded the Golden Peacock
Global Award for Excellence in Corporate Governance in 2008 by The World Council for
Corporate Governance (WCFCG). Previously, Investor Relations Global Rankings (IRGR)
had rated Satyam as the company with Best Corporate Governance Practices for 2006 and
2007. In short, on the eve of its crisis, Satyam was one of the brightest jewels in India’s
corporate crown in every way. It had a market capitalization of 3.98 billion US dollars at
the end of November 2008. It was also a zero-debt company with over $ 1.2 billion in cash
reserves.
Part of the reason for this reputation of Satyam was its stellar board. In late 2008 its non-
executive directors comprised leading academics from India and abroad including Prof.
Krishna Palepu of Harvard Business School, an authority on corporate governance, Vinod
Dhams, the inventor of Pentium chips at Intel, and former top bureaucrats from India. One
could hardly imagine a more competent assemblage of people to steer a corporation.
Trouble started on Dec 16, when its board approved of the acquisition of 100% stake in
privately-held Hyderabad-based Maytas Properties for $1.3 billion and a 51% stake in
public listed firm Maytas Infra for $300 million. The two firms represent the Raju family's
old construction and property business – Maytas is actually Satyam spelt backwards and is
run by the two sons of Satyam founder S Ramalinga Raju. The decision is an even bigger
surprise as Rajus had taken Maytas Infra public just one year back. As of September 31,
2008, promoters held 36.64% in Maytas Infra. The price being paid to the promoters was
fixed at Rs 475 per share, 1.25% discount to the closing price of the scrip on Dec 16. The
open offer will be made at Rs 525/share which is 7% premium to the ruling price as against
the 52 week high of Rs 946. This would be a completely unrelated acquisition by Satyam in
5
a sector that was arguably as troubled, if not more, than software, because of the credit
crunch.
Institutional shareholders resisted the deal from the word go. There was stiff opposition at
the conference call announcing the deal itself, particularly from FII players like Templeton.
The main objection was that it was not clear who had done the valuation of Maytas, why
Satyam should move into an unrelated industry already under severe stress. Besides the
Raju family connection looked like a clear “insider deal” to use shareholder money to bail
out Raju’s sons. Institutional investors went public on the media with their displeasure and
the Satyam ADRs opened 35% lower that morning at NYSE and declined further. With a
similar landslide expected in India the next morning, the management rescinded the
planned acquisition before Indian markets opened next morning, within eight hours of its
announcement of the deal itself. But the damage had been done. On December 17, the
Satyam story made headline news all over the Indian media and Satyam shares fell by
30.66% (from Rs. 226.55 to Rs. 157.10) and the Nifty 50 fell by 2.87%. This provides us
with the first instance of a corporate governance “shock” – related to board ineffectiveness
in monitoring management.
However, worse was in store for Satyam and its shareholders. The second, and bigger,
event happened on January 7 morning (while the markets in India were open) when
Ramalinga Raju, Satyam’s chairman, disclosed that the firm has been fudging its accounts
for several years and its much-vaunted $1.2 billion cash holding was largely non-existent
and the result of a long-drawn accounting fraud. Satyam shares fell by 77.47 % (from Rs.
178.65 at opening to Rs. 40.25 at close) on that day and the Nifty 50 fell by 6.18 %. Raju
and others – including two auditors from PWC – have been in police custody since. This
provides us with the second instance of a corporate governance “shock” – this time related
to accounting fraud and lax auditing.
The December 17 and the January 7 events thus provide us with two large, unexpected
corporate governance shocks concerning the same company but distinguishable in nature.
6
The first one was a shock about board ineffectiveness while the latter was one of
transparency and accounting malpractice.
III. Data and Methodology
The data for the analysis in this paper comes from CMIE’s Prowess database and the
Directors’ Database created under the initiative of the Bombay Stock Exchange and
designed and maintained by Prime Database. The objective of the analysis is to find out
what corporate governance variables had an effect in determining the cross-sectional
variation in the reaction of Indian companies to the two corporate governance shocks
discussed above.
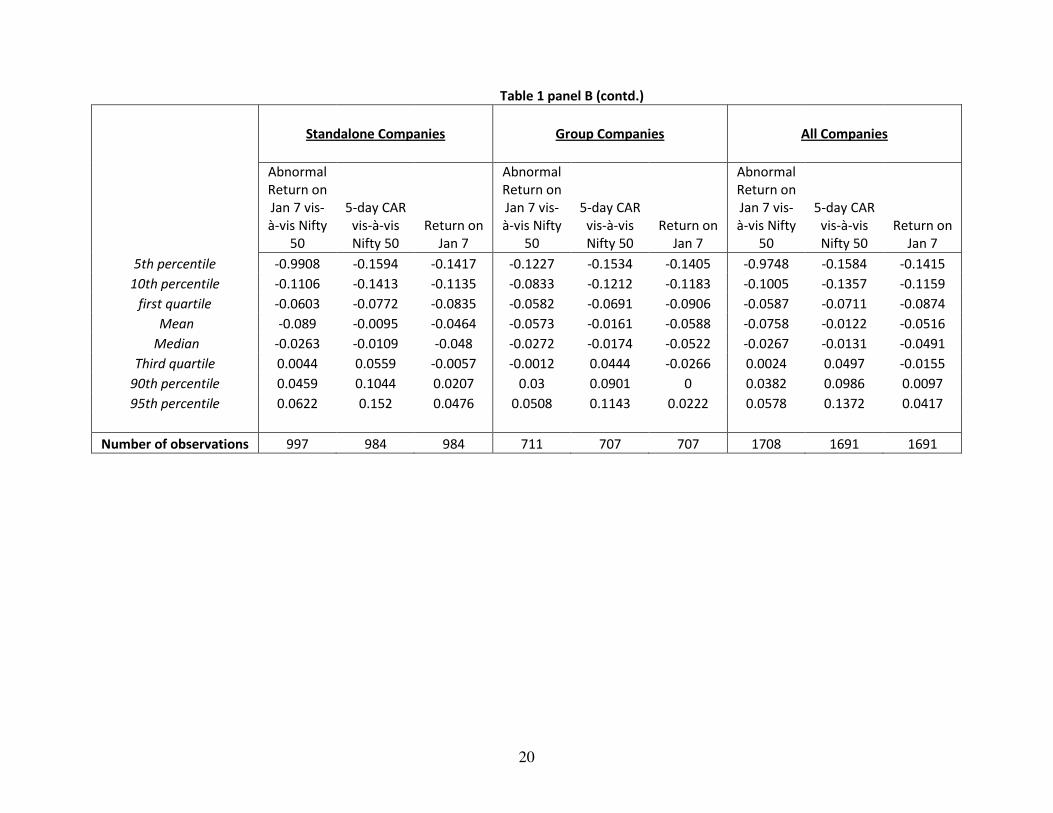
Consequently, our dependent variable is naturally, the individual returns on listed Indian
stocks on or after the two critical days – December 17 and January 7. We start off by
constructing the market adjusted abnormal returns around these two events and cumulate
the abnormal returns over a five day period encompassing two days before and two days
after each of the two events. Thus, Cumulative Abnormal Returns (CARs) over an event
window of ± 2 days around the event date forms the reference variable for our analysis,
though arguments can be made in favor of using raw returns as well as abnormal returns on
each of the specific event days of the shocks. We use these variables in our robustness
checks.
Our computation of the market adjusted abnormal returns follows the standard approach
used in the event study literature (see Barber and Lyon, 1997; Mitchell and Stafford, 2000
for instance). We compute daily returns using the closing prices of two consecutive trading
days using the formula Rt = (Pt – Pt-1)/Pt-1. We use returns on all stocks listed at the
National Stock Exchange as our starting point and use the Nifty 50 index to capture the
market returns. 250 daily returns ending on November 30, 2008 for each stock and the
respective indices are used to estimate the alphas and betas of the individual stocks and
hence the expected and abnormal returns on the two days of interest.
7
Having constructed the CARs, we order companies in terms of their CAR (companies with
highest CAR being at the top) and divide them into three equal groups (i.e., one third of the
observations). We consider the top and the bottom groups and estimate a Probit model to
examine if the probability of belonging to the top group (firms with the high CARs) is
influenced by corporate governance characteristics.
The choice of independent variables is far more open. The corporate governance literature
has dealt with several variables that may individually capture important elements of
corporate governance. Given that we are looking at a within-country variation, we abstract
from all institutional variables that are common to all stocks used in the analysis. Broadly
speaking, we look at a set of board related variables, a set of variables that capture the
ownership patterns, a set of variables that probe into the nature of auditors the firms use
and variables that look at the nature and composition of the audit committee. Our choice of
variables is, of course, motivated by our a priori expectations of drivers of stock reactions
– board related variables for the first shock which primarily brought focus on the
ineffectiveness of the board in restraining management from pushing through an insider
deal, and auditor and audit committee related variables for the second shock that pertains
mainly to accounting quality. Our choice is also influenced by the regulatory focus in
recent years in India, as elsewhere, on the composition of board and its audit committee in
improving corporate governance standards, so that we can comment on the extent to which
the market views these mechanisms as meaningful and effective institutions of corporate
governance in India.
Among the board related variables, we consider board size and board independence as
measured by the proportion of independent directors on the board. In addition we probe
deeper into the nature of the independent directors by looking at the tenure of the current
independent directors and their age to see if the market takes these variables into
considering in assessing the true independence of the board. Finally we look at the
accounting knowledge of the directors serving on the board. Using Prowess data, we
identify how many directors have at least a degree in accounting or finance that implies
knowledge of accounting.
8
The ownership pattern of the firm in question is likely to play a role in its nature of
corporate governance as well. Business groups constitute an important category in India
with related corporate governance issues. We look at whether the firm is belongs to a
business group or is a standalone firm. The share of promoters in the equity of a firm is
another likely important variable.
In addition to the board variables we pay special attention to the audit committee of the
board that supposedly plays an important role in determining the reliability of the firm’s
accounting information. We look at the proportion of independent directors in the audit
committee as well as the extent of accounting knowledge in the audit committee analogous
to the corresponding variable at the board level.
Finally, the auditors play a key role in corporate governance and are likely to be
particularly important when it comes to putting faith in the company’s financial numbers,
the critical issue in the second episode under consideration. We look at several variables
related to the auditors of the company. Given the fact that Satyam’s auditors, PWC, is
likely to have suffered a reputation loss following the scam we use a dummy variable to see
if PWC is an auditor of the company. The other Big 3 audit firms have a corresponding
dummy variable. A similar variable is constructed for the top 6 domestic audit firms as
well.
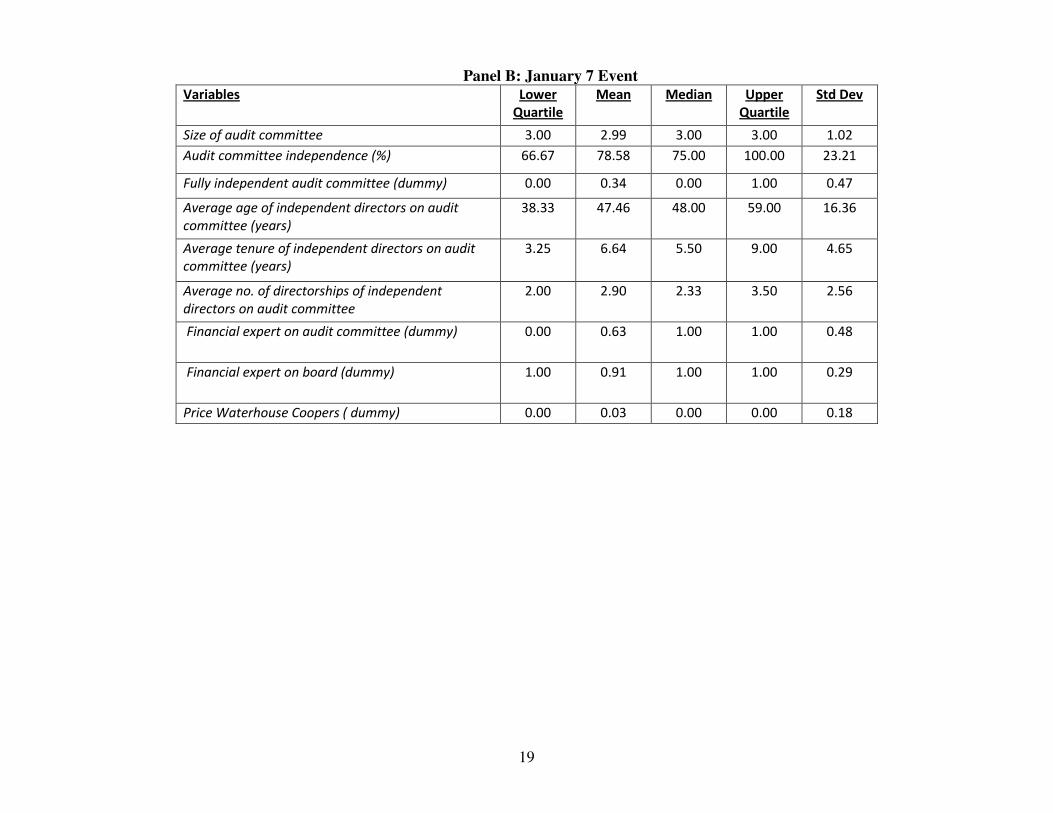
Table 1 provides the descriptive statistics of the variables used in the analysis.
IV. Results
a) The Dec 17 event:
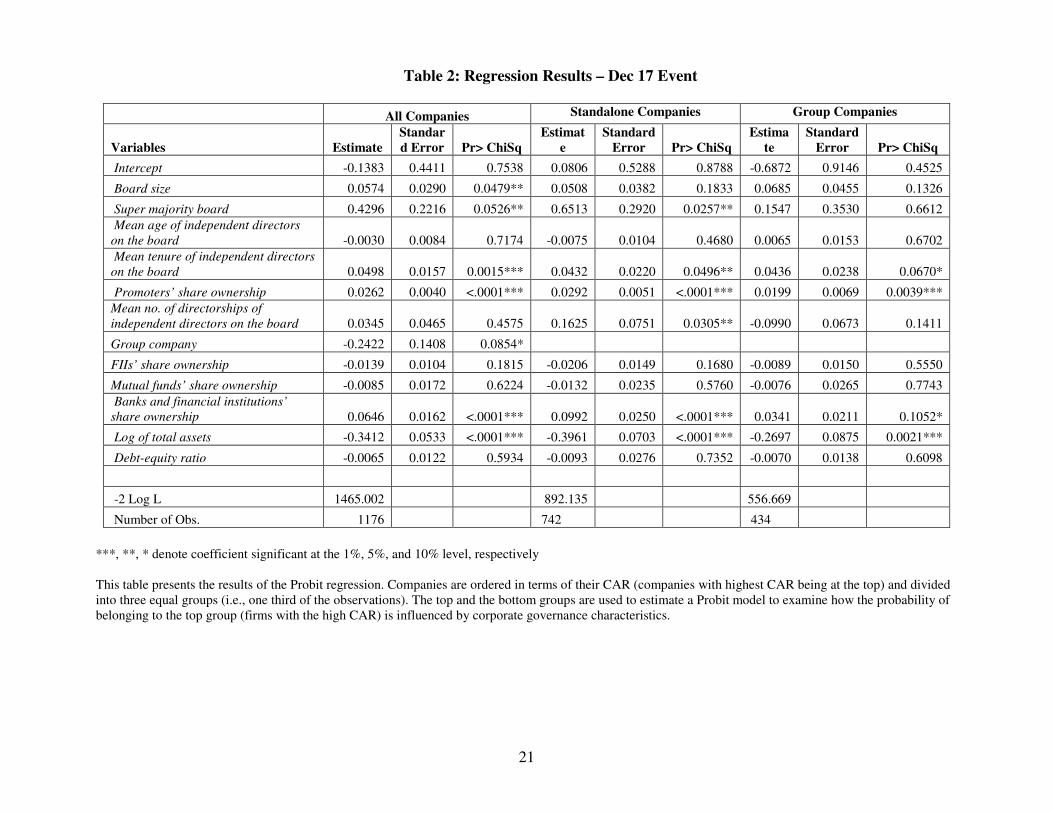
Table 2 shows the results of Probit regression for December 17. The regressions look at
various board-related variables as independent variables after adjusting for leverage and
industry controls for 21 industries. The rationale for this is that the December 16 board
meeting of Satyam approving of its acquisition plan for Maytas and the ensuing uproar
9
amidst international investors raised doubts, rightly or wrongly, about the ability of boards
to protect minority shareholders from the promoters. Hence the quality and role of
independent directors are likely to be key variables on that day.
Board size features in the list; documented evidence elsewhere has indicated its
importance. Board independence as measured by the proportion of independent variables is
another key variable. According to SEBI Clause 49 regulations, boards of companies with
an Executive Chairman or a Chairman who is a promoter or related to the promoter must
have at least 50% independent directors, while boards of other listed companies should
have at least one-third as independent directors.
We probe further into the characteristics of the independent directors to check if the
markets assess their quality and actual independence. We use age as an (imperfect)
indicator of experience and the tenure on the board as an indicator of de facto independence
with the assumption that a longer tenure on a board is likely to compromise a director’s
independence. Finally we look at another measure of board quality – the average number of
directorships held by the independent board members. It is difficult to sign this variable a
priori. Existing literature suggests that the number of board seats held by directors can
point both to their quality as well as their “busyness” indicating a positive and a negative
effect respectively on their quality.
Finally we look at a set of ownership variables. Promoter’s share comes first in this list as
prior research has indicated that high level of promoter ownership can act as a bonding
device with outside shareholders to signal the commitment of owners to maximize
shareholder value and not engage in the expropriation of minority shareholders.
Institutional ownership features next, broken up by institution type. Foreign Institutional
Investors (FIIs), Mutual Funds and Banks and Financial Institutions form the three different
categories of institutional investors.
Given that the Satyam event in December centered around fears of tunneling minority
shareholder’s funds by promoters through transfers to other group companies, we also run
10
our regressions separately for the two subsets – standalone firms and group firms – within
our sample.
Table 2 presents our results for the full sample as well as the sub-samples. The values in
parentheses are p-values computed using heteroscedasticity-consistent standard errors.
Findings:
The regression indicates several key findings.
1. Board size matters. Companies with bigger boards did better. This supports the
Naresh Chandra Committee recommendation to have a board of minimum size of 7. Forty
eight percent of the companies in our sample have board size less than seven. Note that this
does not mean unusually bigger boards will do better. The 95 percentile value in our
sample is 12. This is also consistent with the Companies Bill stipulation that board size be
capped at 12.
2. Companies with super-majority board (75 percent or more independent directors)
experienced higher CAR. In separate regressions not reported here, majority board turns
out to be insignificant. Market seems to give credence to “independent” directors only
when they have substantial voice.
3. Tenure is positive suggesting that the positive effects of directors’ experience
outweigh the negative effects of entrenchment and loss of independence from “familiarity
threat” that comes from long tenure.
4. Market reaction seemed to be favorable to companies with higher promoter share,
perhaps due to commitment. Note that promoters slowly divested their share ownership in
Satyam over time and by the time of the scam they had divested almost their entire equity
ownership.
5. Market penalized group companies. After all the controls, the group companies
fared significantly worse in CAR.
6. When we look separately into group and standalone companies most of the
significance of board related variables disappears. This could be an artifact of the selection
11
problem “independent” directors in group companies. Powerful promoters may choose
“independent” directors. This is possible for standalone companies also, but promoters of
group companies can appoint a person as independent directors in multiple companies in
the group. Thus the cost of dissention by independent directors is likely to be more in group
companies.
7. The market seems to reward the skill of independent directors (proxied by total
number of directorships) but only in standalone companies and not in group companies.
Similar results have been found in other research studies on India.
The overall take-away from the December 17 analysis is that while board independence
matters perhaps more important are the competence and expertise of the board matter.
However, promoter dominance may weaken the effectiveness of board independence.
These suggest that measures to strengthen board independence through mandating the
creation of “nomination committee”, proper definition of independence, and setting up an
effective board process for example, by having independent directors meet without the
management, may be helpful.
Our findings corroborate the somewhat mixed evidence found in the empirical literature
regarding board independence and firm performance. While some studies in the literature
find more independent boards to have a beneficial effect on firm performance (Dahya and
McConnell, 2003), and on discrete tasks such as hiring and firing of chief executive
officers (Weisbach, 1988), and hostile takeovers (Brickley et al., 1994), a significant
number of studies find results to the contrary (Bhagat and Black, 2002; Hermalin and Weisbach, 1991). Some of the studies done in the context of India seem to suggest that
more than board independence, it is the quality of the board as captured in terms of the
expertise and diligence of the independent directors (beneficial effect), CEO duality
(adverse effect), and the presence of controlling shareholders on board (adverse effect) that
matter more in corporate governance (Sarkar et al. 2008; Sarkar and Sarkar, 2009). Similar
views are also expressed on reviews of corporate governance practices based on company
surveys (Grant Thornton – Ficci, 2009).
12
b) The January 7 event
The January event, though involving a corporate governance issue for the same company,
is of a distinctly different nature as compared to the December event. Here the issue is that
of failure of auditing and the doubt it casts on accounting information about Indian firms,
large and small, across the board.
Consequently the independent variables used are different from the preceding analysis as
well. Here we focus on the nature of the auditor and characteristics of the audit committee
together with leverage, ownership variables and industry controls used above. We use a
dummy to capture the effect, if any, of having Price Waterhouse Coopers (PWC) as an
auditor. As for the audit committee, we use variables analogous to those used in the
regression above for the board – size, independence (proportion of independent directors),
mean age and tenure of audit committee members. Next we use the accounting expertise of
directors constituting the audit committee. Given that the Directors’ Database provides
information on the educational background of individual directors we calculate the number
and proportion of audit committee members who have an accounting, banking or
management degree signifying accounting knowledge. While this is certainly an imperfect
indicator of expertise in that it misses out on vast experience dealing with accounting at job
for many and may cast more faith in certain degrees than they deserve, it is a close
objective measure for what we are trying to capture, the ability of the committee to interact
with the auditors and pick up accounting errors, if any. We use dummy variables, one for
board and one for the committee, indicating if at least one director serving in it has the
necessary expertise.
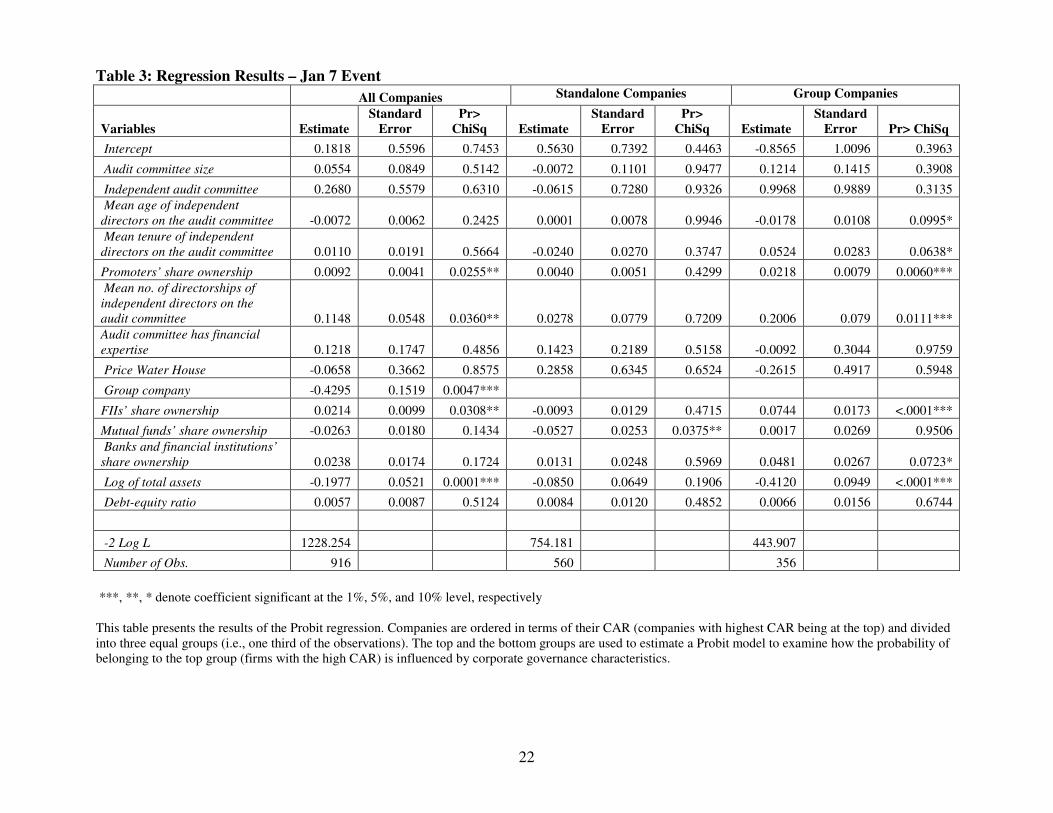
Table 3 reports the results of this regression analysis for the full sample results as well as
for the standalone and business group sub-samples. As in table 2, the values in parentheses
are p-values computed using heteroscedasticity-consistent standard errors. We report
results using the audit committee dummy for financial expertise as the results are invariant
if we use the board dummy instead.
13
Findings:
The major findings from Table 3 are summarized below:
1. Group companies got severely punished. The coefficient (-0.4295) is almost double
this time than in the December episode (-0.2422). This is expected as the January episode
raised a basic question of accounting-propriety. One could no longer trust the accounting
numbers. Problems likely to be exacerbated for group companies where prior research has
shown the existence of expropriation of minority shareholders through tunneling, related
party transactions and earnings management.
2. Promoter share remains positive and significant suggesting the importance of
commitment.
3. PriceWater House dummy is insignificant. Markets did not seem to penalize
companies for their PWC association. Accountants have the responsibility of verifying the
quality of income statements. Quality can be inferred only a deviations from benchmarks.
In Satyam’s case, accounting fraud was based on doctoring of the entire accounting chain,
altering the benchmark itself. Well planned, systematic. Perhaps the market gave the
benefit of doubt to PWC as a firm, concluding that it was no worse than its peers in the
trade.
4. Foreign institutional ownership continued to have a strong positive signaling effect
on firm quality, except for the sub-sample of standalone firms.
5. Independence of the audit committee does not seem to matter. Audit committee
quality (experience as proxied by tenure, and expertise as proxied by total directorships of
members) seems to matter, surprisingly perhaps, only for group companies. Perhaps in the
January episode, the market reacted to group companies only and variation among these.
Concepts like related party transactions and tunneling are far less applicable to stand alone
companies. The presence of a director with financial expertise in the audit committee did
not seem to matter either. Though the current Clause 49 regulations require all members of
the audit committee to be ‘financially literate’ with at least one member having ‘accounting
or related financial management expertise’ the definition of financial literacy namely the
14
“ability to read and understand basic financial statements” is perhaps too weak to send any
effective signal to the market about the financial qualification of the audit committee.
Our findings of the relative unimportance of audit committee independence and audit
committee financial expertise differ from the expectations created by the empirical
evidence existing in the empirical literature which has shown independent audit committees
to lead to higher earnings and audit quality (Klien, 2002; Carcello et al., 2002), and such
effects to be strengthened by the presence of independent directors in the audit committee
with corporate or financial background (Xie et al. 2003; Yeh and Woidtke, 2007;).
Conclusions
We analyze the cross-sectional variation in individual stock returns in India on two specific
days when the market was hit by news of significant corporate governance failure in a
major Indian company that made national headlines for extended periods. We investigate
whether the variation can be explained by corporate governance variables frequently
mentioned in the literature particularly those related to the board, ownership patterns and
auditor/audit committee variables. These are also generally the measures that the Indian
stock market regulator SEBI, like its peers elsewhere in the world, has focused on in
bringing about corporate governance reforms in recent years.
We find that on the first instance – with a shock about board effectiveness – firms with
mid-to-large boards did better in the marketplace. As for independence, a supermajority
(three-quarters or more) of independent directors mattered, but a simple majority did not.
The average board tenure of a director had a positive, not negative, effect, suggesting
experience beats familiarity in the market’s perception. Higher promoter share appears to
instill confidence, as do size.
On the second episode, signaling an audit failure, neither the size nor the independence of
the audit committee seemed to matter. Promoter and FII holding had positive impact in the
15
entire sample as well as for group firms. Size had similar effects as well. Interestingly,
PWC did not seem to carry a stigma that tainted its clients significantly.
In both cases, a group association seemed to flag greater concerns for the market, markedly
more so with the audit shock than the board shock.
This paper provides a first-cut analysis of impact of corporate governance perception
shocks to different firms. It seems to suggest that the market’s perception of corporate
governance indicators are not necessarily in complete agreement with the list of “usual
suspects” frequently discussed in the literature and targeted by regulators. It is possible that
the ground-level realities of an emerging market environment like India’s and the dynamics
of board selection and decision-making reduce or modify the manner in which these
variables are said to work in countries marked by arm’s length transactions. In particular
there seems to be considerable gap between the market’s view and conventional wisdom
regarding the importance of independent directors. The analysis suggests that, perhaps
more than board and audit independence per se, it is the quality and expertise of the board
and the audit committee, and the process of selection of independent directors and the
setting up of an effective board and audit process that are important for effective
governance.
Naturally, a lot remains to be done to advance this line of enquiry. Can independent
directors provide effective corporate governance in companies with promoter dominance as
is typical of India and many East Asian corporations?? Does their contribution depend
upon the regulatory environment that varies across countries? Do big name audit firms
provide a remedy to lax de facto accounting and auditing standards? How strong is the
effect of auditor reputation on a firm’s returns? These and many such questions need to be
understood for a better understanding as well as effective regulation of emerging market
firms. The event-study methodology adopted here may provide answers to some, though
not all such questions.
16
References
Barber, Brad M. and John D. Lyon, 1997, Detecting long-run abnormal stock returns: the empirical power and specification of test statistics, Journal of Financial Economics 43: 341-37 Bhagat, Sanjai and Bernard Black, (2002), “The non-correlation between board independence and long- term firm performance,” The Journal of Corporation Law, Vol. 27, 231-273.
Brickley, J.A., J.L. Coles, and R.L. Terry, 1994, "Outside Directors and the Adoption of Poison Pills," Journal of Financial Economics, Vol. June, 371-390.
Carcello et al. (2002), “Board Characteristics and Audit Fees,” Contemporary Accounting Research, Vol. 19(3), 365-84.
Dahya, J. and McConnell (2003), “Board composition, corporate performance, and the Cadbury Committee recommendation,” Working Paper No. 2003-003, Purdue University. Grant Thornton - Ficci (2009), “CG Review 2009: India 101-500,” Grant Thornton India.
Hermalin, Benjamin E. and Michael S. Weisbach, 1991, The effects of board composition and direct incentives on firm performance, Financial Management, Vol. 20, 101-112. Klein, April (2002), “Audit committee, board of director characteristics, and earnings management,” Journal of Accounting and Economics, Vol. 33, 375-400.
Mitchell, M. L. and E. Stafford, 2000, Managerial decisions and long-term stock price performance, Journal of Business 73(3): 287-329 Sarkar, J., S. Sarkar and K. Sen (2008), “Board of directors and opportunistic earnings management: Evidence from India,” Journal of Accounting, Auditing and Finance, Vol. 23(4).
Sarkar J. and S. Sarkar (2009), “Multiple board appointments and firm performance in emerging economies: Evidence from India,” Pacific Basin Finance Journal, Vol. 17(2), 271-293. Weisbach, M.S., (1988), “Outside directors and CEO turnover,” Journal of Financial Economics, Vol. 20, 431-460. Xie, Biao; Wallace III Davidson, and Peter J. DaDalt (2003), “Earnings management and corporate governance: the role of the board and the audit committee,” Journal of Corporate Finance, Vol. 9, 295-316. Yeh, Yin-Hua and Traice Woidtke (2007), “Corporate Governance and the Informativeness of Accounting Earnings: The Role of the Audit Committee,” working paper.
Super majority board 0.4296 0.2216 0.0526** 0.6513 0.2920 0.0257** 0.1547 0.3530 0.6612 Mean age of independent directors on the board -0.0030 0.0084 0.7174 -0.0075 0.0104 0.4680 0.0065 0.0153 0.6702 Mean tenure of independent directors on the board 0.0498 0.0157 0.0015*** 0.0432 0.0220 0.0496** 0.0436 0.0238 0.0670*
Promoters’ share ownership 0.0262 0.0040 <.0001*** 0.0292 0.0051 <.0001*** 0.0199 0.0069 0.0039*** Mean no. of directorships of independent directors on the board 0.0345 0.0465 0.4575 0.1625 0.0751 0.0305** -0.0990 0.0673 0.1411
***, **, * denote coefficient significant at the 1%, 5%, and 10% level, respectively This table presents the results of the Probit regression. Companies are ordered in terms of their CAR (companies with highest CAR being at the top) and divided into three equal groups (i.e., one third of the observations). The top and the bottom groups are used to estimate a Probit model to examine how the probability of belonging to the top group (firms with the high CAR) is influenced by corporate governance characteristics.
22
Table 3: Regression Results – Jan 7 Event All Companies Standalone Companies Group Companies
***, **, * denote coefficient significant at the 1%, 5%, and 10% level, respectively This table presents the results of the Probit regression. Companies are ordered in terms of their CAR (companies with highest CAR being at the top) and divided into three equal groups (i.e., one third of the observations). The top and the bottom groups are used to estimate a Probit model to examine how the probability of belonging to the top group (firms with the high CAR) is influenced by corporate governance characteristics.
23
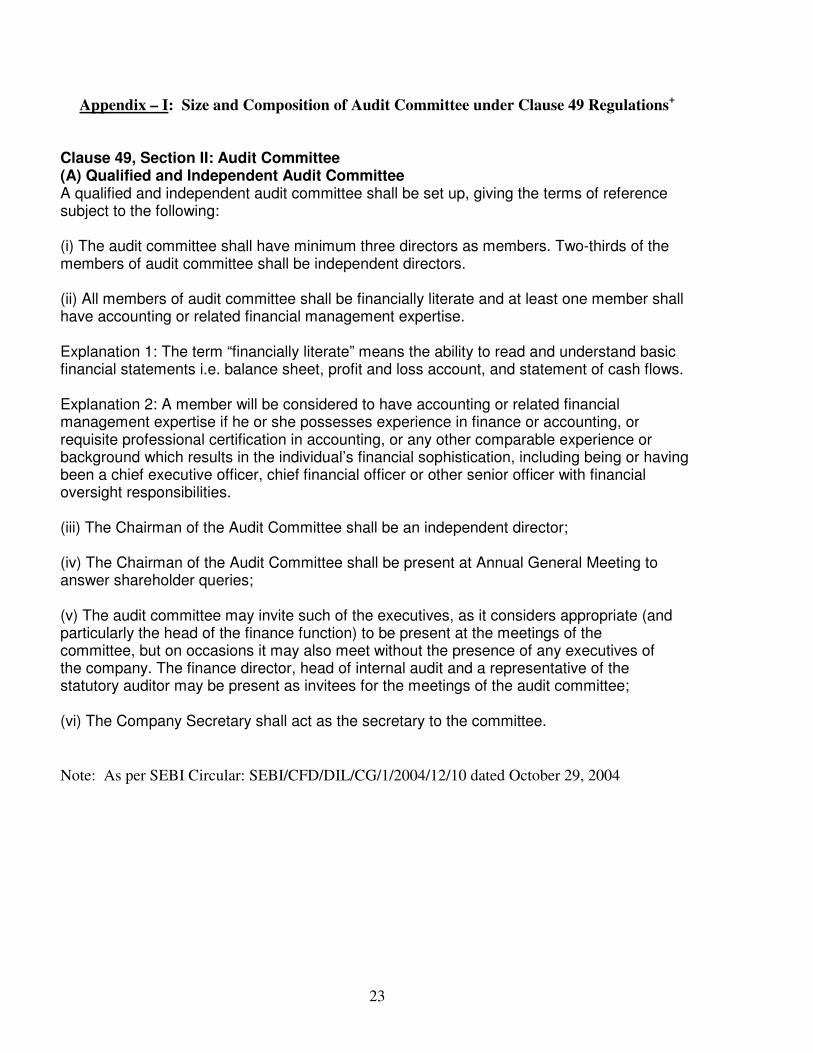
Appendix – I: Size and Composition of Audit Committee under Clause 49 Regulations+ Clause 49, Section II: Audit Committee (A) Qualified and Independent Audit Committee A qualified and independent audit committee shall be set up, giving the terms of reference subject to the following: (i) The audit committee shall have minimum three directors as members. Two-thirds of the members of audit committee shall be independent directors. (ii) All members of audit committee shall be financially literate and at least one member shall have accounting or related financial management expertise. Explanation 1: The term “financially literate” means the ability to read and understand basic financial statements i.e. balance sheet, profit and loss account, and statement of cash flows. Explanation 2: A member will be considered to have accounting or related financial management expertise if he or she possesses experience in finance or accounting, or requisite professional certification in accounting, or any other comparable experience or background which results in the individual’s financial sophistication, including being or having been a chief executive officer, chief financial officer or other senior officer with financial oversight responsibilities. (iii) The Chairman of the Audit Committee shall be an independent director; (iv) The Chairman of the Audit Committee shall be present at Annual General Meeting to answer shareholder queries; (v) The audit committee may invite such of the executives, as it considers appropriate (and particularly the head of the finance function) to be present at the meetings of the committee, but on occasions it may also meet without the presence of any executives of the company. The finance director, head of internal audit and a representative of the statutory auditor may be present as invitees for the meetings of the audit committee; (vi) The Company Secretary shall act as the secretary to the committee. Note: As per SEBI Circular: SEBI/CFD/DIL/CG/1/2004/12/10 dated October 29, 2004