CORPORATE GOVERNANCE PRACTICES AND PERFORMANCE OF SMALL SCALE TEA PROCESSING COMPANIES IN KENYA KEMEI RAYMOND KIPKOECH A RESEARCH PROJECT SUBMITTED IN PARTIAL FULFILLMENT OF THE REQUIREMENTS FOR THE AWARD OF THE DEGREE OF MASTER OF BUSINESS ADMINISTRATION, SCHOOL OF BUSINESS, UNIVERSITY OF NAIROBI NOVEMBER, 2011
Transcript
CORPORATE GOVERNANCE PRACTICES AND PERFORMANCE
OF SMALL SCALE TEA PROCESSING COMPANIES IN KENYA
KEMEI RAYMOND KIPKOECH
A RESEARCH PROJECT SUBMITTED IN PARTIAL FULFILLMENT OF THE
REQUIREMENTS FOR THE AWARD OF THE DEGREE OF MASTER OF
BUSINESS ADMINISTRATION, SCHOOL OF BUSINESS, UNIVERSITY OF
NAIROBI
NOVEMBER, 2011
DECLARATION
I declare that project is my original work and has not been presented for academic
award in any other learning institution.
Kemei Raymond Kipkoech
Registration Number: D6I/73736/2009
This research project has been submitted for examination with my approval as the
research supervisor.
Dr Machuki Vincent.
Department Of Business Administration
School Of Business
University Of Nairobi
i
DEDICATION
This research project is dedicated to Spouse Beatrice, my children, Ashley, Leans, Joy
and Abigael for their understanding and moral support throughout my studies.
n
ACKNOWLEDGEMENT
I would like extend my sincerest thanks to the staff and lectures of the SOB UON-
Kisumu Campus, all of whom were very supportive through my studies.
I would also like to thank my supervisor Dr Vincent N. Machuki who provided
guidance throughout the research project process. Your directions are invaluable. To
the coordinator Kisumu campus Mr. Jaleha thanks a lot
I am especially thankful my fellow students Monari, Fridah, Paul Martin, Liposhe,
and Felistus. We shared a lot over the period.
To my wife Beatrice for the support of taking care of the babies. Lastly my bosses
Ernest, Munyi and now Naftali and Nyakoe and friends who have graciously allowed
me to take the many extra hours needed to accomplish my studies and this research
project.
Respondents, the KTDA fraternity, and all those who allowed me use of company
data, facilities and time to accomplish the objective, I most sincerely thank you all.
m
A B ST R A C T
The study looked the corporate governance practices and the performance in small
scale tea factory companies in Kenya. Companies are continuously under immense
pressure to maintain superior performance in areas of finance, operations and growth
as well as the non financial parameters. Good cooperate governance is linked to
superior forms’ performance Corporate governance is concerned with key areas of
Organization responsibility to the shareholders, management leadership within
organization and issues of transparency, accountability and efficient utilization of
resources. The study used a cross-sectional descriptive survey design. This design
research was informed by the set up of the tea industry and specifically the target
small scale sector as well as the number of companies that were involved in the study
and the need to conduct comparative analysis. The objectives of the study were to
establish the corporate governance practices in the small scale teas processing
companies and the influence it has on organizational performance. The study set to
gather both primary and secondary data by way of questionnaire and secondary data
which were obtained from the managing agent of the companies. To achieve the
purpose of the objectives of the study, corporate governance practice was based on the
best code of practice guidelines while performance was base on the balance scorecard
and other four key areas of performance measurement; quality, Percentage of total
income payout to grower, final payment rate in Kenya shillings per Kilogram of green
leave and market price per kilogram of made tea the study utilized. Both descriptive
statistics and correlation analysis through regression of key performance indicators
against six corporate governance practices was presented in the summarized
regression statistics for the From findings the small scale tea sector has establish,
implemented the corporate governance practices and adopted at various levels their
applications, which have influenced the operations and decision making of the
companies hence influencing the organizational performance of the tea processing
Companies in Kenya. It was concluded that corporate governance best code of
practice provides a structured approach to the principle agent arrangement. The
practices as adopted in the small scale tea industry from the findings are extensively
applied. However certain aspects have not been fully appreciate by some players thus
discrepancies in application and also benefit derivation as show by the wide
IV
performance indicator bases established. Some factories exhibited high level of
corporate governance practice while others presented weak practices this in
correlation to the performance against exhibited variance
v
TABLE OF CONTENTSDeclaration............................................................................................................... i
Dedication................................................................................................................ ii
Acknowledgement................................................................................................... iii
Abstract..................................................................................................................... iv
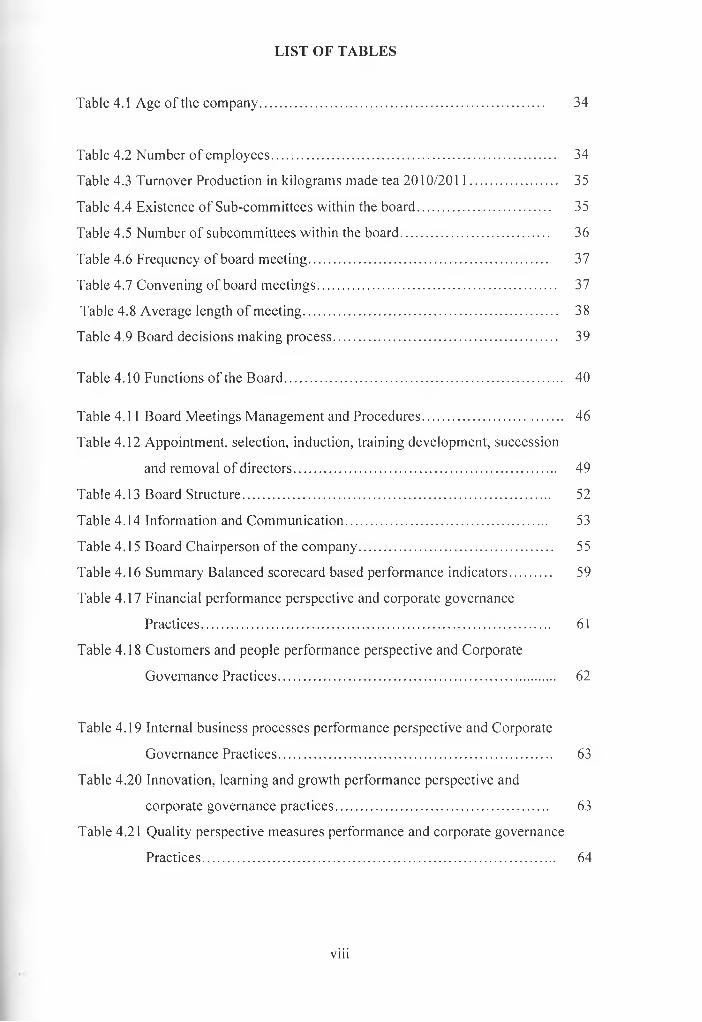
Table of contents...................................................................................................... vi
List of tables............................................................................................................ viii
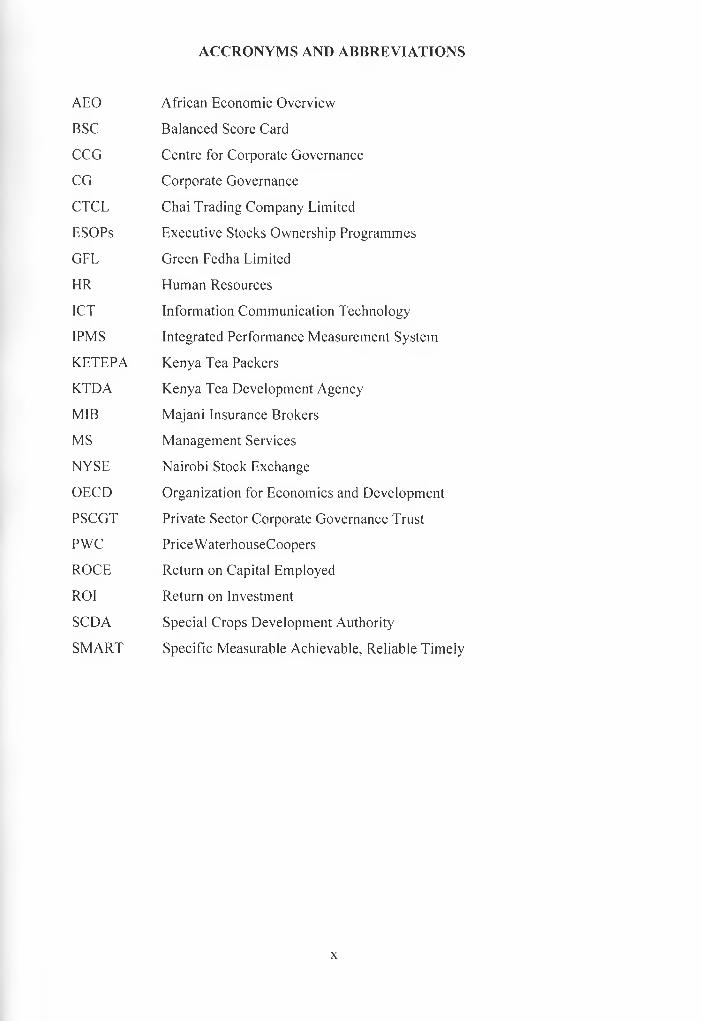
Acronyms and abbreviations................................................................................. x
Further respondent were asked to indicate the average time meetings took in their
companies, scoring between below 2 hours for the shortest time and over 9 hours for the
longest. In table 4.2.8 one company indicated their meetings lasted less than two hours on
average, a majority at 75.8% of the responses indicated the meetings lasted a between 3
and 5 hours while 21.2 percent held meetings between six and eight hours. None had
meetings beyond 9 hours. Time management is key is operations, professional meeting
take two to three hours for quality deliberations, Long hours indicate poor planning, lack
of coherence on agenda and import of irrelevant issues. This impedes the value of the
board and the management engagement.
38
T a b le 4 .9 B o a rd d ec is io n s m ak in g process
Frequency PercentConsensus 32 97.0Missing 1 3.0Total 33 100.0
Source: Research Data (2011)
The study as a crucial indicator to the boards mandate and a key performance pillar of
corporate governance practice sought to now from the respondents the method of making
key decisions in the board. Respondent were required to indicate if the decisions were by
consensus or by vote. From the table 4.2.9 most board arrived at crucial decisions by
consensus. One respondent did not indicate. Harmony in deliberation and decisions
means the companies get to benefit from unity of purpose. Critical issues get to be
deliberated to the satisfaction of all interests. It is also a sign o f understanding of issues
before the board. Group-think should however not be encouraged.
4.3 Corporate Governance Practices
The first objective o f the study was to establish the corporate governance practice by the
small scale tea processing companies in Kenya. In achieving this objective the study was
designed to obtain data on part two o f the questionnaire on the corporate governance
practices based on the best code of practice guidelines for corporate governance as issued
by the centre for corporate governance in Kenya. Six key functions of corporate
governance: Functions of the Board; Board Meetings; Management and Procedures;
Appointment, Selection, Induction, Training Development, Succession and Removal of
Directors; Board Structure; Information and Communication and Board Chairperson of
39
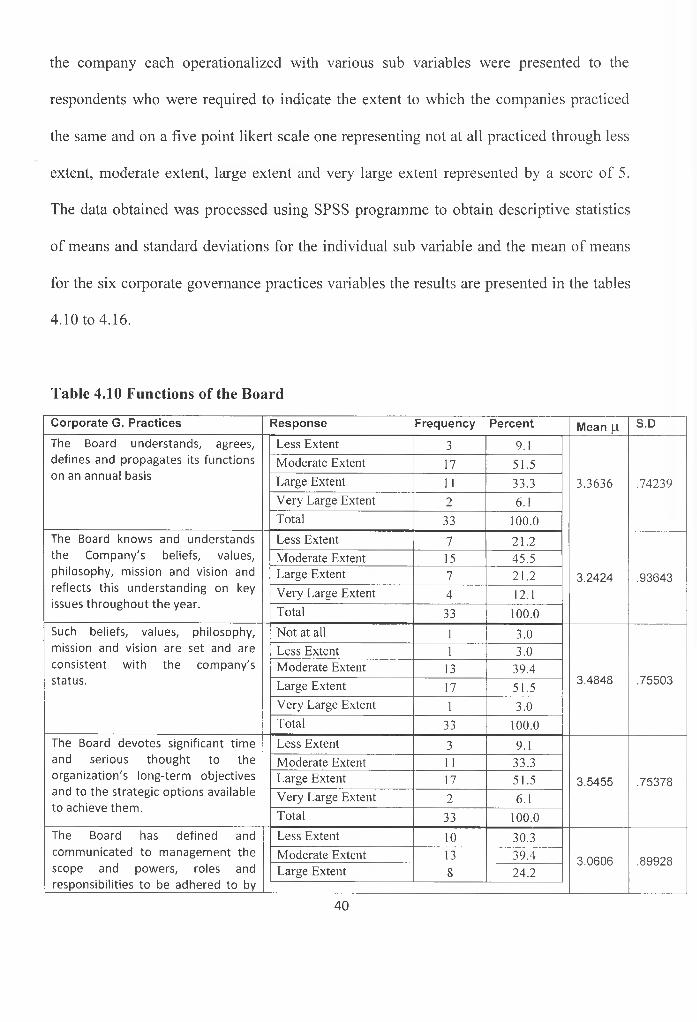
the company each operationalized with various sub variables were presented to the
respondents who were required to indicate the extent to which the companies practiced
the same and on a five point likert scale one representing not at all practiced through less
extent, moderate extent, large extent and very large extent represented by a score of 5.
The data obtained was processed using SPSS programme to obtain descriptive statistics
of means and standard deviations for the individual sub variable and the mean of means
for the six corporate governance practices variables the results are presented in the tables
4.10 to 4.16.
Table 4.10 Functions of the Board
C o rp o ra te G . P ra c tic e s R e s p o n s e F re q u e n c y P e rc e n t M e a n p S .D
The Board understands, agrees, defines and propagates its functions on an annual basis
L e ss E x te n t 3 9.1
3 .3 6 3 6 .7 4 2 3 9
M o d e ra te E x te n t 17 51 .5
L a rg e E x te n t 11 3 3 .3
V e ry L a rg e E x te n t 2 6.1
T o ta l 33 100 .0
The Board knows and understands the Company's beliefs, values, philosophy, mission and vision and reflects this understanding on key issues throughout the year.
L e ss E x te n t 7 2 1 .2
3 .2 4 2 4 .9 3 6 4 3
M o d e ra te E x te n t 15 4 5 .5L a rg e E x te n t 7 2 1 .2
V e ry L a rg e E x te n t 4 12.1
T o ta l 33 100 .0
Such beliefs, values, philosophy, mission and vision are set and are consistent with the company's status.
N o t a t a ll 1 3 .0
3 .4 8 4 8 .7 5 5 0 3
L e ss E x te n t 1 3 .0M o d e ra te E x te n t 13 3 9 .4
L a rg e E x te n t 17 5 1 .5
V e ry L a rg e E x te n t 1 3 .0
T o ta l 33 100 .0
The Board devotes significant time and serious thought to the organization's long-term objectives and to the strategic options available to achieve them.
L e ss E x te n t 3 9.1
3 .5 4 5 5 .7 5 3 7 8
M o d e ra te E x te n t 11 3 3 .3L a rg e E x te n t 17 5 1 .5
V e ry L a rg e E x te n t 2 6.1
T o ta l 33 100 .0
The Board has defined and communicated to management the scope and powers, roles and responsibilities to be adhered to by
L e ss E x te n t 10 3 0 .3
3 .0 6 0 6 .8 9 9 2 8M o d e ra te E x te n t 13 3 9 .4L a rg e E x te n t 8 2 4 .2
40
management to meet routine and exceptional circumstances.
V e ry L a rg e E x te n t 2 6.1
T o ta l 33 100 .0
The majority of the Boards time is not spent on issues of day-to-day management.
N o t a t all 4 12.1
3 .1 8 7 5 1 .3 0 6 0 0
L e ss E x te n t 6 18.2
M o d e ra te E x te n t 8 2 4 .2
L a rg e E x te n t 8 2 4 .2
V e ry L a rg e E x te n t 6 18.2
M is s in g 1 3 .0
T o ta l 33 100 .0
The Board is involved in formulating long-range strategy from the beginning of the end of planning cycle.
N o t a t a ll 2 6.1
3 .5 4 5 5 1 .0 6 3 3 4
L e ss E x te n t 4 12.1
M o d e ra te E x te n t 5 15.2
L a rg e E x te n t 18 54 .5
V e ry L a rg e E x te n t 4 12.1
T o ta l 33 1 0 0 .0
The Board ensures that the organization has sufficient and appropriate resources to achieve its strategic goals.
L e ss E x te n t 2 6.1
3 .9 3 9 4 .8 2 6 8 7
M o d e ra te E x te n t 6 18.2
L a rg e E x te n t 17 5 1 .5
V e ry L a rg e E x te n t 8 2 4 .2
T o ta l 33 100 .0
Proposals from management are analyzed and debated vigorously before being approved by the Board. A proposal that is considered inappropriate is declined.
L e ss E x te n t 3 9.1
3 .8 1 8 2 .84611
M o d e ra te E x te n t 6 18.2
L a rg e E x te n t 18 54 .5
V e ry L a rg e E x te n t 6 18.2
T o ta l 33 100 .0
The Board has an operating plan that specifies its functions, activities and objectives.
N o t a t a ll 1 3 .0
3 .5 1 5 2 .83371
L e ss E x te n t 1 3 .0M o d e ra te E x te n t 14 4 2 .4
L a rg e E x te n t 14 4 2 .4
V e ry L a rg e E x te n t 3 9.1
T o ta l 33 10 0 .0
When appropriate, the Board seeks counsel from professional advisors.
N o t a t all 3 9.1
3 .6 6 6 7 1 .1 9 0 2 4
L e ss E x te n t 4 12.1L a rg e E x te n t 2 0 6 0 .6
V e ry L a rg e E x te n t 6 18.2
T o ta l 33 100 .0
The CEO's remuneration and performance is reviewed and determined by the Board.
N o t a t a ll 7 2 1 .2
1 .8 4 8 5 1 .2 7 7 7 2
L e ss E x te n t 13 3 9 .4
M o d e ra te E x te n t 7 2 1 .2
L a rg e E x te n t 5 15.2
V e ry L a rg e E x te n t 1 3 .0
T o ta l 33 100 .0
The Board determines, annually, the objectives and measurement criteria for the CEO.
L e ss E x te n t 5 15.2
2 .3 9 3 9 1 .0 8 7 9 9M o d e ra te E x te n t 8 2 4 .2
L a rg e E x te n t 17 51 .5
41
V e ry L a rg e E x te n t 3 9.1
T o ta l 33 100 .0
A broad range of appropriate performance indicators are used to monitor the performance of management. Reliability is not placed solely on the financial statements provided by management.
L ess E x te n t 6 18.2
3 .3 3 3 3 .8 8 9 7 6
M o d e ra te E x te n t 13 3 9 .4
L a rg e E x te n t 11 3 3 .3
V e ry L a rg e E x te n t 3 9.1
T o ta l 33 100 .0
The Board has identified the groups to which it is Accountable and Responsible
L ess E x te n t 5 15.2
3 .5 4 5 5 .8 6 9 3 0
M o d e ra te E x te n t 8 2 4 .2
L a rg e E x te n t 17 51 .5
V e ry L a rg e E x te n t 3 9.1
T o ta l 33 100 .0
The Board understands and agrees that its first duty is to the Company, Members and shareholders and Others in that order
N o t a t a ll 1 3 .0
3 .6 3 6 4 .9 2 9 3 2
L e ss E x te n t 2 6.1M o d e ra te E x te n t 10 30 .3
L a rg e E x te n t 15 4 5 .5
V e ry L a rg e E x te n t 5 15.2
T o ta l 33 100 .0
Board activities are conducted in an atmosphere of creative tension.
N o t a t all 3 9.1
3 .2 4 2 4 1 .1 4 6 4 7
L ess E x te n t 6 18.2M o d e ra te E x te n t 7 2 1 .2
L a rg e E x te n t 14 4 2 .4
V e ry L a rg e E x te n t 3 9.1
T o ta l 33 100 .0
The Board has procedures in place to ensure that the organization is meeting its legal responsibilities.
N o t a t all 1 3 .0
3 .6 3 6 4 .9 9 4 3 0
L e ss E x te n t 3 9.1M o d e ra te E x te n t 9 2 7 .3
L a rg e E x te n t 14 4 2 .4
V e ry L a rg e E x te n t 6 18.2
T o ta l 33 100 .0
Formal review of the Board's performance has become an integral part of the culture of the Board.
N o t a t all 5 15.2
2 .5 7 5 8 .9 3 6 4 3
L ess E x te n t 9 2 7 .3M o d e ra te E x te n t 14 4 2 .4
L a rg e E x te n t 5 15.2
T o ta l 33 100 .0
The Board ensures that key members of management are brought into the Board meetings so that they can participate and add value to their deliberations and work on behalf of the Board.
L ess E x te n t 5 15.2
3 .5 9 3 7 .87471
M o d e ra te E x te n t 6 18.2L a rg e E x te n t 18 5 4 .5
V e ry L a rg e E x te n t 3 9.1
M iss in g 1 3 .0
T o ta l 33 10 0 .0
The Board ensures all conflicts are Declared and Resolved
L e ss E x te n t 5 15.23 .6061 .8 9 9 2 8M o d e ra te E x te n t 7 2 1 .2
42
L a rg e E x te n t 17 5 1 .5
V e ry L a rg e E x te n t 4 12.1
T o ta l 33 100 .0
Every Board member has been supplied with a letter of appointment.
N o t a t all 7 2 1 .2
3 .4 8 4 8 1 .5 2 3 1 8
L ess E x te n t 2 6.1M o d e ra te E x te n t 2 6.1
L a rg e E x te n t 12 3 6 .4
V e ry L a rg e E x te n t 10 30 .3
T o ta l 33 100 .0
The letter of appointment defines the roles and functions of the Board and the specific role of each director.
N o t a t all 9 2 7 .3
2 .6 6 6 7 1 .4 0 6 8 3
L ess E x te n t 8 2 4 .2M o d e ra te E x te n t 5 15.2
L a rg e E x te n t 7 2 1 .2
V e ry L a rg e E x te n t 4 12.1
T o ta l 33 100 .0
Source: Research Data (2011)
The study sought to establish the extent to which the functions of the board were practice
by the companies. The respondents were presented with twenty three variables that
constitute the practices o f function of the board and were required to score each on a 5
point likert scale stretching from practice of ’’not at all” to practiced to “very large
extent”. The study further calculate the means and standard deviation of each of the
postulate practice of function of the board to obtain the mean rating and the variation of
the same from respondent to respondent
On the matter of the Board understands, agrees, defines and propagates its functions on
an annual basis, 9.1% indicate practiced to a less extent, 51.5% to a moderate extend
while 33% and 6.1% to a large and very large extend respectively.
As to the practice; the Board knows and understands the Company’s beliefs, values,
philosophy, mission and vision and reflects this understanding on key issues throughout
the year 3% don’t practice it at all another 3% to a less extent, 42.4% to a moderate and
43
large extent and 9.1% to a very large extent. Such beliefs, values, philosophy, mission
and vision are set and are consistent with the company’s status by the company where
4.1% don’t practice at all, 12.1% to less extent, 60.6% to a very large extent and 18.2% to
a very large extent. As to the matter; the Board devotes significant time and serious
thought to the organization’s long-term objectives and to the strategic options available to
achieve them the respondents indicated that 9.1% was to a less extent, 33.2% to a
moderate extent, 51.5% to a large extent and 6.1% to a very large extent. When the
matter of; The Board has defined and communicated to management the scope and
powers, roles and responsibilities to be adhered to by management to meet routine and
exceptional circumstances was put to the respondents, 30.3% indicate it was practiced to
a less extend, 39.4 to a moderate extent, 24.2% to large extend and 6.1% to a very large
extend.
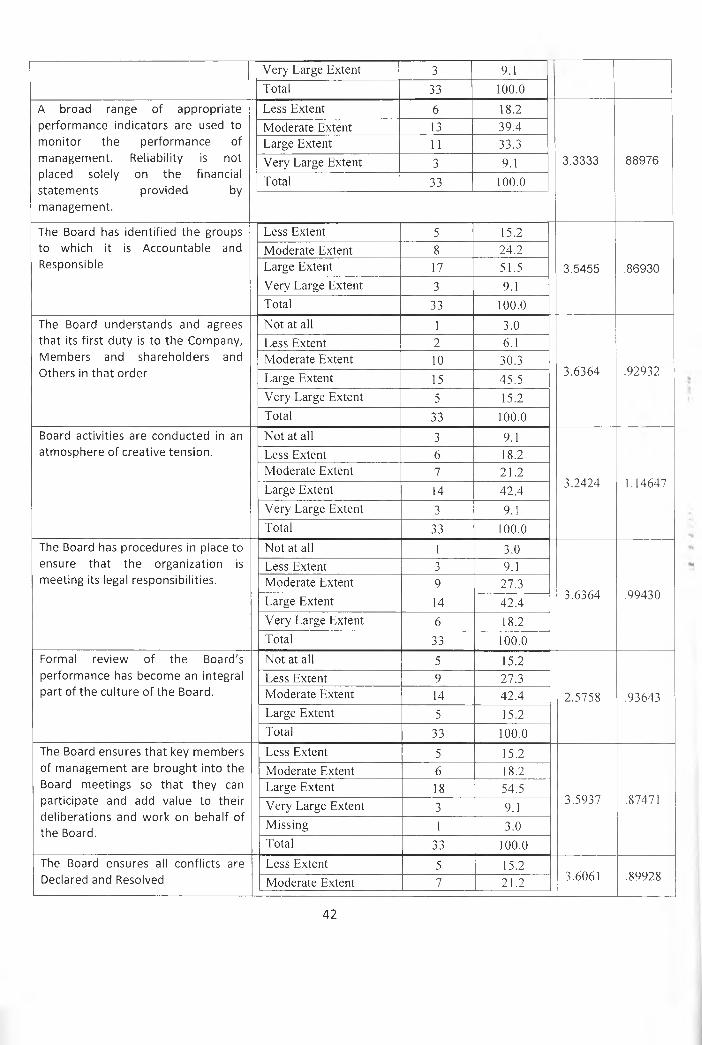
The respondents on the matters; Proposals from management are analyzed and debated
vigorously before being approved by the Board 9.1% practiced it to a less extent, 18.2%
to a moderate extent, 54.4 to a large extent and 18.2 to a very large extent.. A proposal
that is considered inappropriate is declined. To the issue if Board understands and agrees
that its first duty is to the Company, Members and shareholders and others in that order the
respondents indicated that 3% of the company practiced it to no extent 6.1 to a less
extent, 30.3% to a moderate extent and 45.5 and 25.2% to large and very large extents
respectively
Two issues put to the respondents; the CEO’s remuneration and performance is reviewed
and determined by the Board and the Board determines, annually, the objectives and
44
measurement criteria for the CEO, the indications were that 21.25 did not practice it at
all, 39.4% to a less extent, 21.2% to a moderate extent 15.2% to a large extent, 3.2% to a
very large extent and 15.2% to a less extent 24.2 to a moderate extent, 51.5% to large
extent, 9.1% to a very large extent respectively. The question of Formal review of the
Board’s performance has become an integral part of the culture of the Board was placed
to the respondents and showed that 15.2% did it to no extent at all, 27.3% to a less extent,
42.4% to a moderate extend and 15,2% to large extent. On the matter of the letter of
appointment defines the roles and functions of the Board and the specific role of each
director 27.3% had indicates not practiced at all, 24.2% practiced to a less extent, 15.2%
to a moderate extent.
From table 4.3.1, The Board ensures that the organization has sufficient and appropriate
resources to achieve its strategic goals. This was indicated the most practices function of
the board with a mean score of 3.9394 and a standard deviation of 0.82687. Boards are
thoroughly alive to the responsibility they are bestowed with when they are appointed to
the board of companies. Also noted to be highly practiced was the matter of Proposals
from management are analyzed and debated vigorously before being approved by the
Board. A proposal that is considered inappropriate is declined. This variable obtained a
men score of 3.8182 with a standard deviation of 0.84611. The deference in practice of
this feature among the respondents was among the lowest meaning practice is widely
practice. Thought the board when appropriate, the board seeks counsel from professional
advisors, the practice had noted variation among the respondents as indicated by the
standard deviation of 1.19024 (mean=3.6667). The matter placed to respondents, of the
Board understands, agrees, defines and propagates its functions on an annual basis scared45
a mean score of 3.3636 with the lowest internal variation in practice (SD=0.74239) which
can be attributed to the central management system in inducting board members
The CEO's remuneration and performance is reviewed and determined by the Board
scored the lowest practice rating at a mean of 1.8484 and a standard deviation of 1.27772
a measure of internal deference in practice among the respondent as shown by the wide
dispersion around the mean. Also low in score was the response to the matter, the Board
determines, annually, the objectives and measurement criteria for the CEO with as mean
score of 2.3939 and a standard deviation of 1.08799. The board performance also scored
low across the companies at a mean of 2.5758 with a standard deviation of 0.93643. The
CEO remuneration and performance is scored low as the exercise was carried out at the
head quarters of the managing agent of the small scale tea factories.
Table 4.11 Board Meetings Management and Procedures
C o r p o r a te G . P r a c tic e s R e sp o n se F r e q u e n c y P e r c e n t M e a n p S.DEvery Board member has been supplied with a Board manual and a copy of standing orders and regulations governing conduct of Board meetings.
Not at all 10 30.3
2.3636 1.19421
Less Extent 9 27.3Moderate Extent 7 21.2Large Extent 6 18.2Very Large Extent 1 3.0Total 33 100.0
Every Board member was supplied with a calendar of meetings showing dates of Board meetings, committee meetings etc. and key or critical events of the company.
Not at all 1 3.0
3.7273 .87581
Less Extent 2 6.1Moderate Extent 6 18.2Large Extent 20 60.6Very Large Extent 4 12.1Total 33 100.0
Board meetings are conducted in a manner that encourages open communication, meaningful participation, and timely resolution of issues.
Not at all 1 3.0
3.8485 .83371
Less Extent 1 3.0Moderate Extent 5 15.2Large Extent 21 63.6Very Large Extent 5 15.2Total 33 100.0
Sufficient time is provided during Not at all 1 3.0 3.7576 .7917746
Board meetings for thoughtful discussion in addition to management dialogue.
The Board has adopted formal meeting and reporting procedures.
Not at all 1 3.0
3.6061 .93339
Less Extent 3 9.1Moderate Extent 8 24.2Large Extent 17 51.5Very Large Extent 4 12.1Total 33 100.0
Board members receive timely and accurate minutes, advance written agendas and meeting notices; and clear and concise background material to prepare in advance of meetings.
All Board members receive detailed Board papers, copies of draft minutes and agenda papers in advance.
Not at all 1 3.0
3.8788 .96039
Less Extent 2 6.1Moderate Extent 5 15.2Large Extent 17 51.5Very Large Extent 8 24.2Total 33 100.0
47
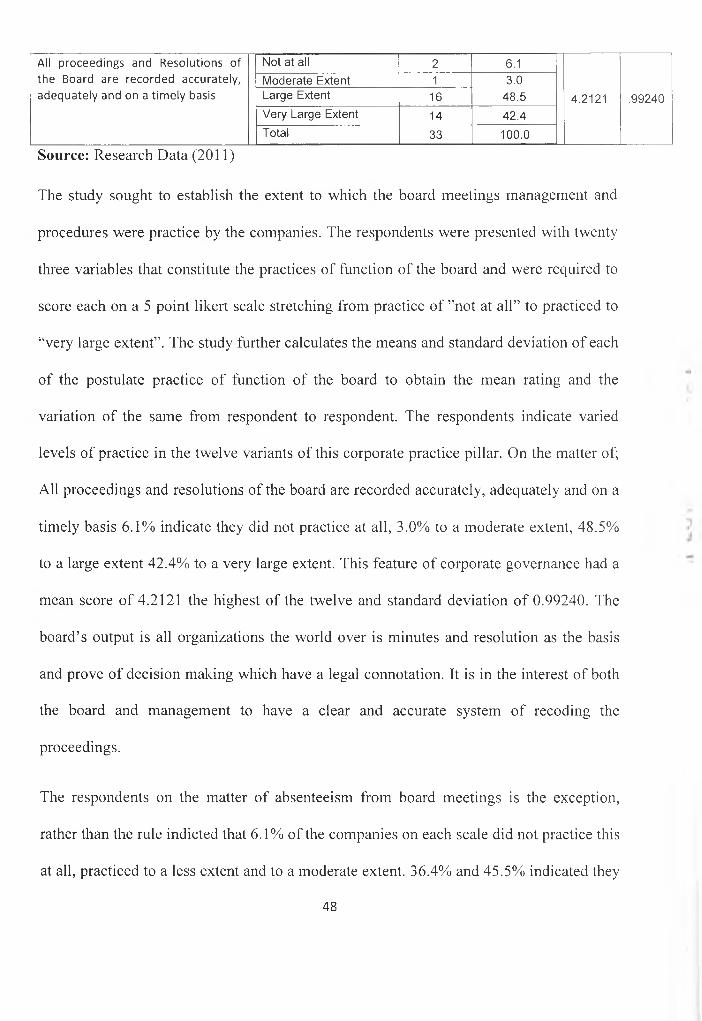
All proceedings and Resolutions of the Board are recorded accurately, adequately and on a timely basis
Not at all 2 6.1Moderate Extent 1 3.0Large Extent 16 48.5Very Large Extent 14 42.4Total 33 100.0
4.2121 .99240
Source: Research Data (2011)
The study sought to establish the extent to which the board meetings management and
procedures were practice by the companies. The respondents were presented with twenty
three variables that constitute the practices of function of the board and were required to
score each on a 5 point likert scale stretching from practice of ’’not at all” to practiced to
“very large extent”. The study further calculates the means and standard deviation of each
of the postulate practice of function of the board to obtain the mean rating and the
variation of the same from respondent to respondent. The respondents indicate varied
levels of practice in the twelve variants of this corporate practice pillar. On the matter of;
All proceedings and resolutions of the board are recorded accurately, adequately and on a
timely basis 6.1% indicate they did not practice at all, 3.0% to a moderate extent, 48.5%
to a large extent 42.4% to a very large extent. This feature of corporate governance had a
mean score of 4.2121 the highest of the twelve and standard deviation o f 0.99240. The
board’s output is all organizations the world over is minutes and resolution as the basis
and prove of decision making which have a legal connotation. It is in the interest of both
the board and management to have a clear and accurate system of recoding the
proceedings.
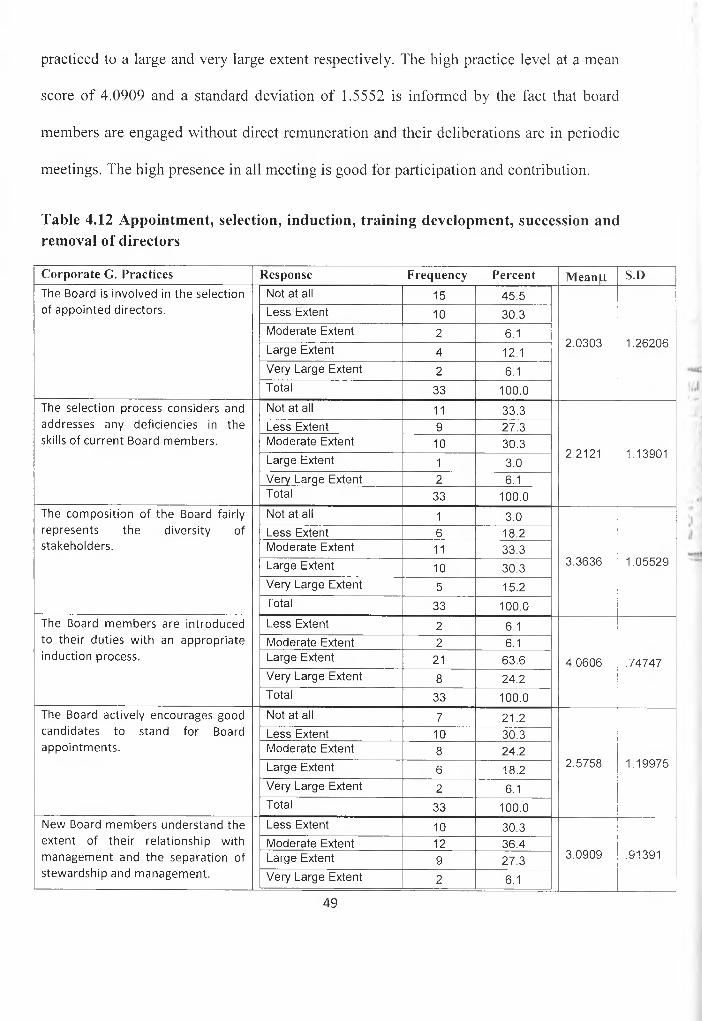
The respondents on the matter of absenteeism from board meetings is the exception,
rather than the rule indicted that 6.1% of the companies on each scale did not practice this
at all, practiced to a less extent and to a moderate extent. 36.4% and 45.5% indicated they
48
practiced to a large and very large extent respectively. The high practice level at a mean
score of 4.0909 and a standard deviation of 1.5552 is informed by the fact that board
members are engaged without direct remuneration and their deliberations are in periodic
meetings. The high presence in all meeting is good for participation and contribution.
Table 4.12 Appointment, selection, induction, training development, succession and removal of directors
C o r p o r a te G . P r a c tic e s R e sp o n se F r e q u e n c y P e r c e n t M e a n p S.DThe Board is involved in the selection of appointed directors.
Not at all 15 45.5
2.0303 1.26206
Less Extent 10 30.3Moderate Extent 2 6.1Large Extent 4 12.1Very Large Extent 2 6.1Total 33 100.0
The selection process considers and addresses any deficiencies in the skills of current Board members.
Not at all 11 33.3
2.2121 1.13901
Less Extent 9 27.3Moderate Extent 10 30.3Large Extent 1 3.0Very Large Extent 2 6.1Total 33 100.0
The composition of the Board fairly represents the diversity of stakeholders.
Not at all 1 3.0
3.3636 1.05529
Less Extent 6 18.2Moderate Extent 11 33.3Large Extent 10 30.3Very Large Extent 5 15.2Total 33 100.0
The Board members are introduced to their duties with an appropriate induction process.
A succession plan is in place for the Chairperson, Chief Executive Officer, Board members and senior management and is reviewed regularly.
Not at all 8 24.2
2.6061 1.27327
Less Extent 9 27.3Moderate Extent 6 18.2Large Extent 8 24.2Very Large Extent 2 6.1Total 33 100.0
Directors who have not been contributing to the good governance of the organization, and are uninterested in improving their performance, are asked to terminate.
Not at all 18 54.5
1.9394 1.27327
Less Extent 5 15.2Moderate Extent 7 21.2Very Large Extent 3 9.1Total 33 100.0
Where the ethical or professional conduct of any director is called into question, such director is suspended pending investigations.
Not at all 12 36.4
2.3636 1.34206
Less Extent 7 21.2Moderate Extent 7 21.2Large Extent 4 12.1Very Large Extent 3 9.1Total 33 100.0
Board members bind themselves to uphold, honor, and respect the Code of Ethics of the organization on first appointment and to resign where
The Board has established and appointed committees with defined terms of reference, composition and reporting requirements. These aspects are formally recorded.
Not at all 5 15.2
2.9394 1.17099
Less Extent 6 18.2Moderate Extent 10 30.3Large Extent 10 30.3Very Large Extent 2 6.1Total 33 100.0
The co m m ittee s have been e stab lished and appointed in light of, Th e need to increase the e ffectiveness o f the Board by utilizing the specia lized sk ills o f Board m em bers, Th e need to provide sup po rt and gu idance to m anage m e nt and Th e need to ensure e ffective and in d e p e n d e n t professional co nsideration o f issue s e.g. au dit reports, finance issues, etc.
Not at all 4 12.1
3.1212 1.13901
Less Extent 5 15.2Moderate Extent 9 27.3Large Extent 13 39.4Very Large Extent 2 6.1Total 33 100.0
The Board has established and appointed, An Executive Committee, An Audit Committee and A Board Appointment and Remuneration Committee
Not at all 10 30.3
2.3939 1.24848
Less Extent 9 27.3Moderate Extent 7 21.2Large Extent 5 15.2Very Large Extent 2 6.1Total 33 100.0
The terms of reference of each of committee are restricted and defined.
Not at all 8 24.2
2.6667 1.29099
Less Extent 8 24.2Moderate Extent 6 18.2Large Extent 9 27.3Very Large Extent 2 6.1Total 33 100.0
Source: Research Data (2011)
As pertains to this practice the respondents were presented with six variables of board
structure practice and required on a five point likert scare to score the level o f practice
52
from one representing not at all to 5 for to a very large extent. The score on the practice
variable; the board has a balanced mix of executive, non-executive and independent non
executive directors (p=T.8182,o= of 0.98281 ) and the roles of chairperson of the board
and chief executive officer are separated and held by different persons (p=4.4242,o=
0.90244), the respondents indicate they did not practice at all for 48.5%, 27,3% to a less
extent, 21.2% to a moderate extent and 3% to a very lage extent while 3% practiced to no
extent at all, 9.1% tom a moderate extent, 27.3% to a large extent and 60.3% to a very
large extent respectively
The other indicators scored means between the two with varied standard deviation
(0.90244 > a < 1.29099). The boards have skewed representations in independents with
the shareholders accounting for 90% of the members, explain the lowest score. The role
of the board and management is highly defined with the factory companies thus the
highly practiced parameter.
Table 4.14 Information and Communication
C o r p o r a te G . P r a c tic e s R e sp o n se F r e q u e n c y P e r c e n t M e a n p S.D (o)Every Board member is supplied with all establishment instruments, all legal documents, the mission statement, and vision and strategy documents of the company on first appointment.
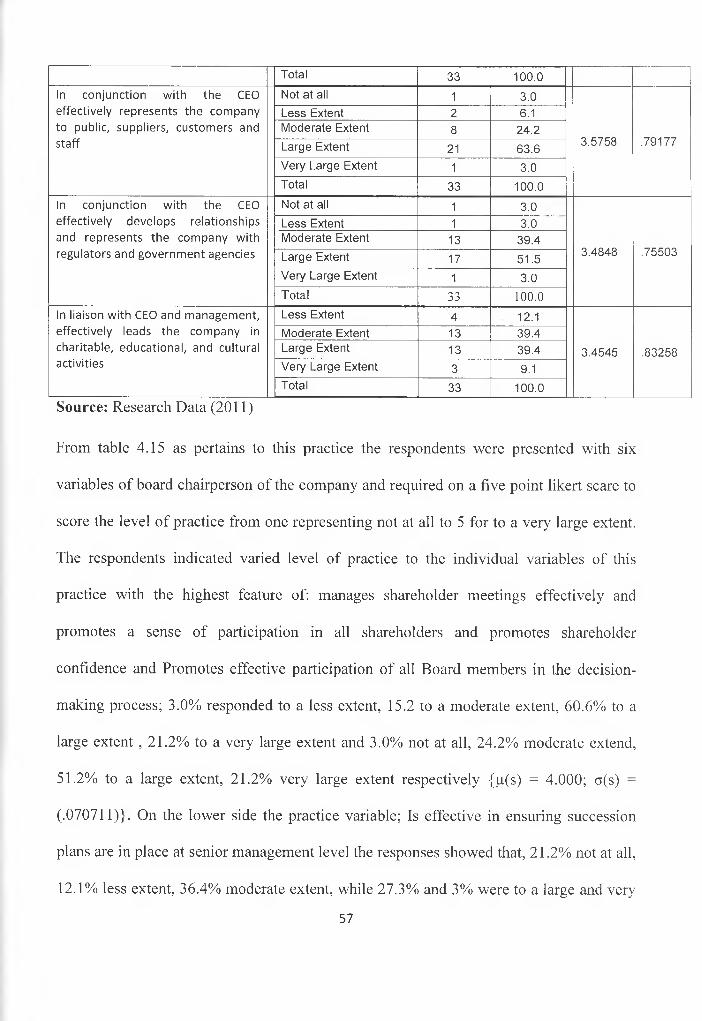
From table 4.15 as pertains to this practice the respondents were presented with six
variables of board chairperson of the company and required on a five point likert scare to
score the level o f practice from one representing not at all to 5 for to a very large extent.
The respondents indicated varied level of practice to the individual variables of this
practice with the highest feature of: manages shareholder meetings effectively and
promotes a sense of participation in all shareholders and promotes shareholder
confidence and Promotes effective participation of all Board members in the decision
making process; 3.0% responded to a less extent, 15.2 to a moderate extent, 60.6% to a
large extent , 21.2% to a very large extent and 3.0% not at all, 24.2% moderate extend,
51.2% to a large extent, 21.2% very large extent respectively (p(s) = 4.000; o(s) =
(.070711)}. On the lower side the practice variable; Is effective in ensuring succession
plans are in place at senior management level the responses showed that, 21.2% not at all,
12.1% less extent, 36.4% moderate extent, while 27.3% and 3% were to a large and very
57
large extents respectively. The mean score was low with a high variability spread on the
individual company responses (p=2.7188, cfT.I 1394)
From the companies bio data question on decision making process and decisions were
exclusively by consensus hence explaining the level for full participation by all board
members. Further the practice of the structure of the board; Board meetings are
facilitated, but not overtly influenced by the chairperson was scored at an average mean
of 3.7879. Shareholder form a major constituency in the election of the board members
thus the high practice of managing shareholder meetings effectively and promoting a
sense of participation.
4.4 Corporate Governance Practice and Performance
The second objective of the study was to determine the effects o f corporate governance
practices on the organizational performance of small scale tea processing companies in
Kenya. The study adopted the balanced scorecard model to gauge key performance
variables o f the respondents’ organization. Five key performance indicators financial
perspective measures, customers and people perspective measures, internal business
processes perspective measures, innovation, learning and growth perspective measures
and quality perspective measures were place to the respondents each with various sub
variable and were require on a five point likert scale to indicate the level of practice 1
representing not at all and 5 to a very large extent. The data was collated, summarized
58
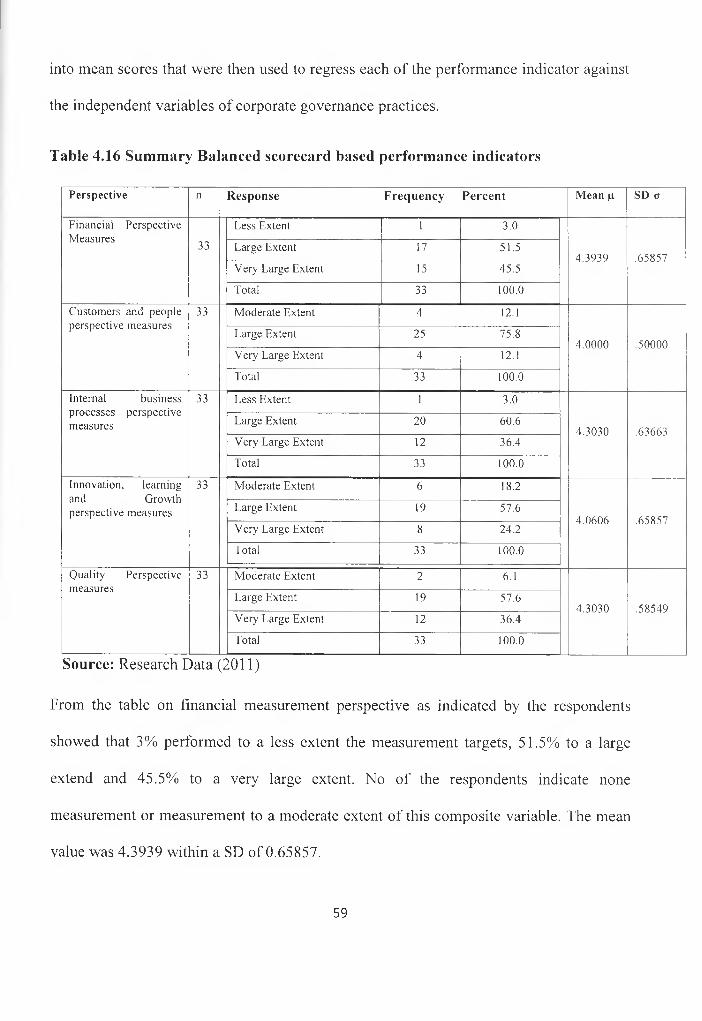
into mean scores that were then used to regress each of the performance indicator against
the independent variables of corporate governance practices.
Table 4.16 Summary Balanced scorecard based performance indicators
Perspective n R e sp o n se F r e q u e n c y P e r c e n t M ean p. S D a
F in a n c ia l P e r s p e c t iv e M e a s u r e s
33
L e s s E x te n t 1 3 .0
4 .3 9 3 9 .6 5 8 5 7L a rg e E x te n t 17 5 1 .5
V e ry L a rg e E x te n t 15 4 5 .5
T o ta l 33 1 0 0 .0
C u s to m e rs a n d p e o p le p e r s p e c t iv e m e a s u re s
33 M o d e ra te E x te n t 4 12.1
4 .0 0 0 0 .5 0 0 0 0L a rg e E x te n t 25 7 5 .8
V e r y L a rg e E x te n t 4 12.1
T o ta l 33 1 0 0 .0
I n te rn a l b u s in e s s p r o c e s s e s p e r s p e c t iv e m e a s u re s
33 L e s s E x te n t 1 3 .0
4 .3 0 3 0 .6 3 6 6 3L a rg e E x te n t 2 0 6 0 .6
V e r y L a rg e E x te n t 12 3 6 .4
T o ta l 33 1 0 0 .0
In n o v a t io n , le a rn in g
a n d G ro w th p e r s p e c t iv e m e a s u re s
33 M o d e ra te E x te n t 6 18.2
4 .0 6 0 6 .6 5 8 5 7L a rg e E x te n t 19 5 7 .6
V e r y L a rg e E x te n t 8 2 4 .2
T o ta l 33 1 0 0 .0
Q u a l i ty P e r s p e c t iv e m e a s u re s
33 M o d e ra te E x te n t 2 6.1
4 .3 0 3 0 .5 8 5 4 9L a rg e E x te n t 19 5 7 .6
V e r y L a rg e E x te n t 12 3 6 .4
T o ta l 33 1 0 0 .0
Source: Research Data (2011)
From the table on financial measurement perspective as indicated by the respondents
showed that 3% performed to a less extent the measurement targets, 51.5% to a large
extend and 45.5% to a very large extent. No of the respondents indicate none
measurement or measurement to a moderate extent of this composite variable. The mean
value was 4.3939 within a SD of 0.65857.
59
Customer and people; on this perspective the responses indicated that 12.1% measures
the parameters to a moderate extend, 75.8 percent to a large extent and 21.1% to a very
large extent where a mean rating of 4.000 and with a standard deviation of 0.5000
Internal business process performance measure perspective involved monitoring of
standard operating procedures, product realization processes infrastructural efficiencies
and systemic efficiencies among others and the responses indicate 36.4% measured the
variable to a very large extent, 60.6% to a large extent and 3.0% to a less extent. The
composite mean was 4.0303 and a standard deviation of .0.63663.
Innovation learning and growth, 18.2 percent of the respondent indicated they measure
the perspective up to moderate extend, while 57.6% and 24.2% measure the variable to
large extend and very large extent respectively. The mean stood at 4.0606 with a SD of
0.65857.
The quality perspective was measured by 6.1% of the companies to a moderate extent,
while 57.6% of the respondents indicated a large extent and 36.4 was to a very large
extent where the mean score was 4.3080 and the standard deviation was 0.58549.
The respondent factories ranked from the highest to the lowest obtained market prices
ranging from ksh 270.40 per kilogram of made tea to ksh 225.00 per kilogram
respectively. The mean price was ksh 252 per kilogram with a standard deviation of ksh
11.780078. The final payments varied between factories of the respondent with the
maximum being ksh 37.28 per kilogram of green leaf and the lowest at ksh 24.67 per
kilogram the mean rate being 30.0409 with a SD of ksh 3.44165. Payout to growers as a60
Percent o f total income stood at 66.40% for the lowest paid to 78.14% for the best paid
the mean standing at 72.3788% of total income being paid out to growers while the
standard deviation was 2.92061%, table 4.4.2 has been presented in the general format
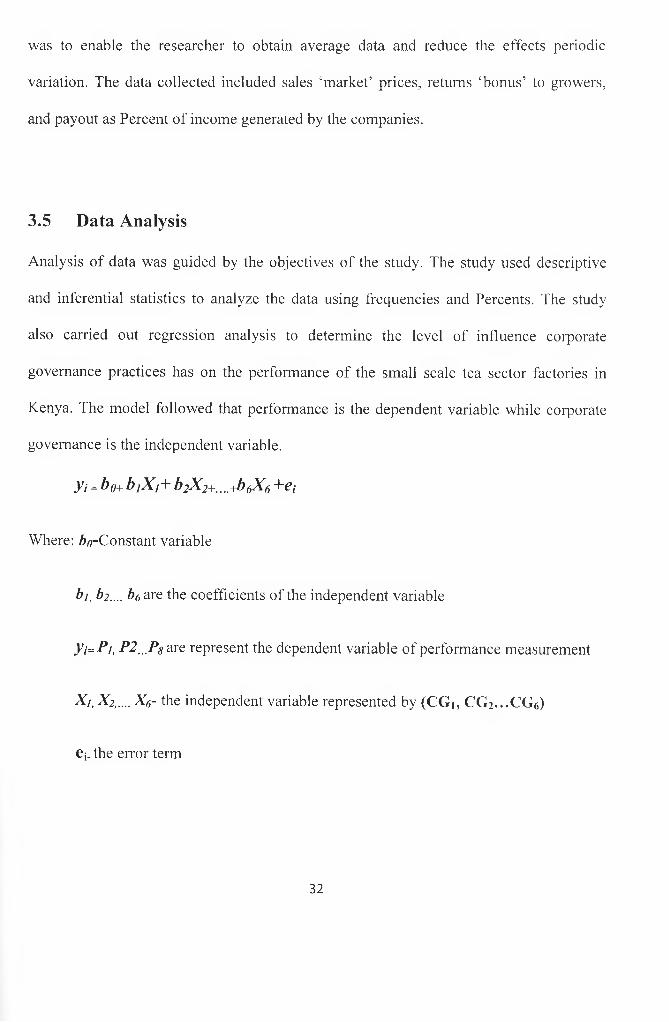
y>i = bo+ b j X j + Z>2 ^ G + . . . . + ^ 6 ^ 6 +£/ Hence the table has the function Performance= /
(corporate governance practice)
4.5 Independent Effects of Corporate Governance Practices
Performance Indicators
The study analyzed the data on individual corporate governance practices by regressing
each against the composite mean of means scores of the eight performance perspective
scores. The results of the regression analysis have been presented tables 4.17 to 4.24,
results discussed, interpreted and conclusions draw.
Table 4.17 Financial performance perspective and corporate governance practices
P e r f o r m a n c e = / '( C o r p o r a te G o v e r n a n c e P ra c t ic e s )U n s ta n d a rd iz e d
C o e f f ic ie n tsS ta n d a r d iz e d
C o e f f ic ie n ts
C o r p o r a t e G o v e r n a n c e P r a c t ic e s B S td . E r ro r B e ta t S ig-( C o n s ta n t) 2 .4 8 0 .9 0 9 2 .7 2 9 .011
F u n c t io n s o f th e B o a rd - .2 6 9 .2 4 3 - .2 1 5 - 1 .1 0 6 .2 7 9
B o a rd M e e t in g s M a n a g e m e n t a n d P ro c e d u re s .3 0 3 .1 8 8 .2 8 5 1 .613 .1 1 9
A p p o in tm e n t , S e le c t io n , In d u c t io n , T ra in in g D e v e lo p m e n t , S u c c e s s io n a n d R e m o v a l o f D ir e c to r s - .1 8 7 .1 4 6 -.2 0 1 - 1 .2 7 6 .2 1 3
B o a rd S t ru c tu r e - .0 6 9 .1 4 2 -.0 8 1 - .4 8 9 .6 2 9
I n fo r m a t io n a n d C o m m u n ic a t io n .1 3 9 .2 0 7 .1 3 0 .6 7 0 .5 0 9
B o a rd C h a ir p e r s o n o f th e c o m p a n y .5 0 8 .1 9 3 .491 2 .6 3 3 .0 1 4
P e r fo r m a n c e : F in a n c ia l P e r s p e c t iv e M e a s u re s
Source: Research Data (2011)
61
From table 4.17 the financial performance of the respondent companies is most influence
by the corporate governance practice of the board chairperson of the company (t=2.633,
p<0.05) is statistically significant. The character and leadership qualities of the chairman
are most likely to influence the financial performance of the company as it impacts on the
decision making process. The board structure is the most statistically not significant
(t=0.0489, p> 0.629) factor of corporate governance practices with list influence on
financial performance.
Table 4.18 Customers and people performance perspective and Corporate
Governance Practices
P e r fo r m a n c e = /'(C o r p o r a te G o v e r n a n c e P ra c t ic e s )U n s ta n d a rd iz e d
C o e f f ic ie n tsS ta n d a r d iz e dC o e f f ic ie n ts
C o r p o r a t e G o v e r n a n c e P r a c t ic e s B S td . E r r o r B e ta t S ig-( C o n s ta n t) 2 .1 8 9 .8 1 4 2 .6 8 9 .0 1 2
F u n c t io n s o f th e B o a rd - .2 7 2 .2 1 8 - .2 8 7 - 1 .2 5 0 .2 2 3
B o a rd M e e t in g s M a n a g e m e n t a n d P ro c e d u re s .1 7 7 .1 6 8 .2 1 9 1 .0 5 0 .3 0 3
A p p o in tm e n t , S e le c t io n , In d u c t io n , T ra in in g D e v e lo p m e n t , S u c c e s s io n a n d R e m o v a l o f D ire c to rs - .0 1 2 .131 - .0 1 7 - .0 9 3 .9 2 7
B o a rd S t ru c tu r e .1 1 8 .1 2 7 .1 8 2 .9 3 3 .3 6 0
I n fo r m a t io n a n d C o m m u n ic a t io n .1 4 6 .1 8 6 .1 7 9 .7 8 7 .4 3 9B o a rd C h a ir p e r s o n o f th e c o m p a n y .3 1 3 .1 7 3 .3 9 8 1 .8 0 9 .0 8 2
P e r fo r m a n c e : C u s to m e rs a n d p e o p le p e r s p e c t iv e m e a s u re s
Source: Research Data (2011)
Customers and people shows little correlation with corporate governance practices in
table 4.18 with autonomous performance high at b=2.189. All practices indicate they are
statistically not significant. The matters that are covered under the performance measure
are external and handled at the managing agent level functions process hence board direct
influence is limited to general and broad policy adoption as advised by the agent.
62
Table 4.19 Internal business processes performance perspective and Corporate
Governance Practices
P e r f o r m a n c e = f ( C o r p o r a t e G o v e r n a n c e P ra c t ic e s )
U n s ta n d a rd iz e dC o e f f ic ie n ts
S ta n d a r d iz e dC o e f f ic ie n ts
C o r p o r a t e G o v e r n a n c e P r a c t ic e s B S td . E r r o r B e ta t ______S i £ ______
( C o n s ta n t) 2 .7 2 5 .8 3 9 3 .2 5 0 .0 0 3
F u n c t io n s o f th e B o a rd - .5 1 7 .2 2 4 - .4 2 8 - 2 .3 0 4 .0 2 9
B o a rd M e e t in g s M a n a g e m e n t a n d P ro c e d u re s .4 1 2 .1 7 4 .4 0 0 2 .3 7 2 .0 2 5
A p p o in tm e n t , S e le c t io n , I n d u c t io n , T ra in in g D e v e lo p m e n t , S u c c e s s io n a n d R e m o v a l o f D ir e c to r s .0 0 7 .1 3 5 .0 0 7 .0 5 0 .961
B o a rd S tru c tu re - .2 2 7 .131 - .2 7 5 - 1 .7 4 0 .0 9 4
I n fo r m a t io n a n d C o m m u n ic a t io n .3 4 3 .191 .331 1 .7 9 3 .0 8 5
B o a rd C h a ir p e r s o n o f th e c o m p a n y .3 3 8 .1 7 8 .3 3 8 1 .8 9 9 .0 6 9
P e r fo r m a n c e : In te rn a l b u s in e s s p r o c e s s e s p e r s p e c t iv e m e a s u re s
Source: Research Data (2011)
From the table 4.19 corporate governance practices of the function of the board (b=0.17, -
2.304, p< 0.05) and board meetings management and procedures (b=0.412, t=2.372, p<
0.05) shows a high level of correlation with the internal business process performance
perspective for the companies. The overall mission, vision and objective setting in the
companies, strategic planning and boards understanding, involvements and participation
in the same process influence the success of the implementation of company activities.
Board control resources while management provides the technical knowhow. Monitoring
and evaluation of performance is crucial. Clear agendas for the board, structure approach
to transactions and overall performance of the board is very important.
Table 4.20 Innovation, learning and growth performance perspective and corporate
governance practices
P e r f o r m a n c e ^ ( C o r p o r a te G o v e r n a n c e P ra c t ic e s )U n s ta n d a rd iz e d
C o e f f ic ie n tsS ta n d a r d iz e dC o e f f ic ie n ts
C o r p o r a t e G o v e r n a n c e P r a c t ic e s B S td . E r r o r B e ta t S ig .(C o n s ta n t) 1 .6 9 2 1 .0 8 8 1 .5 5 6 .1 3 2
F u n c t io n s o f th e B o a rd .0 7 3 .291 .0 5 9 .2 5 2 .8 0 3
63
B o a rd M e e t in g s M a n a g e m e n t a n d P ro c e d u re s .1 3 2 .2 2 5 .1 2 4 .5 8 7 .5 6 2
A p p o in tm e n t , S e le c t io n , In d u c t io n , T ra in in g D e v e lo p m e n t , S u c c e s s io n a n d R e m o v a l o f D ire c to rs - .2 0 1 .1 7 5 - .2 1 6 - 1 .1 4 7 .2 6 2
B o a rd S tru c tu re .1 2 0 .1 6 9 .1 4 0 .7 0 5 .4 8 7
I n fo r m a t io n a n d C o m m u n ic a t io n .2 3 6 .2 4 8 .2 2 0 .9 5 2 .3 5 0
B o a rd C h a ir p e r s o n o f th e c o m p a n y .2 4 0 .231 .2 3 2 1 .0 3 7 .3 0 9
P e r fo r m a n c e : In n o v a t io n , le a rn in g a n d G ro w th p e r s p e c t iv e m e a s u re s
Source: Research Data (2011)
Innovation, learning and Growth perspective measures are least influenced by any of the
corporate governance practices as presented in Table 4.20. The Appointment, Selection,
Induction, Training Development, Succession and Removal of Directors (b=-0.201, t=-
1.147, p> 0.05) and Board Chairperson of the company (b=0.240, t=1.037, p> 0.05)
indicate high correlation variations but statistically not significant. The matters that are
covered under the performance measure fall in management and staff functions process
hence board direct influence is limited to general and broad policy orientation
Table 4.21 Quality perspective measures performance and corporate governance
practices
P e r f o r m a n c e ^ t C o r p o r a t e G o v e r n a n c e P ra c t ic e s )U n s ta n d a rd iz e d
C o e f f ic ie n tsS ta n d a r d iz e dC o e f f ic ie n ts
C o r p o r a t e G o v e r n a n c e P r a c t ic e s B S td . E r r o r B e ta t S if r( C o n s ta n t) 3 .3 0 6 .921 3 .5 8 8 .001
F u n c t io n s o f th e B o a rd .0 2 3 .2 4 6 .021 .0 9 5 .9 2 5
B o a rd M e e t in g s M a n a g e m e n t a n d P ro c e d u re s .1 5 7 .191 .1 6 6 .8 2 2 .4 1 8
A p p o in tm e n t , S e le c t io n , I n d u c t io n , T ra in in g D e v e lo p m e n t , S u c c e s s io n a n d R e m o v a l o f D ir e c to r s - .0 6 9 .1 4 8 - .0 8 4 - .4 6 7 .6 4 4
B o a rd S tru c tu re - .3 1 4 .1 4 4 - .4 1 3 - 2 .1 8 7 .0 3 8
I n fo r m a t io n a n d C o m m u n ic a t io n .2 4 2 .2 1 0 .2 5 4 1.151 .2 6 0
B o a rd C h a ir p e r s o n o f th e c o m p a n y .1 6 5 .1 9 6 .1 7 9 .8 4 1 .4 0 8
P e r fo r m a n c e : Q u a l i ty P e r s p e c t iv e m e a s u re s
Source: Research Data (2011)
64
From the table 4.21 the board structure practice of corporate governance has influence on
the quality performance perspective (b= -.314, t= -2.187, p<0.05) which is statistically
significant. Information and Communication has a high correlation at t= 1.151 but is
statistically not significant (p>0.05)
Table 4.22 Market price per kilogram of made tea performance and corporate
governance practices
P e r fo r m a n c e ^ C C o r p o r a te G o v e r n a n c e P ra c t ic e s )U n s ta n d a rd iz e d
C o e f f ic ie n tsS ta n d a r d iz e dC o e f f ic ie n ts
C o r p o r a t e G o v e r n a n c e P r a c t ic e s B S td . E r ro r B e ta t S ig-( C o n s ta n t) 2 5 9 .3 2 7 2 0 .4 8 9 1 2 .6 5 7 .0 0 0
F u n c t io n s o f th e B o a rd 2 .7 6 2 5 .4 7 8 .1 2 4 .5 0 4 .6 1 8
B o a rd M e e t in g s M a n a g e m e n t a n d P ro c e d u re s 2 .5 1 3 4 .2 4 0 .1 3 2 .5 9 3 .5 5 8
A p p o in tm e n t , S e le c t io n , I n d u c t io n , T ra in in g D e v e lo p m e n t , S u c c e s s io n a n d R e m o v a l o f D ir e c to r s 4 .8 5 2 3 .2 9 6 .2 9 2 1 .4 7 2 .1 5 3
B o a rd S tru c tu re - 5 .9 4 2 3 .1 9 2 - .3 8 8 -1 .8 6 1 .0 7 4
I n fo r m a t io n a n d C o m m u n ic a t io n - .2 0 4 4 .6 7 6 -.011 - .0 4 4 .9 6 6
B o a rd C h a ir p e r s o n o f th e c o m p a n y - 5 .9 6 0 4 .3 5 3 - .3 2 2 - 1 .3 6 9 .1 8 3
P e r fo r m a n c e : M a rk e t p r ic e p e r k i lo g ra m o f m a d e te a
Source: Research Data (2011)
Market price per kilogram of made tea shows little correlation with corporate governance
practices in table 4.22 with autonomous performance high at b=259.327. All practices
indicate they are statistically not significant though Appointment, Selection, Induction,
Training Development, Succession and Removal of Directors ( t= l.472, p>0.05) and
Board structure (-1.861, p> 0.05) shows high t values. The prices are dictated by other
forces other than good corporate governance practices. Buyers, quality and market
dynamics are peripherally controlled from the factory companies.
65
Table 4.23 Final payment rate in shillings per kilogram of green leave performance
perspective and corporate governance practices
P e r f o r m a n c e ^ ( C o r p o r a te G o v e r n a n c e P ra c t ic e s )U n s ta n d a rd iz e d
C o e f f ic ie n tsS ta n d a r d iz e dC o e f f ic ie n ts
C o r p o r a t e G o v e r n a n c e P r a c t ic e s B S td . E r r o r B e ta t SiR-( C o n s ta n t) 3 2 .9 4 9 6 .0 4 1 5 .4 5 4 .000F u n c t io n s o f th e B o a rd -.2 3 1 1 .6 1 5 - .0 3 5 - .1 4 3 .888B o a rd M e e t in g s M a n a g e m e n t a n d P ro c e d u re s - .7 9 6 1 .2 5 0 - .1 4 3 - .6 3 7 .5 3 0
A p p o in tm e n t , S e le c t io n , I n d u c t io n , T ra in in g D e v e lo p m e n t , S u c c e s s io n a n d R e m o v a l o f D ir e c to r s .0 9 7 .9 7 2 .020 .100 .921
B o a rd S t ru c tu r e -1 .9 7 2 .941 -.4 4 1 -2 .0 9 5 .0 4 6
I n fo r m a tio n a n d C o m m u n ic a t io n 1 .033 1 .3 7 9 .1 8 4 .7 4 9 .4 6 0
B o a rd C h a ir p e r s o n o f th e c o m p a n y .9 5 3 1 .2 8 4 .1 7 6 .7 4 2 .4 6 5
P e rfo rm a n c e : F in a l p a y m e n t r a te in K s h p e r K i lo g r a m o f g r e e n le a v e
Source: Research Data (2011)
From table 4.23 Board Structure has a high correlation with Final payment rate in Kenya shillings
per Kilogram of green leave (t=-2.095, p<0.05) hence statistically significant. The board make
decisions on how is paid as “bonus”. This is probably the most single important presentation to
the shareholders at the annual general meetings. The board is also continuously forcused on the
expected bonus issue.
Table 4.24 Percent of total income payout to grower performance perspective and
corporate governance practices
P e r f o r m a n c e ^ ( C o r p o r a te G o v e r n a n c e P ra c t ic e s )U n s ta n d a rd iz e d
C o e f f ic ie n tsS ta n d a r d iz e dC o e f f ic ie n ts
C o r p o r a t e G o v e r n a n c e P r a c t ic e s B S td . E r ro r B e ta t SiR.( C o n s ta n t) 7 5 .1 9 7 4 .9 1 0 1 5 .3 1 4 .000F u n c t io n s o f th e B o a rd 2 .8 0 6 1 .3 1 3 .5 0 7 2 .1 3 7 .0 4 2
B o a rd M e e t in g s M a n a g e m e n t a n d P ro c e d u re s - 1 .6 4 2 1 .0 1 6 - .3 4 8 - 1 .6 1 6 .1 1 8
A p p o in tm e n t , S e le c t io n , In d u c t io n , T ra in in g D e v e lo p m e n t , S u c c e s s io n a n d R e m o v a l o f D ir e c to r s - .8 4 4 .7 9 0 - .2 0 5 - 1 .0 6 9 .2 9 5
B o a rd S t ru c tu r e - .0 7 3 .7 6 5 - .0 1 9 - .0 9 6 .9 2 5
I n fo r m a t io n a n d C o m m u n ic a t io n - .0 0 4 1.121 -.001 - .0 0 4 .9 9 7B o a rd C h a ir p e r s o n o f th e c o m p a n y - .9 3 7 1 .043 - .2 0 4 - .8 9 9 .3 7 7
P e r fo r m a n c e : P e r c e n t o f to ta l in c o m e p a y o u t to g ro w e r
Source: Research Data (2011)
66
From table 4.24 Functions of the Board has a high correlation with Percent of total income
payout to grower (t= 2.137, p<0.05) hence statistically significant. The board makes decisions
on how much of the initial payment and final payments are done. This is probably the most single
important presentation to the shareholders at the annual general meetings. The board is also
continuously focused on the amounts paid to growers. The decision to reelect them by
shareholders is hinged on this performance. The decisions are in line to mission vision and
objectives of the companies.
The six corporate governance practices have been individually have been regressed
against the performance perspective measures. The composite effect of each of the
corporate practices elements on performance. The findings are presented on table 4.25,
discussed and interpreted.
Table 4,25 The effect of corporate governance practices of performance
F u n c t i o n N R R 2 F S1G
F in a n c ia l P e r s p e c t iv e = /(C o rp o ra te G o v e rn an c e P rac tices) 3 3 0 .7 0 3 0 .4 9 4 4 .2 2 4 .0 0 4
C u s to m e r s a n d p e o p le p e r s p e c t iv e = /(C o rp o ra te G o v ern an ce P rac tices)
3 3 0 .5 4 3 0 .2 9 5 1 .1 8 5 0 .1 3 5
I n te r n a l b u s in e s s p r o c e s s e s p e r s p e c t iv e = /(C o rp o ra te G o v e rn an c e P ra c tice s)
3 3 0 .7 3 4 0 .5 3 8 5 .0 4 5 0 .0 0 1
I n n o v a t io n , le a r n in g a n d G r o w th p e r s p e c t iv e = /(C o rp o ra te G o v e rn an c e P ra c tice s )
3 3 0 .5 2 4 0 .2 7 5 1 .6 4 0 0 .1 7 6
Q u a lity P e r s p e c t iv e = /(C o rp o ra te G o v e rn an c e P ra c tice s) 3 3 0 .5 8 4 0 .3 4 1 2 .2 4 5 0 .0 7 0
M a r k e t p r ic e p e r k ilo g r a m o f m a d e t e a = /(C o rp o ra te G o v ern an ce P rac tices)
3 3 0 .4 4 2 0 .1 9 5 1 .0 5 2 0 .4 1 5
F in a l p a y m e n t r a te in K s h p e r K ilo g r a m o f g r e e n le a v e =/ (C o rp o ra te G o v e rn an c e P rac tices)
33 0 .4 2 5 0 .1 8 0 0 .9 5 4 0 .4 7 5
P e r c e n t o f t o ta l in c o m e p a y o u t to g r o w e r = /(C o rp o ra te G o v e rn an c e P ra c tice s)
33 0 .4 1 8 0 .1 7 5 0 .8 8 2 0 .5 2 3
C o r p o r a t e G o v e r n a n c e P r a c t ic e s : F u n c tio n s o f th e B o ard ; B o a rd M e e tin g s; M a n a g e m e n t an d P ro ced u res;
A p p o in tm e n t, S e lec tio n , In d u c tio n , T ra in in g D e v e lo p m en t, S u c c ess io n an d R em o v a l o f D ire c to rs ; B o a rd S tru c tu re ;
In fo rm atio n and C o m m u n ic a tio n and B o ard C h a irp e rso n o f th e c o m p an y
Source: Research Data (2011)
67
Corporate governance have a strong relationship to financial performance (R= 0.703)
with 49.4% (R squared =.494) of financial performance explain by corporate governance
practice. This is significant (4.224, p < 0.05)
Further it can be observed that the Corporate governance variable influence the Customer
and people performance (R=0.543). However it only 29.5% of customers and people
performance that can be explained by corporate governance practices. This is influence
overly is moderate as observed by the value of the F statistic (F= 1.815. 054, p> 0.05)
statistically not significant.
Internal business processes as a function of Corporate governance practice has a strong
relationship (R=0.734) where 53.8% of internal process performance is attributed to
corporate governance practices (R2=0.538). this is statistically significant (F=5.054,p <
0.05). Innovation learning and growth performance as function of Corporate governance
practice has a relatively relationship (R=0.524) where 27.5% of customers and people
performance is attributed to corporate governance practices (R2=0.275), this influence or
explanation is statistically not significant (F=1.640, p < 0.05).
Also from table 4.4.2 it can be observed that the Corporate governance variables
influence the Quality performance (R=0.584). However it only .0341 of quality
performance that can be explained by corporate governance practices. This is influence is
moderate strong as observed by the value of the high F statistic (F=2.245, p > 0.05) hence
statistically significant influence.
Corporate governance practices were further observed to have a low influence on market
price fetched by the products (R=0.442) where of around 20% (R2=. 195) of market price
68
performance is explained by corporate governance practices at not statistically significant
level (F=1.052,p> 0.005)
On the correlation between Final payment rate per kilogram of green leaf and corporate
governance practices the results of the study show that, corporate governance has a some
influence on final payment rates performance (R=0.425), moreover the level of influence
is low as it only explains up to 18% variability. This is statistically not significant (F
value= 0.954, p > 0.05). Corporate governance practices have varied level of influence on
performance indicators. However only the indicators showed a statistically significant;
financial performance (R= 0.703) with 49.4% (R squared =.494) o f financial performance
explain by corporate governance practice (F=4.224, p < 0.05) and Internal business
processes (R=0.734) where 53.8% of performance is attributed to corporate governance
practices (R2=0.538, F=5.054, p < 0.05).
Quality performance as a function of corporate governance (R=0.584 has only 0.341 or
about 35% performance that can be explained by corporate governance practices. The
influence is moderately strong as observed by the value o f the high F statistic (F=2.245)
however, it statistically not significant (p > 0.05).
4.6 Discussions of the Findings
The correlation analysis presented in the summarized regression statistics table 4.25
shows. The independent effect of corporate governance practices on performance
indicators shows that two of them indicate financial perspective and internal business
69
processes and quality are highly correlated to the practices. Corporate governance is
concerned with key areas of Organization responsibility to the shareholders, management
leadership within organization and issues of transparency, accountability and efficient
utilization of resources. The board of directors’ role, composition and internal auditors
are key factors in corporate governance. Other issue of concern with size and
composition, competences with the board, frequency of meetings, role of management,
ownership, management of the agency problem and the interest matrix (Johnson &
Scholes 2003).
Financial performance forms the nerve centre of corporate performance management.
Organizational performance looks at three areas of organizational outcomes: financial
performance (profits, return on assets, return on investment); product market performance
(sales, market share); and shareholder return (total shareholder return, economic value
added). In recent years, many organizations have attempted to manage organizational
performance using the balanced scorecard methodology where performance is tracked
and measured in multiple dimensions such as; financial performance ( shareholder
return), customer service, social responsibility (corporate citizenship, community
outreach), employee stewardship. Mintzberg (1988) postulate that in face of realization
by organization of the umbilical connection of governance and performance they have
increasingly been forced to design performance measurement system that encourage the
effective and efficient implementation of strategic plans for attainment o f objectives and
goals.
70
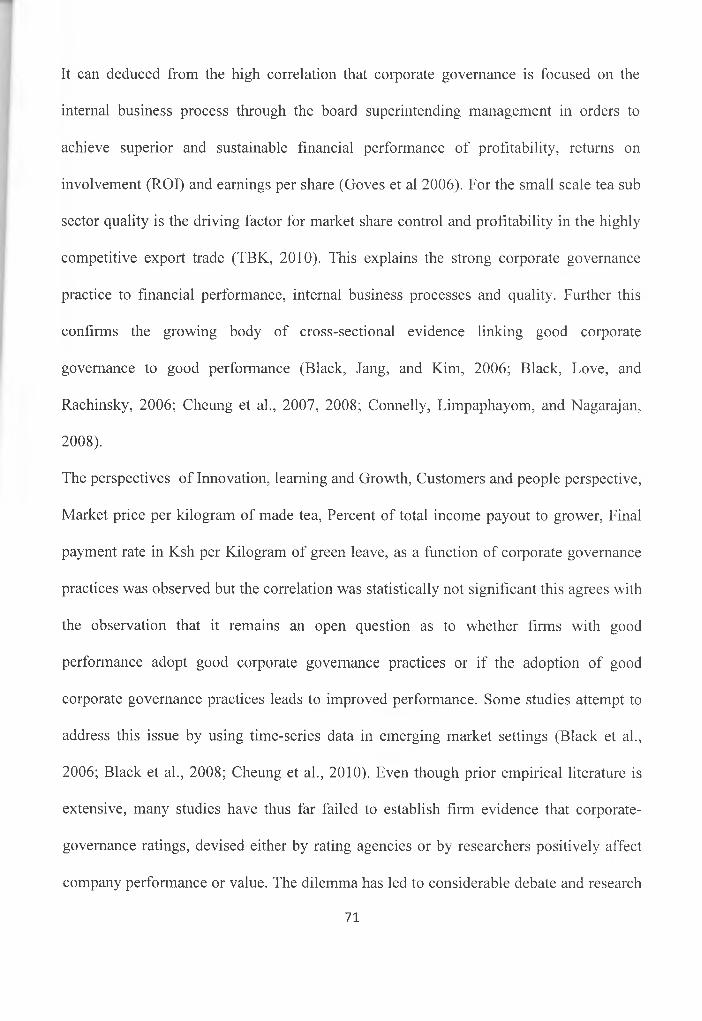
It can deduced from the high correlation that corporate governance is focused on the
internal business process through the board superintending management in orders to
achieve superior and sustainable financial performance of profitability, returns on
involvement (ROI) and earnings per share (Goves et al 2006). For the small scale tea sub
sector quality is the driving factor for market share control and profitability in the highly
competitive export trade (TBK, 2010). This explains the strong corporate governance
practice to financial performance, internal business processes and quality. Further this
confirms the growing body of cross-sectional evidence linking good corporate
governance to good performance (Black, Jang, and Kim, 2006; Black, Love, and
Rachinsky, 2006; Cheung et al., 2007, 2008; Connelly, Limpaphayom, and Nagarajan,
2008).
The perspectives o f Innovation, learning and Growth, Customers and people perspective,
Market price per kilogram of made tea, Percent of total income payout to grower, Final
payment rate in Ksh per Kilogram of green leave, as a function of corporate governance
practices was observed but the correlation was statistically not significant this agrees with
the observation that it remains an open question as to whether firms with good
performance adopt good corporate governance practices or if the adoption of good
corporate governance practices leads to improved performance. Some studies attempt to
address this issue by using time-series data in emerging market settings (Black et al.,
2006; Black et al., 2008; Cheung et al., 2010). Even though prior empirical literature is
extensive, many studies have thus far failed to establish firm evidence that corporate-
governance ratings, devised either by rating agencies or by researchers positively affect
company performance or value. The dilemma has led to considerable debate and research
71
in recent times concerning the need for good corporate governance, with country
institutions around the world drawing up guidelines and codes of practice to strengthen
governance (Cadbury, 1997, PSCGT, 1999).
72
CHAPTER FIVE: SUMMARY OF FINDINGS, CONCLUSSIONS
RECOMMENDATION
5.1 Introduction
This chapter summarizes the findings have been presented, explained and discussed in
line with the objectives. In this chapter the findings are summarized and conclusions
drawn. Further recommendations as well as limitations of the study observed.
5.2 Summary of the Findings
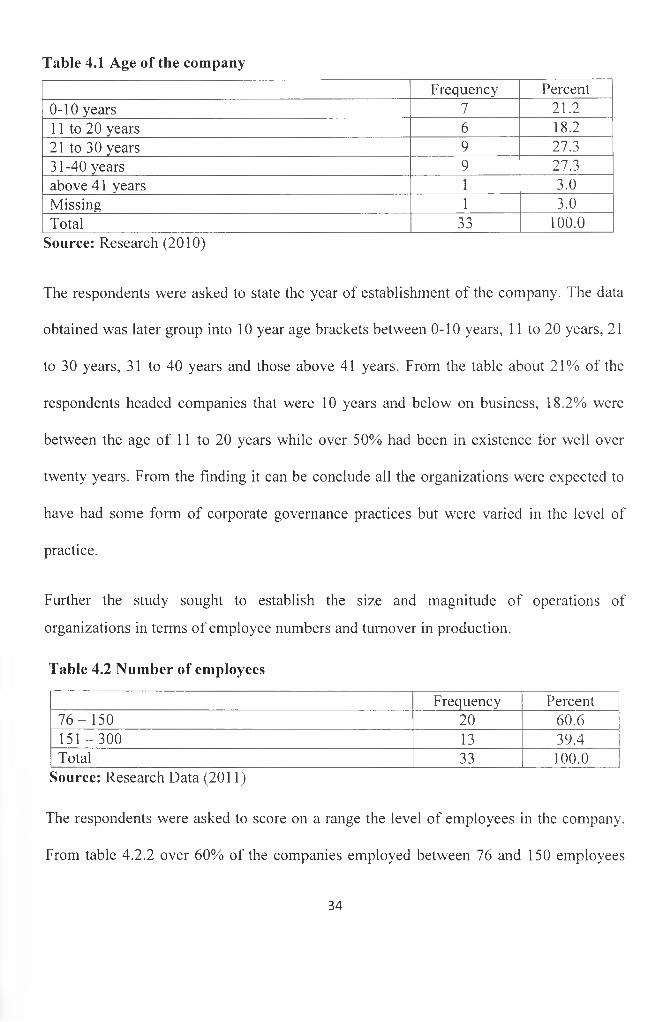
Most companies had been in existence for more than 10 years thus the organizations had
practices some form of corporate governance and had measured performance in one way
or another. A majority of the companies employed between 76 and 300 employees,
producing between 3 and 4.5 million kilograms per year. A sizable number had an annual
production of over 4.5 million kilograms of made tea making them large scale producers
hence the need to have formal performance management system to take care of large
operational and employee management complexities. The magnitude of operations would
require elaborate corporate governance and performance management systems.
A few companies indicated the boards had no sub committees within their structure, an
indication of high centralized management structure within the board the rest have
subcommittees in excess of five which may indicate a duplication o f some sorts and a
73
pointer to excess resource requirements to run the committees raising the issues of
agency cost.
Most board managed the meetings well, two of the respondents indicated that the boards
held below six meeting in the year 2009/2010. On the higher side 42.4% a majority had
more than 13 meetings in the year or more than one meeting in a month. 12.1% had
planned scheduled meetings through the year conforming to a key requirement of
corporate governance principle(PSCGT,1999) A majority at 60.6% had their meetings
called by the secretary to the board, 15.2 percent were called by the chairmen of the
boards while 12.1% were called by others. One company indicate there meetings lasted
less than two hours on average, a majority at 75.8% of the responses indicated the
meetings lasted a between 3 and 5 hours. Most board arrived at crucial decisions by
consensus hence harmony and continuity of operations.
The small scale tea subsector handles over 60% production of tea for exports in Kenya.
The companies surveyed from the finding shows they practiced along the guidelines of
the principles of good corporate governance (CCG, 2003). The results from the
descriptive analysis statistics indicate that the small scale tea sector companies practiced
corporate governance best code of practice to some degree. The key performance
indicators encompassing financial and operational measuresument were regressed against
six corporate govern ace composite variables the results showed a mixture of positive and
negative correlation with each performance measurement perspective. Each corporate
governance practice had some level of influence on the performance parameter but the
level of influence could not be established.74
Further from the research it was noted that some functions of corporate governance
practices had not been fully operationalised while others were in full practice. The
organizational performance indicators varied among respondents hence explaining the
different levels of performance on the last three indicators.
5.3 Conclusion
From data obtained and analyzed the small scale tea sector has establish the corporate
governance practices adopted at various levels of applications, that influences the
operations and decision making of the companies hence influencing the organizational
performance of the tea processing Companies in Kenya. All dependent variables had
some explanation to some degree on the eight dependent variables but posting varied
degrees of influence. It can be concluded that the specific degree of influence for could
not however be ascertained from the study. This tends to agree with past studies that have
pointed out to a correlation between corporate governance and financial or other form of
Matengo, 2008). The findings are therefore not conclusive as to the level of positive or
negative correlation between corporate governance and organizational performance. The
study has however been able to answer the two broad objectives of the study; small scale
tea processing company does practice good corporate governance and the same has some
effect on the level of performance.
75
5.4 Recommendations
Corporate governance best code of practice provides a structured approach to the
principle agent arrangement. The practices as adopted in the small scale tea industry from
the findings are extensively applied. However certain aspects have not been fully
appreciate by some players thus discrepancies in application and also benefit derivation
as show by the wide performance indicator bases established. Some factories exhibited
high level of corporate governance practice while others presented weak practices this in
correlation to the performance against exhibited variances. The practices like provision of
statutory and institutional policy manuals, training manuals, board having diversified
representation for independent directors, setting the key performance parameters for the
Chief executive officers including hiring on performance contract basis have not been
actualized for both the board and management to allow assessment. The balance
scorecard system of performance management can be enhancing as a tool for monitoring
and evaluation by management and the board. Overly the practice of Appointment,
Selection, Induction, Training Development, Succession and Removal of Directors needs
synchronization into the existing management structure to take advantage of benefits
associated with its operationalization. The functions of the board and the leadership style
of the chairperson o f the board had the most significant influence on performance, thus
the need for structured and intense need for the process of Appointment, Selection,
Induction, Training Development, Succession and Removal of Directors to be fully
operationalised. These suggestions can be presented to the various board as a basis for
policy improvement.
76
5.5 Suggestions Further research
The study looked into the practices of good corporate governance in the small scale tea
sector and the influence the practices had on performance of the companies. In the study
descriptive studies only established existence of practices of corporate governance while
the regression model only established the existence of a correlation. What the study did
not look into in the intensity of the practices and the specific level of influence it has on
performance. Its hope that this study will form a basis for further research into intensities
of best corporate governance practices and the intensity each exerts on performance
parameter. The outcome would inform the level of adoption and application for target
results.
77
REFERENCES
Adams, M.B. (1994). Agency Theory and the International Audit, Managerial Auditing Journal, 9(8), 8-12.
Aguilera, R. V. and Jackson, G. (2003). The Cross National-Diversity of Corporate Governance: Dimensions and Determinants, Academy o f ManagementReview, 28, 447^465.
Atkinson, H. & Brown, J. B. (2001). ‘"Rethinking performance measures: assessingprogress in UK hotels”, International Journal o f Contemporary Hospitality
Management. Vol. 13 No 3, pp 128-35
Baker, G. P., Jensen, M. C. & Murphy, K. J. (1988). ‘Compensation and incentives’. Journal o f Finance, 43, 593-616.
Banker, R I., Datar, S. M. & Kaplan, R. S. (1989). “Productivity measurement and management accounting”. Journal o f Accounting, Auditing and Finance, Vol. 4 No. 4. pp. 528
Berle, A. A. & Means, G. C. (1932). The Modern Corporation and Private Property. New York: Commerce Clearing House.
Bett, C. (2003). Strategic planning by tea manufacturing companies in Kenya. Unpublished Management research paper. University of Nairobi.
Bilgin, K. U. (2007). Performance management for public personnel: multi-analysis approach toward personnel. Public Personnel Management, 36(2): 93.
Bititci, U. S., Mendibil, K., Albores, P., & Martinez, M. (2005). "Measuring and Managing Performance in Collaborative Enterprises", International Journal o f Operations and Production Management vol 25, no. 4, pp 333-353, (ISSN 0144-3577).
Bititci, U. S., Mendibil. K., Martinez, V., Albores, P., & Carrie., A. S., (1998). Integrated performance measurement systems: Structures and Relationships, EPSRC final research report, grant no. GR/K 48174, swindon.
Black, B. (2001). “The Corporate Governance Behavior and Market Value of Russian Firms,” Emerging Markets Review 2, 89-108.
Black, B. (2001). “The Corporate Governance Behavior and Market Value of Russian Firms,” Emerging Markets Review 2, 89-108.
78
Black, B., Jang, H. & Kim, W. (2006). “Does Corporate Governance Affect Firm Value? Evidence from Korea,” Journal o f Law, Economics, andOrganization 22, 366-413.
Black, B., Love, I. & Rachinsky, A. (2006) “Corporate Governance Indices and Firms’ Market Values: Time-Series Evidence from Russia,” Emerging Markets Review 7, 361-379.
Bourne, M. C. S„ Mills, J. F„ Wilcox M„ Neely, A. D. & Platts, K. W. (2000),"Designing, implementing and updating performance measurement systems", 13 International Journal o f Production and Operations Management,Vol. 20, No. 7, 754-771.
Bourne, M., Mura, M., Franco-Santos, M., Pavlov, A., Martinez, V., & Lucianetti, L.Centre for Business Performance, Cranfield School o f Management Cranfield, Cranfield, Bedfordshire, MK43 0AL, UK
Brown, L. & Caylor, M. (2006). “Corporate Governance and Firm Operating Performance,” Journal o f Accounting and Public Policy 25, 409-434.
Brown, M.G. Bititci, U. S., Mendibil, K., Martinez, V., Albores, P., & Carrie., A. S., (1998). Integrated performance measurement systems: Structures andRelationships, EPSRC final research report, Grant No. GR/K 48174, Swindon.
Cadbury Report. (1992). Report of the Committee on Financial Aspects of Corporate Governance, Gee & Co., London
Cadbury, A. (1992). The Financial Aspects of Corporate Governance - A Report of the Committee on Corporate Governance. London: Gee and Co.
Cadbury, A. (2002). Corporate Governance and Chairmanship - A Personal View. Oxford: Oxford University Press.
Carney, M. (2005). Corporate Governance and Competitive Advantage in Family- Controlled Firms Entrepreneurship Theory and Practice.
Central Bank of Kenya (June, 2010). Monthly Economic Review’.
Centre for Corporate Governance. (2004), “The Study on Reporting and Disclosure on Corporate Governance in Kenya”, Unpublished
Chakravarthy, B. S. (1896). “Measuring Strategic Performance”, Strategic Journal, Vol.7 pp 420-62
79
Cheung, Y.L., Connelly, J.T., Limpaphayom, P. & Zhou, L. (2007). “Do Investors Really Value Corporate Governance? Evidence from the Hong Kong Market,” Journal o f International Financial Management & Accounting 18, 86-122.
Cheung, Y. L., Jiang, P., Limpaphayom, P. & Lu, T. (2008). “Does Corporate Governance Matter in China?” China Economic Review 19, 460-479.
Cheung, Y. L., Jiang, P., Limpaphayom, P. & Lu, T. (2010) “Corporate Governance in China: A Step Forward,” European Financial Management 16, 94-123.
Claessens, S., Djankov, S., & Lang, L.H.P. (2000). The separation of ownership and control in East Asian corporations. Journal o f Financial Economics, 58, 81-112.
Combined Code (1998) Principles o f Good Governance and Code o f Best Practice. London: Gee & Co. Ltd.
Combined Code (2003). The Combined Code on Corporate Governance. London:The Financial Reporting Council.
Connelly, J.T., Limpaphayom, P. & Nagarajan, N. (2008). “Form versus Substance: The Effect of Family Influence and Corporate Governance Practices on Firm Value in Thailand,” University of Pittsburgh Working Paper.
Coombes, P. & Watson, M. (2001) Corporate reform in the developing world. The Me Kinsey Quarterly, 4: 89-92.
Cumby, J. & Conrod, J. (2001). “None financial performance measures in Canadian biotechnology industry”, Journal o f Intellectual CapitaJ Vol. 2 No. 3, pp. 261-72
Davis, J. H., Schoorman, F. D. & Donaldson, L. (1997). Toward a stewardship theory of management. Academy o f Management Review, 22: 20—47.
Decoene, V. & Bruggeman, W. (2006). ” Strategic alignment and middle-level managers’ motivation in a balanced scorecard setting” International Journal o f Operations &Production Management, 26(4): 429-448.
Delloite & Touche, 2008;
Denis, D. & McConnell, J. (2003). International corporate governance. Journal o f Financial and Quantitative Analysis 38(1): 1-36.
Donnelly J. H., Gibson, J. & Ivancevich J. M. (1992). Fundamentals of management.8th edition, Homewood: Irwin.
Drucker, P. (1954). The Practice of Management. New York: Harper and Row.
80
Eisenberg, T., Sundgren, S. & Wells, M. T. (1998) “Larger Board Size and Decreasing Firm Value in Small Firms,” Journal o f Financial Economics 48, 35-54.
Eisenhardt, K. M. (1989). Agency theory: an assessment and review. Academy o f Management Review, 14, 57-74.
Ertugrul, M. Hegde, & S. (2009). “Corporate Governance Ratings and Firm Performance,” Financial Management 38, 139-160.
Fawcett, S.E. & Wisner, J.D. (1991). "Link Firm Strategy to Operating Decisions through Performance Measurement." Production and Inventory Management Journal 32, no. 3 5-11.
Garengo, P. & Bititci, U. S. (2007). “Towards a contingency approach to performance measurement: an empirical study of Scottish SMEs”, International Journal o f Management Reviews, Vol. 27, No. 8, pp 802-825
Gatauwa, J. M. (2008). The relationship between corporate governance practices andstock market liquidity for firms listed on the NSE. Unpublished Management
research paper University of Nairobi.
Gikang’a, S. G. (2008). Approaches and challenges o f privatization by Kenya Tea Development Agency (KTDA) Limited. Unpublished Management research paper. University of Nairobi.
Gillan, S., J. Hartzell, and L. Starks, 2003, “Explaining Corporate Governance: Boards, Bylaws, and Charter Provisions,” SSRN Working Paper No. 442740.
Gitagama, S. W. (2008). The relationship between business process re-engineering (BPR) and organizational performance: A case of East African Breweries Limited. Unpublished Management research paper. University of Nairobi.
Gompers, P., Ishii, J., & Metrick, A. (2001). Corporate governance and equity prices. Quarterly Journal o f Economics, 116: 107-155.
Gompers, P., Ishii, J. & Metrick, A. (2003). “Corporate Governance and Equity Prices,” Quarterly Journal o f Economics 118, 107-155.
Greenbury, S. R. (1995). Directors’ remuneration. London: Gee & Co. Ltd.
Greenley, G.E. (1994). “Strategic planning and company performance: an appraisal of the empirical evidence”, Scandinavian Journal o f Management, Vol. 10 No. 4, pp. 383-96.
81
Hampel, S. R. (1998). Committee on Corporate Governance: Final Report. London: Gee & Co. Ltd
Hendry, J. (2002). ‘The principal's other problems: honest incompetence and management contracts’. Academy o f Management Review, 27, 98-113.
Jebet, Caroline (2001),’A study of Corporate Governance’, The case of Quoted companies in Kenya. Unpublished Management research paper University of Nairobi.
Jensen B. (2000). Simplicity - The New Competitive Advantage, Cambridge, Mass.: Perseus Publishing.
Jensen, M.C. & Meckling, W.H. (1976). Theory of the firm: Managerial behavior, agency costs and ownership structure. Journal o f Financial Economics, 3, 305-360.
Jensen, M.C. (1986) “Agency Costs of Free Cash Flow, Corporate Finance, and Takeovers,” American Economic Review> 76, 323-329.
Johnson, G. & Scholes, K. (2002). Exploring corporate strategy. Text and cases.6th edition, London: Prentice Hall
Johnson, G. & Scholes, K. (2003). Exploring corporate strategy. Text and cases.6th edition, London: Prentice Hall
Johnson, G. Scholes, K. & Whittington, R. (2006). Exploring corporate strategy.7th edition, London: Prentice Hall.
Kaplan, R. S. & Norton, D. P. (1992). The Balanced Scorecard - Measures that Drive Performance, Harvard Business Review 70, 71-79.
Kaplan, R. S. & Norton, D. P. (1996). The Balanced Scorecard, Boston: Harvard Business School Press, 21
Karugo, J.G. (2003). Effect of liberalization on income of smallholder tea producers in central Kenya. Unpublished Management research paper. University of Nairobi.
Kenett, R.S., Waldman, D. K. & Graves, S. B. (1994). Process performances appraisal systems: a working substitute to individual performance appraisal. Total Quality Management, 5: 267-250.
Kenya Tea Development Agency. (2011). The small scale tea subsection story: 1st African tea convention conference.
82
Kenya law reports: Tea Act Cap 343 Laws of Kenya at www.kenyalaw.org.
Kerich, R., (2008). Corporate governance structures & performance in firms quoted in the NSE. Unpublished Management research paper University o f Nairobi.
Kiamba, J. M., (2008). Effect of corporate governance on financial performance of local authorities. Unpublished Management research paper University of Nairobi.
Kibet, P. K. K., (2008). A survey on the role of internal audit in promoting good corporate governance in state owned enterprises. Unpublished Management research paper University of Nairobi.
Kothari, G. R. (1990). Research Methodology: Methods and Techniques, 2nd ed. New Delhi. Wishwa Prakashan
La Porta, R., Lopez-de-Silanes, F., & Shleiler , A. (1999). Corporate ownership around the world. Journal o f Finance, 54, 471-517.
La Porta, R., Lopez-de-Silanes, F., Shleifer, A., and Vishny, R. W. (2000). “Agency problems and dividend policies around the world”. Journal of Finance, 55 1-33.
Lawler, E. E. (1994). Performance management: the next generation. Compensation and Benefits Review, 26(3): 10 -20.
Lenz, R. T. (1981). ‘Determinants of organizational performance: an interdisciplinary view’, Strategic management journal, 2(2), ppl 31 -154.
Levitt, A. (2000) “Remarks Before the Conference on the Rise and Effectiveness of New Corporate Governance Standards.” Speech by SEC Chairman at Federal Bank of New York, US Securities and Exchange Commission, 2000.
Lifschutz, S. A. & Feldshtein, S. (2010) ‘Corporate Governance Characteristics andExternal Audit Fees’, A Study of Large Public Companies in Israel: International Journal o f business and management, Vol. 5, No.3.
Malin, C. A. (2010). Corporate governance and complexity theory. Oxford, UK.
Matengo, M. (2008). The relationship between corporate governance practices and performance: The case of banking industries in Kenya. Unpublished Management research paper University of Nairobi.
Miller, D. (1988). ‘Relating Porter’s Business strategies to environmental and structure: Analysis and performance implication’, Academy o f Management Journal, 31(2), pp. 280-308.
Mohamed, R., Hui., Rahman, I. K. A. & Aziz, R. A. (2008). “Strategic performance measurement system and organizational capabilities: using levers of control framework”, International Review o f Business Research Papers, Vol. 4 No.3 pp 151-166
Muriithi, J. G. (2008). Corporate governance and the financial performance of state corporations: the case of New Kenya Co-operative Creameries (KCC). Unpublished Management research paper. University of Nairobi.
Mutiga, J. K. (2006), The percieved role o external auditor in corporate governance. Unpublished Management Research Paper, University of Nairobi.
Nanni, A. J., Dixon, J. R., Vollman, T. E. (1992)“The new performance challenge: measuring operations for world class performance”, Dow Jones Irwin, Homewood, IL
Neely, A., Mills, J., Platts, K., Gregory, M. & Richards, H. (1994). “Performance measurement design: A literature review and research agenda”, International Journal o f Operations & Production management, Vol. 25 No.4, pp. 1228-63
Neely, A., Platts, K. & Gregory, M. (2005). “Realizing strategy through measurement”, International Journal o f Operations & Production management, Vol. 14 No.3, pp. 140-52
Ngari, B. K. (2008). Critical factors that affect accessibility o f credit services by small scale tea farmers. Unpublished Management research paper. University of Nairobi.
Nyangito, & Kimura, J. H. (1999) “Provision o f Agricultural Services in a Liberalized Economy: The Case o f the Smallholder Tea Sub Sector”, Institute of Policy Analysis and Research
Organization for Economic Co-operation and Development Report. (2004). The OECD Principle o f Corporate Governance, The Organization for EconomicCooperation and Development, Paris.
Organization for Economic Co-operation and Development, (1999). “OECD Principles of Corporate Governance”, Paris, France
Organization for Economic Co-operation and Development, (2003) Survey of Corporate Governance Developments in OECD Countries.
84
Pearce, J.A. & Robinson, R. (1987). ‘The tenuous link between formal strategic planning and financial performance’, Academy o f Management Review, 12, pp. 6 5 8 -6 7 5 .
Porter, M. (1985). Competitive Advantage: Creating and Sustaining Superior Performance. New York: The Free Press.
Porter, M.E. (1985). Competitive advantage. New York, NY: Free Press.
Power, M. (2000). The audit Implosion: Reporting Risk from the inside.(London: ICAW).
Private Sector Corporate Governance Trust, (1999). Principles for Corporate Governance In Kenya; A Sample Code O f Best Practice For Corporate Governance, Nairobi
Robinson, R.B. & Pearce, J.A. (1983). ‘The impact of formalized strategic planning on financial performance in small organizations’, Strategic Management Journal, 4(3), pp. 197-207.
Robinson, R.B. & Pearce, J.A. (1988). “Planned patterns o f strategic behavior and their relationship to business-unit performance”, Strategic Management Journal, Vol. 9 No.
Santori, P. R. & Anderson, A. D. (1987). “Manufacturing performance in the 1990s: measuring for excellence”, Journal o f Accountancy, Vol. 164 No. 5, pp. 141-7.
Saunders, M., Philip, L. & Thornhill, A., (2007). Research Methods for Business Students. 4th edition, Harlow, England: Pearson Education Ltd.
Shleifer, A. & Vishny, R.W. (1997). A survey of corporate governance. The Journal Finance, 52(2), 737-783.
Tea Board of Kenya, (2011). Annual report. Unpublished
Thakkar, J., Deshmukh, S.G., Gupta, A.D., & Ravi, S., (2007).” Development of a balanced scorecard An integrated approach of Interpretive Structural Modeling (ISM) and Analytic Network Process (ANP)” International Journal o f Productivity and Performance Management, 56(1): 25-59.
Thompson, A., Strickland J. & Gamble, E. (2007). Crafting and executing strategy:The guest for competitive advantage. 15th edition, Boston: McGraw Hill.
Turnbull, N. (1999) Corporate Guidance for Internal Control. London: Gee & Co. Ltd.
85
Wooldridge, B. & Floyd, S. W. (1990), “The strategy process, middle management and organizational performance”, Strategic Management Journal, Vol.l 1, No.3, pp 231-41
Yener, D., A Corporate Governance Brief: What Is Corporate Governance?USAID/EE/MT/ILE. Unpublished
Zattoni, A. & Cuomo, F. (2008). Why adopt codes of good governance? A comparison of institutional and efficiency perspectives. Corporate Governance: An International Review, 16: 1-15.
86
IffiRSITV OF l&ilijSCHOOL OF BUSINESS
PROGRAM - LOWER KABETE CAMPUSTelephone. 732160 fixt. 208 telegrams' ' Varsity '. Nairobi 1 dev 22005 Varsity
P C. Box 30 I4)? Nairobi, Kenya
Date: 3rd October 2011
TO WHOM IT MAY CONCERN
The bearer of this letter Kernel Raymond Kipkoech
REGISTRATION NO: D61/73736/2009
The above named student is in the Master of Business Administration degree program. As part of requirements for the course, he is expected to carry out a study on Corporate Governance Practices and the Influence on Performance of Small Scale Tea Processing Companies in Kenya
He has identified your organization for that purpose. This is to kindly request your assistance to enable him complete the study.
The exercise is strictly for academic purposes and a copy of the final paper will be availed to your organization on request.
Your assistance will be greatly appreciated. I , p ,, ... >.
Thanking you in advance.
Sincerely,
MR, A LE X 3A LEH AC O O R D IN A T O R , SO B, KISU M U CAM PUS
Cc File Co py
i
ISO 9001: 2008 Certified
APPENDIX I: RESEARCH QUESTIONNAIRE
SECTION A:
NB: INFORMATION COVERS THE UNIT (SUBSIDUARY INCLUDED)
i) Company profile
2. Name of the company (Optional).............................................................
3. Year of establishment...................................................
4. Current number of employees (Tick or mark in the with any sign in brackets)
10, Most board decisions are made through?: Consensus [ ] or Voting [ ]
Section B: Corporate Governance
1. The following are some of or all Functions of the Board. Using the likert scale of one
five given below, please rate the extent to which the following applies to your
The Board has procedures in place to ensure that the organization is meeting its legal responsibilities.Formal review of the Board’s performance has become an integral part of the culture of the Board.The Board ensures that key members o f management are brought into the Board meetings so that they can participate and add value to their deliberations and work on behalf of the Board.The Board ensures all conflicts are Declared and ResolvedEvery Board member has been supplied with a letter of appointment.The letter of appointment defines the roles and functions of the Board and the specific role of each director.
2. The following statements relates to Board Meetings Management and Procedures in
the Company. Using the likert scale of one to five given below, please rate the extent to
which the following applies to your company.
Rating Scale
1= Not at all 2 = Less Extent 3= Moderate Extent 4= Large Extent
5 = Very Large Extent
1 2 3 4 5
Every Board member has been supplied with a Board manual and a copy of standing orders and regulations governing conduct of Board meetings.Every Board member was supplied with a calendar of meetings showing dates o f Board meetings, committee meetings etc. and key or critical events of the company.Board meetings are conducted in a manner that encourages open communication, meaningful participation, and timely resolution of issues.Sufficient time is provided during Board meetings for thoughtful discussion in addition to management dialogue.Board time is used effectively so that the Board adds value to management.The Board has adopted formal meeting and reporting procedures.Board members receive timely and accurate minutes, advance written agendas and meeting notices; and clear and concise background material to prepare in advance of meetings.All Board members are fully informed of relevant matters before hand and there are never any surprises.Absenteeism from Board meetings is the exception, rather than the
rule.Board meetings are facilitated, but not overtly influenced by the Chairperson.All Board members receive detailed Board papers, copies of draft minutes and agenda papers in advance.All proceedings and Resolutions of the Board are recorded accurately, adequately and on a timely basis
3. The following regard to Appointment, Selection, Induction, Training Development,
Succession and Removal of Directors in the company. Using the likert scale of one to
five given below, please rate the extent to which the following are practiced your
company.
Rating Scale
1= Not at all 2 = Less Extent 3= Moderate Extent 4= Large Extent
5 = Very Large Extent
1 2 3 4 5The Board is involved in the selection of appointed directors.The selection process considers and address any deficiencies in the skills of current Board members.The composition of the Board fairly represents the diversity of stakeholders.The Board members are introduced to their duties with an appropriate induction process.The Board actively encourages good candidates to stand for Board appointments.New Board members understand the extent of their relationship with management and the separation of stewardship and management.Board members evaluate their individual and overall Board performance, formally on an annual basis.The performance of the Chief Executive Officer is reviewed formally on an annual basis.Encouragement is given for Board members to continue their study of corporate governance and improve the skills they need.Directors understand the extent of their personal liability for the affairs of the company.A succession plan is in place for the Chairperson, Chief Executive Officer, Board members and senior management and is reviewed regularly.Directors who have not been contributing to the good governance of the
organization, and are uninterested in improving their performance, are asked to terminate.Where the ethical or professional conduct of any director is called into question, such director is suspended pending investigations.Board members bind themselves to uphold, honor, and respect the Code of Ethics of the organization on first appointment and to resign where their actions are called into question.
4. Indicate the applicability of the following statements regarding the Board Structure in
the company. Using the likert scale o f one to five given below, please rate the extent to
which the following applies to/or is practiced by company.
Rating Scale
1= Not at all 2 = Less Extent 3= Moderate Extent 4= Large Extent
5 = Very Large Extent
1 2 3 4 5The Board has a balanced mix of Executive, Non-Executive and Independent Non-Executive Directors.The roles of Chairperson of the Board and Chief Executive Officer are separated and held by different persons.The Board has established and appointed committees with defined terms of reference, composition and reporting requirements. These aspects are formally recorded.The committees have been established and appointed in light of,The need to increase the effectiveness of the Board by utilizing the specialized skills of Board members, The need to provide support and guidance to management and The need to ensure effective and independent professional consideration of issues e.g. audit reports, finance issues, etc.The Board has established and appointed, An Executive Committee, An Audit Committee and A Board Appointment and Remuneration CommitteeThe terms of reference of each of committee are restricted and defined.
5. With regard to Information and Communication in the company. Using the likert
scale of one to five given below, please rate the extent to which the following
applies to the company.
R a tin g Sca le
1= Not at all 2 = Less Extent 3= Moderate Extent 4= Large Extent
5 = Very Large Extent
(Tick or mark by any other symbol)
1 2 3 4 5
The Board understands, agrees, defines and propagates its functions on an annual basisThe Board knows and understands the Company’s beliefs, values, philosophy, mission and vision and reflects this understanding on key issues throughout the year.Such beliefs, values, philosophy, mission and vision are set and are consistent with the company’s status.The Board devotes significant time and serious thought to the organization’s long-term objectives and to the strategic options available to achieve them.The Board has defined and communicated to management the scope and powers, roles and responsibilities to be adhered to by management to meet routine and exceptional circumstances.The majority of the Boards time is not spent on issues of day-to-day management.The Board is involved in formulating long-range strategy from the beginning of the end of planning cycle.The Board ensures that the organization has sufficient and appropriate resources to achieve its strategic goals.Proposals from management are analyzed and debated vigorously before being approved by the Board. A proposal that is considered inappropriate is declined.The Board has an operating plan that specifies its functions, activities and objectives.When appropriate, the Board seeks counsel from professional advisors.The CEO’s remuneration and performance is reviewed and determined by the Board.The Board determines, annually, the objectives and measurement criteria for the CEO.A broad range of appropriate performance indicators are used to monitor the performance of management. Reliability is not placed solely on the financial statements provided by management.The Board has identified the groups to which it is Accountable and ResponsibleThe Board understands and agrees that its first duty is to the Company, Members and shareholders and Others in that orderBoard activities are conducted in an atmosphere of creative tension.
1= Not at all 2 = Less Extent 3= Moderate Extent 4= Large Extent
R a tin g Scale
5 = Very Large Extent
1 2 3 4 5Every Board member is supplied with all establishment instruments, all legal documents, the mission statement, and vision and strategy documents of the company on first appointment.Every Board member receives a copy of the Board manual together with a letter of appointment on first appointment.Every Board member receives copies of all policy documents including organization policy documents, personnel and financial manuals on first appointment and every time these are reviewed.Board members are encouraged to discuss matters with members of management after gaining the approval of the Chairperson or the Chief Executive.The Board receives sufficient information from management in an appropriate format as determined by the Board.The Board’s information requirements are communicated to management on a regular basis.Requested information is received in a timely fashion.The Board is proactive in developing an effective communication strategy for the company.The Company Secretary advises Board members regularly on matters o f governance and the applicable law.
6. With regard to Board Chairperson of the company, using the likert scale of one to
five given below, please rate the extent to which the following applies to the
company.
Rating Scale
1= Not at all 2 = Less Extent 3= Moderate Extent 4= Large Extent
5 = Very Large Extent
1 2 3 4 5Manages shareholder relationships and meets with shareholdersActively meets with potential sources of equity and debt capitalManages shareholder meetings effectively and promotes a sense of participation in all shareholders and promotes shareholder confidenceIs an effective Board leader
Promotes effective participation of all Board members in the decisionmaking processPromotes the image of the company, portraying the requisite leadership in the communityEffectively monitors and evaluates performance of the CEO and senior officersEffectively represents shareholders and the Board to the managementEffectively represents management to the Board and shareholdersIs effective in maintaining accountabilityIs effective in ensuring succession plans are in place at senior management levelIn conjunction with the CEO effectively represents the company to public, suppliers, customers and staffIn conjunction with the CEO effectively develops relationships and represents the company with regulators and government agenciesIn liaison with CEO and management, effectively leads the company in charitable, educational, and cultural activities
SECTION C: ORGANIZATIONAL PERFORMANCE MEASUREMENT
1. Indicate the applicability of the following Performance measurement perspectives;
Financial, Customers and people, Internal processes, Innovation, learning and
Growth & Quality (BSC based) in the company. Using the likert scale of one to five
given below, please rate the extent to which the following applies to/or is practiced by
company.
Rating Scale
1= Not at all 2 = Less Extent 3= Moderate Extent 4= Large Extent
5 = Very Large Extent
(Tick or mark by any other symbol)
Financial Perspective Measures 1 2 3 4 5
The company’s return on investment has been improving
The company regularly measures turnover of the business
There is regular measurement and monitoring of Labour cost
There is regular measurement and monitoring of revenue growth
Other operational costs are closely monitored, measured and have been improving annually
Improvement of buying centres and road networks
Continuous financial and technical audits carried out and results are factored into planning cycles for improvements.
The company adopt new technological trends (ICT,Automation etc)
Investment in revenue saving and generating projects and other opportunities.(e.g hydro)
There is cost effective and efficient machinery and vehicle maintenance.
Improved vehicle turnaround time (2 hours)
Maintain the recommended fleet complement. (8, +extra 4 for subsiduary)
2. Customers and people perspective measures 1 2 3 4 5
All customers complaints are captured and fully documented
The company monitors and responses to all customer complaints in a timely manner
Goods returned by customers (withdrawals, reprints for lack of demand)
The company tracts and monitors new customers for their products (none regular buyers of your teas)
There is specific policy to retain customers who over repeated purchases
Inclusion of customer requirements in subsequent product development cycle (brokers/buyers reports)
The company recruits multi skilled staff
There is training o f staff to improve staff skills and competence
The company has developed motivation strategies for staff to improve on service delivery