147


Corporate Information
BOARD OF DIRECTORS*Gan Chee Yen ChairmanShantanu Mitra Chief Executive Officer and Managing DirectorRajeev Kakar Non-Executive DirectorBoon Leng Quah (Danny Quah) Executive DirectorSudha Pillai Independent Director Renu Challu Independent DirectorDr. Robert Milan Shuster Independent Director
COMPANY SECRETARYPankaj Malik
STATUTORY AUDITORSS.R. Batliboi & Co. LLP
BANKERSAllahabad BankAndhra BankAxis Bank LtdBank of America N.A.Bank of BarodaBank of IndiaBank of MaharashtraBNP ParibasCanara BankCorporation Bank Credit Suisse AGDCB Bank LimitedDeutsche Bank AGFederal Bank LtdHDFC Bank LtdICICI Bank LimitedIDBI Bank
Indian Overseas BankJP Morgan Chase Bank N.A.Kotak BankOriental Bank of CommercePunjab National BankRoyal Bank of Scotland N.VSmall Industries Development Bank of IndiaSouth Indian Bank LtdStandard Chartered BankState Bank of Bikaner and JaipurState Bank of HyderabadState Bank of IndiaSyndicate BankThe Hongkong and Shanghai Banking Corporation Limited Union Bank of IndiaUnited Bank of India
RATING AGENCIESCredit Analysis & Research LimitedICRA LimitedIndia Ratings & Research Pvt. Ltd.
REGISTERED OFFICEMegh Towers, Third Floor, New No. 165, Old No. 307, Poonamallee High Road, Maduravoyal, Chennai-600 095,
CORPORATE OFFICEFloor 6, B Wing, Supreme IT Park, Supreme City, Behind Lake Castle, Powai, Mumbai - 400076
*As on 30th June 2015
Fullerton 12.11 PARK.indd 1 12/18/2015 2:21:24 PM

Chairman’s statement
“Fullerton India leverages its wide network in the urban and rural markets, extensive domain knowledge, cutting-edge analytics, deployment of advanced digital technology and highly engaged workforce to provide timely credit, enhance financial literacy, empower individuals and improve livelihoods.”
Chairman’s statement2
Fullerton 12.11 PARK.indd 2 12/18/2015 2:21:34 PM

The global economic growth remained relatively low in 2014-15 with
uneven growth across various economies. While there has been a
moderate growth in advanced economies, the emerging markets
and developing economies exhibited a slowdown. In India, however,
there has been a significant improvement in the macroeconomic
environment; inflation has markedly declined and growth has picked
up aided by key Government policies and lower global oil prices.
India is currently placed on a cyclical upturn, on the back of
significant reforms aimed at rationalising administered pricing
policies in petroleum and natural gas, helping infrastructure
development, liberalising foreign direct investment, facilitating
investments and improving savings. The prospects for growth
in FY16 is expected to be strong with benign inflationary outlook,
comfortable current account and fiscal deficit, buoyant foreign
capital inflows, a stable rupee and rising foreign exchange reserves.
India’s Non-Banking Finance Companies (NBFCs) have been
gaining systemic importance, their share growing from 10.7% of
banking assets in 2009 to 14.3% in 2014. The Indian consumer
finance market is expected to grow at a CAGR of 18% to US$1.2
trillion by 2020. The market still remains under penetrated with
significant upside potential opening up new opportunities for
growth in financial services both in the urban and rural economies.
Fullerton India has one of the largest dedicated distribution
networks, comprising 437 branches in more than 20 states, over
4,000 front end sales employees and close to 3,000 active channel
partners. Fullerton India’s Rural Business conducted under the
Gramshakti brand endeavours to cover the ‘last mile’ between the
branch and the end customer in each village enabling financial
inclusion of the under-served segments of the rural markets.
We have made substantial investments in technology platforms
and systems – the company’s data warehouse, Customer
Relationship Management (CRM), approval-in-principle engine
and analytics solutions help in reaching out to more than 1.1 mn
customers in a cost effective manner and offering innovative
solutions. The Android-based tablets using bio-metric
authentication processes deployed by the company enable
speedier servicing of the customers and enhance transparency,
trust and customer confidence.
Fullerton India’s risk management framework influences and
shapes the portfolio mix, delivers desired returns, optimises
enterprise-wide risk-return proposition and ensures adequate
capital and resource deployment. Our analytics function has
developed models to predict customer behaviours, price products
scientifically, maximise customer retention and launch products
proactively. We have continued to invest in building a strong
talent pool and we provide an environment for individuals to learn
and grow, and teams to win. Our human resources policies are
designed to ensure a healthy and safe workplace, provide equal
opportunity and encourage diversity.
The company recorded an excellent financial performance with
significant growth in assets, revenues and profits. Our Assets
Under Management grew by 39% and total advances increased by
41%. A combination of improving volumes, productivity and healthy
credit quality resulted in an increase in our profit after tax by 60% to
H301 crore. The capital adequacy ratio was at a healthy 19.6% and
return on average equity recorded a considerable growth to 20.9%.
Fullerton India’s Corporate Social Responsibility initiatives
enable sustainable development and inclusive growth across
communities. Since inception, more than 8 lakhs household have
been benefitted through Livelihood , Health Care, Educational and
Environmental Programs. I am pleased to report that our CSR
initiatives have been recognized by various institutes and we have
bagged some prestigious awards like –INDIACSR best case Awards
2014, Amity Global CSR award in women Empowerment category
and Golden Peacock Award for Innovative product category
(Merchandise Loan).
On behalf of my colleagues on the Board of Directors, I would like
to commend the excellent efforts of the entire team at Fullerton
India for the outstanding performance in the last financial year.
I would also like to express our gratitude to the regulators, all
our stakeholders and customers for their continued support
in enabling us to build Fullerton India into one of India’s leading
financial institutions.
Gan Chee Yen
Chairman
Dear Shareholders,
3Annual Report 2015 Fullerton India Credit Company Limited
Fullerton 12.11 PARK.indd 3 12/18/2015 2:21:34 PM

Chief Executive Officer and Managing Director’s statement
Chief Executive Officer and Managing Director’s statement
“Our Business strategy driven by a well defined risk appetite framework, our relentless focus on credit quality, focus on reshaping the asset book towards secured business and use of sophisticated analytics have enabled us to build a high quality asset portfolio and ensure an excellent business performance”
4
Fullerton 12.11 PARK.indd 4 12/18/2015 2:21:36 PM

I am happy to present to you the Annual Report for the financial year ended March 31, 2015.
The company’s performance for the financial year has been outstanding and I am pleased to share some highlights with you:
Total assets of H10,139 cr against H7,268 cr in the previous year, an increase of 40%
Total Advances of H8,610 cr against H6,103 cr in the previous year, an increase of 41%
Operating income of H1,012 cr against H826 cr in the previous year, an increase of 22%
Net Profit of H301 cr against H188 cr in the previous year, an increase of 60%
Return on average equity 20.9%
Return on average assets 3.4%
Fullerton India’s rural business (Gramshakti) is now present in eight states, reaching out to over 42,000 villages and offering a bouquet of products comprising mortgage loans, vehicle loans, micro loans for livelihood advancement, equipment loans, business loans and micro-entrepreneur loans. In line with our endeavour to increase our reach, particularly in the underserved and underbanked segments, we have expanded our network into the rural markets of Chattisgarh during the current year. Gramshakti has added more than 274,000 customers during the year and our rural customer base has now grown to more than 9 lakhs. Fullerton India’s urban business is present across 191 cities, servicing more than 2 lakh customers spread across 20 states. During the next year, Fullerton India is planning to further expand its network and reach out to customers in selected eastern states of the country.
We continue to maintain our focus on strengthening the Balance Sheet by rebalancing the loan portfolio and secured assets now contribute to 45% of the overall portfolio. In the urban business, the primary growth driver has been the Loans Against Property (LAP) segment and secured assets now contribute to 53% of the urban portfolio.
Our business strategy is driven by a well defined risk appetite framework. Credit norms have been specifically designed to achieve predictable Risk Adjusted Returns with Expected Lifetime Losses, through the implementation of internally developed risk grading models, based on Basel methodologies. We continue to maintain focus to ensure that our policies, processes and other norms guiding our businesses build a portfolio that will yield stable returns even in difficult macro-economic environment. We continue to invest in people with right skill sets at all levels, technology and advanced analytics to keep pace with the
growth and to ensure that we are well positioned to leverage our established and growing network. The robustness of our risk management processes has led to a significant improvement of the company’s asset quality demonstrated by the absolute amount of NPA maintained at same levels as last year, despite a growth of 39% in Assets Under Management.
The business remains well funded with the focus on building longer term bank funding which is more stable. Adequate liquidity buffers in terms of cash and equivalents are maintained by the company to be sufficiently funded for near-term lending and repayments. Over the years, funding resources have been vastly diversified giving us the impetus to grow with confidence. Fullerton India has lines of credit from more than 75 institutions including banks, mutual funds and insurance companies. The company was rated AAA by CARE Ratings and AA+ by ICRA Ltd and India Ratings.
In FY15, we have conducted more than 1,000 CSR programmes, impacting over 35,000 rural households across the country through different programs like ‘Jeevika’, the vocational training programme for women and . ‘Pashu Vikas’, the cattle care initiative.
Fullerton India has always maintained the highest corporate governance standards and practices. The cardinal principles of independence, accountability, responsibility, transparency, fair and timely disclosures and the best Board practices are strictly adhered to for discharging the company’s responsibility towards its shareholders , customers, employees and lending institutions.
We believe that the company is in a unique position to participate in the financial inclusion initiatives that are currently being fostered by the government and regulators. Fullerton India specialises in serving customers in the underserved Tier 2 – 4 markets, with 40% of its total branch network in these areas. We expect to further expand our branch network across these locations over the next few years.
We believe that there exists a huge potential in Housing Finance Business and we are presently evaluating a proposition of offering home loans across our extensive footprint in Urban and Rural India by operationalising our Housing Finance subsidiary.
I would like to thank our parent companies – Fullerton Financial Holdings Pte Ltd and Temasek Holdings Pte Ltd, Singapore for their support. We greatly appreciate their faith and confidence in the team managing this organization and look forward to their continued support and guidance in growing the business. I would also like to thank the Regulators, our Bankers and Rating Agencies for their continued support and confidence in us.
Shantanu Mitra,
Chief Executive Officer and Managing Director
Dear Shareholders,
5Annual Report 2015 Fullerton India Credit Company Limited
Fullerton 12.11 PARK.indd 5 12/18/2015 2:21:36 PM

Delivering outstanding performance, FY15
60%
Net profit growth
41%
Overall growth in advances
Fullerton performance
Assets under management
(in H crore)
3,932In FY12
8,669In FY15
Total Customer accounts
7,13,774In FY12
12,62,780In FY15
Own branches
346 In FY12
437 In FY15
Employees
6,362 In FY12
7,244In FY15
Proportion of secured asset
in total loan portfolio (%)
33In FY12
45In FY15
Fullerton India has positioned itself as one of India’s leading Non-Banking Finance Companies, operating across rural and urban markets.
Increasingly financing the needs of an under-banked and under-serviced population.
Catalysing prosperity in the areas of its presence.
Corporate Highlights
Accelerating its growth momentum.
6Corporate Highlights
Fullerton 12.11 PARK.indd 6 12/18/2015 2:21:36 PM

19.6%
Capital adequacy ratio
1.4%
Net NPA to total customer
outstanding
40.3%
Disbursement growth
Parentage Part of the global financial conglomerate, Fullerton Financial Holdings (a subsidiary holding of Temasek Holdings Pte Ltd), present
across seven countries with a customer base of six million. Fullerton Financial Holdings invests in financial institutions in emerging
markets with a focus on business and consumer banking.
ProductsThe Company has the following products under their portfolio:
Personal Loans Business Loans Loans Against Property SME Loans Rural Livelihood Loans Rural Enterprise Loans
Rural Housing Finance Two-Wheeler Loans Commercial Vehicle Loans Merchandise Loans Insurance
Balance Sheet Size
(in H crore)
4,582 In FY12
10,139 In FY15
EBIDTA* (in H crore)
409In FY12
1,033 In FY15
Shareholders’ fund
(in H crore)
776 In FY12
1,567In FY15
PBT (in H crore)
49 In FY12
301In FY15
Total revenue (in H crore)
932 In FY12
1,720In FY15
*EBIDTA amount before considering finance cost
7Annual Report 2015 Fullerton India Credit Company Limited
Fullerton 12.11 PARK.indd 7 12/18/2015 2:21:36 PM

Board of Directors*
1
3
5
2
4
6 7
1 Gan Chee Yen, Chairman 2 Shantanu Mitra, Chief Executive Officer and Managing Director 3 Rajeev Kakar, Non -Executive Director 4 Boon Leng Quah (Danny Quah), Non - Executive Director 5 Sudha Pillai, Independent Director 6 Renu Challu, Independent Director
7 Dr. Robert Milan Shuster, Independent Director
*As on 30th June 2015
8Board of Directors
Fullerton 12.11 PARK.indd 8 12/18/2015 2:21:39 PM

1. Gan Chee YenChairman
Chairman of the Company since November
2011. CEO and Board member of Fullerton
Financial Holdings Pte Ltd, Singapore (FFH),
and Board Commissioner of Bank Danamon.
Previously Co-Chief Investment Officer and
Senior Managing Director, Special Projects at
Temasek International. With Temasek since
2003, first as CFO and subsequently in various
senior management roles. Has served on
several boards including Neptune Orient Line.
Is a member of the Institute of Certified Public
Accountants of Singapore.
2. Shantanu MitraChief Executive Officer and Managing Director
since August 2011
Joined FFH in 2010 as Head of Consumer Risk
Management for consumer markets across all
operational entities in various countries including
India. Before the current role, he was the Deputy
CEO of the Company.
Over three decades of experience in financial
services, with about 20 years at Standard
Chartered and Citibank where he had stints
in Singapore, Thailand and India. A Chartered
Accountant with the Institute of Chartered
Accountants, England and Wales.
3. Rajeev KakarNon - Executive Director
Head of Consumer Banking at FFH. Executive
Director and founder CEO of Dunia Finance
LLC, a Dubai-based JV partnered by Fullerton
Financial Holdings. Has over 20 years of
experience in financial services. Served
Citibank in a variety of Consumer Banking roles
internationally. Is a Bachelor of Technology &
Mechanical Engineering from the Indian Institute
of Technology Delhi, and MBA from Indian
Institute of Management, Ahmedabad.
4. Boon Leng Quah (Danny Quah)Non - Executive Director
Chairman of the Risk Oversight Committee and
Nomination and Remuneration Committees
of the Company’s Board. Currently, Head of
Corporate Development at FFH, Mr. Quah is a
seasoned banker with more than 20 years of
experience in the financial services industry.
Previously, he was the CEO of Fullerton Credit
Services (FCS), part of the FFH group. He had
held various senior management positions in
consumer and corporate banking at Standard
Chartered Bank, like CEO of Negara Brunei
Darussalam, Country Consumer Bank Head
(Philippines), Regional Consumer Banking
Head (North China) and GM of Consumer Bank
Mortgages (China).
His experience also cuts across sales, credit &
operations with distinguished track records. He
graduated from Imperial College of Science,
Technology and Medicine (London).
5. Sudha PillaiIndependent Director
Ms. Pillai, a 1972 batch IAS officer held a number
of senior positions in the Government of India
and the State Government of Kerala for 40 years.
She handled the Industry and Finance portfolios
for nearly twenty years. In the Centre, she worked
in the Ministries of Industry, Corporate Affairs,
Labour and Employment .She contributed
notably to reforms in Industrial and Foreign
Direct Investment policies as also in formulating
the National Skill Development Policy. In Kerala,
as Principal Secretary Finance she worked to
achieve enhanced developed outcomes, coupled
with efficient fiscal management. Earlier as
CMD, Kerala Finance Corporation she dealt with
project financing to SMEs. Her last assignment
was as Member Secretary (in the rank of Minister
of State), Planning Commission, Government
of India. She is also in the boards of many other
companies.
6. Renu ChalluIndependent Director
Ms. Renu Challu is a seasoned banker with
decades of experience in Commercial and
Investment Banking. She was with the State
Bank of India (SBI) for more than 38 years
serving in variety of positions. Some of the
positions held at SBI include President & COO
at SBI Capital Markets, MD & CEO at SBI DFHI,
MD of State Bank of Hyderabad and Deputy
MD, Corporate Strategy and New Business
Development. She is on the Board of many other
companies.
7. Dr. Robert Milan ShusterIndependent Director
Dr. Shuster, is a professional with decades
of experience in the banking sector. He is
currently Chairman of the Audit Committee at
Bank Danamon Indonesia. He served at Asian
Development Bank, ING Bank, National Bank of
Canada, Nippon Credit Bank in various capacities.
After working as the President and CEO of
P. T. Bank PDFCI, he served Bank Danamon
Indonesia in various capacities. He became its
president and CEO and later its Independent
Commissioner. He has also served many other
entities in Directorial and advisory capacities. He
holds Ph.D. in International Economics and Law
from University of Oxford. He also holds Master
of Law from London School of Economics and
Bachelor of Business Administration from Ivey
Business School.
9Annual Report 2015 Fullerton India Credit Company Limited
Fullerton 12.11 PARK.indd 9 12/18/2015 2:21:40 PM

1 Shantanu Mitra, Chief Executive Officer and Managing Director 2 Pratik Gandhi, EVP, Chief Financial Officer 3 Rakesh Makkar, EVP, Head of Business, Marketing & CSR 4 Rajesh Krishnamoorthy, EVP, Chief Risk Officer 5 Ravindra Rao, EVP, Chief Operating Officer 6 Swaminathan Subramanian, EVP, Head Human Capital 7 Ajay Pareek, EVP, Sales & Product Head - Urban Business 8 Deepak Patkar, EVP, Internal Audit
1 2
5 6
3
4
7 8
Leadership Team
10Leadership team
Fullerton 12.11 PARK.indd 10 12/18/2015 2:21:43 PM

1. Shantanu MitraChief Executive Officer and Managing Director
Shantanu is a Chartered Accountant from
England and Wales and joined Fullerton Financial
Holdings, Singapore in 2010 as the Head of
Consumer Risk for the Group after nearly three
decades in Consumer Banking and Risk with
Citibank and Standard Chartered Bank. Shantanu
has worked across various Asian markets,
including Singapore, Thailand and India, and was
the Regional Credit Head for India, Middle East,
South Asia and Africa. Shantanu took over as
CEO and MD of Fullerton India in Aug 2011.
2. Pratik GandhiEVP, Chief Financial Officer
Pratik is a Chartered Accountant and Company
Secretary and has over 25 years of experience
in Banking and Non-bank industries. Prior to
joining Fullerton India, he was the CFO and Head
of Portfolio management/ MIS for CB Risk at
Standard Chartered Bank in Singapore. Pratik
has also held positions of Regional CFO for
Consumer Finance Business for APAC in Citibank
(based in Singapore) as well as Director and
CFO in CitiFinancial India in the past. Pratik is
responsible for Finance, Treasury and Company
Secretarial services of Fullerton India.
3. Rakesh MakkarEVP, Head of Business, Marketing & CSR
Rakesh spearheads Fullerton India’s Urban
and Rural business, in addition to heading the
Marketing & CSR functions. He has over two
decades of valuable experience including new
business and brand launches while developing
dynamic sales teams, product and distribution
networks. Prior to joining Fullerton India,
Rakesh was the Chief Distribution Officer and
Management Committee member at DHFL.
His earlier stints include Future Money as Chief
Executive Officer, Citigroup and as a consultant
for a Vietnamese Bank on consumer finance.
Rakesh is a qualified national rank holder
Chartered Accountant and an MBA.
4. Rajesh Krishnamoorthy EVP, Chief Risk Officer
Rajesh is responsible for Enterprise Risk
Management, Legal and Compliance functions in
Fullerton India. A management graduate, Rajesh
joined Fullerton India in September 2013 and
comes with over 18 years of post-qualification
experience in the financial services sector across
consumer and commercial lending. Prior to
Fullerton India, Rajesh was the Chief Risk Officer
at Bajaj Finance Limited. His other stints include
working in risk management domains at HSBC
Ltd., GE Countrywide, Prime Financial and First
Leasing.
5. Ravindra RaoEVP, Chief Operating Officer
Ravindra comes with 20 years of experience in
Risk Management and Business function. He has
been with Fullerton India since September 2011
and has headed Credit Policy & Underwriting,
Collections, Fraud Risk, Operational Risk, Legal
and Compliance, Mortgage and SME business.
As COO, he is now responsible for Operations,
Customer Service, Technology, etc. Prior to
joining Fullerton India, Ravindra was heading
Collections and Fraud Control for South Asia in
Standard Chartered Bank. He has held senior
positions at HDFC Bank, ABN Amro.
6. Swaminathan SubramanianEVP, Head Human Capital
Swaminathan is an engineer from Jadavpur
University, Kolkata and an MBA from XLRI. He
joined Fullerton India in May 2013 to lead the
Human Capital and Training function. Swami
has over 18 years of HR experience across Asia,
Africa and Middle East markets. He has held
various leadership positions including Head
of HR for Retail Banking, Barclays- Africa and
Head of Compensation & Benefits, Standard
Chartered Bank, South Asia and more recently as
HR lead for Corporate and Investment Banking
Operations & Technology with JP Morgan Chase,
India.
7. Ajay PareekEVP, Sales & Product Head - Urban Business
Ajay is a Chartered Accountant with over 18
years’ experience in audit & financial services
Starting his career with A.F. Fergusons & Co, he
moved to CitiFinancial as part of the start-up
team to launch their retail finance business in
India. At CitiFinancial he handled the risk and
operations functions for 2 years and later took
over as a Regional Business Head. After 5 years
at CitiFinancial, he joined Fullerton India in 2005
as part of the start-up team. Ajay is now Head
- Sales and Product for the Urban Business
and oversees distribution of the Company’s key
products of Personal Loans, Mortgages, SME
and Commercial Vehicle .
8. Deepak PatkarEVP, Internal Audit
Deepak is an Electrical Engineer with a Masters
in Management from Jamnalal Bajaj Institute,
Mumbai. In his work experience of 18 years
he has handled diverse roles including Quality
Assurance, Sales and Distribution, Debt
Collections, Operational Risk and Audit. After
successful stints at Cable Corporation, HCL
Infosystems and Citibank he joined Fullerton
India in 2007 as Head – Retail Collections.
Deepak manages Internal Audit at Fullerton India
in his current profile.
11Annual Report 2015 Fullerton India Credit Company Limited
Fullerton 12.11 PARK.indd 11 12/18/2015 2:21:43 PM
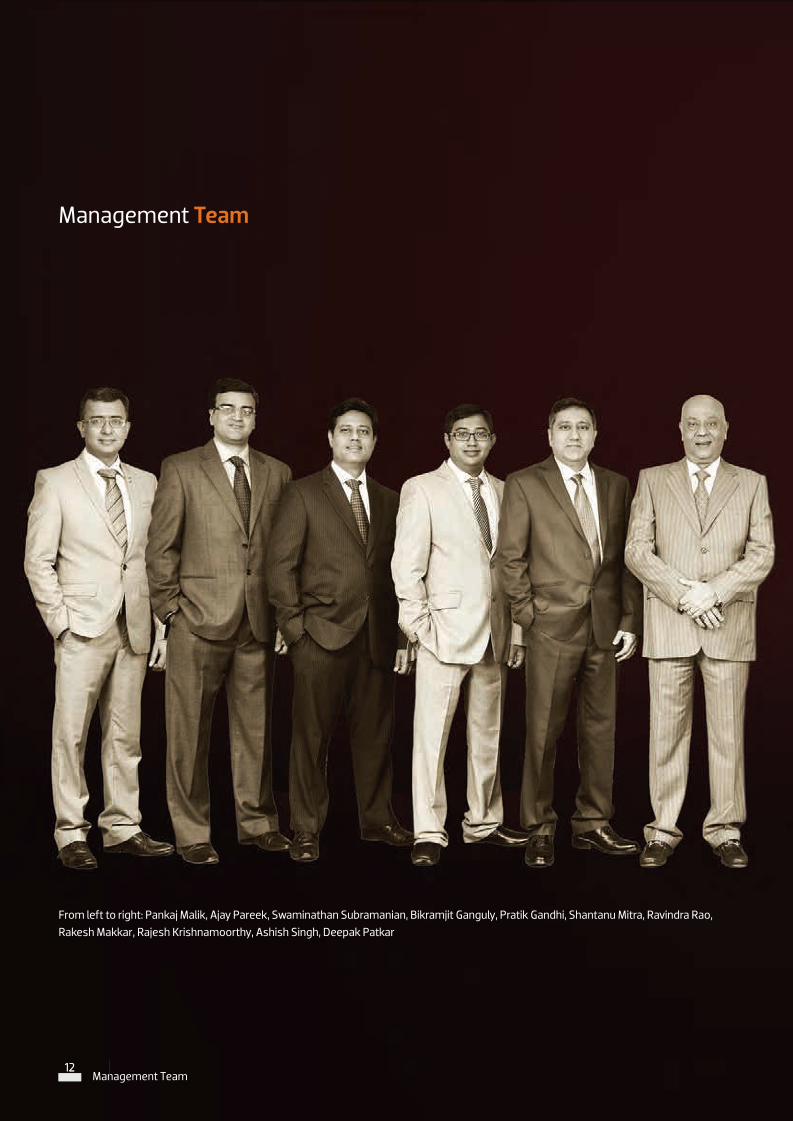
Management Team
From left to right: Pankaj Malik, Ajay Pareek, Swaminathan Subramanian, Bikramjit Ganguly, Pratik Gandhi, Shantanu Mitra, Ravindra Rao, Rakesh Makkar, Rajesh Krishnamoorthy, Ashish Singh, Deepak Patkar
12Management Team
12
Fullerton 12.11 PARK.indd 12 12/18/2015 2:21:48 PM

13Annual Report 2015 Fullerton India Credit Company Limited
Fullerton 12.11 PARK.indd 13 12/18/2015 2:21:52 PM
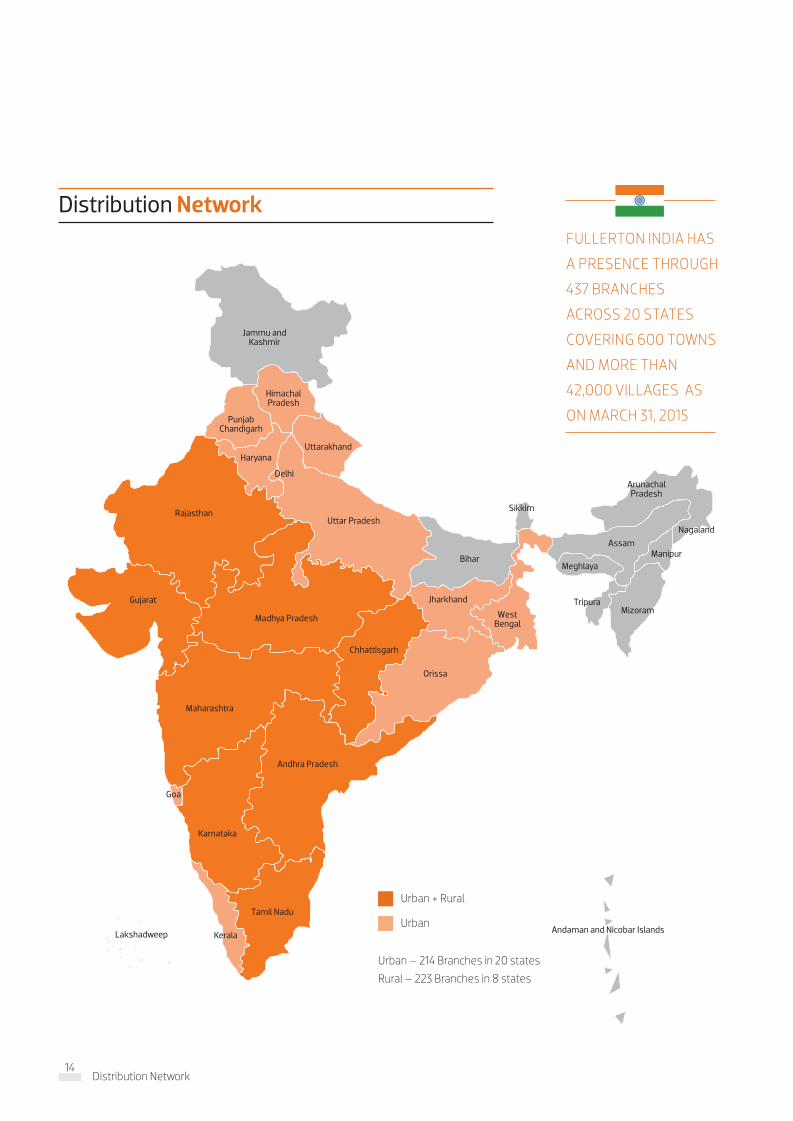
Urban + Rural
Urban
Urban – 214 Branches in 20 states
Rural – 223 Branches in 8 states
Jammu and Kashmir
Himachal Pradesh
Punjab Chandigarh
HaryanaUttarakhand
Delhi
Uttar PradeshRajasthan
Gujarat
Maharashtra
Madhya Pradesh
Chhattisgarh
Jharkhand
Orissa
Andhra Pradesh
Andaman and Nicobar IslandsLakshadweep
Tamil Nadu
Arunachal Pradesh
AssamManipur
Nagaland
Tripura
Meghlaya
MizoramWest Bengal
Sikkim
Bihar
Kerala
Karnataka
Goa
Distribution NetworkFULLERTON INDIA HAS
A PRESENCE THROUGH
437 BRANCHES
ACROSS 20 STATES
COVERING 600 TOWNS
AND MORE THAN
42,000 VILLAGES AS
ON MARCH 31, 2015
Distribution Network14
Fullerton 12.11 PARK.indd 14 12/18/2015 2:21:53 PM

Experience: The Company is part of Fullerton Financial Holdings,
a global conglomerate engaged in providing financial services to
consumers in seven countries. The Company brings to table the
best practices derived from each country.
13%CAGR growth in revenue
in the five years leading
to FY15
Brand: The Fullerton brand stands for trust, superior service and
innovative solutions. This is reflected in the Company reaching
H8,669 crore in assets under management as at March 31, 2015.
10+Number (lakhs) of
customers serviced by the
Company, as at March 31,
2015
Products: The Company created a large product portfolio
serving the various needs of both rural and urban customers
across the country
15Number of products in
Fullerton’s portfolio
Reach: Fullerton is present in 20 states covering nearly 600
towns and more than 42,000 villages. Nearly 70% of the
Company’s branches are in towns with populations of 1,00,000
to 5,00,000.
437Total number of
branches
Competitive advantages
Asset quality: The Company demonstrated higher asset quality
reflected in a decline in its non-performing assets even as its
book size increased, signifying strong credit appraisal, credit
underwriting and collection efficiency.
1.4%Net NPA as on March 31,
2015.
Rural-driven: The company derived 18% of Assets Under
Management from semi-urban and rural India and 67% of
incremental Assets Under Management in FY15.
223Number of rural
branches across eight
states in India.
Governance: Fullerton’s Board comprises four sub-
committees: Risk Oversight Committee, Audit Committee,
Nomination & Remuneration Committee and Corporate Social
Responsibility Committee. This strengthened governance
culture, has helped the Company in improving governance
standards and sustainability.
37.5% of the Company’s Board
comprised Independent
Directors (as on March
31, 2015)
15Annual Report 2015 Fullerton India Credit Company Limited
Fullerton 12.11 PARK.indd 15 12/18/2015 2:21:53 PM
Functional overview
Business and Marketing
Risk Management
Analytics
Funding & Treasury
Information Technology
Human Capital
16Functional overview
Fullerton 12.11 PARK.indd 16 12/18/2015 2:22:00 PM

Business and Marketing
In the business of retail finance, it is necessary to create a customer pull, strengthen online presence, recruit talent and widen product choice.
Over the years, Fullerton India’s business strategy, diversified product suite, best in class ‘analytics backed’ risk management practices, customer friendly approach, strong distribution network and commitment to the community have played a significant role in establishing the company as the preferred financial partner for its customers.
Fullerton India differentiatorFullerton India’s reach continues to be the biggest differentiator in the organised retail finance market
in India. Nearly 70% of the branches are in rural and suburban locations with population base ranging
between one to five lakh. In its target segments Fullerton India has one of the largest dedicated
distribution networks, comprising 437 branches, over 4,000 front end sales employees and close to
3,000 active channel partners.
17Annual Report 2015 Fullerton India Credit Company Limited
Fullerton 12.11 PARK.indd 17 12/18/2015 2:22:12 PM

Rural Business OverviewFullerton India’s Rural Business – Gramshakti has today,
established itself as one of the leading financial services
provider in Rural territories with presence across large number
of towns and villages, offering a bouquet of products to meet
the customers requirement. The services are designed for the
lower mass market segment consumers to (i) advance and
grow their existing livelihoods (ii) invest in a new livelihood /
vocation (iii) help them achieve their aspirational needs.
Gramshakti currently has a network of 223 branches spread
across 8 states covering over 42,000 villages. As of March
2015, Gramshakti has a base of over 9 lakh customers having
over 10.6 lakhs relationship accounts. `
HighlightsRural Business:
Expanded the rural branch network into Chattisgarh, our
8th state – Across the country a total of 45 new branches were
added during the year
Disbursed over 920,000 loans through the year – Total of
H2,065 cr
Robust Portfolio quality with a loss rate of 0.32%
Strong profitability with a pre-tax profit growth of 107% over
FY14
Urban Business OverviewFullerton India’s Urban business distribution is its key
competitive advantage. Over the past year the urban business
has ingrained analytics in its distribution strategy aligning
manpower and channels to target profitable customer
segment. Our urban business has a network of 214 branches
spread across 20 states.
Over the years, Fullerton India’s Urban business has built a
strong sustainable portfolio. This has been led by:
Shift in target market to a superior customer profile
Gradual movement to a secured portfolio led by loan
against property and commercial vehicle
Focus on customers with existing bureau records
HighlightsUrban Business:
In the current year our Urban business has developed
significant capability in lead management through the
deployment of a CRM, allowing it to leverage its existing
customer base for cross-sell and up-sell effectively
Strategic objective of increasing the secured products
portfolio met - with secured portfolio outstanding at 53%
Disbursal growth in LAP retail and SME lending by 59% over
FY14
Personal loans to salaried individuals grew by 38% over FY14
MarketingDuring the course of the year, the Company also strengthened
its marketing initiatives with the objective to reach customers
faster, wider, deeper and better.
The Company enhanced visibility by engaging with local media
channels in the regions of its presence and investment in
outdoor media activities.
Brand amplification:
Regional activations to build brand awareness
PR coverage at regional levels
Extensive outdoor and radio campaign at select locations
during Q4
Creation of marketing collaterals basis product and regional
requirements
Strengths Fullerton’s Gramshakti program , a well-entrenched brand
helps enhance its rural presence
Last mile reach to customers across underserved locations helps in offering financial services at customer’s doorstep
Deep understanding of the target customer segment and credit worthiness enables tailoring product offerings in line with customer needs
Strong channel relationships built over several years has helped the company in delivering volumes
Continuous Community Engagement has built goodwill and trust
Fullerton India’s ability to leverage technology has helped it to service the customers in a seamless and efficient manner
18 Business and Marketing
Fullerton 12.11 PARK.indd 18 12/18/2015 2:22:12 PM

Risk management
Ability to manage evolving variables with competence, leading to predictability and sustainability has been the hallmark of Fullerton India’s Risk Management practice. We leverage our extensive domain knowledge to strengthen long term viability across products, geographies and market cycles.
19Annual Report 2015 Fullerton India Credit Company Limited
Fullerton 12.11 PARK.indd 19 12/18/2015 2:22:24 PM

The Fullerton India differentiatorUsing optimal mix of judgmental criteria and an highly evolved
analytics-backed decision-making platform, we manage
through the life cycle, different customer segments across
diverse lending products and across geographies. Credit
norms are designed to achieve predictable Risk Adjusted
Returns with Expected Lifetime Losses.
Fullerton India is the only NBFC in India to implement Recession
Loss Multiplier (RLM) which helps the Company map portfolio
volatility in case of a likely slowdown in the economy through
the use of sophisticated analytics. This helps the Company in
maintaining superior portfolio quality and enhancing business
profitability across product life cycle
OverviewThe role of risk management in the retail finance sector is
critical in view of the country’s vastness, deep diversity, relative
absence of organised and well established support structures,
need to blend organised and surrogate methods and the need
to cover rural and urban regions.
Fullerton’s key principles of risk management comprise the
following:
The company has enunciated an overarching well defined
risk appetite framework that, influences and shapes the
portfolio mix, desired returns, optimises enterprise-wide risk-
return proposition and ensures adequate capital and resource
deployment
The company has an independent risk management and
governance function
Maintenance of well documented credit risk policies and
programmes with robust performance guardrails, as the basis
of its structured risk management approach.
Extensive use of risk and business analytics.
Credit bureau data is used as an integral part of informed
decision-making and portfolio management
The company has invested in forward-looking risk
assessment protocols; its pre-emptive credit and liquidity
interventions have translated into proactive responsiveness to
challenges.
Risk Appetite Framework At the heart of Fullerton India’s risk management approach
lies a clear understanding of its desired risk appetite. The risk
appetite framework approved by the Board of Directors, covers
different types of risks the organisation is exposed to and also
clearly defines the Company’s risk taking perimeters. Using
this the management decides the kind of segments to grow
into, products to be offered, portfolio shape to be built and
resources to be committed. The decisions are driven not only
by return metrics like Return on Equity (RoE) but also based
on earnings volatility of such segments to take a “through
the cycle” view incorporating economic, credit and market
scenarios.
Fullerton is a pioneer among NBFCs in India, to adopt this
framework, which uses extensive statistical models that
are aligned with approaches aligned with Internal Ratings
Based (IRB) norms of Basel II. Fullerton India periodically de-
risks itself through portfolio-level stress tests that assess
the impact of extreme, though probable, stress scenarios
(economic, credit, market and collateral aberrations) and their
financial impact.
Country Risk AssessmentFullerton India utilises macroeconomic and portfolio indicators
to arrive at an overall country risk outlook. The related risk
assessment then applies itself across five critical areas (credit
underwriting and liquidity policies, delegation authorities,
exceptions, collections intensity and early warning triggers)
depending on the outlook and corresponding management
responses are initiated.
Product Policy, Governance and Monitoring frameworkFullerton India adopts an independent approval process
guided by the use of product programs, customer selection
20Risk Management
Fullerton 12.11 PARK.indd 20 12/18/2015 2:22:24 PM

criteria (CSC), credit acceptance criteria (CAC) and other credit
underwriting processes for sanctioning and booking each loan.
Credit policies are designed by clearly defining target market,
customer selection and credit acceptance criteria, credit
approval methodology, verification, post disbursement
monitoring, collections and remedial management policies.
Credit policies are reviewed on a periodic basis based on
changes in macro- economic, industry / segment level and
customer level trends including Credit Bureau learnings.
The Chairman of the Risk Oversight Committee, CEO, Head of
Business and Chief Risk Officer engage in an ongoing appraisal
of exposure caps, performance triggers, test programs and
country risk assessments.
Credit UnderwritingAt Fullerton India, an independent team governs the credit
assessment, approval and administration processes.
Processes are automated wherever possible to minimise
human intervention. A Business Rules Engine ensures
changes in policy which can be immediately implemented at
the branches. Fullerton India over the years, has optimised its
credit underwriting structures in urban retail and commercial
businesses depending on the product nuances, to have a
prudent mix of centralised, decentralised and Hub-and-Spoke
models.
Operational risk management The operational risk framework is designed on both business
and functional levels including business groups, credit,
operations, corporate and support functions. An operational
risk management committee supervises the management of
operational risks.
Information security risk managementThe Information Security function administers risk
management at an enterprise level. The IT Team is also
responsible for managing and mitigating any risks that may
emerge as a threat to data or the effective functioning of the
company.
Fraud risk management Fullerton India’s autonomous fraud management detects and
eliminates fraud risks–from origination to credit acceptance to
collection. A neural fraud risk system (Hunter), provides active
fraud risk alerts, and has enabled significant saves.
Liquidity risk managementFullerton India has implemented treasury policies to manage
liquidity risks, investments, interest rate risk and borrowings.
These policies articulate the governance framework,
committee responsibilities and functions, risk measurement
parameters, measures for managing stress situations, inbuilt
alerts and other controls.
Strengths The robustness of the Company’s risk management practices
is validated through an increase in profit after tax, higher
business returns and net non-performing assets being lower
than the industry average.
The Analytics team along with the Risk Management teams,
translated prevailing realities into policy and product pricing
using proprietary methods to risk-rank first time borrowers in
Tier 2, Tier 3 and Tier 4 locations; monthly disbursals were in
excess of R200 cr
To achieve all this, by adopting Basel II guidelines, the Company
developed recession loss multiplier (RLM), basing decisions
around the concept of “lifetime profitability” in which losses
cannot exceed a year’s operating profit during recession
periods
The company made extensive use of information from the
Credit Bureau in risk grading the segments and adopting
proactive early warning systems, through cutting-edge
investments in analytics
The Company’s risk management framework ensured robust
risk standards, reconciling customer needs with sustainable
profitability.
Highlights FY15The absolute amount of NPA was maintained at same
levels as last year, despite a growth of 39% in Assets Under
Management.
The Company increased the proportion of secured lending
from 41% in FY14 to 45% in FY15, further de-risking the portfolio.
The Company enhanced the proportion of revenues derived
from non-personal loans from 57% in 2013-14 to 61%.
21Annual Report 2015 Fullerton India Credit Company Limited
Fullerton 12.11 PARK.indd 21 12/18/2015 2:22:25 PM

Analytics
In the business of retail finance, the challenge is finding the right customer, the right product, the right cost that the market will bear and the right time to sell, translating into the highest returns.
Fullerton India invested in cutting-edge analytics with the objective to decipher large data quantities, extend interpretation to execution and generate the highest business returns.
22Analytics
Fullerton 12.11 PARK.indd 22 12/18/2015 2:22:28 PM
The Fullerton India differentiatorThe company engaged a team of experienced analytics
professionals (statisticians and econometrician) to decode
consumer India, possibly the largest such professional
deployment in India’s NBFC sector. The company is possibly
the only NBFC in India to have established a portfolio construct
based on loss volatility with the objective to resist industry
downtrends and ride sectoral rebounds. The Company intends
to empower customers and create digital delivery channels
powered by smart algorithms that can enable instant decision-
making.
OverviewThere is a growing recognition that analytics represents the
absolute frontier in India’s retail finance sector.
With the evolution of technology adoption in the industry,
there is a premium on the need to understand and predict how
customer preferences evolve with socio-economic changes
across segments. Smart predictive algorithms developed
through the study of customer behaviour data enables
scientific assessment of credit worthiness, matching products
with customer needs and higher efficiency of upsell
and cross-sell.
Besides, the analytics function rides on a rare convergence of
enhanced data availability, technology tipping point (low cost of
high end computing), growing availability of real time digitised
information capture and the growing importance of the Credit
Bureau to protect systemic integrity.
StrengthsAnalytic capabilities have helped the Company put science
behind the thousands of customer life cycle decisions taken
every day across various functions - reviewing applications
for credit, pricing and extending credit, monitoring credit
exposures at account, customer and portfolio levels, account
management, etc.
The company today is one of the largest users of bureau tools
and services - monitoring the entire customer base at regular
intervals and insights from this process are used for risk
containment on a timely basis and policy modifications.
The analytics function engaged in predictive modeling, help
reduce turnaround time, enhance customer service and
develop segmented and algorithmic approach to processing
with speed. Smart algorithms help predict customer behaviour,
scientifically price products, protect customer attrition and
maximise profitability per customer.
The company has established a framework of objectively
measured Risk Appetite incorporating volatility risk using
extensive statistical models following the principles and
approaches prescribed by advanced Basel guidelines.
Effective analytics has been driven through state-of-the-
art infrastructure consisting of robust data management
repositories, an enterprise-wide best-in-class Business
Intelligence tool and global industry leading tool for advanced
analytics.
Highlights, FY15The company implemented Approval in Principle feature for
their major products, rationalising approvals turnaround time
and enhancing customer delight.
The analytics function steered the growth engine of the
Company helping maximise profitable growth while improving
portfolio resilience. With the approach of driving specific
segment focussed growth in each of its branches, the portfolio
construct was shaped to optimise lifecycle return on assets.
Superior geographic profiling translated into effective loss
management.
23Annual Report 2015 Fullerton India Credit Company Limited
Fullerton 12.11 PARK.indd 23 12/18/2015 2:22:28 PM

Funding and Treasury
In the business of retail finance, stable funding at an optimum cost is of key importance. Fullerton India strengthened its Treasury function by diversifying its liability base and maintaining close and continuous engagement with its funding partners. This resulted in reduction of cost and a more efficient mix of funds.
The Fullerton India differentiatorLiability management at Fullerton is given a strategic importance and emphasis is laid on building and
maintaining stable funding relationships. Strict limits and compliances ensure that lender interests are
never compromised and decisions are taken from a long term sustainability viewpoint. At Fullerton, the
Treasury is a strategic enabler to Business providing continuous inputs on economy, global and local
markets thereby shaping key portfolio decisions.
24Funding and Treasury
Fullerton 12.11 PARK.indd 24 12/18/2015 2:22:30 PM

OverviewThe Treasury function is responsible for all liability
management including borrowings and liquidity management.
It ensures that the Company stays well-funded for
disbursements and repayments. In addition, Treasury oversees
all external investor interaction, interfacing with rating agencies
and other funding related intermediaries. Over the past few
years Treasury has built and maintained close relationships
with over a hundred institutional investors.
StrengthsThe Treasury capitalised on its several strengths to deliver
positive outcomes to relevant internal and external
stakeholders.
Credit rating: The Company enjoys a credit rating of AAA from
CARE and AA+ from ICRA and India Ratings on its long-term
debt instruments which are among the highest within the
country’s retail finance sector.
Capital adequacy: The Company’s overall capital adequacy at
19.6% was far higher than RBI requirements at 15% reflecting its
confidence in the business.
Secured lending: The Company increased the proportion of
secured lending from 41% to more than 45% at an entity wide
level (including rural lending) thereby imparting durability and
stability to the asset book. This in turn helped in reducing
funding costs and initiating long term funding.
Enhanced Tenors: The Company lengthened the residual
tenures of loans from 29 months as at March 31, 2014 to 33
months as at March 31, 2015 thereby reducing mismatches
and mitigating gapping risks. A judicious mix of funding
instruments including Bank Borrowings and Capital market
is used to maintain optimal tenor, so that funding risks are
reduced and the Company benefits from lower rates, as they
are realized.
Liquidity Buffer: The Company maintained adequate liquidity
buffer in terms of high quality liquid assets, in order to stay
well funded even in case of external exigency. A cushion of
unavailed bank lines is additionally maintained to strengthen
the lines of defence.
Diversified Lender Base: To reduce concentration risk and to
perpetuate funding relationships there is a constant effort to
diversify lenders. In line with the above, FICCL has diversified
its funding profile to over 100 institutional lenders including
Banks, Insurance Companies, Foreign Portfolio Investors,
Mutual Funds, Pension and Provident Funds. Term loans from
Banks constitute the majority of total borrowings, a focused
strategy followed in the FY15. The remaining borrowing is
through Non-Convertible Debentures of medium to long tenor
and Commercial Paper. This ensures that the funding profile
remains resilient to market volatility and provides stability and
deepens relationships.
Highlights, FY15The strong and stringent treasury processes and conservative
liquidity risk management policies have been well recognised
by external rating agencies. This is evidenced by the highest
category rating of AAA, assigned by CARE in the FY15.
FICCL continuously engages with various stakeholders,
including lenders and other funding partners on a continuous
basis in order to keep them informed and updated on the
Company’s developments. Regular investors’ meets are
organised which include interaction with management,
financials and plans. Such events are well represented by all
classes of investors.
This financial year, FICCL added over 25 investors including six
PSU Banks enhancing its funding flexibility and moderating its
average funding costs. Issuance of subordinated debt and buy
back of high cost debt further improved its capital efficiency
and liability structure.
Strong financials in addition to the above factors contributed
in the Company receiving better commercials from lenders
reducing the overall financing cost by 60 basis points.
25Annual Report 2015 Fullerton India Credit Company Limited
Fullerton 12.11 PARK.indd 25 12/18/2015 2:22:30 PM

Fullerton India has been at the forefront of technology adoption, bringing out solutions that enhance customers’ experience and provide world class convenience.
The Fullerton India differentiator The Company embraced cutting-edge technologies
that made it possible for rural field employees to
use Android-based tablets that record transactions
and issue receipts on real time basis, improving
customer experience. The solution combines
on-field data availability with controls like biometric
(fingerprint-based) authentication, digitally signed
receipts and account statements that accelerates
business processes and enhances customer trust.
OverviewFullerton India recognises the need to provide a
unified customer experience that cuts through
various customer touch points, products and
geographies. Speed to customer is increasingly
the critical factor, while ensuring high asset quality
and business continuity. Automation at every level
is therefore the key to enhanced efficiency. The
Company has always been investing in advanced
technology translating into cutting edge product
and services offerings and has been stepping up its
digitisation momentum.
The Company has invested in Customer
Relationship Management (CRM) solution which
is used as a single platform for all customer
engagements. The Company has revamped its web
portal with inquiry management, lead management
and customer online access. The customers can
now apply online for loans and get automated
approval decisions. The company is also in the
process of changing its core system to FinnOne,
Information Technology
26Information Technology
Fullerton 12.11 PARK.indd 26 12/18/2015 2:22:31 PM

which is the industry standard loan originating & management
system. At the Company Call Centre, service delivery is being
optimised by directing the customers to the Interactive Voice
Response (IVR) solution.
Strengths The Company’s data warehouse, Customer Relationship
Management (CRM), approval-in-principle engine and
analytics solutions helped target existing and new customers
in a cost-effective manner and offer customised solutions. In
addition to moderating the cost of customer acquisition, the
Company’s proactive technology investments helped deepen
customer relationships and drive higher efficiencies.
The Company successfully implemented Desktop
Virtualisation, a Cloud Technology solution, to run all its core
operations across Urban and Rural markets. Through this
deployment, Fullerton India moved from a physical desktop PC
environment to a private cloud-based Hosted Shared Desktop
environment. The application delivery as a service (ADaaS)
solution works on the central server, derives server-based
processing power, provides instantaneous boot up, reduces
machine downtime and facilitates employee mobility. The
company has around 2,700 virtual machines that run over
much smaller physical technology infrastructure footprint to
power numerous IT enabled business services.
With a view to support the digital initiatives and focusing
squarely on customer-centricity, the Company has embarked
on a program to equip its core platform with paperless
processing capacity to meet the scale, speed and transaction
volume requirements for the future.
The Company has also created the state-of-the-art Business
Continuity and Disaster Recovery management strategy to
secure the live systems. The Company periodically performs
switch-over and switch-back drills of major IT applications,
thereby preparing for the Company’s readiness in responding
to emergency situations.
The Company uses Customer Relationship Management
(CRM) platform which acts as a single platform to log, handle,
escalate and resolve customer grievances. The Company has
implemented a framework for the measurement of Customer
Experience (internal and external) to ensure that customer
feedback across each touch point (including customer
complaints, customer satisfaction surveys, telephonic surveys
and employee feedback) is analysed and acted upon.
Highlights, FY15The Company’s Infrastructure succeeded in delivering 99%
uptime (which is described as the ability to not affect more
than 25 individuals for more than 15 minutes during working
hours).
We graduated the technology underlying the handheld devices
used by field staff to Android-based tablets, the benefits of
which were extended to more than 1000 field staff, resulting in
enhanced functionality and revenue generating opportunities.
We introduced a ‘social HCM’ concept-based Human
Resources Information System (HRIS), an automated platform
that is easily accessible, serves as a knowledge repository,
highlights employee-wise training schedules, facilitates
seamless responsibility handover in the event of attrition and
standardises training.
27Annual Report 2015 Fullerton India Credit Company Limited
Fullerton 12.11 PARK.indd 27 12/18/2015 2:22:31 PM
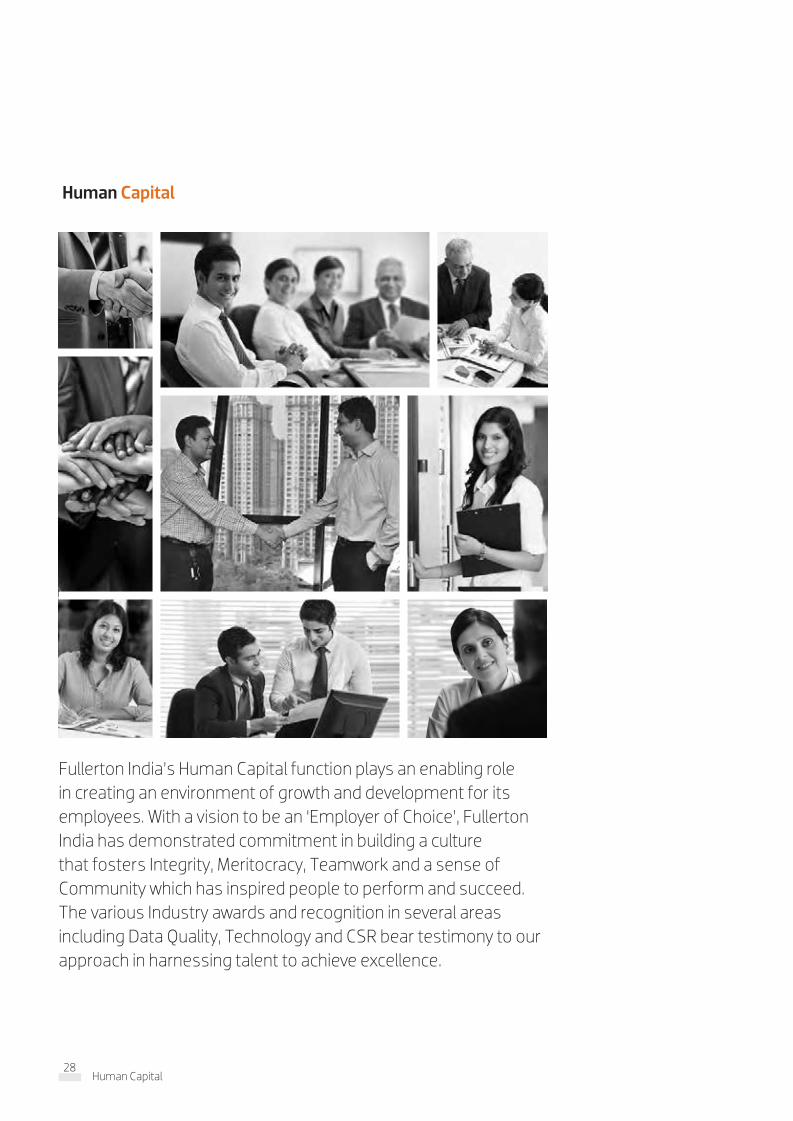
Fullerton India’s Human Capital function plays an enabling role in creating an environment of growth and development for its employees. With a vision to be an ‘Employer of Choice’, Fullerton India has demonstrated commitment in building a culture that fosters Integrity, Meritocracy, Teamwork and a sense of Community which has inspired people to perform and succeed. The various Industry awards and recognition in several areas including Data Quality, Technology and CSR bear testimony to our approach in harnessing talent to achieve excellence.
Human Capital
28Human Capital
Fullerton 12.11 PARK.indd 28 12/18/2015 2:22:39 PM

The Fullerton India differentiatorIn its growth journey, Fullerton India has recruited selectively,
trained comprehensively and communicated transparently.
This has resulted in a highly engaged workforce which
consistently delivers superior business results. The emphasis
on staff development is evidenced by the fact that 60%
of supervisory roles were filled internally. Employees see
their personal and professional growth in tandem with the
Company’s growth.
OverviewFullerton India has created a culture that underpins Integrity,
Meritocracy, Teamwork, Process discipline and Compliance.
Over the last few years, the Company has focused extensively
on employee communication as a key intervention to enhance
engagement, led by the CEO and the Leadership Team,
covering all employees across locations through phone-casts,
town halls and location visits by the Leadership Team. Through
this initiative, the Company has successfully aligned employee
aspirations and goals with the organisation’s strategic
priorities.
StrengthsFullerton India provides an inclusive and caring work
environment. The Company’s code of conduct sets high
standards of integrity, conduct and workplace behaviour.
People policies are designed to ensure a healthy and safe
workplace, free from discrimination or harassment where
employees can raise complaints without fear of retribution.
The Company strengthened its performance measurement
through a sharply defined organisational scorecard, duly
approved by the Board, which in turn cascaded down to each
business function. The strict ‘Pay for Performance’ philosophy
is reflected through short and long-term incentives tied to
performance metrics enabling consistent performers to be
remunerated competitively.
The Company provides hands-on experience, exposure and
education to its Management staff through locally designed
learning programmes as well as the Temasek Business
Leadership Centre, where top performers were nominated to
learning programmes facilitated by a distinguished panel of
current and former professors and lecturers from IMD, INSEAD,
Yale School of Management, University of Michigan and the
Darden School of Business.
Several senior managers enhanced their professional
exposure through international assignments including full
time senior appointments in other international companies of
Fullerton Financial Holdings
Highlights, FY15 Increased people strength from 6,160 as on March 31, 2014
to 7,244 as on March 31, 2015;
Launched the ‘Fullerton India Recognition of Excellence’
programme (FIRE), recognising the top-performing employees
at various intervals through the year, culminating in the
prestigious, annual CEO’s Elite List.
Conducted multiple leadership broadcasts through the
course of the year, engaging all employees
Invested 19,739 person-days in employee training.
Launched learning paths covering several functions that
enable employees to grow to senior levels
Invested in employee welfare (including healthcare, life
insurance and emergency financial aid)
Introduced performance evaluation of the Board and its
constituents against Board approved criteria
29Annual Report 2015 Fullerton India Credit Company Limited
Fullerton 12.11 PARK.indd 29 12/18/2015 2:22:39 PM

Corporate Social Responsibility
IntroductionFullerton India’s approach to Corporate Social Responsibility is captured through more than 1,000 CSR
programmes we have conducted in FY15, benefitting over 35,000 community households.
CSR VisionFullerton India’s CSR vision is to enable sustainable development and inclusive growth across
communities through innovative socioeconomic and environmental interventions, in fulfilment of its
role as a socially responsible corporate citizen.
CSR activities at Fullerton India are broadly categorized under four heads:
Livelihood enhancement I Healthcare initiatives I Educational programmes I Environmental initiatives
Livelihood Enhancement CSR programmes under this head are designed
to support the livelihood of the downtrodden and
under-privileged. Two types of programmes run
under this category are:
Jeevika – Vocational Skill Project
‘Jeevika’ was launched with the primary aim to
enhance the capacity and skill development of
women for the various indigenous vocations.
In FY15, Fullerton India conducted 555 CSR
vocational training programmes benefitting
12,000 households. Apart from this, commercial
stitching and tailoring programmes at two
locations in Madhya Pradesh along with Tara
Livelihood Academy and Beauty Hair Care
initiative at Pune (Maharashtra) in partnership
with LabourNet were also launched. In FY15, 100
women under commercial stitching and tailoring
programmes and 50 women under Beauty Hair
Care programme were trained.
30Corporate Social Responsibility
Fullerton 12.11 PARK.indd 30 12/18/2015 2:22:39 PM
Pashu Vikas – Cattle Care Project
Recognising cattle care as a key need for the community,
Fullerton India has been conducting cattle care camps as a part
of its Pashu Vikas cattle care CSR programme.The key focus of
our Pashu Vikas cattle care camps is to provide cattle owners
with expert advice on increasing milk production. In FY15,
Fullerton India conducted 220 cattle care camps and treated
more than 35,000 cattle.
Healthcare InitiativesThere are two types of programmes conducted under this
category.
Save the Eye
Fullerton India has a dedicated program ‘Save the Eye’
operational for the last 4 years. Along with conducting eye
checkup camps across the country, the Company has been
also operating a vision care centre in Andhra Pradesh with a
partner hospital. In FY15, Fullerton India partnered with ‘Sankara
Eye Hospital’ and other local hospitals for conducting 65 eye
check-up camps in Gujarat and Tamil Nadu. More than 5000
patients were screened and Fullerton India funded around 800
cataract surgeries.
Health check-up camps
Fullerton India along with ‘Sevamob’ has initiated Mobile
Medical Clinics in Jaipur (Rajasthan) and Hubli (Karnataka)
in FY15. Free medicines, child nutritional supplements and
maternal healthcare are distributed through mobile medical
clinics. A detailed health card is prepared for each patient,
which is available online with a support of a 24x7 call centre
for emergencies and unforeseen events. Consultations with
specialist doctors at back office clinics are also arranged on a
daily basis free of cost in case of further complications. More
than 850 patients benefitted in the first month of operation.
Educational ProgrammesUnder this category, Fullerton India has donated Computers
and also hosted women literacy programmes.
Computer Donation
Fullerton India donated 150 old computers along with
accessories to various NGOs for education of children studying
at Government-run primary schools in Maharashtra and
Rajasthan.
Women Functional Literacy
Fullerton India has more than 8 lakh women customers and
many of them are based in some of the remotest locations
across the country. The field officers of the Company interacts
with these customers on a daily basis and provide training
on functional literacy, including counting of currency notes,
signature on the pass book, familiarity with loan process and
interest rates, etc.
Environmental InitiativesIn line with adopting environment friendly practices, in FY15
Fullerton India had financed 2 lakh solar lanterns, 30,000 water
Pashu Vikas DayFullerton India conducted India’s largest single-day
cattle care event under the name of ‘Pashu Vikas Day’
on November 22, 2014. This event was conducted
across 115 locations at the same time, where more
than 22,000 cattle were treated benefitting 10,000
households. 1,500 Fullerton India employees
volunteered for this event to make it a huge success
in its inaugural year.
31Annual Report 2015 Fullerton India Credit Company Limited
Fullerton 12.11 PARK.indd 31 12/18/2015 2:22:39 PM

filters and 42,000 eco cook stoves, benefiting more than 2 lakh
rural households. Fullerton India also has a dedicated CSR project
for enhancing environment sustainability:
Krishi Mitra- Organic Farming
Initiated in 2013, Fullerton India’s Krishi Mitra Organic Farming
project educates the community about Organic Farming, its
benefits and the process of organic certification for better return
from their agriculture produce. Fullerton India has launched this
project in association with ‘MYRADA-Krishi Vigyan Kendra’ at two
places in Tamil Nadu and in association with ‘Vidya Prathisthan
School of Biotechnology (VSBT)’ at 8 places in Baramati,
Maharashtra. Overall 24 progressive farmers were trained with
details on organic farming concepts and practical demonstrations
through a 7 day residential programme. Post-training, they are
certified as Krishi Mitra and are associated with the local NGOs.
32Corporate Social Responsibility
Fullerton 12.11 PARK.indd 32 12/18/2015 2:22:42 PM
Directors’ Report
Dear members,
Your Directors are pleased to present the 20th Annual Report of Fullerton India Credit Company Limited
along with the audited statement of accounts for the financial year ended March 31, 2015.
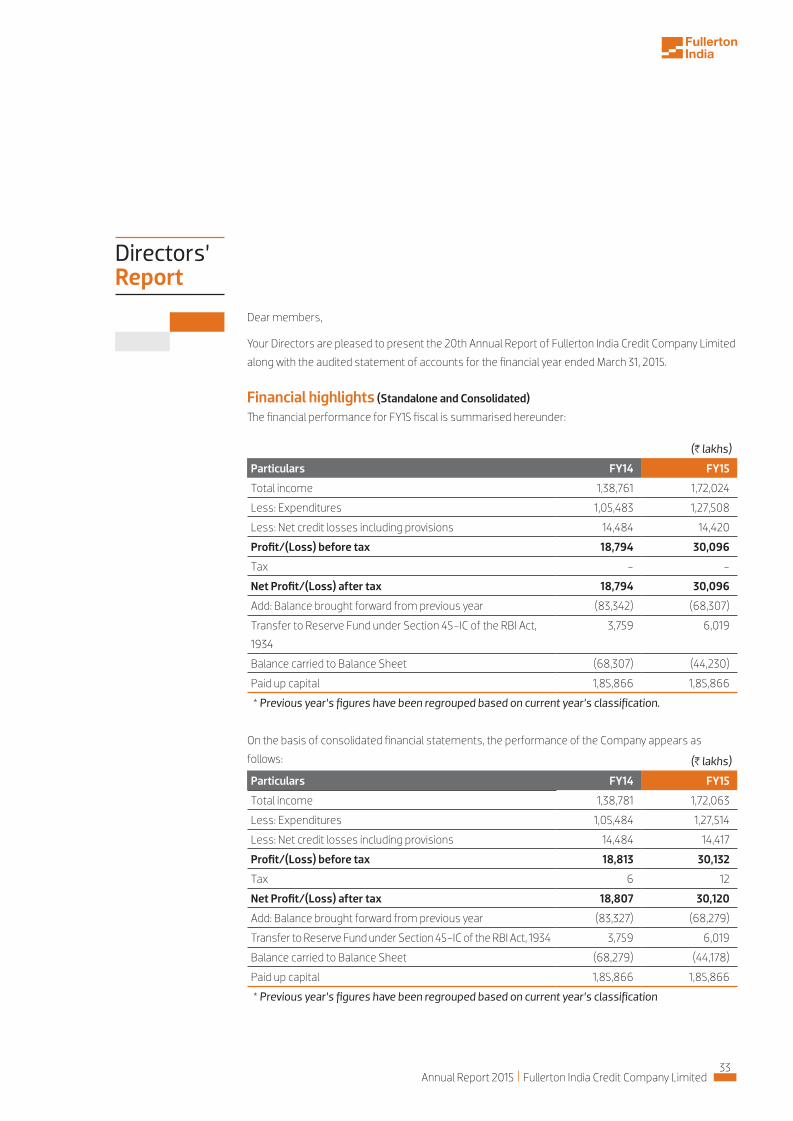
Financial highlights (Standalone and Consolidated)
The financial performance for FY15 fiscal is summarised hereunder:
(H lakhs)
Particulars FY14 FY15
Total income 1,38,781 1,72,063
Less: Expenditures 1,05,484 1,27,514
Less: Net credit losses including provisions 14,484 14,417
Profit/(Loss) before tax 18,813 30,132
Tax 6 12
Net Profit/(Loss) after tax 18,807 30,120
Add: Balance brought forward from previous year (83,327) (68,279)
Transfer to Reserve Fund under Section 45-IC of the RBI Act, 1934 3,759 6,019
Balance carried to Balance Sheet (68,279) (44,178)
Paid up capital 1,85,866 1,85,866
* Previous year’s figures have been regrouped based on current year’s classification
On the basis of consolidated financial statements, the performance of the Company appears as
follows:
(H lakhs)
Particulars FY14 FY15
Total income 1,38,761 1,72,024
Less: Expenditures 1,05,483 1,27,508
Less: Net credit losses including provisions 14,484 14,420
Profit/(Loss) before tax 18,794 30,096
Tax - -
Net Profit/(Loss) after tax 18,794 30,096
Add: Balance brought forward from previous year (83,342) (68,307)
Transfer to Reserve Fund under Section 45-IC of the RBI Act,
1934
3,759 6,019
Balance carried to Balance Sheet (68,307) (44,230)
Paid up capital 1,85,866 1,85,866
* Previous year’s figures have been regrouped based on current year’s classification.
33Annual Report 2015 Fullerton India Credit Company Limited
Fullerton 12.11 PARK.indd 33 12/18/2015 2:22:42 PM

Financial performance and overviewDuring the year under review, the Company continued to
demonstrate effective use of its resources and reported a
healthy improvement across all its operating metrics.
Assets Under Management (representing on-book assets and
assigned portfolios) witnessed a 39% growth and stood at
H8,66,916 lakhs (H6,24,501 lakh as at March 31, 2014) while the
assets on book grew from H6,10,299 lakhs in the previous year
to H8,60,976 lakhs. The live customer base has grown to more
than 10 lakhs.
One of the key focus areas during the fiscal was to reshape
the asset book towards secured business. Accordingly,
secured assets grew to account for 45% of the assets under
management as on March 31, 2015 as against 41% in the
previous year.
Overall disbursals for FY15 stood at H6,83,065 lakhs,
representing a 40% increase over the previous fiscal disbursals
of H4,86,835 lakhs.
The growth in the Balance Sheet was financed to a large extent
through bank borrowings, a more stable source of funding
as compared to market-based borrowings. Bank borrowings
stood at H4,46,142 lakhs (H2,18,729 lakhs as at March 31, 2014)
representing an increase of 104% over last year, while non-
convertible debentures decreased modestly to reach H2,37,150
lakhs (H2,55,115 lakhs as at March 31, 2014), a decrease of 7% over
last year. Short-term commercial papers increased by 22% from
H72,749 lakhs to H88,910 lakhs during the same period.
Gross income increased to H1,72,024 lakhs (H1,38,761 lakhs in
FY 14) and finance costs stood at H70,860 lakhs
(H 56,167 lakhs in FY 14). Net interest income increased by
26.5% to reach H86,170 lakhs (H68,095 lakhs in FY 14).
Non interest expenditure at H56,648 lakhs (H49,316 lakhs in FY
14), represented a reduction as a ratio-to-total income from
59.7% to 56.0%, a healthy improvement backed by efficient
utilisation of human and operational resources.
Net credit losses during the fiscal stood at H14,420 lakhs
showing marginal decrease of H65 lakhs, despite a 39% growth
in Asset Under Management.
A strong underlying momentum, improved asset quality and
operational efficiency enabled the Company to report a 60%
growth in profits to reach H30,096 lakhs (H18,794 lakhs in FY 14)
for the FY15.
State of Company’s affairs and future outlookThe detailed overview of the state of affairs of the Company
and future outlook is provided in the ‘Management discussion
and analysis’ section, enclosed as Annexure I to this report.
Capital adequacyThe details on ‘Tier-I’, ‘Tier-II’ capital and capital adequacy ratio
are given under the ‘Management discussion and analysis’
section of this Report.
Debt positionDuring the year under review, the Company placed H1,42,700
lakhs in commercial papers (H1,23,800 lakhs repaid during
the year) and H73,000 lakhs in non-convertible secured and
unsecured debentures (H90,990 lakhs repaid during the year)
with various mutual funds and financial institutions on a private
placement basis. The Company availed long-term and short-
term loans worth H3,26,500 lakhs (and repaid H98,641 lakhs
during the year) from banks.
Change(s) in the nature of business, if anyThere were no material changes in the nature of the business
of the Company or that of its subsidiaries, during the year
under review.
DividendIn order to conserve the resources of the Company and to
build up reserves and considering the business plans of the
Company, the Directors do not recommend payment of
dividend on Equity Shares for the financial year ended
March 31, 2015.
Transfer to reservesDuring the year, the Company has transferred 20% of its profit
for the year amounting to H6,019 lakhs to reserves created as
34Directors’ Report
Fullerton 12.11 PARK.indd 34 12/18/2015 2:22:42 PM

Sr. No. Name Category Date of resignation
1. Mr. Alan Thompson Director June 20, 2014
2. Ms. Lee Li Ing Director March 17, 2015
Name Number of
shares%
Angelica Investments Pte Ltd 1,77,34,05,000 95.41%
Fullerton Financial Holdings Pte Ltd 8,52,56,357 4.59%
Since, the last AGM, the Board has appointed the following persons as Directors:
Sr. No. Name Category Date of appointment
1. Dr. Milan Robert Shuster Independent Director December 30, 2014
2. Mr. Boon Leng Quah Additional Director May 20, 2015
per the norms laid down under Section 45-IC of the Reserve
Bank of India Act, 1934.
Changes in share capitalThere was no change in the issued, subscribed and paid-up
capital of the Company during the year. The issued, subscribed
and paid-up capital of the Company as at March 31, 2015, stood
at H185,866 lakhs. The Equity Shares, of H10 each, were held as
under:
Directors and key managerial personnelThe Company’s Board lays down the strategic objectives of the Company and guides the management in meeting its goal of
aligning the interests of all the stakeholders with those of the promoters.
Sr. No. Name Category Date of appointment
1. Ms. Sudha Pillai Independent Director August 20, 2014
2. Ms. Renu Challu Independent Director August 20, 2014
3. Dr. Milan Robert Shuster Independent Director December 30, 2014
The following changes have taken place in the Board during the FY15:
(i) Appointment of Directors
Sr. No. Key managerial personnel Designation
1. Mr. Shantanu Mitra Chief Executive Officer and Managing Director
2. Mr. Pratik Gandhi EVP, Chief Financial Officer
3. Mr. Pankaj Malik Head – Finance & Company Secretary
(ii) Resignation of Director
Mr. Ferdy Khouw is liable to retire by rotation at the ensuing
Annual General Meeting of the Company. He, being eligible, has
offered himself for reappointment. The Board recommends his
reappointment to the members of the Company.
All Independent Directors have given declarations that they
meet the criteria of independence as laid down under Section
149(6) of the Companies Act, 2013.
The following were the key managerial personnel of the
Company, as recorded by the Board:
35Annual Report 2015 Fullerton India Credit Company Limited
Fullerton 12.11 PARK.indd 35 12/18/2015 2:22:42 PM
Number of meetings of the Board of DirectorsFour Board meetings were held during the year on;
i. June 19, 2014
ii. August 27, 2014
iii. December 04, 2014 and
iv. March 23, 2015
The time gap between any two meetings was less than four
months with at least one meeting being held every quarter.
Board evaluationThe Nomination and Remuneration Committee recommended
and the Board approved the criteria for evaluation of the
Board, its Committees and the Directors. The Independent
Directors met separately to review the performance of Non-
Independent Directors, Chairpersons of the Company, the
Board as a whole and the flow of information between the
Board and the management.
The Nomination and Remuneration Committee separately
evaluated the performance of individual Directors and of the
Board.
The results of evaluation conducted by the Independent
Directors and Nomination and Remuneration Committee
were submitted to the Chairman of the Board. The Board
subsequently evaluated itself, its committees and all the
Directors.
Managerial remuneration In terms of the provisions of Section 197 read with Rule 5 of
Companies (Appointment and Remuneration of Managerial
Personnel) Rules, 2014, the details of remuneration and
compensation of the employees are set out as on annexure
to the Directors’ Report. Having regard to the provisions of
Section 136 of the Companies Act, 2013, the Annual Report
excluding the aforesaid information is being sent to the
members of the Company. Any member interested in
obtaining such particulars may write to the Company Secretary
of the Company at the Corporate Office.
Details of subsidiaries The Company has two subsidiary companies, both of which are
wholly-owned:
a. Fullerton India Home Finance Company Limited and
b. Fullerton India Foundation for Social & Economic
Development (a Section 8 company)
Both the companies are yet to commence operations.
During the year, the Company has increased its equity
investment to H1,000 lakhs from H200 lakhs in Fullerton India
Home Finance Company Limited. Further Fullerton India Home
Finance Company Limited has made an application to National
Housing Bank (NHB) to obtain certificate of registration for
carrying out home finance business. The said application is
currently under review with the NHB.
Statutory Auditors M/s. S. R. Batliboi & Co. LLP, the auditors of the Company
retire at the forthcoming AGM, and have made themselves
available for reappointment. The Audit Committee, after review,
has recommended their reappointment. The auditors have
given their consent for the reappointment and provided the
certificate as per the relevant provisions of Chapter X of the
Companies Act, 2013 vide their letter dated May 13, 2015.
Secretarial AuditorsM/s. Vinod Kothari & Company, were appointed as the
Secretarial Auditors of the Company by the Board, during the
year. They have conducted the secretarial audit as per the
provisions of section 204 of the Companies Act, 2013 and
issued a Secretarial Audit Report. Copy of the report is attached
Annexure IV to this report.
Response to Auditors’ ReportsThere were no qualifications, reservation or adverse remark
or disclaimer, made by the auditors and secretarial auditors in
their reports.
Disclosure on ESOPSThe Company does not have any employee stock option/
purchase scheme. The details of share appreciation rights are
mentioned in Note 32 of the notes to accounts.
Audit Committee The details of the constitution, terms of reference, etc., of the
Audit Committee are mentioned in the Corporate Governance
Report, enclosed as Annexure II to this report.
Nomination and Remuneration CommitteeThe details of the constitution, terms of reference, etc., of the
Nomination and Remuneration Committee are mentioned in
the Corporate Governance Report, enclosed as Annexure II to
this report.
The Company has laid out clear guidelines approved by the
Nomination and Remuneration Committee (NRC) for Fit and
Proper Criteria for appointment of Directors in accordance with
the Companies Act, 2013 and regulations of the Reserve Bank
of India.36
Directors’ Report
Fullerton 12.11 PARK.indd 36 12/18/2015 2:22:42 PM

Further, the NRC and has also framed a policy for remuneration
for directors, KMPs and employees incorporating principles of
fairness, pay for performance, a sufficient balance in rewarding
short and long term objectives reflected in the pay mix of fixed
and variable pay, meeting the financial viability of the Company.
Vigil mechanism The Company has formulated a whistleblower policy as part
of the vigil mechanism for reporting of genuine concerns by
anyone. The policy, displayed on the website of the Company,
provides an opportunity for any stakeholder to report their
concerns to the management about any actual or suspected
unethical behaviour, fraud or violation of the Company’s Code
of Conduct. This mechanism also provides safeguards against
victimisation of employees, who report their concerns. The
whistle-blower policy comprehensively includes processes
for receiving, analysing, investigating, inquiring and reporting
of the issues raised. An update on whistleblower cases and
investigation conducted thereon is presented to the Audit
Committee on a quarterly basis.
Risk management policyIn line with the RBI regulations, the Company has formed a
Board Committee known as the Risk Oversight Committee. The
Committee oversees the processes of risk assessment and
minimisation, monitors risk management plans and carries
out such other functions as may be directed by the Board.
Please refer the Corporate Governance report for the terms of
reference of the Committee.
The Company has adopted several policies for risk
management. The management reports to the Committee on
risks identified and the action taken to mitigate those risks.
The specific objectives of the Risk Oversight Committee of the
Company include:
To ensure that all the current and future material risk
exposures of the Company are identified, assessed, quantified,
appropriately mitigated and managed;
To establish a framework for the Company’s risk
management process and ensure Company wide
implementation;
To ensure systematic and uniform assessment of risks
related to NBFCs;
To enable compliance with appropriate regulations,
wherever applicable, through the adoption of best-in-class
practices; and,
To assure business growth along with financial stability.
Extract of the annual returnIn terms of the provisions of Section 197 read with Rule 5 of
Companies (Appointment and Remuneration of Managerial
Personnel) Rules, 2014, the details forming part of the
extract of the Annual Return in Form MGT-9 are set out as
an annexure to the Directors’ Report. Having regard to the
provisions of Section 136 of the Companies Act, 2013, the
Annual Report excluding the aforesaid information is being
sent to the members of the Company. Any member interested
in obtaining such particulars may write to the Company
Secretary of the Company at the Corporate Office.
Material changes and commitments, if any, affecting the financial position of the Company which have occurred between the end of the financial year of the Company to which the financial statements relate and the date of the report.There have been no such material changes and commitments
affecting the financial position of the Company which have
occurred during the said period.
Details of significant and material orders passed by the regulators/courts/tribunals impacting the going concern status and the Company’s operations in future.There were no significant and material orders passed by the
regulators/courts/ tribunals impacting the going concern
status of the Company and its operations in future.
Statement in respect of adequacy of internal financial controls with reference to the financial statements.The members may note that:
Systems have been laid to ensure that all transactions
are executed in accordance with management’s general and
specific authorisation. There are well-laid manuals for such
general or specific authorisation
Systems and procedures exist to ensure that all
transactions are recorded as necessary to permit preparation
of financial statements in conformity with generally accepted
accounting principles or any other criteria applicable to such
statements and to maintain accountability for aspects.
Access to assets is permitted only in accordance with
management’s general and specific authorisation. No assets
of the Company are allowed to be used for personal purposes,
37Annual Report 2015 Fullerton India Credit Company Limited
Fullerton 12.11 PARK.indd 37 12/18/2015 2:22:42 PM

Deposits The Company, despite being registered as a ‘Deposit-taking
company’ under the regulations of the RBI, has not accepted
any public deposits during the year under review (Nil during FY
14), under Chapter V of the Companies Act, 2013.
Particulars of loans, guarantees or investments under Section 186The Company is exempt from the provisions laid down
under Section 186 as regards to loan and advances made,
guarantees given or security provided. The Company made
an equity investment in one of its wholly-owned subsidiaries,
details of which are provided under ‘Details of subsidiaries’
section herein above.
Particulars of contracts or arrangements with related partiesThere were no related party transactions falling under Section
188 of the Companies Act, 2013 during the year.
Management discussion and analysis A detailed review of the operations, financial performance, risk
management, outlook, among others, is provided under the
section ‘Management discussion and analysis’, enclosed as
Annexure I to this report.
Corporate Governance A detailed report on Corporate Governance and copy of the
Certification of the Chief Executive Officer and Chief Financial
Officer of the Company are provided as Annexures II and III to
this report respectively.
Fraud reportingThe Company reports about the frauds to the Reserve Bank of
India every quarter in terms of the RBI regulations. The details
of the frauds occurred during the quarter are also placed
before first Audit Committee meeting held after the end of the
quarter. There have been 23 instances of fraud cases reported
by the Company to the Board. The Company has taken
appropriate action in these cases.
No frauds were reported by the Auditors, during the year.
Revision of financial statements or Board’s ReportThere have been no revisions in the financial statements or
Board’s Report.
except in accordance with terms of employment or except as specifically permitted.
The existing assets of the Company are verified/checked at reasonable intervals and appropriate action is taken with respect to
differences, if any.
Based on the above, your Board is of the view that adequate internal financial controls exist in the Company.
Particulars of loans/advances/investments outstanding during the financial yearThe disclosures relating to particulars of loans/advances/investments outstanding as per clause 28 of the Debt Listing Agreement are as under:
Sr. No.In the books of FICCL in capacity of
Disclosures of amounts at the year end and the maximum amount of loans/advances/investments outstanding during the year
Disclosure
1. Parent
Loans and advances in the nature of loans to subsidiaries by name and amount.
Loans and advances in the nature of loans to associates by name and amount.
(i) No repayment schedule or repayment beyond seven years; or
(ii) No interest or interest below section 186 of the Companies Act, 2013 by name and amount.
Loans and advances in the nature of loans to firms/companies in which Directors are interested by name and amount.
Nil
2. SubsidiarySame disclosures as applicable to the parent company in the accounts of subsidiary company
Nil
3. ParentInvestments by the loanee (borrower) in the shares of parent company and subsidiary company, when the Company has made a loan or advance in the nature of loan.
Nil
B. Cash flow statement included in the financial statement
A. With respect to Parent and Subsidiary companies
38Directors’ Report
Fullerton 12.11 PARK.indd 38 12/18/2015 2:22:42 PM

Rating Agency Term Type Rating
CARE LT NCD/TL /SD CARE (AAA) (Triple A)
ICRALT NCD/TL/SD [ICRA] AA+ with stable outlook
ST STD/CP [ICRA] A1+
India RatingsLT NCD/SD IND AA+ with stable outlook
ST STD/CP IND A1+
Sr. No. Trustee Contact details
1. GDA Trusteeship Limited
GDA House, Plot No.85, Bhusari Colony, Paud Road, Pune – 411038Phone: 020 – 25280081 Extension: 107 Fax: 020 – 25280275
2. IL & FS Trust Company Limited
The IL&FS Financial Centre, Plot C- 22, G Block, Bandra Kurla Complex, Bandra (E), Mumbai 400051Phone: 022 - 26533333Fax: 022 - 26533038
3. IDBI Trusteeship Services Limited
Asian Building, Ground Floor,17, R. Kamani Marg, Ballard Estate, Mumbai – 400 001Phone: 022 - 40807000Fax 022 - 66311776
Details of debenture trusteesThe details of the entities which acted as the debenture trustees for the debenture holders of the Company during the year are as
under:
Credit ratingThe credit ratings’ details of the Company as on March 31, 2015 were as follows:
LT – Long-term ST – Short-term NCD – Non-convertible debentures SD – Subordinate debt CP – Commercial paper TL – Term loanSTD – Short-term debt
The ratings mentioned above were reaffirmed by the rating agencies (ICRA and India Ratings) during the FY15.
A fresh rating issued by CARE for Long term debt and Subordinate Debt as CARE (AAA) Triple A during the FY15.
Disclosures under the Sexual Harassment of Women at Workplace (Prevention, Prohibition & Redressal) Act, 2013No complaints were received under the Sexual Harassment of
Women at Workplace (Prevention, Prohibition & Redressal) Act,
2013, during the year.
Conservation of energy, technology absorption and foreign exchange earnings and outgoThe provisions relating to conservation of energy and
technology absorption do not apply to the Company, since it is
an NBFC.
However, FICCL adopts the usage of information technology
extensively and is prudent in utilising non-renewable
resources. There were foreign exchange outflows of H141 lakhs
during the year (H98 lakhs in FY 14), pertaining to travel, training
and professional fees.
Corporate social responsibility The details of the composition of CSR Committee and its
terms of reference are given in Corporate Governance report.
39Annual Report 2015 Fullerton India Credit Company Limited
Fullerton 12.11 PARK.indd 39 12/18/2015 2:22:42 PM

The Company’s CSR policy, including overview of projects is
enclosed as Annexure V to this report.
Directors’ responsibility statementAs per the provisions of Section 134(3)(c) read with Section
134(5) of the Companies Act, 2013, your Directors confirm that:
(i) in the preparation of the annual accounts for the year
ended March 31, 2015, the applicable accounting standards
had been followed along with proper explanation relating
to material departures;
(ii) the Directors had selected such accounting policies and
applied them consistently and made judgments and
estimates that are reasonable and prudent so as to give
a true and fair view of the state of affairs of the Company
at the end of the financial year and of the profit and loss of
the Company for that period;
(iii) the Directors had taken proper and sufficient care for
the maintenance of adequate accounting records in
accordance with the provisions of this Act for safeguarding
the assets of the Company and for preventing and
detecting fraud and other irregularities;
(iv) the Directors had prepared the annual accounts on a going
concern basis;
(v) the Directors had devised proper systems to ensure
compliance with the provisions of all applicable laws
and that such systems were adequate and operating
effectively;
(vi) the Directors had laid down internal financial controls to be
followed by the Company and that such internal financial
controls are adequate and were operating effectively.
Acknowledgement Your Directors would like to place on record, their gratitude
for the cooperation and guidance received from all the
statutory bodies, especially the RBI. The Directors also thank
the shareholders, clients, vendors, investors, banks and
other stakeholders in placing their faith in the Company and
contributing to its growth. We would also like to appreciate the
hard work put in by all our employees, and we look forward to
their continuing patronage, going forward.
On behalf of the Board of Directors
Mumbai Gan Chee Yen
May 20, 2015 Chairman
40Directors’ Report
Fullerton 12.11 PARK.indd 40 12/18/2015 2:22:42 PM

ManagementDiscussion and Analysis
Review of the economy Global economic growth at 3.4% in 2014 was at the same level as in 2013. The growth was largely driven
by improved growth in advanced economies at 1.8% in 2014 against 1.4% in 2013. The US economy
performed relatively better with a growth of 2.4% in 2014; Euro zone growth turned positive at 0.9%
(after a negative 0.5% in 2013); the Japanese economy recorded negative growth of 0.1% while UK
growth was 2.6%. The emerging economy growth slowed at 4.6% in 2014 compared to 5% in 2013.
Emerging Asia growth slowed except for India. Growth in China and ASEAN 5 countries declined to 7.4%
and 4.6% in 2014 against 7.8% and 5.2% respectively in the previous year.
Global growth is projected to increase slightly from 3.4% in 2014 to 3.5% in 2015 and sustain annual
growth of 3.8% through 2016. The growth in 2015 is likely to be driven by a rebound in advanced
economies, supported by a decline in oil prices. In the emerging markets, growth is projected to decline
for the fifth successive year in 2015.
Following the change in the base year to FY12, combined with improvements in the methodology as
well as additional data sources, CSO now estimates that India’s GDP bottomed out at 5.1% in FY13,
recovered sharply to 6.9% in FY14 and strengthened further to 7.4% in FY15.
Accounting for the bulk of GDP, the services sector has been the main engine of India’s growth for
many years. Services Gross Value Added (GVA) grew by a robust 10.7% over April to December 2014 –
up from 10% a year ago. This was driven mainly by the ‘financial, real estate and professional services
segment’, which expanded by 13.7%, up from 8.6% a year ago.
The economy’s weakest link over the last two years, industry, is now showing some signs of revival,
albeit erratically. The Index of Industrial Production (IIP) was up 2.8% in the April-February FY15 period,
compared to 0.1% de-growth a year ago. Several other indicators point to a modest industrial up-turn.
In March, HSBC’s Purchasing Manager’s Index (PMI) for manufacturing was positive for the 17th month
in a row, rising to 52.1 from 51.2 in February.
On the other hand, the unfavourable Kharif (summer) and Rabi (winter) harvests due to a poor
monsoon followed by unseasonal rains, as well as low rise in the Minimum Support Prices (MSP) of
various crops have clearly dampened agricultural incomes and rural consumer sentiments.
Consumer Price Index (CPI) inflation measured in terms of the new 2012 base, averaged 5.9% in FY15,
with inflation for food & beverages at 6.5% and core CPI (excluding food & beverages and fuel & light)
standing at 5.6%. Wholesale Price Index (WPI) also declined steadily over the course of FY15 to 2.3%
in March 2015. The CPI is dominated by food items and services, the prices of which are influenced by
domestic demand and supply trends. On the other hand, a substantial part of WPI is impacted by the
global prices of various tradeable commodities. Notwithstanding these differences in the two main
indices, the decline in inflation in general and CPI in particular, was seen as one of the main factors that
Annexure I to the Directors’ Report
41Annual Report 2015 Fullerton India Credit Company Limited
Fullerton 12.11 PARK.indd 41 12/18/2015 2:22:42 PM
led to the RBI cutting the benchmark interest rates by 25 bps
twice during the year to 7.5%.
Conditions on the external front also remain favourable to
India, and generally supportive of growth. Both the trade and
current account deficits (CAD) have been aided by the large fall
in international crude prices (over 60% drop from peak). The
CAD, which in some quarters is expected to turn surplus in the
new fiscal year, was comfortably financed by strong capital
in-flows. Net portfolio flows came to US$45.7 billion in FY15,
compared to US$8.9 billion a year ago. Three-fifths of this
was in the form of debt, which suggests a positive outlook for
India’s domestic growth.
OutlookThe Government has so far ensured passage of certain far
reaching bills, i.e., the Insurance, coal block allocations and
mining. These are all critical to the revival of the economy, even
though two more critical ones – GST and Land acquisition –
are at discussion/ debate stage in the Parliament at the time
of writing this report.
From this vantage point, growth in the new fiscal is likely/
expected to be stronger than the one in FY15. On the other
hand, the few things that can possibly derail the momentum
are a) a global meltdown due to a possible combination of an
issue in Europe and a liquidity pull back due to a stronger than
expected Fed tightening; b) a reversal of the current optimism
about India leading to reversal of global funds flow into India
with a consequent deleterious impact on the Indian rupee
and c) a continuation of unseasonal/ inadequate rains leading
to further damage to the agricultural output with negative
consequences on inflation and a collapse in the rural economy.
Having said the above, the Reserve Bank of India has more than
once stated that India is well positioned to weather a storm,
given the strong foreign reserves position of the country. As
regards inflation, adequate buffer stocks of wheat and rice
and a global downward trend in prices of sugar and edible oils
are likely to dampen inflationary pressures. Given the RBI’s
stated view that the real interest rate defined as the Repo
rate less ‘look forward’ CPI, should be around 150-200 bps, it
is expected that there might be further Repo rate cuts to the
tune of 50 bps over the remainder of 2015, with the timing
of the cuts to be influenced by incoming data, particularly on
unfolding monsoon dynamics and inflation. All this bodes well
for the Indian economy.
Financial services India’s diversified financial sector is undergoing rapid
expansion. The sector comprises commercial banks, insurance
companies, non-banking financial companies, co-operatives,
pension funds, mutual funds and smaller financial entities.
The financial sector in India is predominantly bank-driven;
commercial banks account for more than 60% of the total
assets held by the financial system.
The outlook for the banking sector appears optimistic,
expected to grow from US$1.8 trillion in FY13 to an estimated
US$28.5 trillion by FY25 [Source: IBEF].
India’s non-banking financial companies (NBFCs) have been
gaining systemic importance, their share growing from 10.7%
of banking assets in 2009 to 14.3% in 2014. NBFCs enjoy several
advantages over banks due to their niche focus, expertise in
specific asset classes as well as deeper penetration in rural
and unbanked markets (even though their borrowing costs are
relatively higher when compared to the banks).
The Indian consumer finance market is expected to grow 18%
CAGR to a US$1.2 trillion opportunity by 2020. While the market
still remains under-penetrated (70%+ of households have no
liabilities of any sort), the organised players (banks and NBFCs)
have progressively developed a number of products (multiple
secured and unsecured loan types) targeted across the various
segments of the income pyramid.
Besides, India’s private lenders (banks and NBFCs) opened
new loan segments (small business loans), hitherto controlled
by PSU banks. The select banks and NBFCs will be able to
42Directors’ Report
Fullerton 12.11 PARK.indd 42 12/18/2015 2:22:42 PM

leverage their expertise and establish market positions to grow
their retail loan books faster than market projections.
Around 18% CAGR expected in retail loans by FY20
Source: Credit Suisse
Retail loan assets in India (US$ bn)1,400
1,200
1,000
800
600
400
200
Small business Gold CV’s
Auto Mortgage Others
FY 09 FY 14 FY 20E
US$279bn
US$440bn
US$1175bn
15%CAGR
18%CAGR
The Reserve Bank of India released the ‘Revised Regulatory
Framework for NBFCs’ in November 2014, strengthening
the structural profile of the NBFC sector, safeguarding the
depositors’ money and regulating the growing role of NBFCs.
Retail credit The 12.6% growth in bank credit in 2015 was derived largely
on the back of a growth in retail lending. Data (until February
2015) indicates that the fastest growing segment within the
ambit of retail lending comprised consumer durables (16.9%)
followed by vehicle loans (14.7%) and housing (14.5%). Industry
credit, accounting for bulk of the bank lending, grew 3.5% while
personal loans (home, auto and consumer loans, among
others) grew by more than 13.5%. The personal loans category
grew 15.4% in FY15 compared to 15.5% growth in FY14 (RBI data).
Optimism is derived from the reality that India’s consumer debt
as a proportion of GDP is still among the lowest in the world,
comparing unfavourably even with peer economies like China,
Thailand and Malaysia.
Even as India’s mortgage finance penetration has been
increasing consistently (8.24% as on December 31, 2014),
it is below the level in developed countries. There is a large
proportion of India’s population still under-served by traditional
financial institutions, indicating untapped potential in segments
like affordable housing.
[Source: ICRA]
MSME sector The term MSME (micro, small and medium enterprises) is
defined by the MSME Development Act of 2006. India’s micro,
small and medium enterprises (MSME) account for 8% of GDP,
45% of manufactured output and 40% of exports (Source: 2010
PM task force). This is largely an unorganised industry, with ~50
million firms employing over 100 million people in sectors as
diverse as retail trade, textiles, food and beverages, hospitality,
auto repairs, furniture, etc.
The penetration of formal finance in India’s MSME sector
is considerably low. The last available numbers from the
government (the fourth MSME census, 2007) indicate that
only less than 13% of all Indian MSME units enjoy any access to
finance/credit.
Credit Suisse analysis indicates that debt in small enterprises
in India is significantly below that of listed small cap stocks
(used 210 companies on BSE with sales in the range of H100
million to H2 billion as small cap companies). Despite such a
low penetration level, the small business lending segment is
Consumer debt to GDP (%)
100%
80%
60%
40%
20%
US UKAustra
liaS Kore
aSingaporeGerm
anyJa
pan
Brazil
China
IndiaIndonesia
00%
Source: Credit Suisse
Retail loans account for 24% of total assets (banks + NBFCs)
Breakdown of advances 2014 (banks + NBFCs)
Source: Credit Suisse
52% Corporate
24% Retail
14% Small business
10% Agriculture
43Annual Report 2015 Fullerton India Credit Company Limited
Fullerton 12.11 PARK.indd 43 12/18/2015 2:22:42 PM

already as large as the housing finance segment and larger than other retail segments with higher
penetration levels (like commercial vehicles and auto finance), indicating that this could remain for long
a critical banking segment.
[Source: Credit Suisse]
Loans against propertyThe largest asset by value owned by Indian households continues to be real estate (90%+ of all assets
owned as per NSSO data). In recent quarters, one type of small business loan, loans against property,
has become popular. Loans are extended to promoters of small businesses against the promoters’
property (usually self-occupied residential). This segment has gained traction from almost all lenders.
The attractiveness of the sector lies in the fact that while operating costs and credit losses are believed
to reflect the robustness of the home loan segment, the yields are typically higher than mortgages and
attracting the interest of larger mortgage players.
[Source: Credit Suisse]
Commercial vehicle (CV) financing The CV financing segment comprises new and used (second-hand) CV financing. Nearly 52% of
CV loans are made for new/first-hand trucks. The yields, perceived borrower risks and even lender
preferences differ significantly between segments. The complete penetration of organised finance in
new CV purchase is near-complete; the leading 12 lenders account for nearly 90% of the market. The
used CV market, however, accounts for a large unorganised segment. We believe overall organised
finance penetration in the CV market is 75%, and unlikely to increase soon. The result is that loan book
growth will reflect the underlying performance of the CV industry growth.
[Source: Credit Suisse]
A young playConsumer lending is one of the youngest banking segments. In the 1990s, retail loans accounted for a minuscule 5% of total bank assets (though there were some specialised NBFCs in specific sectors like car loans and consumer durables). Besides, just two segments (housing and consumer durables) accounted for nearly 80% of all retail loans of banks.
What drives the consumer loan sector in India...
Opportunity: The Indian consumer loan opportunity is estimated at US$1.2 trillion (Source: Credit Suisse report).
Low penetration: Nearly 70% of Indian households have no debt liability.
Gap: The Indian banking system (including NBFCs and cooperative banks) accounts for around 65% of total consumer debt outstanding in India. The remaining 35% provides an attractive opportunity for the organised lending sector.
Small business: The size of the small business lending opportunity is estimated at ~US$340 billion by FY20E, possibly the second-largest segment behind home loans (nearly 30% of total retail lending opportunity).
Information: India’s credit bureaus pool data from over ~155 million individuals (Dec-13), thereby enhancing consumer lending safety.
Aspiration: The country’s growing aspirations will increase a willingness to avail retail debt.
Rates: India’s RBI announced interest rate cuts, which is expected to drive retail credit.
Economy: With the country heading towards economic uptrend, it will drive overall prosperity and help in driving debt growth.
18 years ago, consumer lending was ~5% of bank advances
Breakdown of banking sector advances 1998
Today, retail loans account for 18% of bank advances
Breakdown of banking sector advances 2014
Note: Banks only.
Source: Credit Suisse
63% Corporate
5% Retail
20% Small business
12% Agriculture
Note: Banks only.
Source: Credit Suisse
53% Corporate
18% Retail
16% Small business
13% Agriculture
44Directors’ Report
Fullerton 12.11 PARK.indd 44 12/18/2015 2:22:43 PM
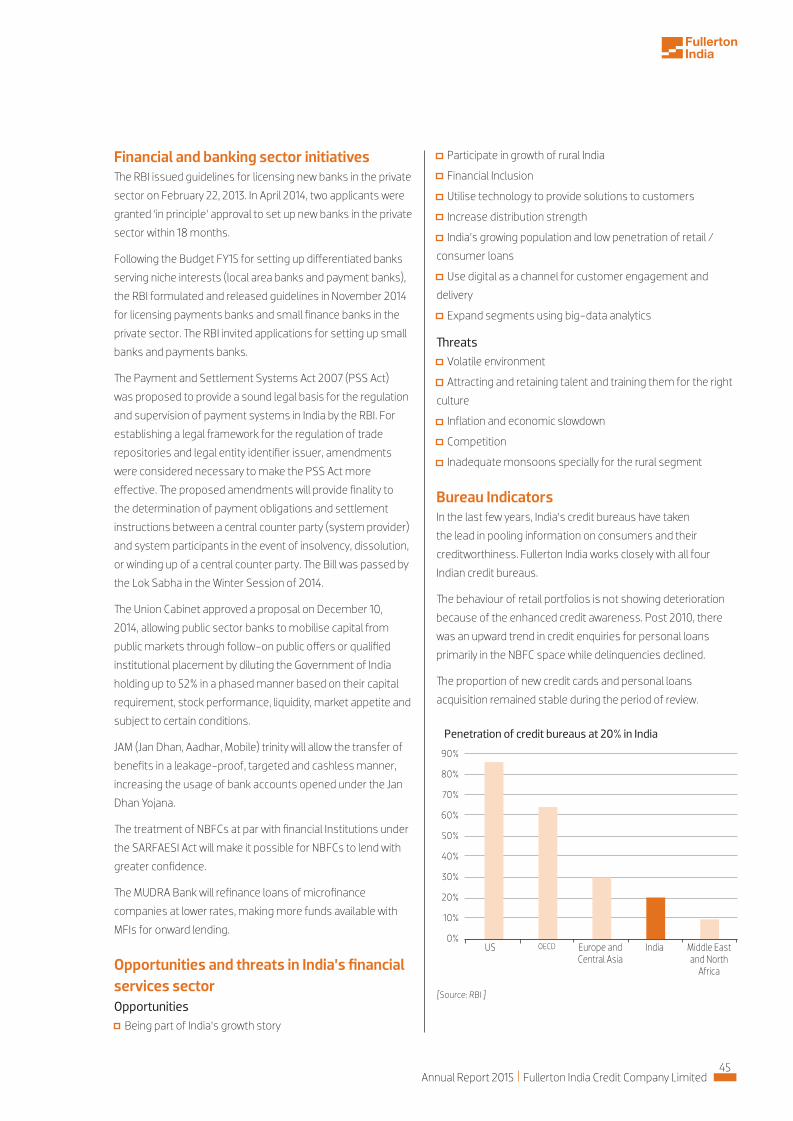
Financial and banking sector initiativesThe RBI issued guidelines for licensing new banks in the private
sector on February 22, 2013. In April 2014, two applicants were
granted ‘in principle’ approval to set up new banks in the private
sector within 18 months.
Following the Budget FY15 for setting up differentiated banks
serving niche interests (local area banks and payment banks),
the RBI formulated and released guidelines in November 2014
for licensing payments banks and small finance banks in the
private sector. The RBI invited applications for setting up small
banks and payments banks.
The Payment and Settlement Systems Act 2007 (PSS Act)
was proposed to provide a sound legal basis for the regulation
and supervision of payment systems in India by the RBI. For
establishing a legal framework for the regulation of trade
repositories and legal entity identifier issuer, amendments
were considered necessary to make the PSS Act more
effective. The proposed amendments will provide finality to
the determination of payment obligations and settlement
instructions between a central counter party (system provider)
and system participants in the event of insolvency, dissolution,
or winding up of a central counter party. The Bill was passed by
the Lok Sabha in the Winter Session of 2014.
The Union Cabinet approved a proposal on December 10,
2014, allowing public sector banks to mobilise capital from
public markets through follow-on public offers or qualified
institutional placement by diluting the Government of India
holding up to 52% in a phased manner based on their capital
requirement, stock performance, liquidity, market appetite and
subject to certain conditions.
JAM (Jan Dhan, Aadhar, Mobile) trinity will allow the transfer of
benefits in a leakage-proof, targeted and cashless manner,
increasing the usage of bank accounts opened under the Jan
Dhan Yojana.
The treatment of NBFCs at par with financial Institutions under
the SARFAESI Act will make it possible for NBFCs to lend with
greater confidence.
The MUDRA Bank will refinance loans of microfinance
companies at lower rates, making more funds available with
MFIs for onward lending.
Opportunities and threats in India’s financial services sector Opportunities
Being part of India’s growth story
Participate in growth of rural India
Financial Inclusion
Utilise technology to provide solutions to customers
Increase distribution strength
India’s growing population and low penetration of retail /
consumer loans
Use digital as a channel for customer engagement and
delivery
Expand segments using big-data analytics
Threats Volatile environment
Attracting and retaining talent and training them for the right
culture
Inflation and economic slowdown
Competition
Inadequate monsoons specially for the rural segment
Bureau IndicatorsIn the last few years, India’s credit bureaus have taken
the lead in pooling information on consumers and their
creditworthiness. Fullerton India works closely with all four
Indian credit bureaus.
The behaviour of retail portfolios is not showing deterioration
because of the enhanced credit awareness. Post 2010, there
was an upward trend in credit enquiries for personal loans
primarily in the NBFC space while delinquencies declined.
The proportion of new credit cards and personal loans
acquisition remained stable during the period of review.
Penetration of credit bureaus at 20% in India
90%
80%
70%
60%
50%
40%
30%
20%
10%
0%US OECD Europe and
Central AsiaIndia Middle East
and North Africa
[Source: RBI ]
45Annual Report 2015 Fullerton India Credit Company Limited
Fullerton 12.11 PARK.indd 45 12/18/2015 2:22:43 PM

Acquisition consistently increased following 2009. The industry witnessed controlled growth with enhanced credit awareness.
Q306 Q307 Q308 Q309 Q310 Q311 Q312 Q313 Q314
Robust growth led
by
Credit Squeeze Volume
contracts for next 6
consecutive
Accounts opened per quarter (H ‘000)
12,000
9,000
6,000
3,000
0
Enquiries per quarter (H)
12,000
9,000
6,000
3,000
0
Q110 Q410 Q311 Q212 Q113 Q413 Q314
Number of enquiries increased following 2010, primarily driven by PL enquiries contributed by the NBFC sector
Industry level delinquency for PL has improved since 2011
LAP-Retail Enquiry & 90+@12MOB (H ‘000)
Retail LAP* vintage delinquency is stable
Business segment snapshot
Segment No of branches (as on March 31, 2015)
Products Disbursal FY15 (H lakhs )
Net Revenue FY15 (H lakhs )
Urban business 214 Personal loans, loan
against property, SME
loans and consumer
vehicle financing
4,76,580 70,228
Rural business 223 Mortgage loans, low-
value loans, machinery
loans, business loans,
micro-entrepreneur loans
2,06,485 30,976
Urban business Fullerton India is present across 191 cities (Metro to Tier 4),
servicing close to 2 lakh customers. The Company’s 214
branches are spread across 20 states.
The Company provides personal loans (salaried, self-employed
and MSME customers), loan against property to MSME and
self-employed customers, SME loans and commercial vehicle
loans. The Company’s competitive advantage is derived
from the prudent use of cutting-edge technology, superior
customer service and a sensitive understanding of the needs
of consumers not addressed by the traditional banking
system.
PL-Enquiry & 90+@12MOB (H ‘000)
3,500
3,000
2,500
2,000
1,500
1,000
500
0
2.0%
1.5%
1.0%
0.5%
0.0%Q210 Q111 Q411 Q312 Q213 Q114 Q414
3,500
3,000
2,500
0
2.0%
1.5%
1.0%
0.5%
0.0%Q210 Q111 Q411 Q312 Q213 Q114 Q414
PVT NBFC PSU MNC 90+@12MOB PVT NBFC PSU MNC 90+@12MOB
46Directors’ Report
Fullerton 12.11 PARK.indd 46 12/18/2015 2:22:43 PM

Personal loans FICC caters to personal and professional financial needs of customers across different segments and
income streams. The Personal Loan lending empowers it’s customers to excel in all their endeavours
by meeting their financial requirements.
With our wide sales and distribution network, we offer Personal loans at 191 cities, with which we have
offered our financial assistance to almost 2 lakh customers lives as on date.
Our state of the art analytics and well groomed product and credit framework has led to a balanced
growth. The Company made a conscious effort in moving to the profitable segment, comprising loans
to consumers with credible bureau records and hence, considered superior risk grade, which helped
improve portfolio quality. The Company leveraged analytic tools to identify potential customers,
manage sales resources and enhance productivity.
Going ahead, the Company intends to cross-sell products, improve customer management and focus
on digital marketing. Besides, it intends to create pre-approved personal loans for select customers
based on their credit history. The targeted disbursals are expected to enhance yields as the Company
shifts to a superior portfolio quality.
In our next phase, the Company is working towards offering digital lending solution to its customers.
Loans against property The Company commenced this business segment in 2010 with the objective to increase foothold in
the secured loan category. The Company is still at a nascent stage in this space, providing loans to
customers across 31 locations. The loan segment targets the self-employed and MSME segments
(for their working capital requirements).
The business received a significant boost during the year under review resulting in a near-56% growth
in disbursal over FY14. During the year under review, the Company embarked on a project to improve
project efficiency, reducing turnaround time from 42 days to 17 days, enhancing customer retention and
customer service.
Going ahead, the Company expects to moderate its turnaround time, enter more semi-urban towns,
strengthen channel engagement and improve client retention.
SME business The big ticket loan against property is considered as an SME business loan. The Company employed a
specialised front line sales team and widened its presence across seven cities. Even as the business
size was small, the Company achieved 63% growth in disbursal over FY14. The Company intends to
increase business presence in FY16.
Commercial vehicles Owing to the prevailing slowdown, the Company focused on controlled growth in this business category.
The Company refinanced vehicles and individual owners (fleet size of 1-3 vehicles), enhancing yields.
The Company was present in 21 cities across the country.
During the year under review, the Company grew this business 26% owing to an improvement in the
commercial vehicles segment. The Company exited 18 cities based on reasons of viability.
What is expected to drive India’s CV industry...
Auction of coal blocks; received record bids (H 3trn)
100% FDI in railway infrastructure
Projected railways spend of H532 billion to develop the east-west corridor
Highway construction of 104,000 kms in five years
Government allocation of H6 billion for Smart Cities
Improved construction and mining activity
Fleet replacement by large fleet operators
[Source: ICRA]
47Annual Report 2015 Fullerton India Credit Company Limited
Fullerton 12.11 PARK.indd 47 12/18/2015 2:22:43 PM

Fullerton India GramshaktiFullerton India’s rural business is conducted under the Gramshakti brand. It offers a bouquet of products comprising mortgage
loans, vehicle loans, low-value loans, equipment loans, business loans and micro-entrepreneur loans, among others. Fullerton
India Gramshakti is present in eight states (Tamil Nadu, Andhra Pradesh, Maharashtra, Karnataka, Gujarat, Rajasthan, Chattisgarh
and Madhya Pradesh) with 223 branches, servicing close to a 10 lakh customers (as on March 31, 2015). Through its Gramshakti
branches, Fullerton India reaches to over 42,000 villages (as on March 31, 2015).
Fullerton India Gramshakti’s mission is to cover the “last mile” between its branch where financial services are available and the
home or place of business of the customer. The Gramshakti network has an enviable reach that covers the last mile between the
branch and the end customer in each village in the catchment, enabling financial inclusion of the under-served and un-served
segments of the rural markets. Fullerton India’s officers service customers at their doorstep and constantly engage in improving
the understanding of customers on the Company’s financial services as well as create awareness on the need for good credit
behaviour for their long term growth. The company has invested in a unique technology system to enable itself to serve the
customer better and faster. The use of bio-metric authentication processes and transaction devices, have enabled speedier
servicing of collections and also built a great level of transparency, trust and customer confidence.
Gramshakti’s strategy has been to establish itself as a financial institution that contributes to financing requirements for all
customer segments across the rural landscape. To achieve this, the Company is looking to leverage on the vast distribution
network and the expertise that it has built in the rural markets to widen its presence through branch expansion and product
customisation.
In the coming FY16, the Company plans to expand the network by another 35 branches in potential rural markets and introduce
newer products to meet the growing aspirations of the rural customer.
The rural business represents an attractive opportunity for the Company to provide a superior proposition over the unorganised
financiers charging high rates of interest.
The commercial vehicle market is largely dependent on the national economy, which is expected to improve. The Company will stay
with the ‘sale and collect’ model, the sales team responsible for 0-60 DPD collections.
Growing business in the urban segment
FY13 FY14 FY15
2,82
,207
3,51
,578
4,76
,580
Urban disbursal (H lakh)
2,32
,373
1,68,
124
1,82,
382
Personal loan disbursal
(H lakh)
67,6
05
1,36,
329
2,16
,403
LAP-retail and SME disbursal
(H lakh)
16,9
07
16,16
8
27,19
9
CV disbursal(H lakh)
48Directors’ Report
Fullerton 12.11 PARK.indd 48 12/18/2015 2:22:43 PM
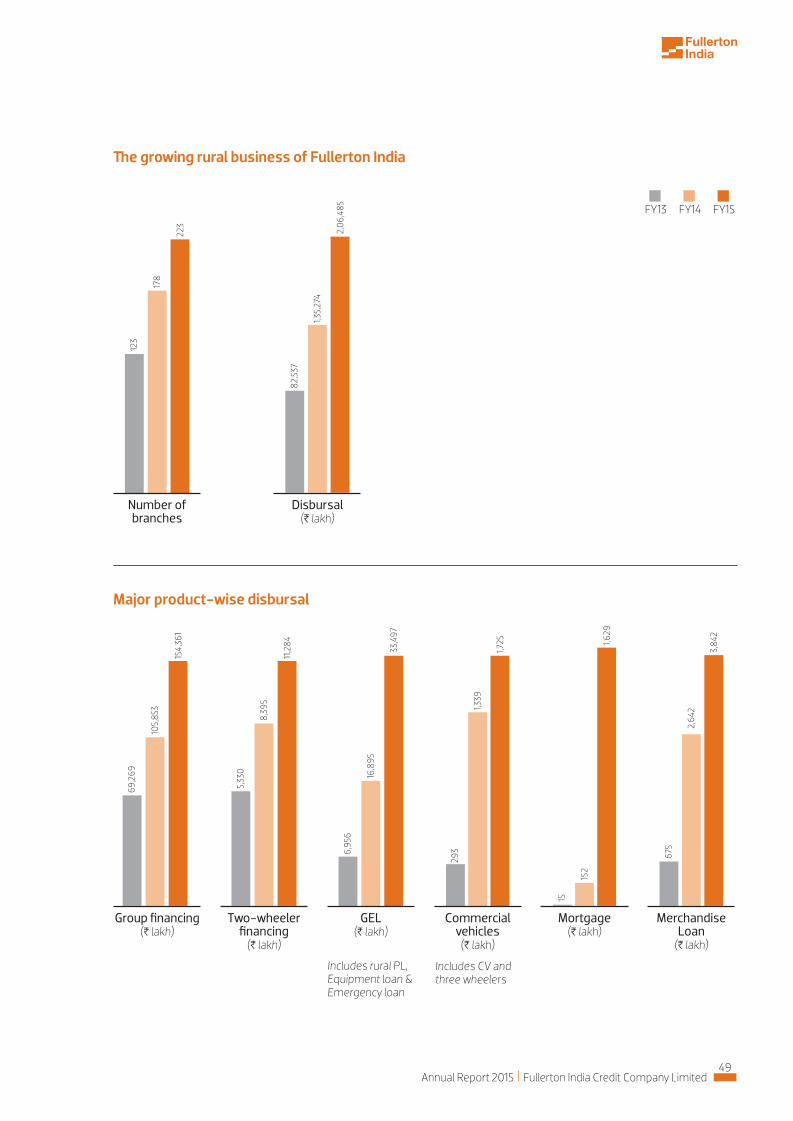
The growing rural business of Fullerton India
Major product-wise disbursal
FY13 FY14 FY15
Group financing (H lakh)
69,2
69
105,
853
154,
361
5,33
0
8,39
5
11,2
84
Two-wheeler financing
(H lakh)
6,95
6
16,8
95
33,4
97
GEL (H lakh)
293
1,339
1,725
Commercial vehicles
(H lakh)
675
2,64
2
3,84
2
Merchandise Loan
(H lakh)
Mortgage (H lakh)
15
152
1,629
123
178
223
Number of branches
82,5
37
1,35,
274
2,06
,485
Disbursal(H lakh)
Includes CV and three wheelers
Includes rural PL, Equipment loan & Emergency loan
49Annual Report 2015 Fullerton India Credit Company Limited
Fullerton 12.11 PARK.indd 49 12/18/2015 2:22:43 PM

Risk management The robustness of the Company’s risk management was
validated through an increase in profit before tax, higher
business returns and net non-performing assets being
controlled at 1.4%.
The company diversified its portfolio risk through the
extension from single business lending (personal loans) to
multiple products. The multiple products as a proportion of
revenues increased while the proportion of secured lending
rose, strengthening the de-risking. Among other initiatives,
the Company’s analytics team translated prevailing realities
into policy and product pricing using proprietary methods to
risk-rank first time borrowers in Tier 2 and 3 locations; monthly
disbursals were in excess of H20,000 lakhs.
The highlight of the Company’s risk management discipline
was the development of a Recession Loss Multiplier in line with
Basel II requirements, basing decisions around the concept
of life time losses in which losses cannot exceed a year’s
operating profit during recession periods. The company also
made extensive use of information from the Credit Bureau in
risk-assigning through a cutting-edge investment in analytics
(for a more comprehensive understanding of the Company’s
risk management process, please read the separate
standalone section on Risk Management).
Standalone financials as per Indian GAAPAnalysis of the Financial Statements The year FY15 was clearly one in which there was a quantum
improvement in the financials of the Company – which in a
sense was the culmination of many steps, both big and small,
taken over the last few years since the turnaround began in
2010/ 2011. The Company further strengthened its operational,
sales and branch productivity, putting in place process re-
engineering and system automation in various facets of the
business.
Continuing with our Risk Appetite agenda, the ratio of secured
assets in the customer asset mix was increased to 45% of the
portfolio, up from ~41% in FY14, the increase coming mostly
from the Loans Against Property (LAP) segment. The Company
expanded its rural franchise by 45 branches, while closing five
sub-optimal urban branches, reaching a branch count of 223 in
the Rural business, within an overall branch count of 437.
Total assets increased 40% from H7,26,816 lakhs on March
31, 2014 to H10,13,932 lakhs on March 31, 2015. Total advances
increased 41% from H6,10,299 lakhs at March 31, 2014 to
H8,60,976 lakhs at March 31, 2015 following robust growth in
the secured business and rural loan book.
A combination of improving volumes, productivity and healthy
credit quality resulted in an increase in profit before tax of
H11,302 Lakhs - from H18,794 lakhs in FY14 to H30,096 lakhs in
FY15.
(H in lakhs, except percentages)
Particulars FY14 FY15 % change
Interest Income 124,262 157,030 26.4
Interest Expense 56,167 70,860 26.2
Net interest income 68,095 86,170 26.5
Non-interest income
- Fee income 2,669 6,822 155.6
- Assignment Income 463 140 (69.7)
- Profit on Sale of Investment 4,488 1,941 ( 56.7)
- Other income1 6,879 6,091 (11.5)
Operating income 82,594 1,01,164 22.5
Operating expenses 49,316 56,648 14.9
Operating profit 33,278 44,516 33.8
Provisions and write-offs (net of write-backs) 14,484 14,420 (0.4)
Profit before tax 18,794 30,096 60.1
Tax, including deferred tax - - -
Profit after tax 18,794 30,096 60.1
1. Includes Commission on Life Insurance / General Insurance and Ancillary Income from operations e.g. foreclosure, bounce, penal etc..
50Directors’ Report
Fullerton 12.11 PARK.indd 50 12/18/2015 2:22:43 PM

Net interest income for the fiscal stood at H86,170 lakhs in
FY15 (H68,095 lakhs in FY14) on the back of a 37% increase in
average interest-earning assets. Net interest margin declined
by 85 basis points as the Company continued to focus on
accelerating the portfolio mix towards secured businesses.
Non-interest income marginally increased to H14,994 lakhs in
FY15 (H14,499 lakhs in FY14) due to an increase in fee income,
which was partially set off by a decline in assignment income.
Non-interest expenses remained controlled and during the
year increased by H7,332 lakhs (15%) to H56,648 lakhs. During
the previous financial year (FY14), there was a change in the
accounting policy to recognise loan origination costs across
loan tenures. The impact of this policy change translated into
an increase in expenses during FY15.
Provisions and contingencies (excluding provisions for tax)
were H14,420 lakhs, a decrease of H65 lakhs on an expanding
portfolio, as credit interventions reflected a strong and
improving portfolio quality and decline in the provision on
standard assets.
The total capital adequacy ratio, computed in accordance with RBI guidelines, was at a healthy 19.6% as at March 31, 2015, with a
Tier-1 capital adequacy ratio of 15.9% compared to a total capital adequacy ratio of 22.4% and Tier-1 capital adequacy ratio of 18.4%
as at March 31, 2014. This was mainly attributable to a 37% increase in interest earning assets.
Return on average equity (ROE) increased to 20.9% as compared to 15.8% (previous year), indicating an increase of 32.3%. As the
asset size grows and the book is prudently leveraged, ROE could expand further.
The cost to Income ratio improved to 56% compared to 59.7% in the previous year following enhanced economies of scale.
Net interest income and spread analysisThe following table sets forth the net interest income and spread analysis. (H in lakhs, except percentages)
Key ratiosThe following table sets forth key financial ratios:
Particulars FY14 FY15
Capital Adequacy – Total (%) 22.4 19.6
Return on average equity (%) 15.8 20.9
Return on average assets (%) 2.8 3.4
Earnings per share 1.0 1.6
Book value per share 6.4 7.8
Cost to income (%) 59.7 56.0Notes:
Return on average equity is the ratio of the net profit after tax to the averages of quarterly balances of equity share capital and reserves. Return on average assets is the ratio of net profit after tax to averages of quarterly balances of total assets. Cost represents operating expense. Income represents net interest income plus non-interest income.
Notes:
1 The average balances are the averages of quarterly balances.
Particulars FY14 FY15 % change
Interest income 1,24,262 1,57,030 26.4
Interest expense 56,167 70,860 26.2
Net Interest income 68,095 86,170 26.5
Average interest-earning assets1 6,10,287 8,35,921 37.0
Average interest earning secured assets1 2,16,846 3,17,335 46.3
Average interest-bearing liabilities1 5,18,914 6,80,785 31.2
Net interest margin 11.2% 10.3% -
Average yield 20.4% 18.8% -
Average cost of funds 10.8% 10.4% -
Interest spread 9.5% 8.4% -
51Annual Report 2015 Fullerton India Credit Company Limited
Fullerton 12.11 PARK.indd 51 12/18/2015 2:22:43 PM

The yield on interest-earning assets declined from 20.4% in FY14 to 18.8% in FY15 following a significant increase in secured assets
with comparatively lower yields.
The following table sets forth the trend in average interest-earning assets and average interest-bearing liabilities.
Average interest-earning assets increased 37.0% from H6,10,287 lakhs in FY14 to H8,35,921 lakhs in FY15. Average advances
increased 34.2%, from H5,59,472 lakhs in FY14 to H7,50,664 lakhs in FY15. Growth was contributed by retail secured businesses and
rural loans.
While overall average borrowings increased 31.2%, a larger proportion was derived from bank loans compared to Non-Convertible
Debentures and Commercial Paper. This was part of a conscious strategy to increase the proportion of reliable bank funding in the
overall funding mix (more explained in the Funding and Liquidity management section).
Non-interest incomeThe following tables set forth the principal components of non-interest income.
The fee income from customers increased 155.6% following a change in the accounting policy last year (FY14), to recognise
documentation and stamping fees collected from borrowers across the loan tenure. Assignment income declined from H463 lakhs
at March 31, 2014 to H140 lakhs at March 31, 2015 due to a run-down of assignment loans.
Non-interest expenseThe following table sets forth the principal components of non-interest expense.
Notes:Average balances are the averages of quarterly balances.
Particulars FY14 FY15 % change
Advances 5,59,472 7,50,664 34.2
Interest earning investments 39,772 48,657 22.3
Other interest earning assets 11,043 36,600 231.4
Total interest earning assets 6,10,287 8,35,921 37.0
Bank Loans 1,70,844 3,41,216 99.7
Non-Convertible Debentures 2,30,109 2,51,825 9.4
Commercial Paper 1,17,961 87,744 (25.6)
Borrowings 5,18,914 6,80,785 31.2
(H in lakhs, except percentages)
Notes: 1. Fee Income includes Processing Fees, Document Fees and Stamping Fees. 2. Other Income includes Commission on Life Insurance / General Insurance / IHO and other ancillary income from operations.
Particulars FY14 FY15 % change
Fee income1 2,669 6,822 155.6
Assignment Income 463 140 (69.7)
Profit on Sale of Investment 4,488 1,941 (56.7)
Other income2 6,879 6,091 (11.5)
Total Non-Interest Income 14,499 14,994 3.4
(H in lakhs, except percentages)
Particulars FY14 FY15 % change
Employee benefit expense 25,480 29,556 16.0
Depreciation 2,117 2,309 9.0
Other administrative expenses 21,719 24,783 14.1
Total non-interest expense 49,316 56,648 14.9
Provisions and write-offs 14,484 14,420 (0.4)
(H in lakhs, except percentages)
52Directors’ Report
Fullerton 12.11 PARK.indd 52 12/18/2015 2:22:43 PM

(H in lakhs, except percentages)
Employee expenses for FY15 increased 16% over FY14 due to
an increase in employees from 6,160 to 7,244. Employee costs
accounted for 52.2% of total non-interest expense for FY15
compared to 51.7% for the year ending March 31, 2014. Most
employee increases were in the rural business.
Other administrative expenses primarily included professional
charges (including collection agency cost), commission and
brokerage, rent, rates and taxes, repair and maintenance and
other expenditure. Other administrative expenses increased
14.1% from H21,719 lakhs in FY14 to H24,783 lakhs in FY15 due
to an increase in commission brokerage and lead generation
charges, which was in line with a growth in business volumes.
Provisions and write-off consisting of bad debt write off (net
of recoveries), specific provisions for non-performing assets,
provisions for standard assets and provision for diminishing
investment value declined from H14,484 lakhs to H14,420 lakhs
for the financial year ended March 31, 2015.
Total assets increased 40% from H7,26,816 lakhs at March 31,
2014 to H10,13,932 lakhs at March 31, 2015, primarily due to
an increase in advances. Net advances increased 41% from
H6,10,299 lakhs at March 31, 2014 to H8,60,976 lakhs at March
31, 2015, primarily due to an increase in loans against property
portfolio and rural loan book.
Total investments increased 23% from H41,954 lakhs at March
31, 2014 to H51,689 lakhs at March 31, 2015, primarily due to
the Company’s policy of keeping adequate liquidity to fund
prospective liability repayments and asset building (explained
further in the Funding and Liquidity management).
Assets As on March 31, 2014 As on March 31, 2015 % change
Cash and Bank Balances 38,693 54,039 39.7
Investments 41,954 51,689 23.2
- Government Securities 0 522 NA
- Certificate of Deposits / NCD’s 41,747 30,593 (26.7)
- Equity / Preference investment 207 1,005 384.7
- Other investments 0 19,569 NA
Advances 6,10,299 8,60,976 41.1
Fixed assets (including leased assets) 4,430 4,655 5.1
Other assets 31,440 42,575 35.4
Total assets 7,26,816 10,13,932 39.5
Financial conditionAssetsThe following table sets forth the principal components of assets.
Notes:All amounts have been rounded off to the nearest lakhs.
Particulars
As on March 31, 2014 As on March 31, 2015
Total Retail Advances
% of Total Retail
Advances
Total Retail Advances
% of Total Retail
AdvancesPersonal Loans 2,78,782 45.7 3,28,260 38.1
LAP-Retail 1,20,172 19.7 1,98,665 23.1
Two Wheeler 26,188 4.3 14,951 1.7
Commercial Vehicle 30,626 5.0 43,663 5.1
LAP-SME 65,484 10.7 1,26,018 14.6
Others 89,047 14.6 1,49,419 17.4
Total 6,10,299 100.0 8,60,976 100.0
Asset quality and compositionThe following table sets forth, at the dates indicated, the composition of outstanding portfolio.
(H in lakhs, except percentages)
53Annual Report 2015 Fullerton India Credit Company Limited
Fullerton 12.11 PARK.indd 53 12/18/2015 2:22:44 PM
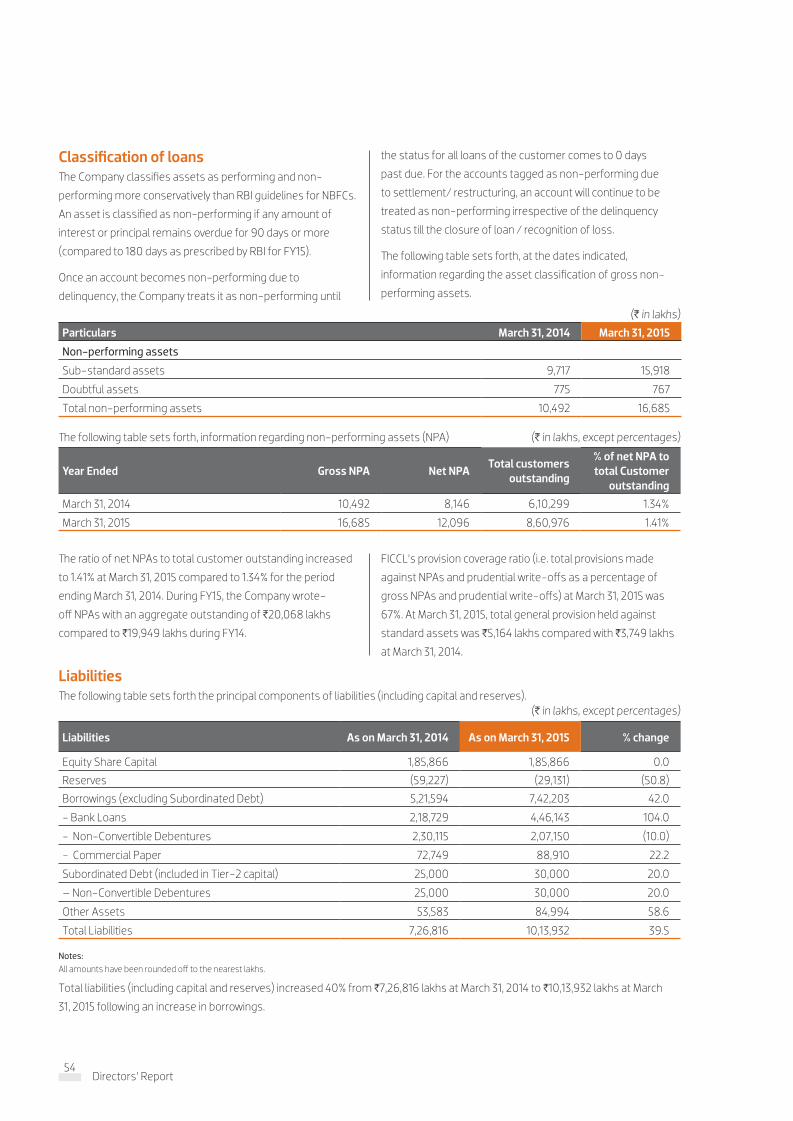
Classification of loansThe Company classifies assets as performing and non-
performing more conservatively than RBI guidelines for NBFCs.
An asset is classified as non-performing if any amount of
interest or principal remains overdue for 90 days or more
(compared to 180 days as prescribed by RBI for FY15).
Once an account becomes non-performing due to
delinquency, the Company treats it as non-performing until
the status for all loans of the customer comes to 0 days
past due. For the accounts tagged as non-performing due
to settlement/ restructuring, an account will continue to be
treated as non-performing irrespective of the delinquency
status till the closure of loan / recognition of loss.
The following table sets forth, at the dates indicated,
information regarding the asset classification of gross non-
performing assets.
The ratio of net NPAs to total customer outstanding increased
to 1.41% at March 31, 2015 compared to 1.34% for the period
ending March 31, 2014. During FY15, the Company wrote-
off NPAs with an aggregate outstanding of H20,068 lakhs
compared to H19,949 lakhs during FY14.
FICCL’s provision coverage ratio (i.e. total provisions made
against NPAs and prudential write-offs as a percentage of
gross NPAs and prudential write-offs) at March 31, 2015 was
67%. At March 31, 2015, total general provision held against
standard assets was H5,164 lakhs compared with H3,749 lakhs
at March 31, 2014.
LiabilitiesThe following table sets forth the principal components of liabilities (including capital and reserves).
(H in lakhs)
Particulars March 31, 2014 March 31, 2015
Non-performing assets
Sub-standard assets 9,717 15,918
Doubtful assets 775 767
Total non-performing assets 10,492 16,685
Year Ended Gross NPA Net NPA Total customers
outstanding
% of net NPA to total Customer
outstanding
March 31, 2014 10,492 8,146 6,10,299 1.34%
March 31, 2015 16,685 12,096 8,60,976 1.41%
The following table sets forth, information regarding non-performing assets (NPA) (H in lakhs, except percentages)
(H in lakhs, except percentages)
Liabilities As on March 31, 2014 As on March 31, 2015 % change
Equity Share Capital 1,85,866 1,85,866 0.0
Reserves (59,227) (29,131) (50.8)
Borrowings (excluding Subordinated Debt) 5,21,594 7,42,203 42.0
- Bank Loans 2,18,729 4,46,143 104.0
- Non-Convertible Debentures 2,30,115 2,07,150 (10.0)
- Commercial Paper 72,749 88,910 22.2
Subordinated Debt (included in Tier-2 capital) 25,000 30,000 20.0
– Non-Convertible Debentures 25,000 30,000 20.0
Other Assets 53,583 84,994 58.6
Total Liabilities 7,26,816 10,13,932 39.5
Notes:All amounts have been rounded off to the nearest lakhs.
Total liabilities (including capital and reserves) increased 40% from H7,26,816 lakhs at March 31, 2014 to H10,13,932 lakhs at March
31, 2015 following an increase in borrowings.
54Directors’ Report
Fullerton 12.11 PARK.indd 54 12/18/2015 2:22:44 PM

Funding / Liquidity ManagementThe company continued with its focus on prudent liquidity
management with several benchmarks to measure liquidity
risk, including (but not limited to) long term to short term ratio,
liquidity buffer (in number of months depending on event and
liquidity risk expectation), single lender limit, cash flow and
pricing gap mismatches. There is continuous oversight over
this key matter from the Board and its relevant committees.
In terms of funding profile, the focus during the year changed
to longer term bank funding, which is considered more
durable, even as access to capital markets was intermittent
due to volatile market conditions and changing regulations.
The company enjoyed success in introducing several new and
prestigious banking relationships during the year under review,
providing stability to funding sources. Furthermore, more than
a dozen institutional investors/ lenders (not including banks)
were added, further de-risking the liability pipeline. Residual
tenure of liabilities was increased to 33 months (from 29
months as of March 2014) to match the longer tenure asset
book. Finally, adequate liquidity buffers in terms of cash/ cash
equivalents were maintained by the Company to be sufficiently
funded for near-term lending and repayments.
Capital Adequacy and Resources The Company proactively manages its capital keeping in mind the interests of its shareholders, regulators, lenders, rating agencies
and other stakeholders. The Company also takes into account extraneous factors that could adversely affect earnings and capital.
The RBI mandates a minimum total capital to risk-weighted assets ratio of 15% and a minimum Tier-1 ratio of 7.5%. The Company
continues to report benchmarks well above stipulation.
Particulars As on March 31, 2014 As on March 31, 2015
Tier 1 Capital 1,15,123 1,43,538
Tier 2 Capital 25,500 32,689
Total Capital 1,40,623 1,76,227
Total Capital Adequacy Ratio 22.4% 19.6%
Tier 1 Capital Adequacy Ratio 18.4% 15.9%
Tier 2 Capital Adequacy Ratio 4.0% 3.6%
(H in lakhs)
40%
58%
Ratio of bank borrowings
29
33
Residual tenor of liabilities
71
95
No of Investors
Mar14 Mar15
55Annual Report 2015 Fullerton India Credit Company Limited
Fullerton 12.11 PARK.indd 55 12/18/2015 2:22:44 PM

Internal Control Fullerton India instituted adequate internal control systems
commensurate with the nature of its business and size of
operations. The systems ascertain that transactions are
authorised, recorded and reported correctly. The Company
ensures adherence with all internal control policies and
procedures as well as compliance with all regulatory guidelines
in respect of business, risk, branches and support functions.
The Audit Committee of the Board of Directors reviews their
adequacy. All significant audit observations of the Internal
Auditors and follow-up actions were reported upon and
discussed at the Audit Committee.
Human Resource Management Fullerton India is in a rapid growth journey, expanding its branch
networks in Rural and semi Urban India as well as diversifying
its skill sets along product lines. The Company has added over
1000 employees in FY15, investing in capabilities to manage
new geographies and leading change initiatives including
new technology deployment, process reengineering and
strengthening policies driven by cutting edge analytics.
While the Company has hired externally to fuel expansion, it
has invested intensively in training and developing its internal
talent. During the year under review, the Company invested
19,739 person-days of training. Nearly 60% of supervisory roles
were grown from within, providing career growth opportunities
across business and functions.
The Company has undertaken several organisation
effectiveness initiatives in this financial year. Staff benefits
have been enhanced with comprehensive health care and
life cover programmes across all levels. The Company’s pay
for performance philosophy permeates right from the Board
levels to the last frontline employees through a balanced
mix of fixed pay, short term and long term incentives in line
that are in sync with the long term strategic agenda of the
Company. Significant time from the CEO and Leadership
time is devoted to staff communication and engagement,
through organisation level leadership broadcast, state level
cascade communication and regional town-halls. This has
resulted in a stronger alignment of the employees’ goals to
the organisation’s priorities and at the same time has provided
a platform for employees to have their questions answered
and issues to be heard and addressed. Through continuous
communication, the Company recorded the best productivity
over the years, better engagement scores and reduced top
talent attrition.
The organisation promotes a strong culture of meritocracy,
integrity, disciplined performance and governance over legal
and compliance matters. The Company has put in place
policies which are designed to ensure a healthy and safe
workplace, free from discrimination where employees can
raise complaints without fear retribution or employment
security. The Company’s code of conduct emphasises equal
opportunity, diversity prevention and redressal of workplace
and gender harassment and has a whistleblower policy and
mechanism for escalation and speedy redressal of issues with
zero tolerance to breaches.
56Directors’ Report
Fullerton 12.11 PARK.indd 56 12/18/2015 2:22:44 PM
Report onCorporate Governance
Annexure II to the Directors’ Report
I. Corporate Governance Philosophy and PracticeFullerton India Credit Company Ltd (FICCL) believes in adopting and adhering to the best recognised
corporate governance practices and continuously benchmarks itself against each such practice. It also
understands and respects its fiduciary role and responsibility towards its shareholders, customers,
employees and bankers and strives hard to meet their expectations.
The Company believes that best Board practices and transparent disclosures are necessary for
creating shareholders’ value. The Company has infused the philosophy of corporate governance
into all its activities. The philosophy on corporate governance is an important tool for shareholders’
protection and maximisation of their long term values. The cardinal principles such as independence,
accountability, responsibility, transparency, fair and timely disclosures, credibility, etc., serve as the
means for implementing the philosophy of corporate governance in letter and spirit. In addition to
compliance with regulatory requirements, FICCL endeavors to ensure highest standards of ethical and
responsible conduct.
The Company continuously focuses on upgrading its governance practices and systems to effectively
meet the new challenges faced by the Company. It is focused on raising the standards of corporate
governance and adopting best systems and procedures. It is also committed to achieve and maintain
the highest standards of corporate governance by timely and accurate disclosure of information
regarding the performance of the Company.
The constitution of the Board and its committees are in compliance with the provisions of the
Companies Act, 2013 and the RBI regulations. Although the Clause 49 of the Listing Agreement does
not apply to FICCL, as its equity shares are not listed on any stock exchange, the Company voluntarily
follows the spirit of Clause 49 to the extent possible.
II. Board of Directors The Corporate Governance principles of the Company ensure that the Board remains informed,
independent and provides guidance to the Company. Further the Board is fully aware of its fiduciary
responsibilities and recognises its responsibilities to stakeholders to uphold the highest standards in all
matters concerning FICCL.
All the Directors of the Company are well qualified persons of proven competence and possess the
highest level of personal and professional ethics, integrity and values. The Directors exercise their
objective judgment independently. The Board is committed towards representing the long term
interests of its stakeholders. The Board members actively participate in all strategic issues which are
crucial for the long term development of the organisation.
57Annual Report 2015 Fullerton India Credit Company Limited
Fullerton 12.11 PARK.indd 57 12/18/2015 2:22:44 PM
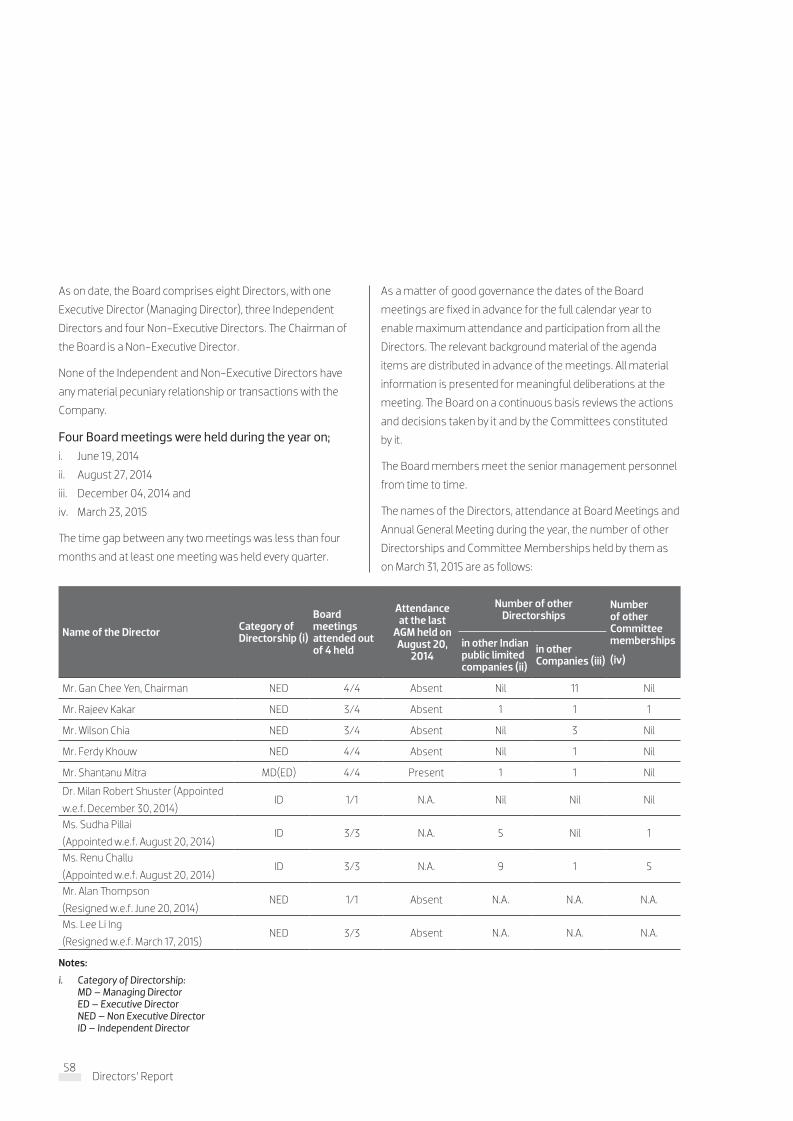
As on date, the Board comprises eight Directors, with one
Executive Director (Managing Director), three Independent
Directors and four Non-Executive Directors. The Chairman of
the Board is a Non-Executive Director.
None of the Independent and Non-Executive Directors have
any material pecuniary relationship or transactions with the
Company.
Four Board meetings were held during the year on;i. June 19, 2014
ii. August 27, 2014
iii. December 04, 2014 and
iv. March 23, 2015
The time gap between any two meetings was less than four
months and at least one meeting was held every quarter.
As a matter of good governance the dates of the Board
meetings are fixed in advance for the full calendar year to
enable maximum attendance and participation from all the
Directors. The relevant background material of the agenda
items are distributed in advance of the meetings. All material
information is presented for meaningful deliberations at the
meeting. The Board on a continuous basis reviews the actions
and decisions taken by it and by the Committees constituted
by it.
The Board members meet the senior management personnel
from time to time.
The names of the Directors, attendance at Board Meetings and
Annual General Meeting during the year, the number of other
Directorships and Committee Memberships held by them as
on March 31, 2015 are as follows:
Name of the Director Category of Directorship (i)
Board meetings attended out of 4 held
Attendance at the last
AGM held on August 20,
2014
Number of other Directorships
Number of other Committee memberships
(iv)
in other Indian public limited companies (ii)
in other Companies (iii)
Mr. Gan Chee Yen, Chairman NED 4/4 Absent Nil 11 Nil
Mr. Rajeev Kakar NED 3/4 Absent 1 1 1
Mr. Wilson Chia NED 3/4 Absent Nil 3 Nil
Mr. Ferdy Khouw NED 4/4 Absent Nil 1 Nil
Mr. Shantanu Mitra MD(ED) 4/4 Present 1 1 Nil
Dr. Milan Robert Shuster (Appointed
w.e.f. December 30, 2014)ID 1/1 N.A. Nil Nil Nil
Ms. Sudha Pillai
(Appointed w.e.f. August 20, 2014)ID 3/3 N.A. 5 Nil 1
Ms. Renu Challu
(Appointed w.e.f. August 20, 2014)ID 3/3 N.A. 9 1 5
Mr. Alan Thompson
(Resigned w.e.f. June 20, 2014) NED 1/1 Absent N.A. N.A. N.A.
Ms. Lee Li Ing
(Resigned w.e.f. March 17, 2015) NED 3/3 Absent N.A. N.A. N.A.
Notes:
i. Category of Directorship: MD – Managing Director ED – Executive Director NED – Non Executive Director ID – Independent Director
58Directors’ Report
Fullerton 12.11 PARK.indd 58 12/18/2015 2:22:44 PM
ii. Comprises public limited companies incorporated in India.
iii. Comprises private limited companies incorporated in India, foreign companies and Section 8 companies.
iv. As per the requirement of Clause 49, only membership/chairmanship of the Audit Committee and Shareholders’/Investors
Grievance Committee held in public limited companies have been considered.
v. None of the Directors of the Company hold Directorship in more than 10 Public Companies or is a member in more than 10 Committees or
acts as Chairman of more than 5 Committees across all companies in which he or she is a Director.
Director seeking reappointmentMr. Ferdy Khouw will be retiring at the forthcoming AGM. He
being eligible has offered himself for re-appointment. The
profile of Mr. Ferdy Khouw is as under:
Mr. Ferdy Khouw is currently the EVP, Treasury and Capital
Markets, at the Company’s parent company, Fullerton Financial
Holdings Pte Ltd, Singapore.
Mr. Khouw has over 27 years of experience in Treasury and
Capital Markets. Most recently, he was Managing Director and
Head of Global Markets Sales, Non Japan Asia at Royal Bank of
Canada (RBC). Prior to that he was based in Hong Kong as the
Head of Investor Sales, Asia Pacific, for HSBC.
Mr. Khouw started his career as a corporate FX dealer at ANZ
Banking Group and several years as a corporate dealer at
Westpac Bank. He then moved on to head FX Sales for Citibank
in Australia and subsequently pursued a career in Asia where
he held many senior positions involving Sales, Trading and
Capital Markets functions. He is particularly respected for his
efforts during the Asian Financial Crisis where he was the
Country Treasurer for Citibank Indonesia.
Mr. Khouw holds a Master of Applied Finance from Macquarie
University and a Bachelor of Economics from the University of
Sydney.
Mr. Khouw is not on the board of any other company in India or
abroad as on date.
Mr. Khouw does not hold any shares in the Company.
III. Board Committees
(a) Audit CommitteeTerms of Reference The powers and terms of reference of the Audit Committee are
comprehensive and include the requirements as set by Section
177 of the Companies Act, 2013. The Committee is vested
with necessary powers as defined in its charter to achieve its
objectives.
The role of the Committee in brief includes the following:
To review appointment and removal, of Internal and external
auditors
To monitor the independence, performance and
effectiveness of internal and external audit process
To review financial statements, oversee the financial
reporting process;
Examination of the internal and external auditors’ reports
and findings
Reviewing the adequacy of internal control systems
To review Related Party Transactions of the Company
To conduct scrutiny of inter-corporate loans and
investments
To approve valuation of undertakings or assets or net worth
of a company or its liabilities
To oversee the vigil mechanism
To approve provision of any other services by auditors apart
from audit
Composition The Audit Committee currently comprises of two Independent
Directors and one Non-Executive Director. All the members
of the Audit Committee are financially literate and persons of
proven competence and integrity. The Company Secretary acts
as the Secretary to the Committee. The Statutory Auditors
and Internal Auditors are invited to the meeting to bring out
the issues which they may have with regards to finance,
operations, processes, systems and other allied matters.
The Audit Committee Meetings were held on the following
dates and the necessary quorum was present at all the
meetings:
i. June 19, 2014
ii. August 27, 2014
iii. November 13, 2014
iv. December 04, 2014 and
v. March 23, 2015
59Annual Report 2015 Fullerton India Credit Company Limited
Fullerton 12.11 PARK.indd 59 12/18/2015 2:22:44 PM

The details of the composition of the Committee and
attendance at its Meetings are set out in the following table:
Name of MemberNumber of Meetings
Attended
Dr. Milan Robert Shuster, Chairman (Appointed w.e.f. December 30, 2014)
1/1
Mr. Rajeev Kakar 4/5
Mr. Sudha Pillai (Appointed w.e.f. August 20, 2014)
4/4
Mr. Wilson Chia, Ex Chairman (Till December 30, 2014)
3/4
Mr. Alan Thompson, Ex Chairman (Resigned w.e.f. June 20, 2014)
1/1
The proceedings of the Audit Committee Meetings were noted
by the Board of Directors at its meetings.
(b) Risk Oversight CommitteeThe Company has a comprehensive, well-established and
detailed risk management framework. The Company especially
focuses on improving sensitivity to assessment of risks and
improving methods of computation of risk weights, processes
and procedures. The Company has constituted a Risk Oversight
Committee to identify, review and control key risk areas,
across the entire organisation as per the requirements of RBI
guidelines.
Terms of Reference Risk Oversight Committee is a dedicated Board-level
committee that monitors the risk management in the
Company. The risk assessment and mitigation procedures are
reviewed by the Board periodically. The role of the Committee
in brief includes the following:
Oversee the development of risk policies and strategies
Implement risk policies relevant to all business units
Ensure that all activities are in compliance with the Prudential
Regulations and also within the framework of the policies and
controls established by the relevant units of the Company
Formulate the policy for the consideration of the Board on
client profile, products and risk return matrix on the asset side
Studying the market with regards to interest rate risk,
currency risk and other financial risks
Formulating the policy on raising the resources based on the
perceived risk parameters
Sanction of the credit limits within ceiling prescribed by the
Board
Determining the terms of the sanction such as the interest
rate, security, repayment, documents, etc. within the overall
credit policy of the Company
The Risk Oversight Committee (ROC) controls and manages
the inherent risks relating to the Company’s activities in the
following categories:
Credit Risk
Market Risk / Liquidity Risk
Liquidity Risk Management
Currency Risk
Interest Rate Risk
Operational Risk
Regulatory / Reputational Risk, etc.
Composition The Risk Oversight Committee currently comprises of one
Independent Director and two Non-Executive Directors.
MeetingsThe Risk Oversight Committee meetings were held on the
following dates and the necessary quorum was present at all
the meetings:
i. June 19, 2014
ii. August 27, 2014
iii. December 04, 2014 and
iv. March 23, 2015
The details of the composition of the Committee and
attendance at its Meetings are set out in the following table:
Name of Member Number of Meetings
Mr. Wilson Chia, Chairman 3/4
Mr. Rajeev Kakar 3/4
Ms. Renu Challu (Appointed w.e.f. August 20, 2014)
3/3
Mr. Gan Chee Yen (Till June 19, 2014)
1/1
The proceedings of the Risk Oversight Committee Meetings
were noted by the Board of Directors at its meetings. The
Company Secretary acts as secretary to the Committee.
(c) Nomination and Remuneration Committee The Company has a Nomination & Remuneration Committee
(NRC) pursuant to the requirements of Section 178 of the
Companies Act, 2013. The Committee is vested with necessary
powers, as per its Charter approved by the Board.
The Terms of Reference of Nomination and Remuneration
60Directors’ Report
Fullerton 12.11 PARK.indd 60 12/18/2015 2:22:44 PM
Committee in brief are as under:
Nomination Functions: Review the structure, size and composition of the Board
Formulate the criteria for directors
Be responsible for identifying and nominating for the
approval of the Board, persons who are qualified to become
directors and who are “fit and proper as director” and may
be appointed in senior management in accordance with the
criteria laid down
Carry out evaluation of the Directors’ performance
Evaluate suitable candidates and approve the appointment
of the CEO and the Company’s Leadership Team members
Formulate plans for succession for the CEO and the
Leadership Team members
Re-appoint any non-executive director at the conclusion of
his or her specified term of office.
Remuneration Functions: Finalise a policy, relating to the remuneration for the
directors, key managerial personnel and other employees
Determine the remuneration payable to the directors
Recommend the compensation for the CEO & MD, and each
of the Leadership Team members
Recommend the compensation strategy and budget
covering all employees of the Company
Review deployment of key Human Capital strategies and
tools.
Composition The Nomination and Remuneration Committee currently
comprises of two Independent Directors and two Non-
Executive Directors.
Meetings The Nomination and Remuneration Committee meetings were
held on the following dates and the necessary quorum was
present at all the meetings:
i. June 19, 2014
ii. December 04, 2014 and
iii. March 23, 2015
The Committee meets on need basis.
The details of the composition of the Committee and
attendance at its meetings are set out in the following table:
Name Number of Meetings
Attended
Mr. Wilson Chia, Chairman (Appointed w.e.f. June 19, 2014)
2/2
Mr. Gan Chee Yen, Ex Chairman 3/3
Dr. Milan Robert Shuster (Appointed w.e.f. December 30, 2014)
1/1
Ms. Renu Challu (Appointed w.e.f. August 20, 2014)
2/2
Mr. Alan Thompson (Resigned w.e.f. June 20, 2014)
1/1
Ms. Lee Li Ing (Till December 04, 2014)
2/2
The proceedings of the Nomination and Remuneration
Committee meetings were noted by the Board of Directors at
its meetings.
(d) Corporate Social Responsibility (CSR) CommitteeThe Company has a Corporate Social Responsibility (CSR)
Committee to comply with the requirements of Section 135
of the Companies Act, 2013. The Committee is vested with
necessary powers, as laid down in its charter to achieve its
objectives.
Terms of Reference The Terms of Reference of the CSR Committee in brief are as
under:
To recommend the Company’s CSR policy
To monitor implementation of the CSR Policy of the
Company
To recommend the amount of expenditure to be incurred on
different CSR activities
To institute a transparent monitoring mechanism for
ensuring implementation of the projects / programs /
activities proposed to be undertaken by the Company and
review the amount spent on them
To review synergy or alignment for various CSR activities
along with partners
To review and finalise the Annual CSR Report reflecting
fairly the Company’s CSR approach, policies, systems and
performance.
61Annual Report 2015 Fullerton India Credit Company Limited
Fullerton 12.11 PARK.indd 61 12/18/2015 2:22:44 PM

Composition The CSR Committee currently comprises of two independent
directors and a Non-Executive Director.
MeetingsThe CSR Committee was constituted on December 04, 2014
and its first meeting was held on March 23, 2015.
The details of the composition of the Committee and
attendance at its Meetings are set out in the following table:
Name Number of Meetings
Attended
Mr. Gan Chee Yen (Chairman) 1/1
Ms. Sudha Pillai 1/1
Ms. Renu Challu 1/1
The proceedings of the CSR Committee Meeting were noted by
the Board of Directors at its meeting.
Your Company has other management committees such
as Asset Liability Committee (ALCO) formed as per the
NBFC’s Prudential Norms (Reserve Bank) Directions, 1998, as
amended from time to time.
IV. Code of ConductThe Company adopted the code of conduct approved by the
Board of Directors which is binding on the employees of the
Company and the same has been complied with. Code of
conduct is signed off on an annual basis every year.
V. Directors & Officers Liability Insurance coverageThe Company has obtained Directors and Officers Liability
Insurance coverage from HDFC Ergo General Insurance
Company Ltd to the extent of H20 crores along with entity
cover under Employees’ Practices Liability and any other legal
action that might be initiated against the Directors.
VI. General Body MeetingsThe details of the General Body Meetings held in the last three financial years are given below:
General Body Meeting Day, Date Time Venue
Seventeenth AGM August 23, 2012 11.30 a.m.Megh Towers, Third Floor, Old No.307, New No.165,
Poonamallee High Road, Maduravoyal, Chennai – 600095
Extra-Ordinary General Meeting September 26, 2012 11.00 a.m.Board Room, Floor 6, B wing, Supreme IT Park, Supreme
City, Behind Lake Castle, Powai, Mumbai 400 076
Eighteenth AGM September 16, 2013 11.30 a.m.Megh Towers, Third Floor, Old No.307, New No.165,
Poonamallee High Road, Maduravoyal, Chennai – 600095
Extra-Ordinary General Meeting April 29, 2014 11.30 a.m.Board Room, Floor 6, B wing, Supreme IT Park, Supreme
City, Behind Lake Castle, Powai, Mumbai 400 076
Extra-Ordinary General Meeting June 10, 2014 11.30 a.m.Board Room, Floor 6, B wing, Supreme IT Park, Supreme
City, Behind Lake Castle, Powai, Mumbai 400 076
Nineteenth AGM August 20, 2014 11.30 a.m.Megh Towers, Third Floor, Old No.307, New No.165,
Poonamallee High Road, Maduravoyal, Chennai – 600095Extra-Ordinary General
MeetingDecember 30, 2014 11.30 a.m.
Board Room, Floor 6, B wing, Supreme IT Park, Supreme
City, Behind Lake Castle, Powai, Mumbai 400 076
62Directors’ Report
Fullerton 12.11 PARK.indd 62 12/18/2015 2:22:44 PM
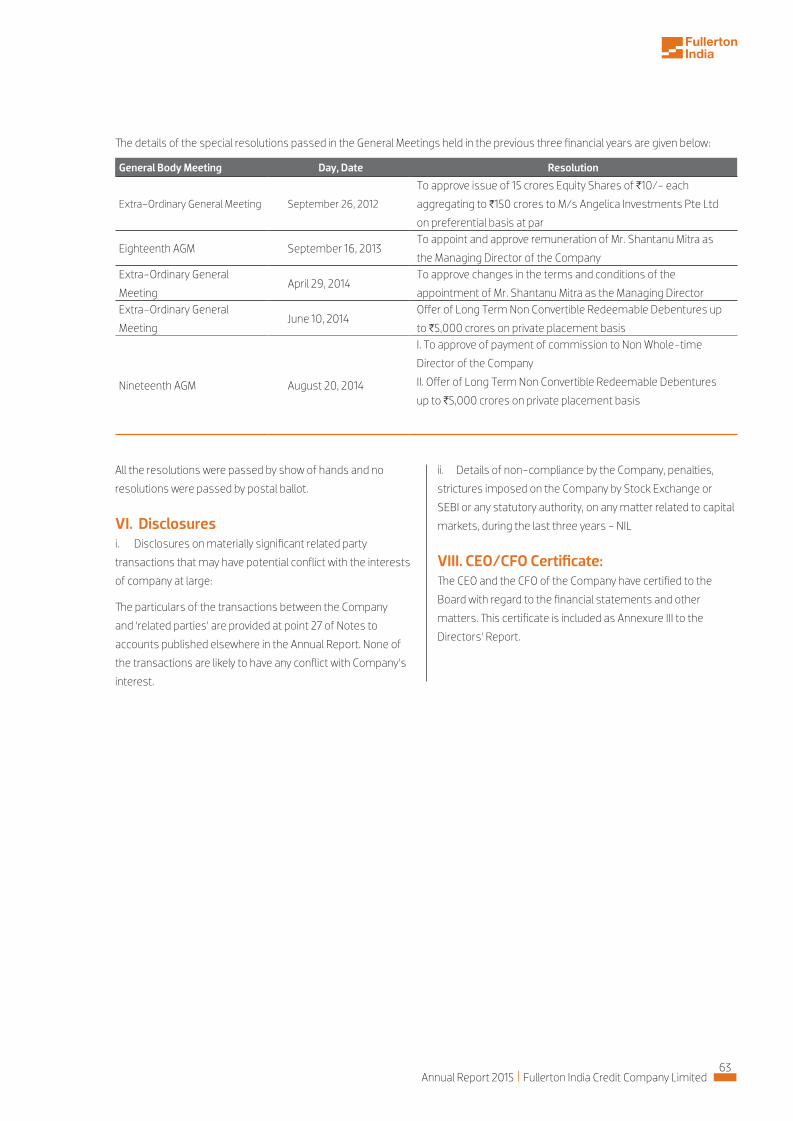
The details of the special resolutions passed in the General Meetings held in the previous three financial years are given below:
General Body Meeting Day, Date Resolution
Extra-Ordinary General Meeting September 26, 2012
To approve issue of 15 crores Equity Shares of H10/- each
aggregating to H150 crores to M/s Angelica Investments Pte Ltd
on preferential basis at par
Eighteenth AGM September 16, 2013To appoint and approve remuneration of Mr. Shantanu Mitra as
the Managing Director of the CompanyExtra-Ordinary General
MeetingApril 29, 2014
To approve changes in the terms and conditions of the
appointment of Mr. Shantanu Mitra as the Managing DirectorExtra-Ordinary General
MeetingJune 10, 2014
Offer of Long Term Non Convertible Redeemable Debentures up
to H5,000 crores on private placement basis
Nineteenth AGM August 20, 2014
I. To approve of payment of commission to Non Whole-time
Director of the Company
II. Offer of Long Term Non Convertible Redeemable Debentures
up to H5,000 crores on private placement basis
All the resolutions were passed by show of hands and no
resolutions were passed by postal ballot.
VI. Disclosuresi. Disclosures on materially significant related party
transactions that may have potential conflict with the interests
of company at large:
The particulars of the transactions between the Company
and ‘related parties’ are provided at point 27 of Notes to
accounts published elsewhere in the Annual Report. None of
the transactions are likely to have any conflict with Company’s
interest.
ii. Details of non-compliance by the Company, penalties,
strictures imposed on the Company by Stock Exchange or
SEBI or any statutory authority, on any matter related to capital
markets, during the last three years - NIL
VIII. CEO/CFO Certificate:The CEO and the CFO of the Company have certified to the
Board with regard to the financial statements and other
matters. This certificate is included as Annexure III to the
Directors’ Report.
63Annual Report 2015 Fullerton India Credit Company Limited
Fullerton 12.11 PARK.indd 63 12/18/2015 2:22:44 PM

Certification by Chief Executive Officer (CEO) and Chief Financial Officer (CFO)
To,
The Shareholders and the Board of Directors
Fullerton India Credit Company Limited
We, Shantanu Mitra, Chief Executive Officer & Managing Director and Pratik Gandhi, Chief Financial
Officer, of Fullerton India Credit Company Limited, to the best of our knowledge and belief, certify that:
a. We have reviewed the financial statements and the cash flow statements for the year ended
March 31, 2015 (hereinafter referred to as the year) and that to the best of our knowledge and belief:
i. These statements do not contain any materially untrue statement or omit any material fact or
contain statements that might be misleading;
ii. These statements together present a true and fair view of the Company’s affairs and are in
compliance with existing accounting standards, applicable laws and regulations.
b. There are no transactions entered into by the Company during the year which are fraudulent, illegal
or violative of the Company’s internal policies
c. We accept responsibility for establishing and maintaining internal controls for financial reporting
and we have evaluated the effectiveness of internal control systems of the Company pertaining to
financial reporting and have disclosed to the auditors and the Audit Committee, deficiencies in the
design or operation of such internal controls, if any, of which we are aware and have taken requisite
steps to rectify these deficiencies.
d. We have indicated to the Auditors and the Audit Committee;
i. Significant changes in internal control over financial reporting during the year and
ii. Significant changes in accounting policies during the year and the same have been disclosed in
the notes to the financial statements.
e. There have been 23 instances of fraud reported by the Company to the Board. The Company has
taken appropriate legal action against the same. Although the Company is registered as deposit-
taking NBFC, it has not accepted deposits from the public.
Shantanu Mitra Pratik Gandhi
Chief Executive Officer and Managing Director EVP, Chief Financial Officer
Date: May 20, 2015
Place: Mumbai
Annexure III to the Directors’ Report
64Directors’ Report
Fullerton 12.11 PARK.indd 64 12/18/2015 2:22:44 PM

Form No. MR-3
SECRETARIAL AUDIT REPORTFOR THE FINANCIAL YEAR ENDED MARCH 31, 2015
[Pursuant to section 204(1) of the Companies Act, 2013 and rule no.9 of the Companies
(Appointment and Remuneration of Managerial Personnel) Rules, 2014]
To,
The Members,
Fullerton India Credit Company Limited
We have conducted the secretarial audit of the
compliance of applicable statutory provisions
and the adherence to good corporate practices
by Fullerton India Credit Company Limited
(hereinafter called “the Company”). Secretarial
Audit was conducted in a manner that provided
us a reasonable basis for evaluating the
corporate conducts/statutory compliances and
expressing our opinion thereon.
Based on our verification of the Company’s
books, papers, minute books, forms and returns
filed and other records maintained by the
Company as specified in Annexure I and also
the information provided by the Company, its
officers, agents and authorised representatives
during the conduct of secretarial audit, we hereby
report that in our opinion, the Company has,
during the audit period covering the financial
year ended on March 31, 2015, complied with
the statutory provisions listed hereunder and
also that the Company has proper board-
processes and compliance-mechanism in place
to the extent, in the manner and subject to the
reporting made hereinafter:
We have examined the books, papers, minute
books, forms and returns filed and other
records maintained by the Fullerton India Credit
Company Limited (the Company),for the financial
year ended on March 31, 2015 according to the
provisions of:
1. The Companies Act, 2013 and the rules made
thereunder including any re-enactment
thereof (‘Act, 2013’);
2. The Securities Contracts (Regulation)
Act, 1956 (“SCRA”) and the rules made
thereunder;
3. The Depositories Act, 1996 and the
regulations and bye-laws framed
thereunder;
4. Foreign Exchange Management Act,
1999 and the rules and regulations made
thereunder to the extent of Foreign Direct
Investment;
5. The following Regulations and Guidelines
prescribed under the Securities and
Exchange Board of India Act, 1992 (“SEBI
Act”):
a. The Securities and Exchange Board of
India (Registrars to an Issue and Share
Transfer Agents) Regulations, 1993
regarding the Companies Act and dealing
with client;
b. Securities and Exchange Board of India
(Issue and Listing of Debt Securities)
Regulations, 2008;
6. Laws specifically applicable to the industry
to which the Company belongs, that is to
say:
a. Reserve Bank of India Act, 1934;
b. Non-Banking Financial (Deposit
Accepting or Holding) Companies
Prudential Norms (Reserve Bank)
Directions, 2007;
c. Non-Banking Financial Companies
Auditor’s Report (Reserve Bank)
Directions, 1998;
Annexure IV to the Directors’ Report
65Annual Report 2015 Fullerton India Credit Company Limited
Fullerton 12.11 PARK.indd 65 12/18/2015 2:22:44 PM

d. Non-Banking Financial Companies ( Acceptance of
Public Deposit) Directions, 1998;
e. RBI guidelines on Frauds – Future approach towards
monitoring of frauds in NBFCs;
f. RBI guidelines on Fair Practices Code (FPC) for all
NBFCs;
g. RBI guidelines on Corporate Governance;
h. RBI guidelines for Raising Money through Private
Placement by NBFCs-Non Convertible Debentures;
i. RBI guidelines on Rounding off transactions to the
Nearest Rupee by NBFCs;
j. ‘Know Your Customer’ (KYC) Guidelines – Anti Money
Laundering Standards (AML) -’Prevention of Money
Laundering Act, 2002 - Obligations of NBFCs in terms
of Rules notified thereunder;
k. Returns to be Submitted by NBFC;
l. Revised Regulatory framework issued by the RBI and
Notifications issued thereunder;
m. RBI guidelines on Early Recognition of Financial
Distress, Prompt Steps for Resolution and Fair
Recovery for Lenders: Framework for Revitalising
Distressed Assets in the Economy
n. The Insurance Regulatory and Development Authority
(Licensing of Corporate Agents) Regulations, 2002;
o. Master Circular by RBI - Allied activities - Entry into
insurance business.
We have also examined compliance with the applicable
clauses of the following:
a. The Listing Agreements entered into by the Company with
the stock exchanges for listing debt securities issued on
private placement basis.
During the period under review, the Company has complied
with the provisions of the Act, Rules, Regulations, Guidelines,
etc. mentioned above.
Management Responsibility:
1. Maintenance of secretarial records is the responsibility of
the management of the Company. Our responsibility is to
express an opinion on these secretarial records based
on our audit;
2. We have followed the audit practices and the processes
as were appropriate to obtain reasonable assurance
about the correctness of the contents of the secretarial
records. The verification was done on test basis to ensure
that correct facts are reflected in secretarial records. We
believe that the processes and practices, we followed
provide a reasonable basis for our opinion;
3. We have not verified the correctness and appropriateness
of financial records and Books of Accounts of the
Company;
4. Wherever required, we have obtained the Management
Representation about the compliance of laws, rules and
regulation and happening of events etc;
5. The compliance of the provisions of Corporate and
other applicable laws, rules, regulations, standards is
the responsibility of management. Our examination was
limited to the verification of procedure on test basis;
6. The Secretarial Audit report is neither an assurance as to
the future viability of the Company nor of the efficacy or
effectiveness with which the management has conducted
the affairs of the Company.
Recommendations as a matter of best practice:
In the course of our audit, we have made certain
recommendations for good corporate practices, separately
placed before the Board, for its necessary consideration and
implementation by the Company.
We further report that:
The Board of Directors of the Company is duly constituted
with proper balance of Executive Directors, Non-Executive
Directors and Independent Directors. The changes in the
composition of the Board of Directors that took place during
the period under review were carried out in compliance with
the provisions of the Act.
Adequate notices were given to all directors to schedule the
Board Meetings, agenda and detailed notes on agenda were
sent at least seven days in advance, and a system exists for
seeking and obtaining further information and clarifications
on the agenda items before the meeting and for meaningful
participation at the meeting.
Majority decision is carried through while the dissenting
members’ views, if any are captured and recorded as part of
the minutes.
We further report that there are adequate systems and
processes in the Company commensurate with the size
and operations of the Company to monitor and ensure
compliance with applicable laws, rules, regulations and
guidelines.
66Directors’ Report
Fullerton 12.11 PARK.indd 66 12/18/2015 2:22:44 PM
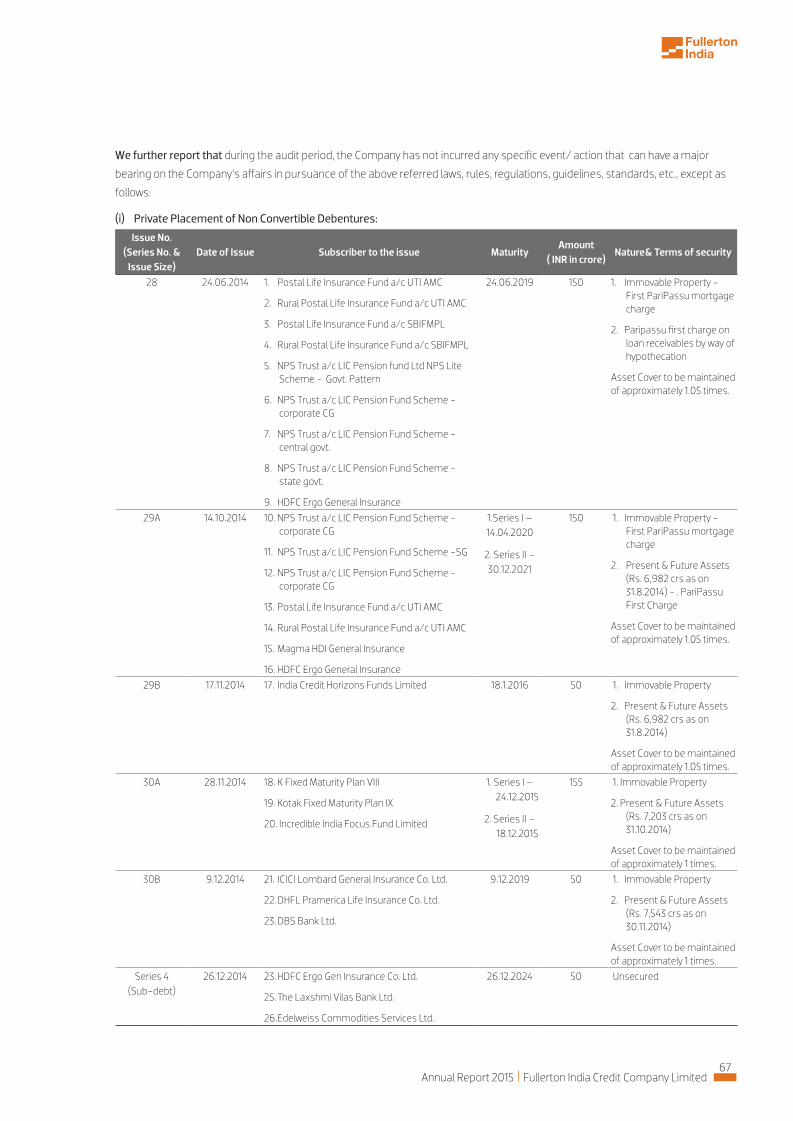
We further report that during the audit period, the Company has not incurred any specific event/ action that can have a major
bearing on the Company’s affairs in pursuance of the above referred laws, rules, regulations, guidelines, standards, etc., except as
follows:
(i) Private Placement of Non Convertible Debentures:
Issue No. (Series No. &
Issue Size)Date of Issue Subscriber to the issue Maturity
Amount ( INR in crore)
Nature& Terms of security
28 24.06.2014 1. Postal Life Insurance Fund a/c UTI AMC
2. Rural Postal Life Insurance Fund a/c UTI AMC
3. Postal Life Insurance Fund a/c SBIFMPL
4. Rural Postal Life Insurance Fund a/c SBIFMPL
5. NPS Trust a/c LIC Pension fund Ltd NPS Lite Scheme - Govt. Pattern
6. NPS Trust a/c LIC Pension Fund Scheme - corporate CG
7. NPS Trust a/c LIC Pension Fund Scheme - central govt.
8. NPS Trust a/c LIC Pension Fund Scheme - state govt.
9. HDFC Ergo General Insurance
24.06.2019 150 1. Immovable Property - First PariPassu mortgage charge
2. Paripassu first charge on loan receivables by way of hypothecation
Asset Cover to be maintained of approximately 1.05 times.
29A 14.10.2014 10. NPS Trust a/c LIC Pension Fund Scheme - corporate CG
11. NPS Trust a/c LIC Pension Fund Scheme -SG
12. NPS Trust a/c LIC Pension Fund Scheme - corporate CG
13. Postal Life Insurance Fund a/c UTI AMC
14. Rural Postal Life Insurance Fund a/c UTI AMC
15. Magma HDI General Insurance
16. HDFC Ergo General Insurance
1.Series I – 14.04.2020
2. Series II – 30.12.2021
150 1. Immovable Property - First PariPassu mortgage charge
2. Present & Future Assets (Rs. 6,982 crs as on 31.8.2014) - . PariPassu First Charge
Asset Cover to be maintained of approximately 1.05 times.
29B 17.11.2014 17. India Credit Horizons Funds Limited 18.1.2016 50 1. Immovable Property
2. Present & Future Assets (Rs. 6,982 crs as on 31.8.2014)
Asset Cover to be maintained of approximately 1.05 times.
30A 28.11.2014 18. K Fixed Maturity Plan VIII
19. Kotak Fixed Maturity Plan IX
20. Incredible India Focus Fund Limited
1. Series I – 24.12.2015
2. Series II – 18.12.2015
155 1. Immovable Property
2. Present & Future Assets (Rs. 7,203 crs as on 31.10.2014)
Asset Cover to be maintained of approximately 1 times.
30B 9.12.2014 21. ICICI Lombard General Insurance Co. Ltd.
22. DHFL Pramerica Life Insurance Co. Ltd.
23. DBS Bank Ltd.
9.12.2019 50 1. Immovable Property
2. Present & Future Assets (Rs. 7,543 crs as on 30.11.2014)
Asset Cover to be maintained of approximately 1 times.
Series 4 (Sub-debt)
26.12.2014 23. HDFC Ergo Gen Insurance Co. Ltd.
25. The Laxshmi Vilas Bank Ltd.
26. Edelweiss Commodities Services Ltd.
26.12.2024 50 Unsecured
67Annual Report 2015 Fullerton India Credit Company Limited
Fullerton 12.11 PARK.indd 67 12/18/2015 2:22:44 PM

Issue No. (Series No. &
Issue Size)Date of Issue Subscriber to the issue Maturity
Amount ( INR in crore)
Nature& Terms of security
30C 23.1.2015 27. Yes Bank Ltd. 23.1.2018 25 1. Immovable Property
2. Present & Future Assets (Rs. 7,780 crs as on 30.12.2014)
Asset Cover to be maintained of approximately 1 times.
30D 29.1.2015 28. SBI Life Insurance Co. Ltd.
29. The Oriental Ins Co. Ltd
30. Union Bank of India
1. Series I – 29.1.2019
2. Series II – 29.1.2020
0 1. Immovable Property
2. Present & Future Assets (Rs. 7,780 crs as on 30.12.2014)
Asset Cover to be maintained of approximately 1 times.
31A 12.02.2015 31. Cairn India Ltd 12.03.2018 50 1. Immovable Property
2. Present & Future Assets (Rs. 7,862 crs as on 31.01.2015)
Asset Cover to be maintained of approximately 1 times.
Sr. No. Deal series No Counter Party Issue dateOriginal Maturity
DateCoupon rate
(ROI)Buyback date
Face Value (H Crs)
1 Series-15 Pramerica MF 28-Aug-12 28-Aug-14 10.75% 15-May-14 10.0
2 Series-15 Kotak MF 28-Aug-12 28-Aug-14 10.75% 15-May-14 35.0
3 Series-15 SBI MF 28-Aug-12 28-Aug-14 10.75% 15-May-14 25.0
4 Series-15 Tata MF 28-Aug-12 28-Aug-14 10.75% 19-May-14 10.0
5 Series-15 Principal MF 28-Aug-12 28-Aug-14 10.75% 19-May-14 5.0
6 Series-15 DSP 28-Aug-12 28-Aug-14 10.75% 20-May-14 25.0
7 Series-15 DSP 28-Aug-12 28-Aug-14 10.75% 21-May-14 25.0
8 Series-15 Credit Suisse Securities 28-Aug-12 28-Aug-14 10.75% 11-Jun-14 10.0
9 Series-21
Unsecured
HDFC ERGO Insurance 9-Aug-11 8-Aug-14 11.25% 23-Jun-14 15.0
10 Series-17 Principal MF 5-Sep-12 4-Sep-15 11.10% 28-Jan-15 4.0
11 Series-17 SBI MF 5-Sep-12 4-Sep-15 11.10% 30-Jan-15 30.0
12 Series-14 Franklin MF 22-Aug-12 21-Aug-15 11.50% 29-Jan-15 50.0
13 Series-14 Franklin MF 22-Aug-12 21-Aug-15 11.50% 9-Mar-15 25.0
14 Series-13 Franklin MF 11-Jun-12 10-Jun-15 12.15% 9-Mar-15 100.0
Total 369.0
(i) Special resolution, in terms of section 180 (1) (a) & (c )was not required to be passed by the Company as the Company had
already passed on 30th April, 2008 by way of special resolution under Section 293 (1) (a) & (d) of Companies Act, 1956 to affirm
the borrowing powers and power to create mortgage/charge/hypothecation on the movable, immoveable property of the
Company to the extent of Rs. 10,000 crores;
(ii) The Company has opted for early redemption (buyback) of certain NCDs listed on the wholesale debt segment, details whereof
has been specified as under. There has been no buyback of specified securities as explained under Section 68 of Act, 2013.
Sd/-
Vinod Kothari & Company
Company Secretaries in Practice
Place: Kolkata ACS 4718
Date: 19th May, 2015 C P No. 1391
68Directors’ Report
Fullerton 12.11 PARK.indd 68 12/18/2015 2:22:45 PM
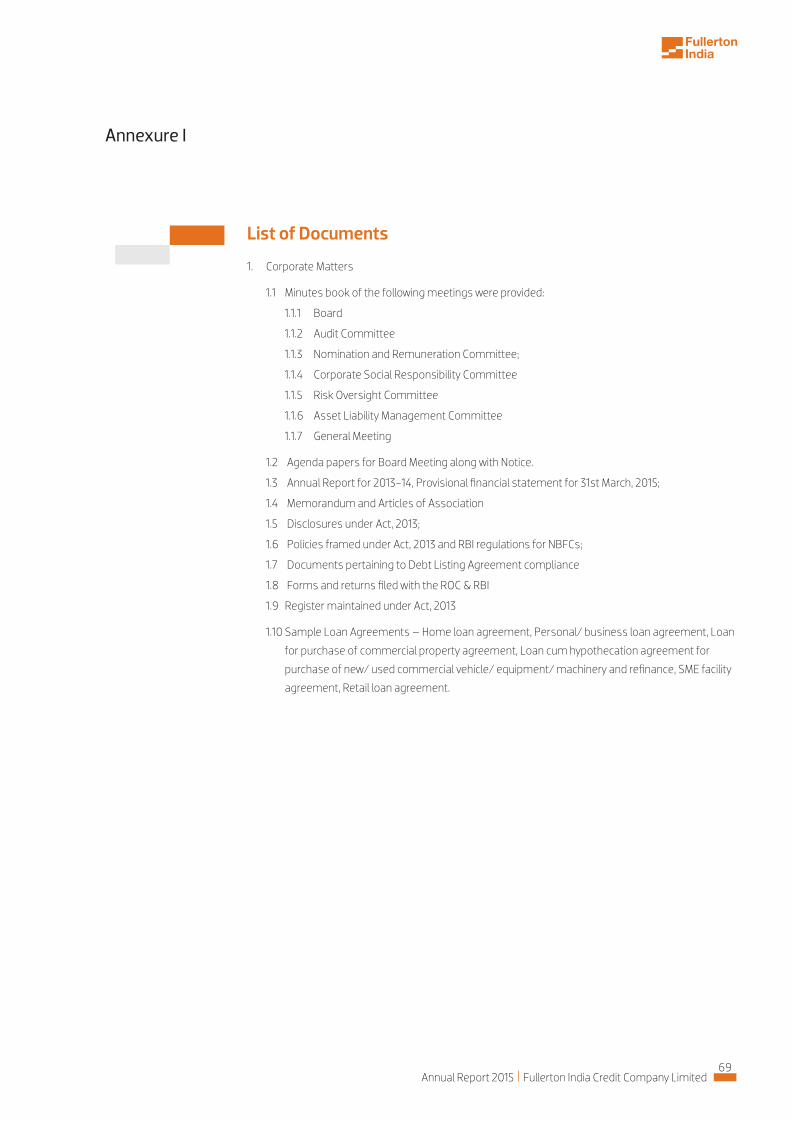
List of Documents
1. Corporate Matters
1.1 Minutes book of the following meetings were provided:
1.1.1 Board
1.1.2 Audit Committee
1.1.3 Nomination and Remuneration Committee;
1.1.4 Corporate Social Responsibility Committee
1.1.5 Risk Oversight Committee
1.1.6 Asset Liability Management Committee
1.1.7 General Meeting
1.2 Agenda papers for Board Meeting along with Notice.
1.3 Annual Report for 2013-14, Provisional financial statement for 31st March, 2015;
1.4 Memorandum and Articles of Association
1.5 Disclosures under Act, 2013;
1.6 Policies framed under Act, 2013 and RBI regulations for NBFCs;
1.7 Documents pertaining to Debt Listing Agreement compliance
1.8 Forms and returns filed with the ROC & RBI
1.9 Register maintained under Act, 2013
1.10 Sample Loan Agreements – Home loan agreement, Personal/ business loan agreement, Loan
for purchase of commercial property agreement, Loan cum hypothecation agreement for
purchase of new/ used commercial vehicle/ equipment/ machinery and refinance, SME facility
agreement, Retail loan agreement.
Annexure I
69Annual Report 2015 Fullerton India Credit Company Limited
Fullerton 12.11 PARK.indd 69 12/18/2015 2:22:45 PM
Annexure V to the Directors’ Report
A brief outline of the Company’s CSR policy, including overview of projects or programmes proposed to
be undertaken and a reference to the web-link to the CSR policy and projects or programmes.
CSR policy of Fullerton India (brief outline)
1. IntroductionFullerton India is committed to grow in a socially and environmentally responsible manner. With
financial inclusion as our guiding business vision, Fullerton India aims to reach out to the under-banked
and unbanked by not just providing them with financial services but also by enabling the communities
with services and skills that would help improve their standards and quality of living.
Thus, Fullerton India’s CSR initiatives aim to create long-term sustainable impact on the community.
The CSR initiatives shall, however, not directly relate have no direct relation with to (i) the business of the
Company and (ii) welfare of its employees.
2. CSR VisionFullerton India’s CSR Vision is to enable sustainable development and inclusive growth across
communities through innovative socioeconomic and environmental interventions, in fulfilment of its
role as a socially responsible corporate.
3. CSR ObjectivesFullerton India’s CSR initiative focuses on the three keys aspects of community development - social,
economic and environment. To achieve long-term sustainable impact on the community, Fullerton
India’s CSR objectives are:
Advance livelihoods through: Identification of technical expertise for guidance and facilitation of programmes
Skill development and capacity-building initiatives
Income enhancement through market linkages, across value chains
Education programmes focusing on enhancement of knowledge leading to upgradation of skills and
empowerment
Improve the social well-being of the community through: Health awareness and intervention programmes for the benefit of the community and the under-
privileged residing in the vicinity of the Company’s operational areas, with a focus on eye care and
nutrition.
Health interventions with a focus on women through awareness and implementation of programmes
enabling adoption of best-in-class practices
Awareness about preventive healthcare, with a focus on hygiene and clean drinking water.
Adoption of sustainable environmental practices through: Promotion and adoption of environmentally sustainable practices, such as organic farming
Report on Corporate Social Responsibility
70Directors’ Report
Fullerton 12.11 PARK.indd 70 12/18/2015 2:22:45 PM

Raising awareness and adoption of green technology and
alternative energy through programmes/interventions
4. ScopeThe CSR Policy (the ‘Policy’) shall be applicable to all CSR
initiatives and activities undertaken by Fullerton India and all
its employees for the welfare and sustainable development
benefit of different segments of the society at large.
This Policy is in line with the Section 135 of the Companies Act,
2013 (the ‘Act’) and the rules made there under.
Web link: http://www.fullertonindia.com/community-initiatives/our-csr-mission.aspx
a) The Composition of the CSR Committee:
The CSR Committee consists of the following three members:
1. Mr. Gan Chee Yen (Chairman)
2. Mrs. Renu Challu (Independent Director)
3. Mrs. Sudha Pillai (Independent Director)
b) Average net profit of the Company (computed in accordance with provisions of Section 198 of the Companies Act, 2013) for the last three financial years
Average net profit for last three financial years (in Hlakhs)
Company/Year FY12 FY13 FY14Average for the last three years
FICCL 4,979 15,167 18,794 12,980
c) Prescribed CSR expenditure (two per cent of the amount as in item 3 above) H260 lakhs (2% of H12,980 lakhs)
d) Details of CSR expenditure during the financial year. Total amount to be expenditure during the financial year;
H2.6 crore
Amount unspent, if any;
H1.6 crore (to be carried forward to FY 15-16)
Manner in which the amount spent during the financial year is detailed below:
FULLERTON INDIA CSR REPORT
S. No.
CSR Project or activity Identified
Sector in which the Project is covered
Projects or programs local area or other specify the state and district where projects or
programs was undertaken
Amount outlay
(Budget) project or
program wise
Amount spent on the projects or programs Sub
heads Cumulative expenditure up to the reporting
period˙
Amount spent: direct
or through implementing
agency
1.
Direct Expenditure on projects
and programs
2.
Overheads
1 Mobile Medical clinics
Schedule VII, Item (i)- promoting preventive health care
Location-1-: 20 villages and urban slums in Hubli (Karnataka); Location-2-: Jaipur (Rajasthan)
14,53,500 7,26,750 0 7,26,750 Implementing agency
2 Vision Care Center
Schedule VII, Item (i)- promoting
preventive health care
Location-1-: Slums in Rajamundhary (Andhra pradesh)
Location-2-: 50 villages Ramchandrapuram, Rajamundhary
(Andhra Pradesh)
9,50,000 4,10,000 0 4,10,000 Implementing agency
71Annual Report 2015 Fullerton India Credit Company Limited
Fullerton 12.11 PARK.indd 71 12/18/2015 2:22:45 PM

FULLERTON INDIA CSR REPORT
S. No.
CSR Project or activity Identified
Sector in which the Project is covered
Projects or programs local area or other specify the state and district where projects or
programs was undertaken
Amount outlay
(Budget) project or
program wise
Amount spent on the projects or programs Sub
heads Cumulative expenditure up to the reporting
period˙
Amount spent: direct
or through implementing
agency
1.
Direct Expenditure on projects
and programs
2.
Overheads
3 Vision Care Center
Schedule VII, Item (i)- promoting
preventive health care
Location-: 50 villages in Dharapuram block, Coimbatore
(Tamil Nadu)
8,69,100 5,16,600 0 5,16,600 Implementing agency
4 Vision Care Center
Schedule VII, Item (i)- promoting
preventive health care
Location-1-: 50 villages Ravulapalem, East Godavary
(Andhra Pradesh)
96,000 88,000 0 88,000 Implementing agency
5 Mobile Vision Care Van
Schedule VII, Item (i)- promoting
preventive health care
Location-: 10-slums in Indore (Madhya Pradesh)
23,83,950 15,00,000 0 15,00,000 Implementing agency
6 Eye Check-up camps
Schedule VII, Item (i)- promoting
preventive health care
Location-1-: 100 villages in Godhra, and Aravali district,
(Gujarat) Location-2-: 50 villages Krishnankoil, Virudhunagar (Tamil
Nadu)
12,50,000 8,05,000 0 10,06,630 Implementing agency
Disaster Relief Schedule VII, Item (i)- promoting
preventive health care, eradicating hunger,
poverty
Location-1-: J&K flood relief Location-2-:
Odisha flood relief
14,00,000 14,00,000 0 14,00,000 Implementing agency
7 Livelihood Enhancement-
Commercial Stitching and
tailoring
Schedule VII, Item (ii)- promoting employment
enhancing vocational skills especially among women
Location-1-: Sagar (Madhya Pradesh), Location-2-:
Jabalpur (madhya Pradesh)
6,25,844 3,12,922 0 3,12,922 Implementing agency
8 Livelihood Enhancement- Beauty and Hair
care
Schedule VII, Item (ii)- promoting employment
enhancing vocational skills especially among women
Location-1-: Pune (Maharashtra)
8,39,610 5,04,777 0 5,04,777 Implementing agency
9 Vocational training program
Schedule VII, Item (ii)- promoting employment
enhancing vocational skills especially among women
200 locations in 6 states (Maharashtra, Madhya Pradesh,
Tamil Nadu, Karnataka, Rajasthan, Gujarat)
5,00,000 3,10,000 0 3,10,000 Direct
10 Livelihood Enhancement-
Cattle Care Program
Schedule VII, Item (ii)- Livelihood Enhancement
projects
200 locations in 7 states (Maharashtra, Madhya Pradesh,
Tamil Nadu, Karnataka, Rajasthan, Gujarat, Andhra Pradesh)
18,70,000 15,75,000 0 15,75,000 Direct
11 Livelihood Enhancement-
Integrated Livestock
Development
Schedule VII, Item (ii)- Livelihood Enhancement
projects
5 blocks in Hoshangabad (Madhya Pradesh)
12,60,000 6,03,000 0 6,03,000 Implementing agency
12 Environment Sustainability-
Krish Mitra Program
Schedule VII, Item (iv)- Conservation of
natural resources and maintaining quality
of soil
Location-1-: 8 blocks in 3 district-Nashik, Ahmednagar
and Solapur (Maharashtra); Location-2-: 2 blocks of Erode
district (Tamil Nadu)
14,00,000 6,48,000 0 6,48,000 Implementing agency
13 Administrative cost
5% of Spending 4,70,000
Grand Total 94,00,049 0 98,70,049
72Directors’ Report
Fullerton 12.11 PARK.indd 72 12/18/2015 2:22:45 PM

c) In case the Company has failed to spend the two per cent of the average net profit of the last three financial years or any part thereof, the Company shall provide the reasons for not spending the amount in its Board report.H154 lakhs was unspent and is being carried forward to FY 15-16
Fullerton India has a robust CSR program conducting more
than 700 CSR programs and benefitting more than 15000
households every year for the last 5 years with major focus on
livelihood advancement.
To align itself with the additional requirements of the
Company’s law, Fullerton India planned to diversify its focus
areas as well as scale up its CSR activities. Health care,
Environment and Education focused programs were initiated.
To encapsulate the new focus sectors a comprehensive CSR
policy and framework was designed in consultation with all
the stakeholders. It’s been an endeavour of Fullerton India to
launch any CSR project on a pilot before scaling up, helping iron
out the practical challenges in implementation and design a
robust CSR project replicated across the country.
This being the first year for mandatory spending and due to
the above challenges Fullerton India was unable to spend its
demarcated 2% of the stipulated CSR budget.
Fullerton India as a responsible corporate is committed to its
social obligation and in its first CSR committee meeting held
in December 2014 had decided to carry forward the entire
unspent for the FY 15, which is an amount of H154 lakhs to FY16.
We hereby certify that the implementation and monitoring of
CSR Projects are in compliance with the CSR objectives and
Policy of Fullerton India.
The entire unspent amount as a part of its CSR budget for FY15
will be spent and carried forward to the CSR budget of FY 16.
Sd/- Sd/-
Shantanu Mitra Gan Chee Yen
(Chief Executive Officer and Managing Director) (Chairman CSR Committee)
Date: May 20, 2015
Place: Mumbai
73Annual Report 2015 Fullerton India Credit Company Limited
Fullerton 12.11 PARK.indd 73 12/18/2015 2:22:45 PM

74
Independent Auditor’s Report
To the Members of Fullerton India Credit Company Limited
Report on the Consolidated Financial Statements
We have audited the accompanying consolidated financial statements
of Fullerton India Credit Company Limited (hereinafter referred to as
“the Holding Company”) and its subsidiaries (the Holding Company
and its subsidiaries together referred to as “the Group”), comprising of
the consolidated Balance Sheet as at March 31, 2015, the consolidated
Statement of Profit and Loss and consolidated Cash Flow Statement for
the year then ended, and a summary of significant accounting policies
and other explanatory information (hereinafter referred to as ‘the
consolidated financial statements’).
Management’s Responsibility for the Consolidated Financial Statements
preparation of these consolidated financial statements in terms with the
requirement of the Companies Act, 2013 (“the Act”) that give a true and
fair view of the consolidated financial position, consolidated financial
performance and consolidated cash flows of the Group in accordance
with accounting principles generally accepted in India, including the
Accounting Standards specified under Section 133 of the Act, read with
of Directors of the companies included in the Group are responsible
for maintenance of adequate accounting records in accordance with
the provisions of the Act for safeguarding of the assets of the Group
and for preventing and detecting frauds and other irregularities; the
selection and application of appropriate accounting policies; making
judgments and estimates that are reasonable and prudent; and the
design, implementation and maintenance of adequate internal financial
control that were operating effectively for ensuring the accuracy and
completeness of the accounting records, relevant to the preparation
and presentation of the financial statements that give a true and fair
view and are free from material misstatement, whether due to fraud
or error, which have been used for the purpose of preparation of the
consolidated financial statements by the Directors of the Holding
Company, as aforesaid.
Auditor’s Responsibility
Our responsibility is to express an opinion on these consolidated
financial statements based on our audit. While conducting the audit,
we have taken into account the provisions of the Act, the accounting
and auditing standards and matters which are required to be included
in the audit report under the provisions of the Act and the Rules made
thereunder. We conducted our audit in accordance with the Standards
on Auditing, issued by the Institute of Chartered Accountants of India, as
we comply with ethical requirements and plan and perform the audit to
obtain reasonable assurance about whether the financial statements
are free from material mis-statement.
An audit involves performing procedures to obtain audit evidence about
the amounts and disclosures in the consolidated financial statements.
assessment of the risks of material of the consolidated
financial statements, whether due to fraud or error. In making those
risk assessments, the auditor considers internal financial control
relevant to the Holding Company’s preparation of the consolidated
financial statements that give a true and fair view in order to design
audit procedures that are appropriate in the circumstances but not for
the purpose of expressing an opinion on whether the Holding Company
has in place an adequate internal financial controls system over financial
reporting and the operating effectiveness of such controls. An audit
also includes evaluating the appropriateness of accounting policies
used and the reasonableness of the accounting estimates made by the
Holding Company’s Board of Directors, as well as evaluating the overall
presentation of the consolidated financial statements. We believe that
the audit evidence obtained by us and the audit evidence obtained by
the other auditors in terms of their reports referred to in paragraph (a) of
the Other Matters below, is sufficient and appropriate to provide a basis
for our audit opinion on the consolidated financial statements.
Opinion
In our opinion and to the best of our information and according to the
explanations given to us, the consolidated financial statements give
the information required by the Act in the manner so required and give
a true and fair view in conformity with the accounting principles generally
accepted in India of the consolidated state of affairs of the Group, as
at March 31, 2015, their consolidated profit, and their consolidated cash
flows for the year ended on that date.
Report on Other Legal and Regulatory Requirements
1. As required by the Companies (Auditor’s Report) Order, 2015 (“the
Order”), issued by the Central Government of India in terms of sub-
section (11) of Section 143 of the Act, based on the comments in
the auditor’s report of the Holding Company and its subsidiaries
mis-statement.

75Annual Report 2015 Fullerton India Credit Company Limited
incorporated in India, to whom the Order applies, we give in the
Annexure a statement on the matters specified in paragraphs 3 and
4 of the Order, to the extent applicable.
2. As required by section 143 (3) of the Act, we report, to the extent
applicable, that:
(a) We and other auditors whose reports we have relied upon have
sought and obtained all the information and explanations which
to the best of our knowledge and belief were necessary for the
purpose of our audit of the aforesaid consolidated financial
statements;
(b) In our opinion proper books of account as required by law
relating to preparation of the aforesaid consolidation of the
financial statements have been kept so far as it appears from
our examination of those books and reports of the other
auditors;
(c)
Profit and Loss, and consolidated Cash Flow Statement dealt
with by this Report are in agreement with the books of account
maintained for the purpose of preparation of the consolidated
financial statements;
(d) In our opinion, the aforesaid consolidated financial statements
comply with the Accounting Standards specified under section
133 of the Act, read with Rule 7 of the Companies (Accounts)
Rules, 2014;
(e) On the basis of the written representations received from the
directors of the Holding Company as on March 31, 2015 taken on
record by the Board of Directors of the Holding Company and
the reports of the auditors who are appointed under Section
139 of the Act, of its subsidiary companies incorporated in India,
none of the directors of the Group’s companies is disqualified
as on March 31, 2015 from being appointed as a director in terms
of Section 164 (2) of the Act.
(f) With respect to the other matters to be included in the Auditor’s
Report in accordance with Rule 11 of the Companies (Audit and
Auditors) Rules, 2014, in our opinion and to the best of our
information and according to the explanations given to us:
i.
of pending litigations on its consolidated financial position
of the Group – Refer Note 29 to the consolidated financial
statements;
ii.
contracts including derivative contracts as at March 31, 2015
for which there were any material foreseeable losses; and
iii.
transferred to the Investor Education and Protection Fund
by the Group.
Other Matter
(a)
assets of Rs 105,346,654 as at March 31, 2015, and total revenues
of Rs. 3,905,892 and net cash outflows of Rs. 164,214 for the year
ended on that date, in respect of two subsidiaries, which have
been audited by other auditors, which financial statements, other
financial information and auditor’s reports have been furnished to
us by the management. Our opinion on the consolidated financial
statements, in so far as it relates to the amounts and disclosures
included in respect of these subsidiaries, and our report in terms
of sub-sections (3) and (11) of Section 143 of the Act, in so far as it
relates to the aforesaid subsidiaries, is based solely on the reports
of such other auditors.
Our opinion on the consolidated financial statements, and our report
on Other Legal and Regulatory Requirements above, is not modified in
respect of the above matters with respect to our reliance on the work
done and the reports of the other auditors and the financial statements
and other financial information certified by the Management.
For S. R. BATLIBOI & CO. LLP
ICAI Firm Registration Number: 301003E
Chartered Accountants
Sd/-
per Shrawan Jalan
Place: Mumbai Partner
Date: May 20, 2015 Membership No.: 102102

76
Annexure to the Auditor’s Report
Annexure referred to in paragraph 1 under the heading “Report on other legal and regulatory requirements” of our report of even date
Re: Fullerton India Credit Company Limited
Company’) and its subsidiaries and to whom the provisions of the Order
apply together are referred to as “the Covered entities” in this report.
(i) (a)
showing full particulars, including quantitative details and
situation of fixed assets. According to the reports of the
other auditors who audited the financial statements of other
Covered entities of the group, such other covered entities do
not have any fixed assets, and accordingly, the requirements
under paragraph 3(i)(a) of the Order are not applicable to such
covered entities and hence not commented upon.
(b) Fixed assets have been physically verified by the management
of the Holding Company during the year and no material
discrepancies were identified on such verification. According
to the reports of the other auditors who audited the financial
statements of other Covered entities of the group, such other
covered entities do not have any fixed assets, and accordingly,
the requirements under paragraph 3(i)(b) of the Order are not
applicable to such covered entities and hence not commented
upon.
(ii)
of the Group does not involve inventories and, accordingly, the
requirements under paragraph 4(ii) of the Order are not applicable
to the Holding Company and other covered entities of the Group
and hence not commented upon.
(iii) According to the information and explanations given to us and
as reported by the other auditors who audited the financial
statements of other covered entities of the Group, the Holding
Company and other Covered entities of the Group have not
granted any loans, secured or unsecured to companies, firms or
other parties covered in the register maintained under section 189
of the Companies Act, 2013. Accordingly, the provisions of clause
3(iii)(a) and (b) of the Order are not applicable to the Covered
entities of the Group and hence not commented upon.
(iv) In our opinion and according to the information and explanations
given to us, there is an adequate internal control system
commensurate with the size of the Holding Company and the
nature of its businesses, for the purchase of fixed assets and for
rendering of services. During the course of our audit, no major
weakness was observed or continuing failure to correct any major
weakness in the internal control system of the Holding Company
in respect of these areas. According to the reports of the other
auditors who audited the financial statements of other covered
entities of the group, such other covered entities have not started
its operations and have not undertaken any transactions for
purchase of fixed assets or rendering of any services during the
year, and accordingly, the requirements under paragraph (iv) are
not applicable to such other covered entities.
(v)
not accepted any deposits from the public.
(vi) To the best of our knowledge and as explained and reported
fo stnemetats laicnanfi eht detidua ohw srotidua rehto eht yb
covered entities of the Group, the Central Government has not
specified the maintenance of cost records under clause 148(1) of
the Companies Act, 2013, for the services of the Holding Company
and Covered entities of the Group.
(vii) (a)
are generally regular in depositing with appropriate authorities
undisputed statutory dues including provident fund,
employees’ state insurance, income-tax, sales-tax, wealth-
tax, service tax, customs duty, excise duty, value added tax,
cess and other material statutory dues as applicable to the
respective covered entities.
(b) According to the information and explanations given to us,
no undisputed amounts payable in respect of provident fund,
employees’ state insurance, income-tax, wealth-tax, service
tax, sales-tax, customs duty, excise duty, value added tax,
cess and other material statutory dues were outstanding,
at the year end, for a period of more than six months from
the date they became payable for the covered entities of the
Group.
(c) According to the records of the Holding Company and Covered
entities of the Group and as reported by other auditors who
audited the financial statements of certain covered entities
in the Group, the dues outstanding of income-tax, sales-
tax, wealth-tax, service tax, customs duty, excise duty, value

77Annual Report 2015 Fullerton India Credit Company Limited
added tax and cess on account of any dispute, are as follows:
Name of the Entity Name of the statute Nature of the dues
Amount (Rs)
Period to which the amount
relates
Due Date Forum where the dispute is pending
Fullerton India Credit Company Limited
Chapter V of the Finance Act, 1994
Service tax 416,282 Various dates Various dates
Commissioner of Central Excise (Appeals)
(d)
to the Investor Education and Protection Fund by the
Holding Company and other Covered entities of the Group in
accordance with the relevant provisions of the Companies Act,
1956 (1 of 1956) and rules made thereunder.
(viii)
than fifty per cent of its net worth and it has not incurred cash
losses in the current and immediately preceding financial year in
respect of Holding Company. Based on the report of the other
auditor who audited the financial statements of other covered
entities of the Group, the Covered entity has been registered for
a period of less than five years and hence they not required to
comment on whether or not the accumulated losses at the end
of the financial year is fifty per cent or more of its net worth and
whether it has incurred cash losses in the current financial year
and in the immediately preceding financial year.
(ix) Based on our audit procedures and as per the information and
explanations given by the management and as reported by the
other auditor who audited the financial statements of certain
covered entities, of the Group, we are of the opinion that the
Holding Company and Covered entities of the Group have not
defaulted in their repayment of dues to a financial institution, bank
or debenture holders.
(x) According to the information and explanations given to us, and
based on the reports of the other auditors who audited the
financial statements of other Covered entities of the Group, the
Holding Company and the Covered entities of the Group have
not given any guarantee for loans taken by others from banks or
financial institutions.
(xi) Based on information and explanations given to us by the
management of the Holding Company, term loans were applied
for the purpose for which the loans were obtained, though idle/
surplus funds which were not required for immediate utilisation
have been gainfully invested in liquid investments payable on
demand. Based on the report of the other auditor who audited the
financial statements of other covered entities of the Group, the
Covered entity did not have any term loans outstanding during the
year and accordingly, paragraph 3(xi) of the Order is not applicable
and hence not commented upon.
(xii) Based upon the audit procedures performed for the purpose
of reporting the true and fair view of the consolidated financial
statements and as per the information and explanations given by
the management and reports of the other auditors who audited
the financial statements / financial information of other covered
entities of the group, which we have relied upon, we report that no
fraud on or by the Covered entities of the Group have been noticed or
reported during the year, except in case of Holding Company where
we have been informed that during the year there were fourteen
instances of cash embezzlements by the employees of the
Holding Company and external parties aggregating Rs. 13,93,521;
eight instances of loans given based on misrepresentation by
the borrowers, employees and external parties aggregating Rs.
32,50,336; an instance of fraudulent transfer of excess amounts
lying in customer loan accounts by an employee to accounts of
the employees involved have been terminated and the Holding
Company is in the process of taking legal action against such
provided the outstanding balance (net of recovery) aggregating Rs.
17,906,242, as at the Balance sheet date.
For S. R. BATLIBOI & CO. LLP
ICAI Firm Registration Number: 301003E
Chartered Accountants
Sd/-
per Shrawan Jalan
Place: Mumbai Partner
Date: May 20, 2015 Membership No.: 102102
1,40,90,000

78
Notes March 31, 2015 March 31, 2014
Rs. lakhs Rs. lakhs
EQUITY AND LIABILITIES
Shareholders’ funds
Share capital 3 1,85,866 1,85,866
Reserves and surplus 4 (29,079) (59,200)
Non-current liabilities
Long-term borrowings 5 4,89,208 3,34,130
Other long term liabilities 6 6,515 3,508
Long-term provisions 7 8,057 5,000
Current liabilities
Short-term borrowings 8 90,415 83,200
Other current liabilities 9 2,61,067 1,72,071
Short-term provisions 7 1,937 2,270
TOTAL 10,13,986 7,26,845
ASSETS
Non-current assets
Fixed assets
Tangible assets 10 2,432 2,302
Intangible assets 11 1,096 1,633
Assets under development 10 & 11 1,127 495
Non-current investments 12 5 5
Long-term loans and advances 13 6,01,792 4,07,769
Other non-current assets 14 6,241 5,256
Current assets
Current investments 15 50,684 41,747
Trade receivables 16 254 267
Cash and bank balances 17 55,069 38,919
Short-term loans and advances 13 2,77,270 2,15,405
Other current assets 14 18,016 13,047
TOTAL 10,13,986 7,26,845
Summary of significant accounting policies 2.1
Consolidated Balance Sheet as at March 31, 2015
As per our report of even date
S. R. BATLIBOI & Co. LLP For and on behalf of the Board of Directors of ICAI Firm Registration number: 301003E Fullerton India Credit Company Limited Chartered Accountants
Sd/- Sd/- Sd/-per Shrawan Jalan Gan Chee Yen Shantanu Mitra Partner Chairman CEO and Managing Director Membership No: 102102 Sd/- Sd/- Pratik Gandhi Pankaj Malik Chief Financial Officer Head - Finance and Company Secretary
Place : Mumbai Place : Mumbai Date : May 20, 2015 Date : May 20, 2015

79Annual Report 2015 Fullerton India Credit Company Limited
Notes March 31, 2015 March 31, 2014
Rs. lakhs Rs. lakhs
INCOME
Revenue from operations 18 1,67,863 1,32,873
Other income 19 4,200 5,908
Total revenue (I) 1,72,063 1,38,781
EXPENSES
Employee benefit expense 20 29,556 25,480
Other expenses 21 24,788 21,719
Depreciation and amortisation expense 10&11 2,309 2,118
Finance costs 22 70,861 56,167
Provisions and write-offs 23 14,417 14,484
Total expenses (II) 1,41,931 1,19,968
Profit before tax (III) =(I)-(II) 30,132 18,813
Tax expenses
Income tax for the year 6,935 4,750
Provision related to previous years (158) 646
MAT credit entitlement (6,765) (5,390)
Total tax expense (IV) 12 6
Profit for the year (III)-(IV) 30,120 18,807
Earnings per equity share (Rs.) 24
Diluted (Computed on the basis of total profit for the year) 1.62 1.01
Basic (Computed on the basis of total profit for the year) 1.62 1.01
Summary of significant accounting policies 2.1
Consolidated Statement of Profit and Loss for the year ended March 31, 2015
As per our report of even date
S. R. BATLIBOI & Co. LLP For and on behalf of the Board of Directors of ICAI Firm Registration number: 301003E Fullerton India Credit Company Limited Chartered Accountants
Sd/- Sd/- Sd/-per Shrawan Jalan Gan Chee Yen Shantanu Mitra Partner Chairman CEO and Managing Director Membership No: 102102 Sd/- Sd/- Pratik Gandhi Pankaj Malik Chief Financial Officer Head - Finance and Company Secretary
Place : Mumbai Place : Mumbai Date : May 20, 2015 Date : May 20, 2015

80
March 31, 2015 March 31, 2014
Rs. lakhs Rs. lakhs
A. CASH FLOW FROM OPERATING ACTIVITIES:
Net profit before taxation 30,132 18,813
Adjustment to reconcile profit before tax to net cash flows
Depreciation and amortisation 2,309 2,117
Interest on fixed deposits and bonds (3,086) (1,623)
Interest on investments (3,418) (1,944)
Profit on sale of fixed assets (38) (16)
Write off of fixed assets and intangible assets 66 27
Profit on sale of investments (1,926) (4,518)
Unrealised loss on investments 3 105
Provision for standard/sub standard assets and bad debts written off 14,417 14,383
Provision for employees benefits (86) 213
Amortisation of ancillary borrowing costs 1,466 1,511
Unamortised loan origination costs (3,807) (3,659)
Unamortised loan processing fees 5,149 5,305
Operating profit before working capital changes 41,181 30,714
Movements in working capital :
- (Increase)/decrease in long term loans and advances (1,96,719) (1,11,591)
- (Increase)/decrease in short term loans and advances (65,554) (42,006)
- (Increase)/decrease in other current assets (2,386) (1,506)
- (Increase)/decrease in trade receivables 13 (127)
- Increase/(decrease) in current liabilities 23,101 6,078
- Increase/(decrease) in other long term liabilities 652 378
- Increase/ (decrease) in short term Provision 31 (1)
Cash generated from operations (1,99,681) (1,18,062)
- Income taxes paid (5,221) (4,351)
Net cash from operating activities (A) (2,04,903) (1,22,413)
B. CASH FLOW FROM INVESTING ACTIVITIES:
Purchase of fixed assets and intangibles (2,866) (2,220)
Proceeds from sale of fixed assets 43 25
Purchase of current investments (12,01,237) (17,25,854)
Sale/maturity of investments 11,97,536 17,26,669
Fixed deposit placed during the year (59,109) (39,918)
Fixed deposit matured during the year 19,872 38,150
Interest received on fixed deposits and bonds 2,154 1,178
Interest received on investments 115 517
Net cash from investing activities (B) (43,492) (1,453)
Consolidated Cash Flow Statement for the year ended March 31, 2015

81Annual Report 2015 Fullerton India Credit Company Limited
March 31, 2015 March 31, 2014
Rs. lakhs Rs. lakhs
C. CASH FLOW FROM FINANCING ACTIVITIES
Proceeds from long term borrowings from banks and financial institutions 3,62,000 2,64,300
Proceeds from short term borrowings from banks and financial institutions 1,68,636 1,75,638
Repayment of long term borrowings from banks and financial institutions (1,43,607) (1,04,007)
Repayment of short term borrowings from banks and financial institutions (1,61,435) (2,04,793)
Payment of ancillary borrowing costs (1,373) (1,592)
Net cash used in financing activities (C ) 2,24,221 1,29,546
Net increase/(decrease) in cash and cash equivalents (A)+(B)+(C) (24,173) 5,680
Cash and cash equivalents as at the beginning of the year 33,107 27,427
Cash and cash equivalents as at the end of the year 8,934 33,107
(refer note 28)
Components of cash and cash equivalents as at the end of the year
Cash and cheques on hand 1,151 819
With banks - on current account 7,783 12,673
- on deposit account - 19,615
Cash and cash equivalents as at the end of the year 8,934 33,107
Summary of significant accounting policies 2.1
Consolidated Cash Flow Statement for the year ended March 31, 2015
As per our report of even date
S. R. BATLIBOI & Co. LLP For and on behalf of the Board of Directors of ICAI Firm Registration number: 301003E Fullerton India Credit Company Limited Chartered Accountants
Sd/- Sd/- Sd/-per Shrawan Jalan Gan Chee Yen Shantanu Mitra Partner Chairman CEO and Managing Director Membership No: 102102 Sd/- Sd/- Pratik Gandhi Pankaj Malik Chief Financial Officer Head - Finance and Company Secretary
Place : Mumbai Place : Mumbai Date : May 20, 2015 Date : May 20, 2015

82
Notes to the Consolidated Financial Statements for the year ended March 31, 2015
(Amount in Rupees Lakhs unless otherwise stated)1. CORPORATE INFORMATION
Fullerton India Credit Company Limited (‘the Company’) is a public limited company domiciled in India and incorporated under the provisions
Company provides loans to small and medium enterprises for working capital and growth, loans for commercial vehicles and two-wheelers,
home improvement loans, loans against property, personal loans, working capital loans for urban salaried and self-employed and loans for rural
livelihood advancement and financing of various rural micro enterprises.
2. SIGNIFICANT ACCOUNTING POLICIES
(a) Basis of Preparation of Consolidated Financial Statements
‘FICCL’) and its subsidiaries (hereinafter collectively referred to as the ‘Group’).
under the Companies Act, 2013 (the ‘Act’), read with General Circular 8/2014 dated April 4, 2014 and as per the guidelines issued by Reserve Bank
and are consistent with those used in the previous year.
(b) Principles of Consolidation
(i)
eliminated on consolidation.
assets, liabilities, income and expenses, after eliminating intra-group balances and intra-group transactions resulting in unrealised profits
or losses.
circumstances and necessary adjustments required for deviations, if any to the extent possible unless otherwise stated, are made in the
Consolidated Financial Statements and are presented in the same manner as the Company’s standalone financial statements.
(ii)
Particulars Country of Incorporation
Proportion of ownership as on March 31, 2015
Proportion of ownership as on March 31, 2014
Financial Year ends on
Fullerton India Home Finance Company Limited India 100% 100% March 31
Fullerton India Foundation for Social and Economic Development
India 100% 100% March 31
For the purpose of Consolidated Financial Statements, the results of FICCL and its subsidiaries for the year ended March 31, 2015 have been
derived from the respective Company’s audited financials of the year ended March 31, 2015.
2.1 Summary of Significant Accounting Policies
(a) Use of estimates
judgements, estimates and assumptions that affect the reported amounts of revenues, expenses, assets and liabilities and disclosure of
contingent liabilities at the end of reporting period. Although these estimates are based on management’s knowledge of current events and
actions, uncertainty about these assumptions and estimates could result in the outcomes requiring a material adjustment to the carrying
amount of assets and liabilities in future periods.
(b) Tangible fixed assets
Fixed assets are carried at cost, net of accumulated depreciation and impairment loss, if any. Cost includes purchase price and directly
attributable cost of bringing the asset to its working condition for the intended use.
Gain or loss arising from de-recognition of a fixed asset is measured as the difference between the net disposal proceeds and the carrying
amount of the asset and is recognised in the Statement of Profit and Loss when the asset is derecognised.

83Annual Report 2015 Fullerton India Credit Company Limited
Notes to the Consolidated Financial Statements for the year ended March 31, 2015
(Amount in Rupees Lakhs unless otherwise stated) (c) Intangible assets
Costs relating to acquisition and development of computer software are capitalised in accordance with the AS 26 ‘Intangible Assets’ issued
by the Institute of Chartered Accountants of India (‘ICAI’) and are amortised using the straight line method over a period of five years, which
is the management’s estimate of its useful life.
(d) Depreciation on tangible fixed assets
Depreciation on tangible fixed assets is provided using the Straight Line Method (‘SLM’) as per the useful life of the asset estimated by the
management.
Useful life estimated by the Group(in years)
Useful Life as per Schedule II(in years)
Building 50 60
Computer Server and Other Accessories 4 6
Computer Desktop and Laptops 3 3
Furniture and Fixtures 5 10
Office Equipments 5 5
Handheld devices 2 5
Vehicles 4 8
Leasehold improvements are amortised over the period of the lease subject to a maximum lease period of 66 months.
Tangible assets having an original cost up to Rs. 5,000 individually are depreciated fully in the year of purchase.
(e) Impairment
amount is the greater of the asset’s net s
s
elling price and value in use. In assessing value in use, the estimated future cash flows are
discounted to their present value using a pre-tax discount rate that reflects current market assessments of the time value of money and
risk specific to the asset.
After impairment, depreciation is provided on the revised carrying amount of the asset over its remaining useful life.
(f) Investments
Investments, which are readily realisable and intended to be held for not more than one year from the date on which such investments
are made, are classified as current investments. All other investments are classified as long-term investments. Current investments are
carried in the financial statements at lower of cost and fair value determined in accordance with the NBFC directions. Investments in the
units of mutual funds in the nature of current investments that have been valued at the net asset value declared by the mutual fund in
respect of each particular scheme, in accordance with the NBFC directions. Long-term investments are carried at cost. However, provision
for diminution in value is made to recognise a decline other than temporary in the value of the investments.
(g) Asset classification and Provisioning/write-off of Assets
(i) Loans are classified as standard and non-performing assets in accordance with Company’s policy. A loan is classified as NPA, where
interest/installment is overdue for a period of 90 days and above, from the day it becomes due.
(ii) Loans are provided for/written off, in accordance with Company’s policy, subject to the minimum provision required as per Non–
Banking Financial (Deposit Accepting or Holding) Companies Prudential Norms (Reserve Bank) Directions, 2007 as amended from
time to time.
(h) Leases
Where the Group is the lessor
Assets given on operating leases are included in fixed assets. Lease income is recognised in the Statement of Profit and Loss on a straight-
line basis over the lease term. Costs, including depreciation are recognised as an expense in the Statement of Profit and Loss. Initial direct
costs such as legal costs, brokerage costs, etc. are recognised immediately in the Statement of Profit and Loss.
Where the Group is the lessee
Lease arrangements where the Lessor effectively retains, substantially, all the risks and benefits of ownership of the leased term, are
classified as operating leases. Operating lease payments are recognised as an expense in the Statement of Profit and Loss on a straight-
line basis over the lease term.

84
Notes to the Consolidated Financial Statements for the year ended March 31, 2015
(Amount in Rupees Lakhs unless otherwise stated) (i) Revenue recognition
Revenue is recognised to the extent that it is probable that the economic benefits will flow to the Group and the revenue can be reliably
measured.
Interest Income
Interest income on loans given is recognised under the internal rate of return method.
Such interest, where installments are overdue for 90 days and above, is recognised only when actually realised. Any such income, recognised
and remaining unrealised after the installments have become overdue for 90 days and above, is reversed.
Interest income on deposits with banks is recognised on a time proportion basis taking into account the amount outstanding and the
applicable interest rate.
Income from Assignment of loans and receivables
On sale of receivables under asset assignment arrangement, the profit arising on account of sale is recognised over the life of the receivables
assigned on an accrual basis and loss, (if any) arising on account of sale is accounted immediately.
Fee income
Loan processing fee/document fee/stamp fee are recognised over the term of the loan in proportion to the interest accrued during the
year. For the agreements foreclosed or transferred through assignment, the unamortised portion of the fee is recognised as income to the
Statement of Profit and Loss at the time of such foreclosure/transfer through assignment.
Additional charges such as penal, dishonour, foreclosure charges, etc. are recognised on realisation basis.
Income on discounted instruments
Income on discounted instruments is recognised over the tenor of the instrument on straight line basis.
Commission and brokerage income
Commission and brokerage income earned for the services rendered are recognised on accrual basis.
Dividend Income
Dividend income is recognised when the shareholders’ right to receive payment is established by the balance sheet date.
Profit/Loss in sale of investments
Profit/loss earned on sale of investments is recognised on trade date basis. On disposal of an investment, the difference between its
carrying amount and net disposal proceeds is charged or credited to the Statement of Profit and Loss.
(j) Foreign currency transactions
i) Initial recognition
Foreign currency transactions are recorded at exchange rate ruling at the date of transaction.
ii) Conversion
Foreign currency monetary balances are reported using the exchange rate prevailing at the reporting date.
Non-monetary balances, which are measured in terms of historical cost denominated in a foreign currency, are reported using the
exchange rate at the date of the transaction.
iii) Exchange differences
Exchange differences arising on the settlement of monetary balances or on the restatement of the Company’s monetary balances
at rates different from those at which they were initially recorded during the year, or reported in the previous financial statements, are
recognised as income or as expense in the year in which they arise.
(k) Retirement and Other Employee benefits
i) Short Term Employee Benefits
All short term employee benefits are accounted on undiscounted basis during the accounting period based on services rendered by
employees.
ii) Defined Contribution Plans
a)
payable to the provident fund.
b) Superannuation is provided for on accrual basis, in accordance with the Group’s policy.
iii) Defined Benefit Plans
Gratuity liability is provided for on the basis of an actuarial valuation on projected unit credit method made at the end of each financial
year. Actuarial gain or loss is recognised in full in the period in which they occur in the Statement of Profit and Loss.
85Annual Report 2015 Fullerton India Credit Company Limited
Notes to the Consolidated Financial Statements for the year ended March 31, 2015
(Amount in Rupees Lakhs unless otherwise stated) iv) Leave benefits
Accumulated leave balance, which is expected to be utilised within the next twelve months, is treated as short term employee benefit.
entitlement that has accumulated at the reporting date.
v) Other Benefits
contribution for branch sales incentives has been discontinued effective January 1, 2013. For amounts not due as at the end of the year
(based on employment period), expense is provided for on the basis of an actuarial valuation made at the end of the financial year.
Actuarial gains/losses are immediately taken to the Statement of Profit and Loss and are not deferred. Amounts due to employees
after completion of required employment period are provided for on accrual basis.
(l) Income taxes
Tax expense comprises current and deferred tax. Current income tax is measured at the amount expected to be paid to the tax authorities
enacted or substantively enacted at the reporting date.
Deferred income taxes reflects the impact of current year timing differences between taxable income and accounting income originating
during the current year and reversal of timing differences of earlier years. Deferred tax is measured based on the tax rates and the tax laws
enacted or substantively enacted at the balance sheet date. Deferred tax assets are recognised only to the extent that there is reasonable
certainty that sufficient future taxable income will be available against which such deferred tax assets can be realised. In situations where
the Company has unabsorbed depreciation or carry forward tax losses, all deferred tax assets are recognised only if there is virtual certainty
supported by convincing evidence that they can be realised against future taxable profits.
At each balance sheet date, the Company re-assesses unrecognised deferred tax assets. It recognises unrecognised deferred tax assets
to the extent that it has become reasonably certain or virtually certain, as the case may be that sufficient future taxable income will be
available against which such deferred tax assets can be realised.
credit available as an asset only to the extent that there is convincing evidence that the Company will pay normal income tax during the
specified period, i.e., the period for which MAT credit is allowed to be carried forward. In the year in which the Company recognises
s
MAT
credit as an asset in accordance with the Guidance Note on Accounting for Credit Available in respect of Minimum Alternative Tax under the
Income Tax Act, 1961, the said asset is created by way of credit to the Statement of Profit and Loss and shown as “MAT Credit Entitlement.”
not have convincing evidence that it will pay normal tax during the specified period.
(m) Earnings per share
Basic earnings per share is calculated by dividing the net profit or loss for the period attributable to equity shareholders (after deducting
attributable taxes) by the weighted average number of equity shares outstanding during the year.
For the purpose of calculating diluted earnings per share, the net profit or loss for the year attributable to equity shareholders and the
weighted average number of shares outstanding during the year are adjusted for the effects of all dilutive potential equity shares.
(n) Provisions & Contingencies
A provision is recognised when an enterprise has a present obligation as a result of past event; it is probable that an outflow of resources
embodying economic benefits will be required to settle the obligation, in respect of which a reliable estimate can be made. Provisions are
estimates are reviewed at each reporting date and adjusted to reflect the current best estimates.
A contingent liability is a possible obligation that arises from past events whose existence will be confirmed by the occurrence or non-
occurrence of one or more uncertain future events beyond the control of the Group or a present obligation that is not recognised because it
is not probable that an outflow of resources will be required to settle the obligation. A contingent liability also arises in extremely rare cases
where there is a liability that cannot be recognised because it cannot be measured reliably. A disclosure for contingent liability is made when
there is a possible obligation or a present obligation that may, but probably will not, require an outflow of resources or it cannot be reliably
estimated. When there is a possible obligation or a present obligation in respect of which the likelihood of outflow of resources is remote,
no provision or disclosure is made. A contingent asset is neither recognised nor disclosed.
(o) Cash and cash equivalents
Cash and cash equivalents for the purpose of cash flow statement comprise cash at bank and cash in hand and short term balances with
original maturity of three months or less from the date of acquisition, highly liquid investments that are readily convertible into known amounts
of cash and which are subject to insignificant risk of changes in value.
86
Notes to the Consolidated Financial Statements for the year ended March 31, 2015
(Amount in Rupees Lakhs unless otherwise stated) (p) Share based payments
In case stock appreciation rights, measurement and disclosure of the employee share-based payment plan is done in accordance with
relating to stock appreciation rights using the intrinsic value method. Compensation expense is amortised over the vesting period of the
rights on a straight line basis.
(q) Borrowing costs
Ancillary borrowing costs incurred in connection with the arrangement of borrowings is amortised over the tenure of the respective
borrowings.
(r) Loan origination costs
Loan origination costs such as credit verification, contact point verification, agreement stamping and direct selling agents commission are
recognised as expense over the contractual tenor of the loan agreements in proportion to the interest accrued during the year. For the
agreements foreclosed or transferred through assignment, the unamortised portion of the loan acquisition costs are recognised as charge
to the Statement of Profit and Loss at the time of such foreclosure/transfer through assignment.
(s) Operating cycle
Assets and Liabilities are classified as current and non-current based on the operating cycle which has been estimated to be 12 months. All
assets and liabilities which are expected to be realised and settled, within a period of 12 months from the date of Balance Sheet have been
classified as current and other assets and liabilities are classified as non-current.
(t) Cash flow statement
Cash flows are reported using the indirect method, whereby profit/(loss) before extraordinary items and tax is adjusted for the effects of
investing and financing activities of the Group are segregated based on the available information.
(u) Commercial papers
issue value is amortised on a time basis and is disclosed separately under finance charges.
2.2 Change in estimates:
(a) Depreciation/amortisation of tangible and intangible assets
In accordance with the requirements of Schedule II of the Act, the Company has reassessed the useful life and residual value of its tangible
and intangible assets. As a result,
i) an amount of Rs. 6 lakhs has been charged to the Statement of Profit and Loss in respect of the assets whose remaining life is nil as
at April 1, 2014 and
ii) an amount of Rs. 126 lakhs has been charged to the Statement of Profit and Loss for the year, representing the additional depreciation
on the carrying value of the assets as at April 1, 2014 due to change in useful life of the asset.
(b) During the current year, the Company has revised the estimate of provision on standard assets. Had the Company used the estimate
applicable in previous year the provision on standard assets would have been lower by Rs. 1,531 lakhs.
(c) During the current year, the Company has revised the estimate of provision on sub-standard assets. Had the Company used the estimate
applicable in previous year the provision on sub-standard assets would have been lower by Rs. 426 lakhs.
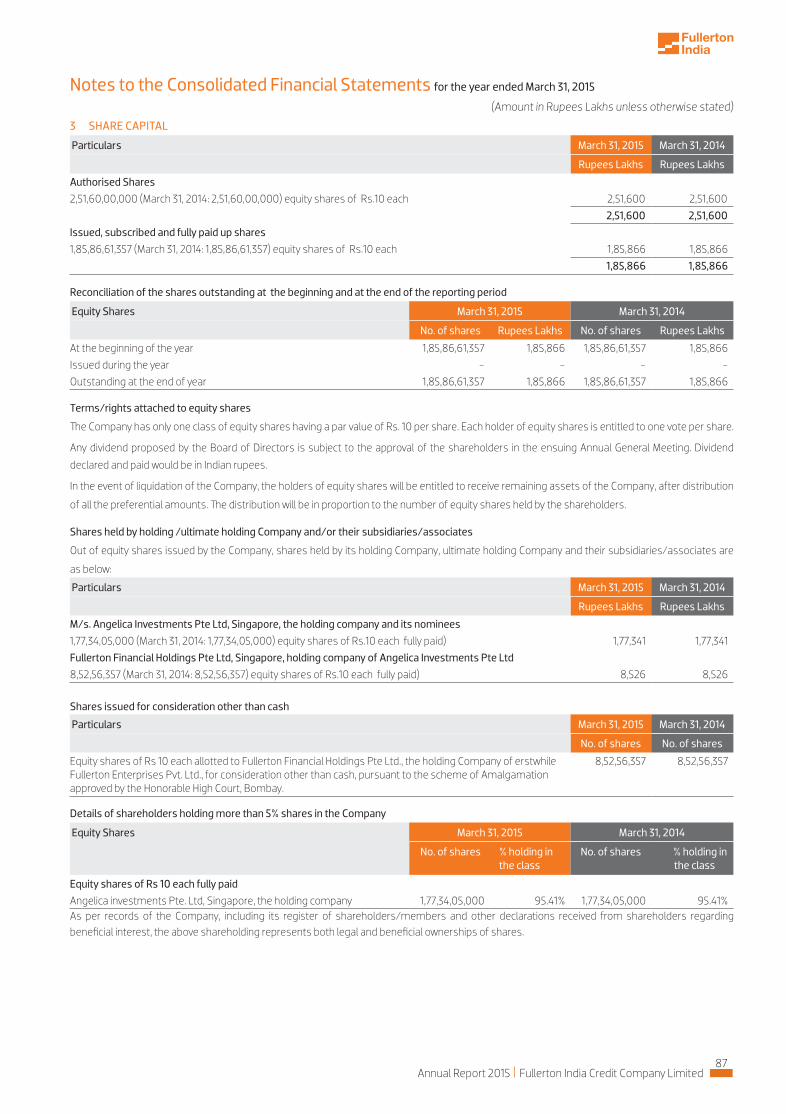
87Annual Report 2015 Fullerton India Credit Company Limited
Notes to the Consolidated Financial Statements for the year ended March 31, 2015
(Amount in Rupees Lakhs unless otherwise stated)
3 SHARE CAPITAL
Particulars March 31, 2015 March 31, 2014
Rupees Lakhs Rupees Lakhs
Authorised Shares
2,51,60,00,000 (March 31, 2014: 2,51,60,00,000) equity shares of Rs.10 each 2,51,600 2,51,600
2,51,600 2,51,600
Issued, subscribed and fully paid up shares
1,85,86,61,357 (March 31, 2014: 1,85,86,61,357) equity shares of Rs.10 each 1,85,866 1,85,866
1,85,866 1,85,866
Reconciliation of the shares outstanding at the beginning and at the end of the reporting period
Equity Shares March 31, 2015 March 31, 2014
No. of shares Rupees Lakhs No. of shares Rupees Lakhs
At the beginning of the year 1,85,86,61,357 1,85,866 1,85,86,61,357 1,85,866
Issued during the year - - - -
Outstanding at the end of year 1,85,86,61,357 1,85,866 1,85,86,61,357 1,85,866
Terms/rights attached to equity shares
Company has only one class of equity shares having a par value of Rs. 10 per share. Each holder of equity shares is entitled to one vote per share.
Any dividend proposed by the Board of Directors is subject to the approval of the shareholders in the ensuing Annual General Meeting. Dividend
declared and paid would be in Indian rupees.
In the event of liquidation of the Company, the holders of equity shares will be entitled to receive remaining assets of the Company, after distribution
Particulars March 31, 2015 March 31, 2014
Rupees Lakhs Rupees Lakhs
M/s. Angelica Investments Pte Ltd, Singapore, the holding company and its nominees
1,77,34,05,000 (March 31, 2014: 1,77,34,05,000) equity shares of Rs.10 each fully paid) 1,77,341 1,77,341
Fullerton Financial Holdings Pte Ltd, Singapore, holding company of Angelica Investments Pte Ltd
8,52,56,357 (March 31, 2014: 8,52,56,357) equity shares of Rs.10 each fully paid) 8,526 8,526
Shares held by holding /ultimate holding Company and/or their subsidiaries/associates
Out of equity shares issued by the Company, shares held by its holding Company, ultimate holding Company and their subsidiaries/associates are
as below:
Particulars March 31, 2015 March 31, 2014
No. of shares No. of shares
Equity shares of Rs 10 each allotted to Fullerton Financial Holdings Pte Ltd., the holding Company of erstwhile Fullerton Enterprises Pvt. Ltd., for consideration other than cash, pursuant to the scheme of Amalgamation approved by the Honorable High Court, Bombay.
8,52,56,357 8,52,56,357
Shares issued for consideration other than cash
Details of shareholders holding more than 5% shares in the Company
Equity Shares March 31, 2015 March 31, 2014
No. of shares % holding in the class the class
No. of shares % holding in
Equity shares of Rs 10 each fully paid
Angelica investments Pte. Ltd, Singapore, the holding company 1,77,34,05,000 95.41% 1,77,34,05,000 95.41%As per records of the Company, including its register of shareholders/members and other declarations received from shareholders regarding beneficial interest, the above shareholding represents both legal and beneficial ownerships of shares.

88
Notes to the Consolidated Financial Statements for the year ended March 31, 2015
Particulars March 31, 2015 March 31, 2014
Rupees Lakhs Rupees Lakhs
General Reserve 96 96
(A) 96 96
Capital Reserve 349 349
(B) 349 349
Securities Premium Account 696 696
(C) 696 696
Reserve Fund under Section 45 - IC of the RBI Act, 1934
Balance as per the last financial statements 7,939 4,180
Add: Amount transferred from surplus balance in the statement of profit and loss 6,019 3,759
Closing Balance (D) 13,958 7,939
(Deficit) in the statement of profit and loss
Balance as per the last financial statements (68,279) (83,327)
Add: Profit for the year 30,120 18,807
Less: Transferred to Statutory Reserve [@ 20% of profit after tax (6,019) (3,759)
Net deficit in the statement of profit and loss (E) (44,178) (68,279)
Total reserves and surplus (A+B+C+D+E) (29,079) (59,200)
4 RESERVE AND SURPLUS
Non Current portion Current maturities
Particulars March 31, 2015 March 31, 2014 March 31, 2015 March 31, 2014
Rupees Lakhs Rupees Lakhs Rupees Lakhs Rupees Lakhs
Term Loans
Indian rupee loan from banks (secured)* 3,31,908 1,37,580 1,01,229 59,198
Indian rupee loan from banks (unsecured) 11,500 11,500 - -
Debentures
Debentures (secured)** 1,15,800 1,57,550 88,850 67,566
Debentures (unsecured) 30,000 27,500 2,500 2,500
Total 4,89,208 3,34,130 1,92,579 1,29,264
Secured Borrowings 4,47,708 2,95,130 1,90,079 1,26,764
Unsecured Borrowings 41,500 39,000 2,500 2,500
Less: Amount disclosed under the head other current liabilities (refer note 9) - - 1,92,579 1,29,264
Total 4,89,208 3,34,130 - -
* Indian rupee loan from banks are secured by first pari passu charge over all loan receivables except specific charge on specific loan receivables for one of the financial institution
** Debentures are secured by first pari passu charge over all loan receivables and immovable property.
5 LONG TERM BORROWINGS

89Annual Report 2015 Fullerton India Credit Company Limited
Notes to the Consolidated Financial Statements for the year ended March 31, 2015
Original maturity of loan(in no. of days)
Rate of interest
Due within 1 year Due 1 to 2 Years Due 2 to 3 Years More than 3 Years Total
No. of installments
Rupees Lakhs
No. of installments
Rupees Lakhs
No. of installments
Rupees Lakhs
No. of installments
Rupees Lakhs
Rupees Lakhs
Monthly repayment schedule
1096-1460 9% - 11% - - 6 25,000 - - - - 25,000
More than 1460 11% - 12% 12 1,632 12 1,632 12 1,632 1 201 5,097
Quarterly repayment schedule
366-720 9% - 11% 1 625 – - - - - - 625
731-10959% - 11% 6 6,250 8 8,750 2 2,500 - - 17,500
12% - 13% - - - - - - - - -
1096-1460
More than 1460
9% - 11% 23 43,007 30 55,651 9 17,875 - - 1,16,533
11% - 12% 19 16,944 11 9,097 - - - - 26,041
11% -12 % 4 5,000 2 2,500 - - - - 7,500
Half yearly repayment schedule
731-1095 9% - 11% 2 3,333 2 3,333 1 1,667 - - 8,333
1096-1460 9% - 11% 1 2,500 2 5,000 1 2,500 - - 10,000
More than 1460 9% - 11% 3 8,667 10 24,729 12 27,229 19 31,374 91,999
Yearly repayment schedule
1096-1460
More than 1460
9% - 11% - - 1 3,750 1 3,750 - - 7,500
11% - 12% - - 1 2,500 1 2,500 2 5,000 10,000
Bullet repayment schedule
731-10959% - 11% - - - - 1 7,500 - - 7,500
11% -12 % - - 1 10,000 - - - - 10,000
1096-1460 9% - 11% - - 2 21,500 - - - - 21,500
Total 87 1,01,229 110 1,91,596 61 88,070 50 63,742 4,44,637
Terms of repayment of term loan as on March 31, 2015
Original maturity of loan(in no. of days)
Rate of interest
Due within 1 year Due 1 to 2 Years Due 2 to 3 Years More than 3 Years Total
No. of installments
Rupees Lakhs
No. of installments
Rupees Lakhs
No. of installments
Rupees Lakhs
No. of installments
Rupees Lakhs
Rupees Lakhs
Monthly repayment schedule
More than 1460 11% - 12% 12 1,632 12 1,632 12 1,632 13 1,833 6,729
Quarterly repayment schedule
366-720 9% - 11% 4 2,500 1 625 - - - - 3,125
731-1095
9% - 11% - - 8 11,250 8 11,250 - - 22,500
11% - 12% 10 7,311 9 6,895 2 1,362 - - 15,568
12% - 13% 19 23,857 5 4,374 1 625 - - 28,856
1096-1460 11% - 12% - - 2 1,000 4 2,000 4 2,000 5,000
More than 1460
9% - 11% 1 277 4 1,110 4 3,613 - - 5,000
11% - 12% 14 11,120 28 20,357 24 38,523 - - 70,000
12% - 13% 2 2,500 4 5,000 2 2,500 - - 10,000
Bullet repayment schedule
731-109511% - 12% - - - - 1 10,000 - - 10,000
12% - 13% 1 10,000 - - - - - - 10,000
1096-1460 9% - 11% - - - - 1 11,500 - - 11,500
More than 1460 9% - 11% - - - - 1 10,000 - - 10,000
Total 63 59,198 73 52,242 60 93,005 17 3,833 2,08,278
Terms of repayment of term loan as on March 31, 2014
5 LONG TERM BORROWINGS (contd.)
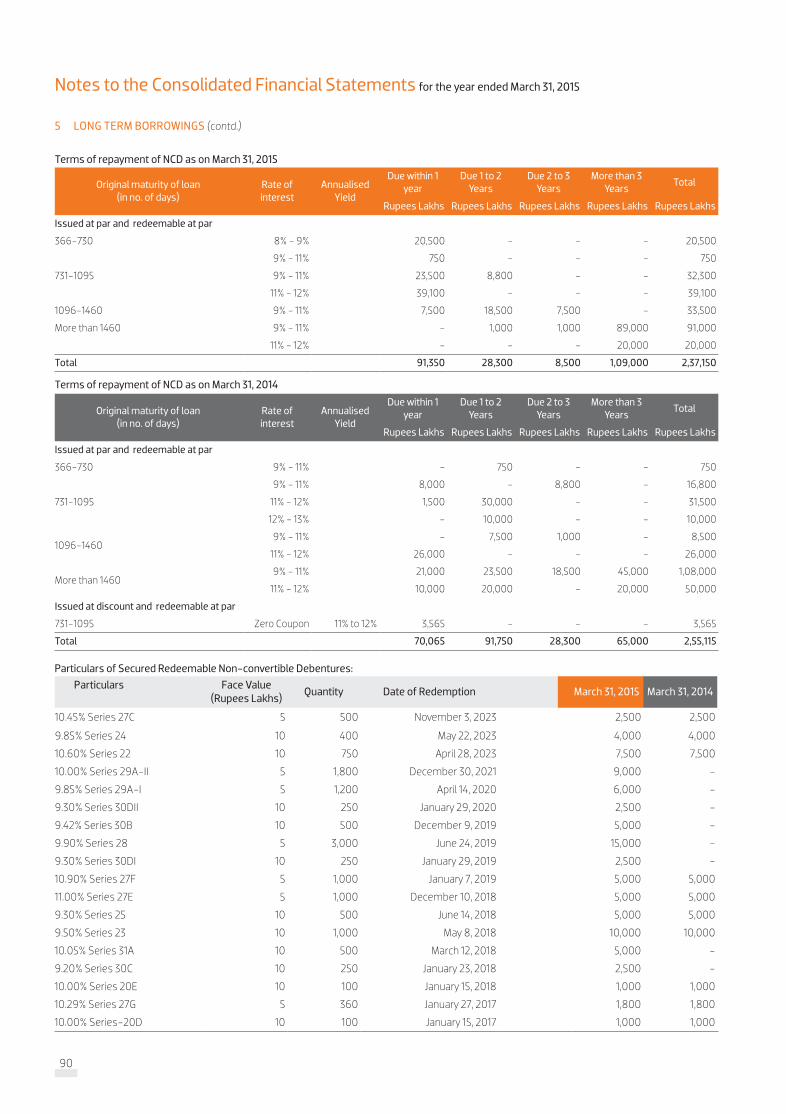
90
Original maturity of loan(in no. of days)
Rate of interest
Annualised Yield
Due within 1 year
Due 1 to 2 Years
Due 2 to 3 Years
More than 3 Years
Total
Rupees Lakhs Rupees Lakhs Rupees Lakhs Rupees Lakhs Rupees Lakhs
Issued at par and redeemable at par
366-730 8% - 9% 20,500 - - - 20,500
9% - 11% 750 - - - 750
731-1095 9% - 11% 23,500 8,800 - - 32,300
11% - 12% 39,100 - - - 39,100
1096-1460 9% - 11% 7,500 18,500 7,500 - 33,500
More than 1460 9% - 11% - 1,000 1,000 89,000 91,000
11% - 12% - - - 20,000 20,000
Total 91,350 28,300 8,500 1,09,000 2,37,150
Terms of repayment of NCD as on March 31, 2015
Particulars Face Value (Rupees Lakhs)
Quantity Date of Redemption March 31, 2015 March 31, 2014
10.45% Series 27C 5 500 November 3, 2023 2,500 2,500
9.85% Series 24 10 400 May 22, 2023 4,000 4,000
10.60% Series 22 10 750 April 28, 2023 7,500 7,500
10.00% Series 29A-II 5 1,800 December 30, 2021 9,000 -
9.85% Series 29A-I 5 1,200 April 14, 2020 6,000 -
9.30% Series 30DII 10 250 January 29, 2020 2,500 -
9.42% Series 30B 10 500 December 9, 2019 5,000 -
9.90% Series 28 5 3,000 June 24, 2019 15,000 -
9.30% Series 30DI 10 250 January 29, 2019 2,500 -
10.90% Series 27F 5 1,000 January 7, 2019 5,000 5,000
11.00% Series 27E 5 1,000 December 10, 2018 5,000 5,000
9.30% Series 25 10 500 June 14, 2018 5,000 5,000
9.50% Series 23 10 1,000 May 8, 2018 10,000 10,000
10.05% Series 31A 10 500 March 12, 2018 5,000 -
9.20% Series 30C 10 250 January 23, 2018 2,500 -
10.00% Series 20E 10 100 January 15, 2018 1,000 1,000
10.29% Series 27G 5 360 January 27, 2017 1,800 1,800
10.00% Series-20D 10 100 January 15, 2017 1,000 1,000
Particulars of Secured Redeemable Non-convertible Debentures:
Original maturity of loan(in no. of days)
Rate of interest
Annualised Yield
Due within 1 year
Due 1 to 2 Years
Due 2 to 3 Years
More than 3 Years
Total
Rupees Lakhs Rupees Lakhs Rupees Lakhs Rupees Lakhs Rupees Lakhs
Issued at par and redeemable at par
366-730 9% - 11% - 750 - - 750
731-1095
9% - 11% 8,000 - 8,800 - 16,800
11% - 12% 1,500 30,000 - - 31,500
12% - 13% - 10,000 - - 10,000
1096-14609% - 11% - 7,500 1,000 - 8,500
11% - 12% 26,000 - - - 26,000
More than 14609% - 11% 21,000 23,500 18,500 45,000 1,08,000
11% - 12% 10,000 20,000 - 20,000 50,000
Issued at discount and redeemable at par
731-1095 Zero Coupon 11% to 12% 3,565 - - - 3,565
Total 70,065 91,750 28,300 65,000 2,55,115
Terms of repayment of NCD as on March 31, 2014
Notes to the Consolidated Financial Statements for the year ended March 31, 2015
5 LONG TERM BORROWINGS (contd.)
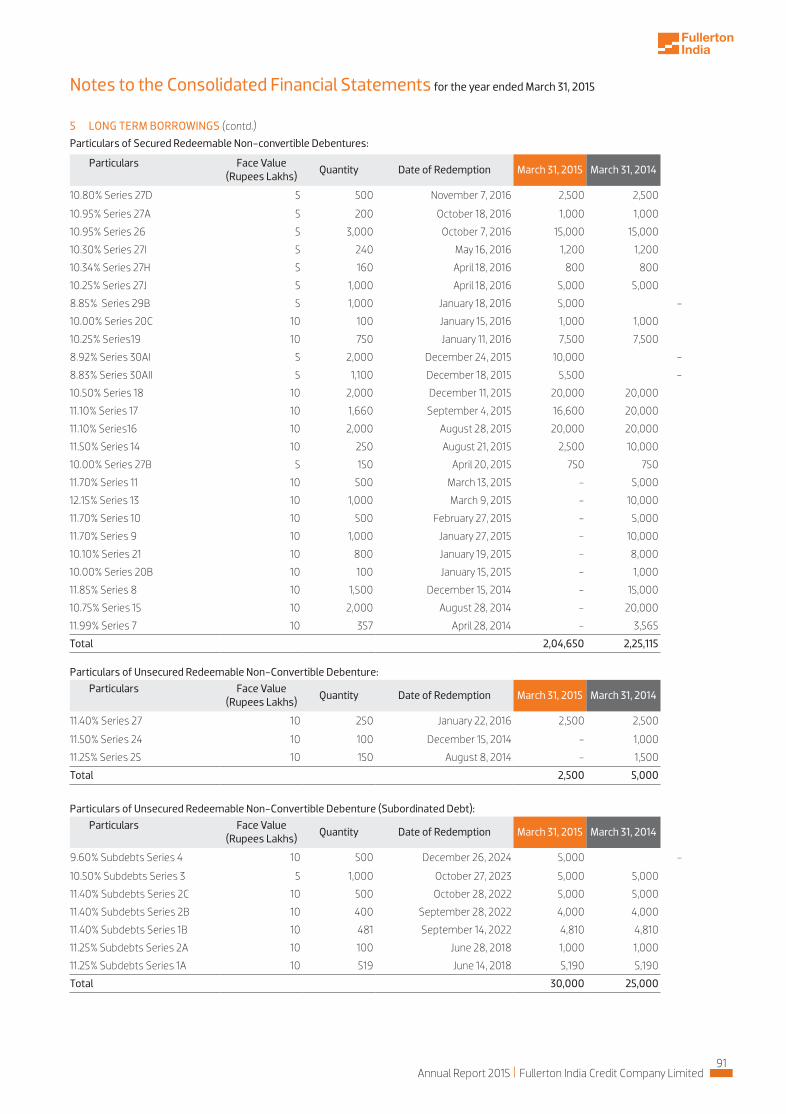
91Annual Report 2015 Fullerton India Credit Company Limited
Notes to the Consolidated Financial Statements for the year ended March 31, 2015
Particulars of Secured Redeemable Non-convertible Debentures:
Particulars Face Value (Rupees Lakhs)
Quantity Date of Redemption March 31, 2015 March 31, 2014
10.80% Series 27D 5 500 November 7, 2016 2,500 2,500
10.95% Series 27A 5 200 October 18, 2016 1,000 1,000
10.95% Series 26 5 3,000 October 7, 2016 15,000 15,000
10.30% Series 27I 5 240 May 16, 2016 1,200 1,200
10.34% Series 27H 5 160 April 18, 2016 800 800
10.25% Series 27J 5 1,000 April 18, 2016 5,000 5,000
8.85% Series 29B 5 1,000 January 18, 2016 5,000 -
10.00% Series 20C 10 100 January 15, 2016 1,000 1,000
10.25% Series19 10 750 January 11, 2016 7,500 7,500
8.92% Series 30AI 5 2,000 December 24, 2015 10,000 -
8.83% Series 30AII 5 1,100 December 18, 2015 5,500 -
10.50% Series 18 10 2,000 December 11, 2015 20,000 20,000
11.10% Series 17 10 1,660 September 4, 2015 16,600 20,000
11.10% Series16 10 2,000 August 28, 2015 20,000 20,000
11.50% Series 14 10 250 August 21, 2015 2,500 10,000
10.00% Series 27B 5 150 April 20, 2015 750 750
11.70% Series 11 10 500 March 13, 2015 000,5 -
12.15% Series 13 10 1,000 March 9, 2015 000,01 -
11.70% Series 10 10 500 February 27, 2015 000,5 -
11.70% Series 9 10 1,000 January 27, 2015 000,01 -
10.10% Series 21 10 800 January 19, 2015 000,8 -
10.00% Series 20B 10 100 January 15, 2015 000,1 -
11.85% Series 8 10 1,500 December 15, 2014 000,51 -
10.75% Series 15 10 2,000 August 28, 2014 000,02 -
11.99% Series 7 10 357 April 28, 2014 565,3 -
Total 2,04,650 2,25,115
Particulars Face Value (Rupees Lakhs)
Quantity Date of Redemption March 31, 2015 March 31, 2014
11.40% Series 27 10 250 January 22, 2016 2,500 2,500
11.50% Series 24 10 100 December 15, 2014 000,1 -
11.25% Series 25 10 150 August 8, 2014 005,1 -
Total 2,500 5,000
Particulars of Unsecured Redeemable Non-Convertible Debenture:
Particulars Face Value (Rupees Lakhs)
Quantity Date of Redemption March 31, 2015 March 31, 2014
9.60% Subdebts Series 4 10 500 December 26, 2024 5,000 -
10.50% Subdebts Series 3 5 1,000 October 27, 2023 5,000 5,000
11.40% Subdebts Series 2C 10 500 October 28, 2022 5,000 5,000
11.40% Subdebts Series 2B 10 400 September 28, 2022 4,000 4,000
11.40% Subdebts Series 1B 10 481 September 14, 2022 4,810 4,810
11.25% Subdebts Series 2A 10 100 June 28, 2018 1,000 1,000
11.25% Subdebts Series 1A 10 519 June 14, 2018 5,190 5,190
Total 30,000 25,000
Particulars of Unsecured Redeemable Non-Convertible Debenture (Subordinated Debt):
5 LONG TERM BORROWINGS (contd.)

92
Particulars March 31, 2015 March 31, 2014
Rupees Lakhs Rupees Lakhs
Interest accrued but not due on debentures 497 73
Employee benefits payable 753 545
Unamortised income
Unamortised loan processing fees 5,015 2,660
Unamortised income on asset assignment - 14
Others 2 2
Others 248 214
Total 6,515 3,508
Long Term Short Term
Particulars March 31, 2015 March 31, 2014 March 31, 2015 March 31, 2014
Rupees Lakhs Rupees Lakhs Rupees Lakhs Rupees Lakhs
Provision for employee benefits
Provision for gratuity (refer note 32) - - 170 271
Provision for superannuation - - 46 31
Provision for leave benefits - - 34 -
Other provisions
Provision for standard assets (refer note 2.2 (b)) 3,477 2,413 1,687 1,336
Provision for sub-standard assets (refer note 2.2 (c)) 4,494 2,250 - -
Provision for assigned loans - 251 - 632
Provision for security deposits 86 86 - -
Total 8,057 5,000 1,937 2,270
Particulars March 31, 2015 March 31, 2014
Rupees Lakhs Rupees Lakhs
Loan repayable on demand
Cash credit from banks (secured)* - 10,451
Cash credit from banks (unsecured) 5 -
Other loans and advances
Indian rupee loan from banks (secured)* 1,500 -
Commercial paper (unsecured) 88,910 72,749
Total 90,415 83,200
Secured borrowings 1,500 10,451
Unsecured borrowings 88,915 72,749
Total 90,415 83,200
*Cash Credit from banks and Indian rupee loan from bank is secured by first pari passu charge over all loan receivables
Notes to the Consolidated Financial Statements for the year ended March 31, 2015
6 OTHER LONG TERM LIABILITIES
7 PROVISIONS
8 SHORT TERM BORROWINGS

93Annual Report 2015 Fullerton India Credit Company Limited
Notes to the Consolidated Financial Statements for the year ended March 31, 2015
Particulars March 31, 2015 March 31, 2014Rupees Lakhs Rupees Lakhs
Other liabilities Current maturities of long term borrowings (refer note 5) 1,92,579 1,29,264 Expenses and other payable 7,052 5,350 (refer note 33 for details of dues to Micro Small and Medium Enterprises) Employee benefits payable 4,839 4,066 Bank balances (Book overdraft) 32,413 9,910 Interest accrued but not due
On debentures 11,461 13,553 On bank loans 359 447 On others 1 8
Undisputed statutory dues 897 717 Payable towards asset assignment 335 1,295 Others 5,542 4,616 Unamortised income
Unamortised loan processing fees 5,558 2,764 Unamortised income on asset assignment - 35 Others 31 46
Total 2,61,067 1,72,071
Particulars (Rupees Lakhs)
Office Equipments**
Furniture & Fixtures**
Computers & Accessories
Leasehold Improvements
Vehicles Land &
Building* Leased assets
Total
Cost At April 1, 2013 2,368 2,466 4,171 3,232 65 6 - 12,307 Addition 389 180 384 319 - - 96 1,369 Disposals 79 262 270 159 - - - 770 At March 31, 2014 2,678 2,384 4,285 3,392 65 6 96 12,906 Addition 518 232 647 95 65 - 28 1,585 Disposals 431 131 588 219 42 - - 1,411 At March 31, 2015 2,765 2,485 4,344 3,268 88 6 125 13,080 Depreciation At April 1, 2013 1,878 1,965 3,641 2,666 27 - - 10,177 Charge for the year 292 250 298 251 37 - 13 1,142 Disposals 74 253 270 155 - - - 753 At March 31, 2014 2,096 1,962 3,669 2,762 65 - 13 10,567 Charge for the year 368 277 443 323 4 - 29 1,445 Disposals 430 124 588 216 42 - - 1,401 At March 31, 2015 2,034 2,115 3,524 2,868 27 - 42 10,611 Impairment At April 1, 2013 8 14 3 13 - - - 38 Additions - - - - - - - - Charge for the year - - - - - - - - At March 31, 2014 8 14 3 13 - - - 38 Additions - - - - - - - - Charge for the year - - - - - - - - At March 31, 2015 8 14 3 13 - - - 38 Net Block - - - - - - - - At March 31, 2014 574 408 614 616 - 6 83 2,302 At March 31, 2015 723 356 818 386 61 6 83 2,432
All assets have been recognised at cost Capital Work in Progress - - - - - - - - At March 31, 2014 49 - 162 0 - - - 212 At March 31, 2015 38 1 197 2 - - - 237
* Mortgaged as security against Secured Non-Convertible debentures ** Refer note 2.2 (a)
9 OTHER CURRENT LIABILITIES
10 TANGIBLE ASSETS

94
Particulars Computer Software
Total
Rupees Lakhs Rupees Lakhs Gross block At April 1, 2013 5,616 5,616 Additions 491 491 Disposals 13 13 At March 31, 2014 6,094 6,094 Additions 384 384 Disposals 319 319 At March 31, 2015 6,159 6,159 Depreciation At April 1, 2013 3,485 3,485 Charge for the year 976 976 Deductions - - At March 31, 2014 4,461 4,461 Charge for the year 864 864 Deductions 263 263 At March 31, 2015 5,062 5,062 Net block At March 31, 2014 1,633 1,633 At March 31, 2015 1,096 1,096 Capital Work in Progress - - At March 31, 2014 283 283 At March 31, 2015 890 890
Notes to the Consolidated Financial Statements for the year ended March 31, 2015
Particulars March 31, 2015 March 31, 2014
Rupees Lakhs Rupees Lakhs
Non Trade Investments (valued at cost unless stated otherwise)
Investment in equity instruments (unquoted)
a ) Others
50,000 (March 31, 2014: 50,000) equity shares of Rs. 10 each fully paid-up in Alpha Micro Finance Consultants Private Limited
5 5
(A) 5 5
Less: Provision for diminution in value (B) - -
Net Value {(A)-(B)} 5 5
Aggregate amount of unquoted investments 5 5
11 INTANGIBLE ASSETS
12 NON-CURRENT INVESTMENTS

95Annual Report 2015 Fullerton India Credit Company Limited
Notes to the Consolidated Financial Statements for the year ended March 31, 2015
Non-current Current
Particulars March 31, 2015 March 31, 2014 March 31, 2015 March 31, 2014
Rupees Lakhs Rupees Lakhs Rupees Lakhs Rupees Lakhs
A Portfolio loans
a. Secured, considered good*
Loans 3,28,881 1,95,652 45,023 41,870
b. Secured, considered doubtful**
Loans 12,722 7,039 - -
c. Unsecured, considered good*
Loans 2,39,584 1,90,406 2,30,803 1,71,880
d. Unsecured, considered doubtful**
Loans 3,963 3,452 - -
Sub-Total 5,85,150 3,96,549 2,75,826 2,13,750
B Security deposits
Unsecured, considered good 1,407 1,339 38 53
Unsecured, considered doubtful 86 86 - -
Sub-Total 1,493 1,425 38 53
C Advances recoverable in cash or in kind or for value to be received
Unsecured, considered good 440 1,158 - -
Sub-Total 440 1,158 - -
D Other loans and advances
Retained interest receivable on asset assignment - 34 - 85
Advance Income Tax (net of provision for tax ) 369 906 - -
MAT credit entitlement 14,136 7,371 - -
Prepaid expenses 34 77 638 686
Loans and advances to employees 6 11 9 7
Others 6 5 759 824
Sub-Total 14,551 8,404 1,406 1,602
E Capital advances
Unsecured, considered good 158 233 - -
Sub-Total 158 233 - -
Total (A+B+C+D+E) 6,01,792 4,07,769 2,77,270 2,15,405
13 LOANS AND ADVANCES
Non-current Current
Particulars March 31, 2015 March 31, 2014 March 31, 2015 March 31, 2014Rupees Lakhs Rupees Lakhs Rupees Lakhs Rupees Lakhs
Non Current bank balances (refer note 17) - 1,085 - - Unamortised ancillary cost of borrowings 1,726 1,988 1,346 1,178 Unamortised loan origination cost 4,514 2,057 2,952 1,602 Interest accrued and due On secured loans - - 324 292 On unsecured loans - - 600 649 Interest Accrued but not due On deposits placed with banks - 125 1,406 438 On government securities - - 8 - On debentures and bonds - - 105 - On secured loans - - 3,599 2,569 On unsecured loans - - 7,674 6,317 Other Assets 1 1 2 2 Total 6,241 5,256 18,016 13,047
14 OTHER ASSETS
* Represents standard assets in accordance with Company’s asset classification policy (refer note 2.1 (g))** Represents non-performing assets in accordance with Company’s asset classification policy (refer note 2.1 (g))
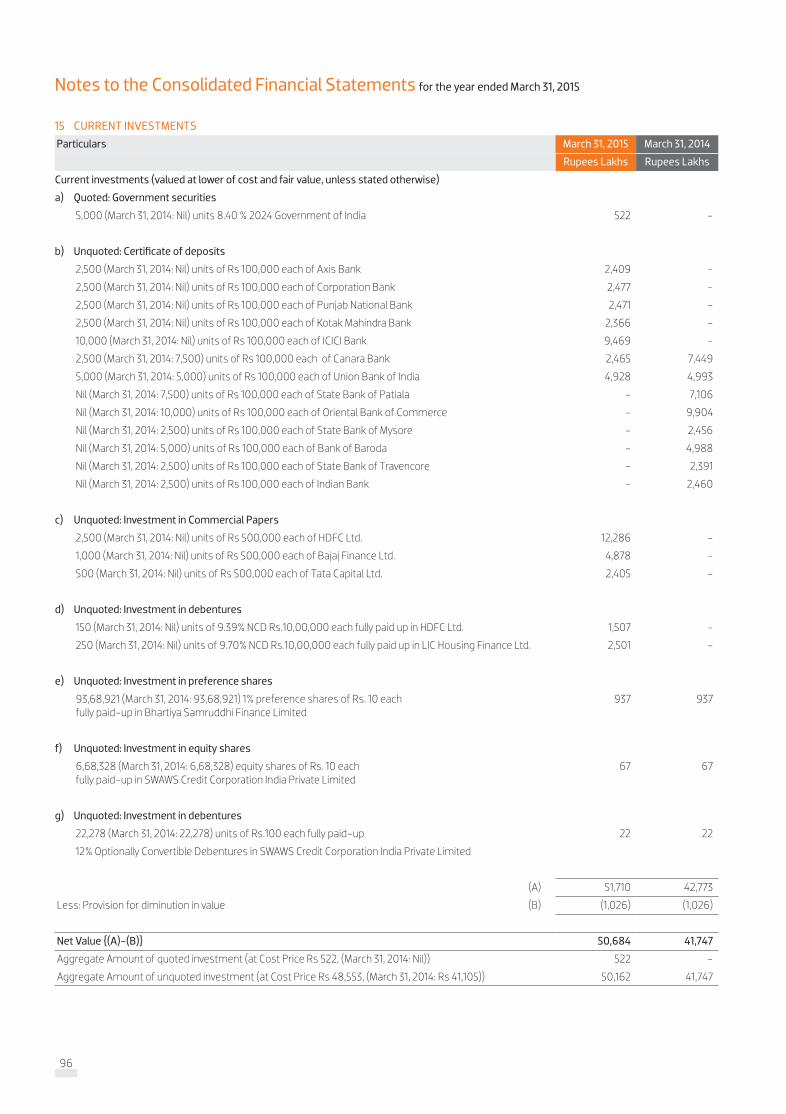
96
Particulars March 31, 2015 March 31, 2014
Rupees Lakhs Rupees Lakhs
Current investments (valued at lower of cost and fair value, unless stated otherwise)
a) Quoted: Government securities
5,000 (March 31, 2014: Nil) units 8.40 % 2024 Government of India 522 -
b) Unquoted: Certificate of deposits
2,500 (March 31, 2014: Nil) units of Rs 100,000 each of Axis Bank 2,409 -
2,500 (March 31, 2014: Nil) units of Rs 100,000 each of Corporation Bank 2,477 -
2,500 (March 31, 2014: Nil) units of Rs 100,000 each of Punjab National Bank 2,471 -
2,500 (March 31, 2014: Nil) units of Rs 100,000 each of Kotak Mahindra Bank 2,366 -
10,000 (March 31, 2014: Nil) units of Rs 100,000 each of ICICI Bank 9,469 -
2,500 (March 31, 2014: 7,500) units of Rs 100,000 each of Canara Bank 2,465 7,449
5,000 (March 31, 2014: 5,000) units of Rs 100,000 each of Union Bank of India 4,928 4,993
Nil (March 31, 2014: 7,500) units of Rs 100,000 each of State Bank of Patiala - 7,106
Nil (March 31, 2014: 10,000) units of Rs 100,000 each of Oriental Bank of Commerce - 9,904
Nil (March 31, 2014: 2,500) units of Rs 100,000 each of State Bank of Mysore - 2,456
Nil (March 31, 2014: 5,000) units of Rs 100,000 each of Bank of Baroda - 4,988
Nil (March 31, 2014: 2,500) units of Rs 100,000 each of State Bank of Travencore - 2,391
Nil (March 31, 2014: 2,500) units of Rs 100,000 each of Indian Bank - 2,460
c) Unquoted: Investment in Commercial Papers
2,500 (March 31, 2014: Nil) units of Rs 500,000 each of HDFC Ltd. 12,286 -
1,000 (March 31, 2014: Nil) units of Rs 500,000 each of Bajaj Finance Ltd. 4,878 -
500 (March 31, 2014: Nil) units of Rs 500,000 each of Tata Capital Ltd. 2,405 -
d) Unquoted: Investment in debentures
150 (March 31, 2014: Nil) units of 9.39% NCD Rs.10,00,000 each fully paid up in HDFC Ltd. 1,507 -
250 (March 31, 2014: Nil) units of 9.70% NCD Rs.10,00,000 each fully paid up in LIC Housing Finance Ltd. 2,501 -
e) Unquoted: Investment in preference shares
93,68,921 (March 31, 2014: 93,68,921) 1% preference shares of Rs. 10 each fully paid-up in Bhartiya Samruddhi Finance Limited
937 937
f) Unquoted: Investment in equity shares
6,68,328 (March 31, 2014: 6,68,328) equity shares of Rs. 10 each fully paid-up in SWAWS Credit Corporation India Private Limited
67 67
g) Unquoted: Investment in debentures
22,278 (March 31, 2014: 22,278) units of Rs.100 each fully paid-up 22 22
12% Optionally Convertible Debentures in SWAWS Credit Corporation India Private Limited
(A) 51,710 42,773
Less: Provision for diminution in value (B) (1,026) (1,026)
Net Value {(A)-(B)} 50,684 41,747
Aggregate Amount of quoted investment (at Cost Price Rs 522, (March 31, 2014: Nil)) 522 -
Aggregate Amount of unquoted investment (at Cost Price Rs 48,553, (March 31, 2014: Rs 41,105)) 50,162 41,747
Notes to the Consolidated Financial Statements for the year ended March 31, 2015
15 CURRENT INVESTMENTS

97Annual Report 2015 Fullerton India Credit Company Limited
Notes to the Consolidated Financial Statements for the year ended March 31, 2015
Non-current Current
Particulars March 31, 2015 March 31, 2014 March 31, 2015 March 31, 2014Rupees Lakhs Rupees Lakhs Rupees Lakhs Rupees Lakhs
Other receivable Unsecured, considered good - - 254 267 Total - - 254 267
16 TRADE RECEIVABLE
Non-current Current
Particulars March 31, 2015 March 31, 2014 March 31, 2015 March 31, 2014Rupees Lakhs Rupees Lakhs Rupees Lakhs Rupees Lakhs
Cash and cash equivalents: Cash on hand - - 1,151 819 Balances with Banks - On Current accounts - - 7,783 12,673 - Deposits with original maturity of less than 3 months* - - - 19,615 (A) - - 8,934 33,107 Other bank balances - Deposits with original maturity for more than 12 months* - 1,085 20,400 5,588 - Deposits with original maturity for more than 3 months* - - 25,735 224 but less than 12 months (B) - 1,085 46,134 5,812 Less: amount disclosed under non current assets (refer note14) - (1,085) - - Total {(A)+(B)} - - 55,069 38,919
* Rs. Nil lakhs (March 31, 2014 : Rs. 6,188 lakhs) Pledged against working capital limit sanctioned by banks and pledged as cash collateral in connection with asset assignment.
17 CASH AND BANK BALANCES
ParticularsYear ended
March 31, 2015Year ended
March 31, 2014Rupees Lakhs Rupees Lakhs
Interest income on loans 1,50,527 1,20,694 Income from asset assignment 140 463 Interest on bank deposits 3,042 834 Interest on investments 3,500 2,753 Other operating revenue Processing charges 6,822 2,669 Ancillary income from operations 3,832 5,460 Total 1,67,863 1,32,873
18 REVENUE FROM OPERATIONS
ParticularsYear ended
March 31, 2015Year ended
March 31, 2014Rupees Lakhs Rupees Lakhs
Profit on sale of investments 1,941 4,488 Miscellaneous income 2,259 1,419 Total 4,200 5,908
19 OTHER INCOME

98
ParticularsYear ended
March 31, 2015Year ended
March 31, 2014Rupees Lakhs Rupees Lakhs
Salaries, bonus and allowances 27,290 23,218 Contribution to provident and other funds 978 887 Gratuity expenses (refer note 32) 333 451 Staff welfare expenses 955 924 Total 29,556 25,480
ParticularsYear ended
March 31, 2015Year ended
March 31, 2014Rupees Lakhs Rupees Lakhs
Printing and stationery 844 735 Rent 2,395 2,422 Rates and taxes 276 308 Insurance 23 12 Business promotion expenses 1,399 293 Commission, Brokerage and Lead Generation 3,249 1,862 Legal charges 164 147 Professional Charges (including collection and credit cost) 9,011 9,734 Courier charges 350 276 Repairs and maintenance Office premises 1,129 1,021 Others 940 755 Directors' sitting fees 14 - Travelling expenses 2,079 1,672 Telecommunication expenses 738 823 Payment to auditors (refer details below) 42 38 Electricity charges 660 667 Security charges 159 127 Recruitment expenses 143 91 Training expenses 283 225 Fees and subscription 22 28 Corporate social responsibility expenses (refer note 35) 94 36 Miscellaneous expenses 708 420 Write off of fixed assets and intangible assets 66 27 Total 24,788 21,719 As auditor: Audit fees 27 23 Tax audit fees 4 4 Limited review 5 3 In other capacity: Other services (certification fees) 4 5 Reimbursement of expenses 1 3
Notes to the Consolidated Financial Statements for the year ended March 31, 2015
20 EMPLOYEE BENEFIT EXPENSES
21 OTHER EXPENSES
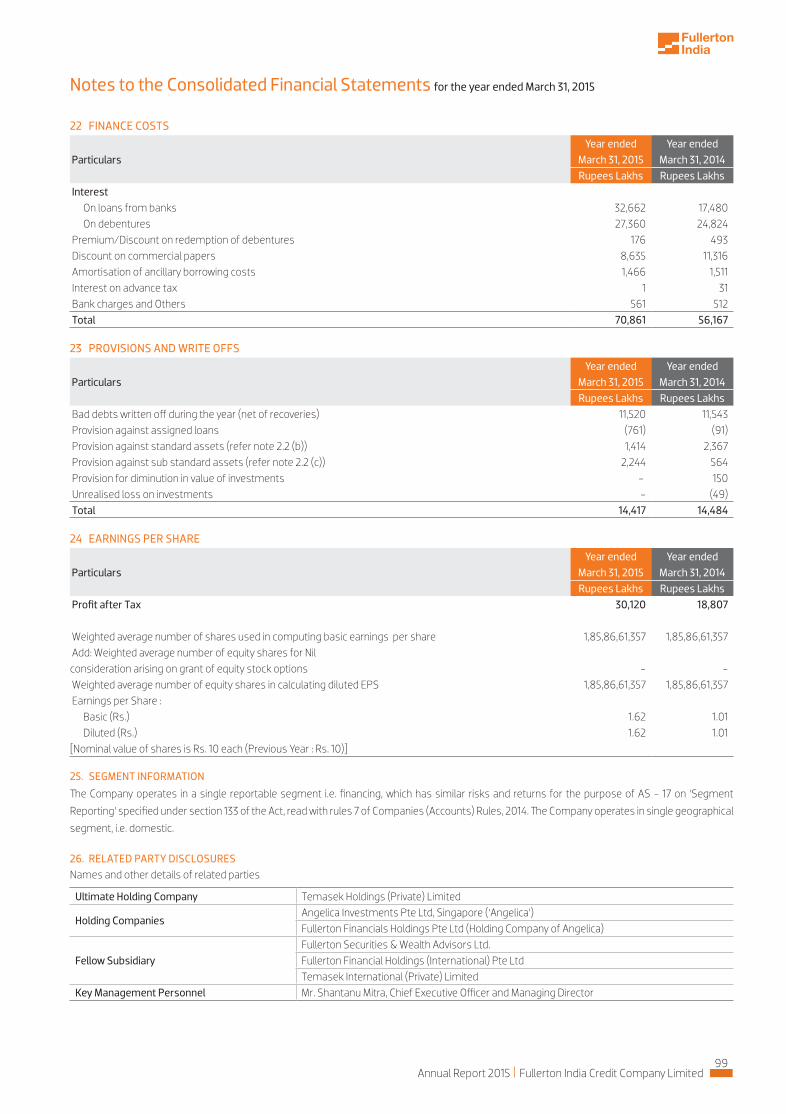
99Annual Report 2015 Fullerton India Credit Company Limited
Notes to the Consolidated Financial Statements for the year ended March 31, 2015
ParticularsYear ended
March 31, 2015Year ended
March 31, 2014Rupees Lakhs Rupees Lakhs
Interest On loans from banks 32,662 17,480 On debentures 27,360 24,824
Premium/Discount on redemption of debentures 176 493 Discount on commercial papers 8,635 11,316 Amortisation of ancillary borrowing costs 1,466 1,511 Interest on advance tax 1 31 Bank charges and Others 561 512 Total 70,861 56,167
ParticularsYear ended
March 31, 2015Year ended
March 31, 2014Rupees Lakhs Rupees Lakhs
Profit after Tax 30,120 18,807 Weighted average number of shares used in computing basic earnings per share 1,85,86,61,357 1,85,86,61,357 Add: Weighted average number of equity shares for Nil consideration arising on grant of equity stock options - - Weighted average number of equity shares in calculating diluted EPS 1,85,86,61,357 1,85,86,61,357 Earnings per Share :
Basic (Rs.) 1.62 1.01 Diluted (Rs.) 1.62 1.01
[Nominal value of shares is Rs. 10 each (Previous Year : Rs. 10)]
25. SEGMENT INFORMATION
segment, i.e. domestic.
22 FINANCE COSTS
ParticularsYear ended
March 31, 2015Year ended
March 31, 2014Rupees Lakhs Rupees Lakhs
Bad debts written off during the year (net of recoveries) 11,520 11,543 Provision against assigned loans (761) (91) Provision against standard assets (refer note 2.2 (b)) 1,414 2,367 Provision against sub standard assets (refer note 2.2 (c)) 2,244 564 Provision for diminution in value of investments - 150 Unrealised loss on investments - (49) Total 14,417 14,484
23 PROVISIONS AND WRITE OFFS
24 EARNINGS PER SHARE
26. RELATED PARTY DISCLOSURESNames and other details of related parties
Ultimate Holding Company Temasek Holdings (Private) Limited
Holding CompaniesAngelica Investments Pte Ltd, Singapore (‘Angelica’)Fullerton Financials Holdings Pte Ltd (Holding Company of Angelica)
Fellow SubsidiaryFullerton Securities & Wealth Advisors Ltd.Fullerton Financial Holdings (International) Pte LtdTemasek International (Private) LimitedMr. Shantanu Mitra, Chief Executive Officer and Managing DirectorKey Management Personnel

100
Notes to the Consolidated Financial Statements for the year ended March 31, 2015
26. RELATED PARTY DISCLOSURES (contd.)
27. LEASESa) Where the Company is the lessee:
b) Where the Company is the lessor:
market conditions.
Transactions during the year Holding Companies
Key Management Personnel
Fellow Subsidiary Total
March 31, 2015
March 31, 2014
March 31, 2015
March 31, 2014
March 31, 2015
March 31, 2014
March 31, 2015
March 31, 2014
Reimbursement for expenses incurred on behalf of the Company 3 - - - 35 12 38 12
Expenses incurred by the Company on behalf of others - - - - 1 - 1 4
Salary & employee benefits
Mr. Shantanu Mitra - - 720 643 - - 720 643
(Rupees Lakhs)
ParticularsFor the year ended
March 31, 2015For the year ended
March 31, 2014Rupees Lakhs Rupees Lakhs
Operating lease payments recognised during the year 2,756 2,728Minimum Lease Obligations Not later than one year 2,374 2,620 Later than one year but not later than five years 2,327 3,697 Later than five years 533 473
Particulars
For the year ended March 31, 2015
For the year ended March 31, 2014
Rupees Lakhs Rupees Lakhs
Operating lease rental recognised during the year 31 10
Minimum Lease Obligations
Not later than one year 32 21
Later than one year but not later than five years 53 74
Later than five years - -
28. CASH AND CASH EQUIVALENTS FOR THE PURPOSE OF CASH FLOW STATEMENT
ParticularsMarch 31, 2015 March 31, 2014
Rupees Lakhs Rupees Lakhs
Cash and Bank Balance (refer note 17 ) 55,069 38,919
Less: Other bank balances (refer note 17) (46,134) (5,812)
Balance considered as Cash and Cash Equivalents for Cash Flow Statement 8,934 33,107
Description of the LiabilityMarch 31, 2015 March 31, 2014
Rupees Lakhs Rupees Lakhs
Credit enhancement provided by the Company for the loans under assignment arrangements (including cash collaterals and interest subordination)
- 4,982
Contingent liability for litigations pending against the Company 20 22
29. CONTINGENT LIABILITY AND COMMITMENTS
a) Contingent liabilities:
Notes to the Consolidated Financial Statements for the year ended March 31, 2015
26. RELATED PARTY DISCLOSURES (contd.)
27. LEASESa) Where the Company is the lessee:
b) Where the Company is the lessor:
market conditions.
Transactions during the year Holding Companies
Key Management Personnel
Fellow Subsidiary Total
March 31, 2015
March 31, 2014
March 31, 2015
March 31, 2014
March 31, 2015
March 31, 2014
March 31, 2015
March 31, 2014
Reimbursement for expenses incurred on behalf of the Company 3 - - - 35 12 38.00 12
Expenses incurred by the Company on behalf of others - - - - 1 - 1 4
Salary & employee benefits
Mr. Shantanu Mitra - - 720 643 - - 720 643
(Rupees Lakhs)
ParticularsFor the year ended
March 31, 2015For the year ended
March 31, 2014Rupees Lakhs Rupees Lakhs
Operating lease payments recognized during the year 2,756 2,728Minimum Lease Obligations Not later than one year 2,374 2,620 Later than one year but not later than five years 2,327 3,697 Later than five years 533 473
Particulars
For the year ended March 31, 2015
For the year ended March 31, 2014
Rupees Lakhs Rupees Lakhs
Operating lease rental recognized during the year 31 10
Minimum Lease Obligations
Not later than one year 32 21
Later than one year but not later than five years 53 74
Later than five years - -
28. CASH AND CASH EQUIVALENTS FOR THE PURPOSE OF CASH FLOW STATEMENT
ParticularsMarch 31, 2015 March 31, 2014
Rupees Lakhs Rupees Lakhs
Cash and Bank Balance (refer note 17 ) 55,069 38,919
Less: Other bank balances (refer note 17) (46,134) (5,812)
Balance considered as Cash and Cash Equivalents for Cash Flow Statement 8,934 33,107
ParticularsMarch 31, 2015 March 31, 2014
Rupees Lakhs Rupees Lakhs
Credit enhancement provided by the Company for the loans under assignment arrangements (including cash collaterals and interest subordination)
- 4,982
Contingent liability for litigations pending against the Company 20 22
29. CONTINGENT LIABILITY AND COMMITMENTS
a) Contingent liabilities:
116117
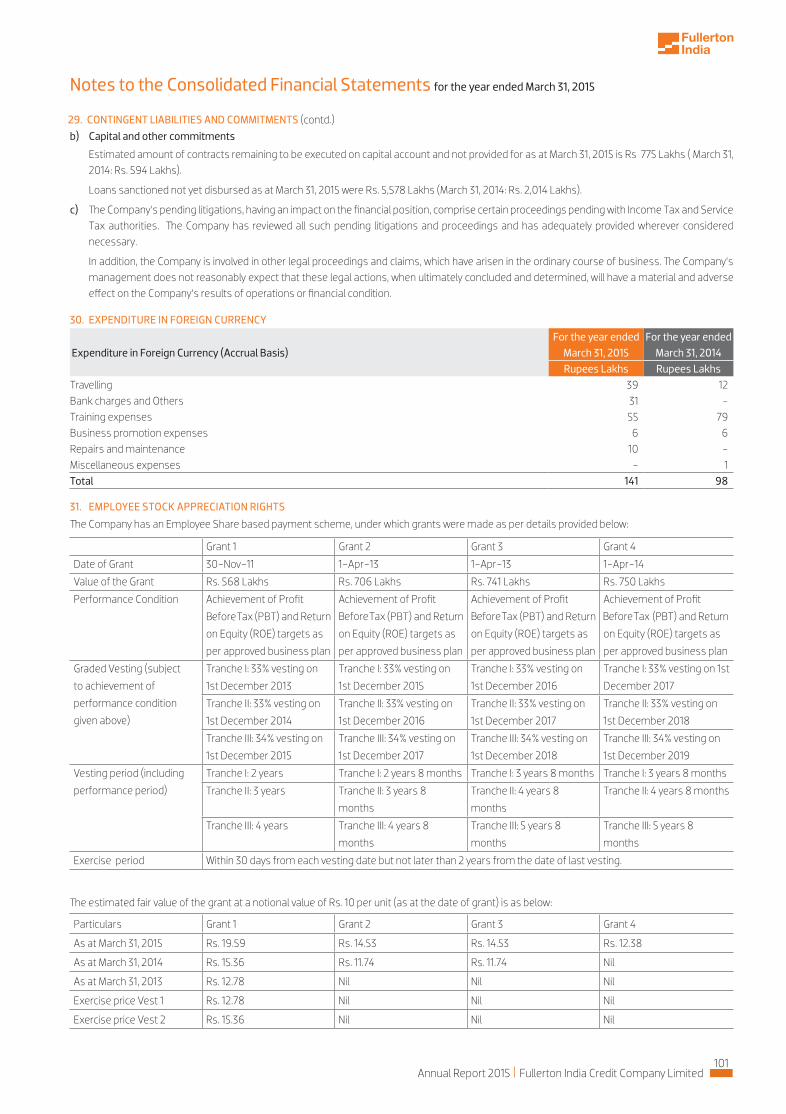
101Annual Report 2015 Fullerton India Credit Company Limited
Notes to the Consolidated Financial Statements
29. CONTINGENT LIABILITIES AND COMMITMENTS (contd.) b) Capital and other commitments Estimated amount of contracts remaining to be executed on capital account and not provided for as at March 31, 2015 is Rs 775 Lakhs ( March 31,
2014: Rs. 594 Lakhs).
Loans sanctioned not yet disbursed as at March 31, 2015 were Rs. 5,578 Lakhs (March 31, 2014: Rs. 2,014 Lakhs).
c)
necessary.
management does not reasonably expect that these legal actions, when ultimately concluded and determined, will have a material and adverse effect on the Company’s results of operations or financial condition.
30. EXPENDITURE IN FOREIGN CURRENCY
Expenditure in Foreign Currency (Accrual Basis)
TravellingBank charges and OthersTraining expensesBusiness promotion expensesRepairs and maintenanceMiscellaneous expensesTotal
31. EMPLOYEE STOCK APPRECIATION RIGHTS
Grant 1 Grant 2
Date of Grant 30-Nov-11 1-Apr-13
Value of the Grant Rs. 568 Lakhs Rs. 706 Lakhs
Performance Condition Achievement of Profit
before tax (PBT) and Return
on Equity (ROE) targets as
per approved business plan
Achievement of Profit
before tax (PBT) and Return
on Equity (ROE) targets as
per approved business plan
Graded Vesting (subject
to achievement of
performance condition
given above)
Tranche I: 33% vesting on
1st December 2013
Tranche I: 33% vesting on
1st December 2015
Tranche II: 33% vesting on
1st December 2014
Tranche II: 33% vesting on
1st December 2016
Tranche III: 34% vesting on
1st December 2015
Tranche III: 34% vesting on
1st December 2017
Vesting period (including
performance period)
Tranche I: 2 years Tranche I: 2 years 8 months
Tranche II: 3 years Tranche II: 3 years 8
months
Tranche III: 4 years Tranche III: 4 years 8
months
Exercise period Within 30 days from each vesting date but not later than 2 years from the date of last vesting.
Particulars Grant 1 Grant 2
As at March 31, 2015 Rs. 19.59 Rs. 14.53
As at March 31, 2014 Rs. 15.36 Rs. 11.74
As at March 31, 2013 Rs. 12.78 Nil
Exercise price Vest 1 Rs. 12.78 Nil
Exercise price Vest 2 Rs. 15.36 Nil
Notes to the Consolidated Financial Statements for the year ended March 31, 2015
b)
Capital and other commitments
Estimated amount of contracts remaining to be executed on capital account and not provided for as at March 31, 2015 is Rs 775 Lakhs ( March 31, 2014: Rs. 594 Lakhs).
Loans sanctioned not yet disbursed as at March 31, 2015 were Rs. 5,578 Lakhs (March 31, 2014: Rs. 2,014 Lakhs).
c)
necessary.
management does not reasonably expect that these legal actions, when ultimately concluded and determined, will have a material and adverse effect on the Company’s results of operations or financial condition.
30. EXPENDITURE IN FOREIGN CURRENCY
Expenditure in Foreign Currency (Accrual Basis)For the year ended
March 31, 2015For the year ended
March 31, 2014Rupees Lakhs Rupees Lakhs
Travelling 39 12 Bank charges and Others 31 - Training expenses 55 79 Business promotion expenses 6 6 Repairs and maintenance 10 - Miscellaneous expenses - 1 Total 141 98
31. EMPLOYEE STOCK APPRECIATION RIGHTS
Grant 1 Grant 2 Grant 3 Grant 4
Date of Grant 30-Nov-11 1-Apr-13 1-Apr-13 1-Apr-14
Value of the Grant Rs. 568 Lakhs Rs. 706 Lakhs Rs. 741 Lakhs Rs. 750 Lakhs
Performance Condition Achievement of Profit
Before Tax (PBT) and Return
on Equity (ROE) targets as
per approved business plan
Achievement of Profit
(PBT) and Return
on Equity (ROE) targets as
per approved business plan
Achievement of Profit
(PBT) and Return
on Equity (ROE) targets as
per approved business plan
Achievement of Profit
(PBT) and Return
on Equity (ROE) targets as
per approved business plan
Graded Vesting (subject
to achievement of
performance condition
given above)
Tranche I: 33% vesting on
1st December 2013
Tranche I: 33% vesting on
1st December 2015
Tranche I: 33% vesting on
1st December 2016
Tranche I: 33% vesting on 1st
December 2017
Tranche II: 33% vesting on
1st December 2014
Tranche II: 33% vesting on
1st December 2016
Tranche II: 33% vesting on
1st December 2017
Tranche II: 33% vesting on
1st December 2018
Tranche III: 34% vesting on
1st December 2015
Tranche III: 34% vesting on
1st December 2017
Tranche III: 34% vesting on
1st December 2018
Tranche III: 34% vesting on
1st December 2019
Vesting period (including
performance period)
Tranche I: 2 years Tranche I: 2 years 8 months Tranche I: 3 years 8 months Tranche I: 3 years 8 months
Tranche II: 3 years Tranche II: 3 years 8
months
Tranche II: 4 years 8
months
Tranche II: 4 years 8 months
Tranche III: 4 years Tranche III: 4 years 8
months
Tranche III: 5 years 8
months
Tranche III: 5 years 8
months
Exercise period Within 30 days from each vesting date but not later than 2 years from the date of last vesting.
Particulars Grant 1 Grant 2 Grant 3 Grant 4
As at March 31, 2015 Rs. 19.59 Rs. 14.53 Rs. 14.53 Rs. 12.38
As at March 31, 2014 Rs. 15.36 Rs. 11.74 Rs. 11.74 Nil
As at March 31, 2013 Rs. 12.78 Nil Nil Nil
Exercise price Vest 1 Rs. 12.78 Nil Nil Nil
Exercise price Vest 2 Rs. 15.36 Nil Nil Nil
Before Tax Before Tax Before Tax

102
31. EMPLOYEE STOCK APPRECIATION RIGHT (contd.)
Notes to the Consolidated Financial Statements for the year ended March 31, 2015
Fair value is computed using the method provided in the scheme for estimating the valuation of the grant which is linked to the Net Book Value of the
business.
Adjustment has been made for the resignations during the year ended March 31, 2015 and the consequential impact of forfeiture of the grant.
32. RETIREMENT AND OTHER EMPLOYEE BENEFITS
salary (last drawn salary) for each completed year of service.
in the balance sheet for the plan.
ParticularsMarch 31, 2015 March 31, 2014
Rupees Lakhs Rupees Lakhs
Grants Outstanding at the beginning of the year 1,420 491
Grant made during the year 750 1,447
Grants forfeited on resignation of employee 209 402
Grants vested 111 128
Grants exercised 97 116
Grants outstanding – unvested 1839 1,409
Grants outstanding – vested and exercisable 26 11
Expenses arising from grants made 686 475
Statement of Profit and Loss Gratuity expense (recognised in Employee benefit expense):
ParticularsMarch 31, 2015 March 31, 2014Rupees Lakhs Rupees Lakhs
Current service cost 117 65Interest cost on benefit obligation 54 21Expected return on plan assets (27) (16)Net actuarial (gain)/loss recognised in the year 189 381Past service cost - -Net Benefit Expense 333 451Actual return on plan assets - -
Changes in the present value of the defined benefit obligation are as follows:
ParticularsMarch 31, 2015 March 31, 2014Rupees Lakhs Rupees Lakhs
Opening defined benefit obligation 581 253Interest cost 54 21Current service cost 117 65Benefits paid (556) (136)Actuarial (gains)/losses on obligation 665 379Closing defined benefit obligation 861 581
Balance SheetDetails of Provision for gratuity:
ParticularsMarch 31, 2015 March 31, 2014Rupees Lakhs Rupees Lakhs
Defined benefit obligation 861 581Fair value of plan assets 691 310Less: Unrecognised Past Service Cost - -Plan asset/(liability) (170) (271)
s
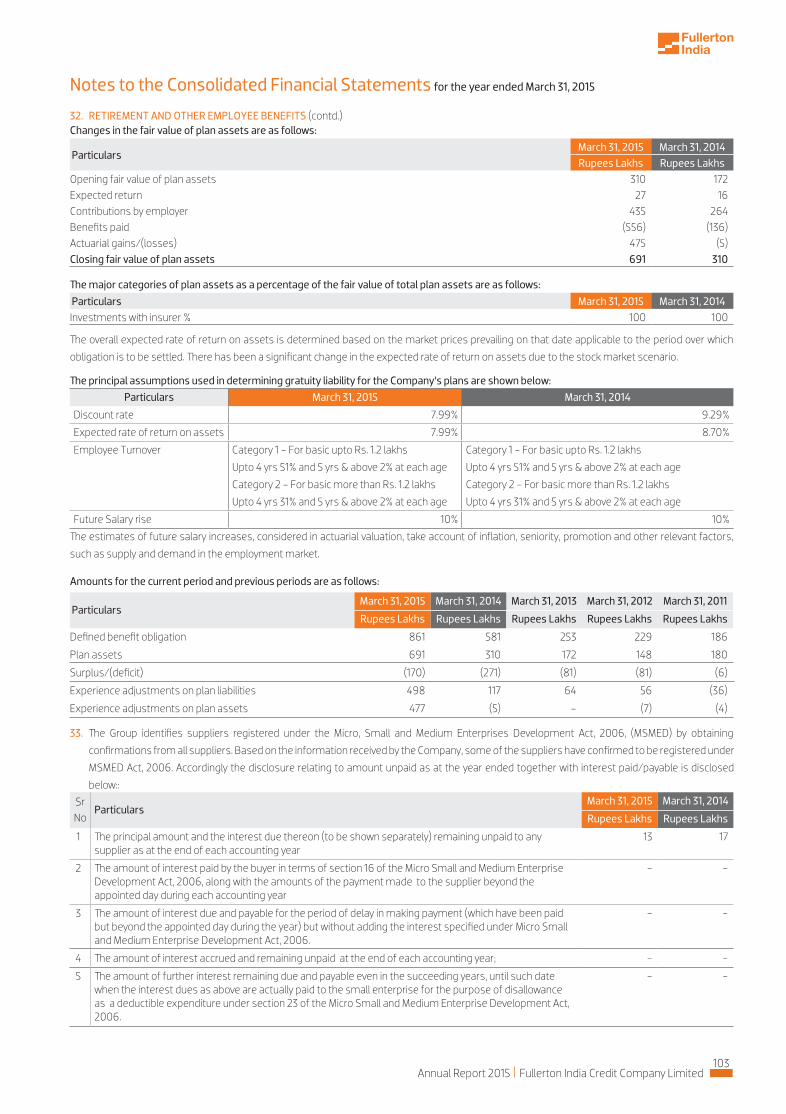
103Annual Report 2015 Fullerton India Credit Company Limited
32. RETIREMENT AND OTHER EMPLOYEE BENEFITS (contd.)
Notes to the Consolidated Financial Statements for the year ended March 31, 2015
Changes in the fair value of plan assets are as follows:
ParticularsMarch 31, 2015 March 31, 2014Rupees Lakhs Rupees Lakhs
Opening fair value of plan assets 310 172Expected return 27 16Contributions by employer 435 264Benefits paid (556) (136)Actuarial gains/(losses) 475 (5)Closing fair value of plan assets 691 310
Particulars March 31, 2015 March 31, 2014Investments with insurer % 100 100
such as supply and demand in the employment market.
Particulars March 31, 2015 March 31, 2014
Discount rate 7.99% 9.29%
Expected rate of return on assets 7.99% 8.70%
Employee Turnover Category 1 - For basic upto Rs. 1.2 lakhs
Upto 4 yrs 51% and 5 yrs & above 2% at each age
Category 2 - For basic more than Rs. 1.2 lakhs
Upto 4 yrs 31% and 5 yrs & above 2% at each age
Category 1 - For basic upto Rs. 1.2 lakhs
Upto 4 yrs 51% and 5 yrs & above 2% at each age
Category 2 - For basic more than Rs. 1.2 lakhs
Upto 4 yrs 31% and 5 yrs & above 2% at each age
Future Salary rise 10% 10%
Amounts for the current period and previous periods are as follows:
33.
confirmations from all suppliers. Based on the information received by the Company, some of the suppliers have confirmed to be registered under
MSMED Act, 2006. Accordingly the disclosure relating to amount unpaid as at the year ended together with interest paid/payable is disclosed
below::
ParticularsMarch 31, 2015 March 31, 2014 March 31, 2013 March 31, 2012 March 31, 2011
Rupees Lakhs Rupees Lakhs Rupees Lakhs Rupees Lakhs Rupees Lakhs
Defined benefit obligation 861 581 253 229 186
Plan assets 691 310 172 148 180
Surplus/(deficit) (170) (271) (81) (81) (6)
Experience adjustments on plan liabilities 498 117 64 56 (36)
Experience adjustments on plan assets 477 (5) - (7) (4)
Sr No
ParticularsMarch 31, 2015 March 31, 2014
Rupees Lakhs Rupees Lakhs
1supplier as at the end of each accounting year
13 17
2Development Act, 2006, along with the amounts of the payment made to the supplier beyond the appointed day during each accounting year
- -
3but beyond the appointed day during the year) but without adding the interest specified under Micro Small and Medium Enterprise Development Act, 2006.
- -
4 - -
5when the interest dues as above are actually paid to the small enterprise for the purpose of disallowance as a deductible expenditure under section 23 of the Micro Small and Medium Enterprise Development Act, 2006.
- -
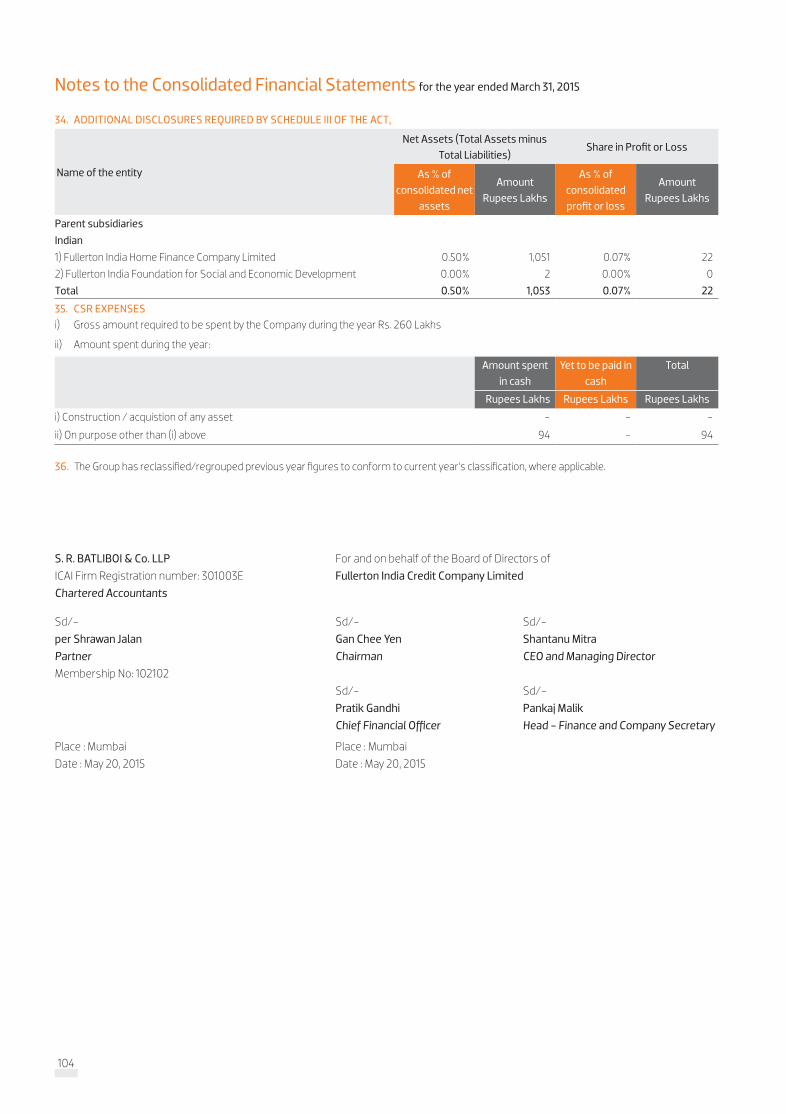
104
Notes to the Consolidated Financial Statements for the year ended March 31, 2015
35. CSR EXPENSESi) Gross amount required to be spent by the Company during the year Rs. 260 Lakhs
ii) Amount spent during the year:
34. ADDITIONAL DISCLOSURES REQUIRED BY SCHEDULE III OF THE ACT,
36.
Amount spent in cash
Yet to be paid in cash
Total
Rupees LakhsRupees Lakhs Rupees Lakhs
i) Construction / acquistion of any asset - - -
ii) On purpose other than (i) above 94 - 94
S. R. BATLIBOI & Co. LLP For and on behalf of the Board of Directors of ICAI Firm Registration number: 301003E Fullerton India Credit Company Limited Chartered Accountants
Sd/- Sd/- Sd/-per Shrawan Jalan Gan Chee Yen Shantanu Mitra Partner Chairman CEO and Managing Director Membership No: 102102 Sd/- Sd/- Pratik Gandhi Pankaj Malik Chief Financial Officer Head - Finance and Company Secretary
Place : Mumbai Place : Mumbai Date : May 20, 2015 Date : May 20, 2015
Name of the entity
Net Assets (Total Assets minus Total Liabilities)
Share in Profit or Loss
As % of consolidated net
assets
AmountRupees Lakhs
As % of consolidated profit or loss
AmountRupees Lakhs
Parent subsidiaries
Indian
1) Fullerton India Home Finance Company Limited 0.50% 1,051 0.07% 22
2) Fullerton India Foundation for Social and Economic Development 0.00% 2 0.00% 0
Total 0.50% 1,053 0.07% 22
Notes to the Consolidated Financial Statements for the year ended March 31, 2015
39. CSR EXPENSESi) Gross amount required to be spent by the Company during the year Rs. 260 Lakhs
ii) Amount spent during the year:
34. ADDITIONAL DISCLOSURES REQUIRED BY SCHEDULE III OF THE ACT,
40.
Amount spent in cash
Yet to be paid in cash
Total
Rupees Lakhs Rupees Lakhs
i) Construction / acquistion of any asset - - -
ii) On purpose other than (i) above 94 - 94
As per our report of even date
S. R. BATLIBOI & Co. LLP For and on behalf of the Board of Directors of ICAI Firm’s Registration number: 301003E Fullerton India Credit Company Limited Chartered Accountants
Sd/- Sd/- Sd/-per Shrawan Jalan Gan Chee Yen Shantanu Mitra Partner Chairman CEO and Managing Director Membership No: 102102 Sd/- Sd/- Pratik Gandhi Pankaj Malik Chief Financial Officer Head - Finance and Company Secretary
Place : Mumbai Place : Mumbai Date : May 20, 2015 Date : May 20, 2015
Name of the entity
Net Assets (Total Assets minus Total Liabilities)
Share in Profit or Loss
As % of consolidated net
assets
AmountRupees Lakhs
As % of consolidated profit or loss
AmountRupees Lakhs
Parent subsidiaries
Indian
1) Fullerton India Home Finance Company Limited 0.50% 1,051 0.07% 22
2) Fullerton India Foundation for Social and Economic Development 0.00% 2 0.00% 0
Total 0.50% 1,053 0.07% 22
120PB

105Annual Report 2015 Fullerton India Credit Company Limited
�e Group has reclassified/regrouped previous year figures to conform to current year’s classification, where applicable.
Notes to the Consolidated Financial Statements for the year ended March 31, 2015
39. CSR EXPENSESi) Gross amount required to be spent by the Company during the year Rs. 260 Lakhs
ii) Amount spent during the year:
34. ADDITIONAL DISCLOSURES REQUIRED BY SCHEDULE III OF THE ACT,
40.
Amount spent in cash
Yet to be paid in cash
Total
Rupees LakhsRupees Lakhs Rupees Lakhs
i) Construction / acquistion of any asset - - -
ii) On purpose other than (i) above 94 - 94
S. R. BATLIBOI & Co. LLP For and on behalf of the Board of Directors of ICAI Firm Registration number: 301003E Fullerton India Credit Company Limited Chartered Accountants
Sd/- Sd/- Sd/-per Shrawan Jalan Gan Chee Yen Shantanu Mitra Partner Chairman CEO and Managing Director Membership No: 102102 Sd/- Sd/- Pratik Gandhi Pankaj Malik Chief Financial Officer Head - Finance and Company Secretary
Place : Mumbai Place : Mumbai Date : May 20, 2015 Date : May 20, 2015
Name of the entity
Net Assets (Total Assets minus Total Liabilities)
Share in Profit or Loss
As % of consolidated net
assets
AmountRupees Lakhs
As % of consolidated profit or loss
AmountRupees Lakhs
Parent subsidiaries
Indian
1) Fullerton India Home Finance Company Limited 0.50% 1,051 0.07% 22
2) Fullerton India Foundation for Social and Economic Development 0.00% 2 0.00% 0
Total 0.50% 1,053 0.07% 22
Notes to the Consolidated Financial Statements for the year ended March 31, 2015
39. CSR EXPENSESi) Gross amount required to be spent by the Company during the year Rs. 260 Lakhs
ii) Amount spent during the year:
34. ADDITIONAL DISCLOSURES REQUIRED BY SCHEDULE III OF THE ACT,
40.
Amount spent in cash
Yet to be paid in cash
Total
Rupees Lakhs Rupees Lakhs
i) Construction / acquistion of any asset - - -
ii) On purpose other than (i) above 94 - 94
As per our report of even date
S. R. BATLIBOI & Co. LLP For and on behalf of the Board of Directors of ICAI Firm’s Registration number: 301003E Fullerton India Credit Company Limited Chartered Accountants
Sd/- Sd/- Sd/-per Shrawan Jalan Gan Chee Yen Shantanu Mitra Partner Chairman CEO and Managing Director Membership No: 102102 Sd/- Sd/- Pratik Gandhi Pankaj Malik Chief Financial Officer Head - Finance and Company Secretary
Place : Mumbai Place : Mumbai Date : May 20, 2015 Date : May 20, 2015
Name of the entity
Net Assets (Total Assets minus Total Liabilities)
Share in Profit or Loss
As % of consolidated net
assets
AmountRupees Lakhs
As % of consolidated profit or loss
AmountRupees Lakhs
Parent subsidiaries
Indian
1) Fullerton India Home Finance Company Limited 0.50% 1,051 0.07% 22
2) Fullerton India Foundation for Social and Economic Development 0.00% 2 0.00% 0
Total 0.50% 1,053 0.07% 22
120PB
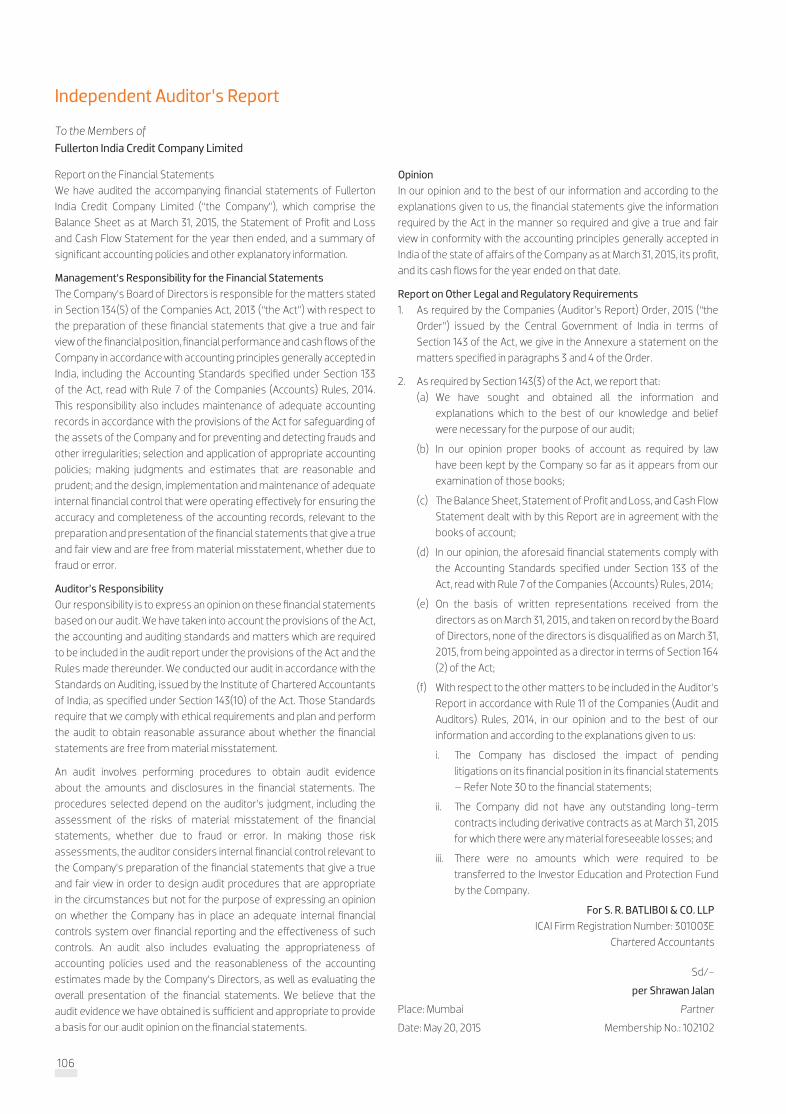
106
Independent Auditor’s Report
To the Members of Fullerton India Credit Company Limited
Report on the Financial StatementsWe have audited the accompanying financial statements of Fullerton India Credit Company Limited (“the Company”), which comprise the Balance Sheet as at March 31, 2015, the Statement of Profit and Loss and Cash Flow Statement for the year then ended, and a summary of significant accounting policies and other explanatory information.
Management’s Responsibility for the Financial Statements
in Section 134(5) of the Companies Act, 2013 (“the Act”) with respect to the preparation of these financial statements that give a true and fair view of the financial position, financial performance and cash flows of the Company in accordance with accounting principles generally accepted in India, including the Accounting Standards specified under Section 133 of the Act, read with Rule 7 of the Companies (Accounts) Rules, 2014.
records in accordance with the provisions of the Act for safeguarding of the assets of the Company and for preventing and detecting frauds and other irregularities; selection and application of appropriate accounting policies; making judgments and estimates that are reasonable and prudent; and the design, implementation and maintenance of adequate internal financial control that were operating effectively for ensuring the accuracy and completeness of the accounting records, relevant to the preparation and presentation of the financial statements that give a true and fair view and are free from material misstatement, whether due to fraud or error.
Auditor’s ResponsibilityOur responsibility is to express an opinion on these financial statements based on our audit. We have taken into account the provisions of the Act, the accounting and auditing standards and matters which are required to be included in the audit report under the provisions of the Act and the Rules made thereunder. We conducted our audit in accordance with the Standards on Auditing, issued by the Institute of Chartered Accountants
require that we comply with ethical requirements and plan and perform the audit to obtain reasonable assurance about whether the financial statements are free from material misstatement.
An audit involves performing procedures to obtain audit evidence
procedures selected depend on the auditor’s judgment, including the assessment of the risks of material misstatement of the financial statements, whether due to fraud or error. In making those risk assessments, the auditor considers internal financial control relevant to the Company’s preparation of the financial statements that give a true and fair view in order to design audit procedures that are appropriate in the circumstances but not for the purpose of expressing an opinion on whether the Company has in place an adequate internal financial controls system over financial reporting and the effectiveness of such controls. An audit also includes evaluating the appropriateness of accounting policies used and the reasonableness of the accounting estimates made by the Company’s Directors, as well as evaluating the overall presentation of the financial statements. We believe that the audit evidence we have obtained is sufficient and appropriate to provide a basis for our audit opinion on the financial statements.
OpinionIn our opinion and to the best of our information and according to the explanations given to us, the financial statements give the information required by the Act in the manner so required and give a true and fair view in conformity with the accounting principles generally accepted in India of the state of affairs of the Company as at March 31, 2015, its profit, and its cash flows for the year ended on that date.
Report on Other Legal and Regulatory Requirements1. As required by the Companies (Auditor’s Report) Order, 2015 (“the
Order”) issued by the Central Government of India in terms of Section 143 of the Act, we give in the Annexure a statement on the matters specified in paragraphs 3 and 4 of the Order.
2. As required by Section 143(3) of the Act, we report that: (a) We have sought and obtained all the information and
explanations which to the best of our knowledge and belief were necessary for the purpose of our audit;
(b) In our opinion proper books of account as required by law have been kept by the Company so far as it appears from our examination of those books;
(c) Statement dealt with by this Report are in agreement with the books of account;
(d) In our opinion, the aforesaid financial statements comply with the Accounting Standards specified under Section 133 of the Act, read with Rule 7 of the Companies (Accounts) Rules, 2014;
(e) On the basis of written representations received from the directors as on March 31, 2015, and taken on record by the Board of Directors, none of the directors is disqualified as on March 31, 2015, from being appointed as a director in terms of Section 164 (2) of the Act;
(f) With respect to the other matters to be included in the Auditor’s Report in accordance with Rule 11 of the Companies (Audit and Auditors) Rules, 2014, in our opinion and to the best of our information and according to the explanations given to us:
i. litigations on its financial position in its financial statements – Refer Note 30 to the financial statements;
ii. contracts including derivative contracts as at March 31, 2015 for which there were any material foreseeable losses; and
iii. transferred to the Investor Education and Protection Fund by the Company.
For S. R. BATLIBOI & CO. LLP ICAI Firm Registration Number: 301003E Chartered Accountants
Sd/-
per Shrawan Jalan
Place: Mumbai Partner
Date: May 20, 2015 Membership No.: 102102

107Annual Report 2015 Fullerton India Credit Company Limited
Annexure referred to in paragraph 1 under the heading “Report on other legal and regulatory requirements” of our report of even date
Re: Fullerton India Credit Company Limited
(i) (a)
particulars, including quantitative details and situation of fixed
assets.
(b) Fixed assets have been physically verified by the management
during the year and no material discrepancies were identified
on such verification.
(ii)
accordingly, the requirements under paragraph 4(ii) of the Order
are not applicable to the Company and hence not commented
upon.
(iii) According to the information and explanations given to us, the
Company has not granted any loans, secured or unsecured
to companies, firms or other parties covered in the register
maintained under section 189 of the Companies Act, 2013.
Accordingly, the provisions of clause 3(iii)(a) and (b) of the Order
are not applicable to the Company and hence not commented
upon.
(iv) In our opinion and according to the information and explanations
given to us, there is an adequate internal control system
commensurate with the size of the Company and the nature of
its business, for the purchase of fixed assets and for rendering of
inventory and the sale of goods. During the course of our audit,
we have not observed any major weakness or continuing failure to
correct any major weakness in the internal control system of the
Company in respect of these areas.
(v)
(vi) To the best of our knowledge and as explained, the Central
Government has not specified the maintenance of cost records
under clause 148(1) of the Companies Act, 2013, for the products/
services of the Company.
(vii) (a)
appropriate authorities undisputed statutory dues including
provident fund, employees’ state insurance, income-tax,
sales-tax, wealth-tax, service tax, customs duty, excise
duty, value added tax, cess and other material statutory dues
applicable to it.
(b) According to the information and explanations given to us,
no undisputed amounts payable in respect of provident fund,
employees’ state insurance, income-tax, wealth-tax, service
tax, sales-tax, customs duty, excise duty, value added tax,
cess and other material statutory dues were outstanding, at
the year end, for a period of more than six months from the
date they became payable.
(c) According to the records of the Company, the dues
outstanding of income-tax, sales-tax, wealth-tax, service
tax, customs duty, excise duty, value added tax and cess on
account of any dispute, are as follows:
Name of the statute
Nature of the dues
Amount (Rs)
Period to which the amount relates
Due Date
Forum where the dispute is
pending
Chapter V of the Finance Act, 1994
Service tax
416,282 Various dates
Various dates
Commissioner of Central Excise (Appeals)
(d)
to the Investor Education and Protection Fund by the Company
in accordance with the relevant provisions of the Companies
Act, 1956 (1 of 1956) and rules made thereunder.
(viii)
year are less than fifty per cent of its net worth and it has not
incurred cash losses in the current and immediately preceding
financial year.
(ix) Based on our audit procedures and as per the information and
explanations given by the management, we are of the opinion that
the Company has not defaulted in repayment of dues to a financial
institution, bank or debenture holders.
(x) According to the information and explanations given to us, the
Company has not given any guarantee for loans taken by others
from banks or financial institutions.
(xi) Based on the information and explanation given to us by the
management, term loans were applied for the purpose for which
the loans were obtained, though idle/surplus funds which were
not required for immediate utilisation have been gainfully invested
in liquid investments payable on demand.
(xii) We have been informed that during the year there were
fourteen instances of cash embezzlements by the employees
of the Company and external parties aggregating Rs.1,393,521;
eight instances of loans given based on misrepresentation by
the borrowers, employees and external parties aggregating
Rs.3,250,336; an instance of fraudulent transfer of excess
amounts lying in customer loan accounts by an employee to
services of the employees involved have been terminated and
the Company is in the process of taking legal action against such
outstanding balance (net of recovery) aggregating Rs.17,906,242,
as at the Balance Sheet date.
For S. R. BATLIBOI & CO. LLP ICAI Firm Registration Number: 301003E Chartered Accountants
Sd/-
per Shrawan Jalan
Place: Mumbai Partner
Date: May 20, 2015 Membership No.: 102102

108
Notes March 31, 2015 March 31, 2014
Rs. lakhs Rs. lakhs
EQUITY AND LIABILITIES
Shareholders’ funds
Share capital 3 1,85,866 1,85,866
Reserves and surplus 4 (29,131) (59,227)
Non-current liabilities
Long-term borrowings 5 4,89,208 3,34,130
Other long term liabilities 6 6,515 3,508
Long-term provisions 7 8,057 5,000
Current liabilities
Short-term borrowings 8 90,415 83,200
Other current liabilities 9 2,61,065 1,72,069
Short-term provisions 7 1,937 2,270
TOTAL 10,13,932 7,26,816
ASSETS
Non-current assets
Fixed assets
Tangible assets 10 2,432 2,302
Intangible assets 11 1,096 1,633
Assets under development 10 & 11 1,127 495
Non-current investments 12 1,005 207
Long-term loans and advances 13 6,01,792 4,07,769
Other non-current assets 14 6,240 5,255
Current assets
Current investments 15 50,684 41,747
Trade receivables 16 254 267
Cash and bank balances 17 54,039 38,693
Short-term loans and advances 13 2,77,270 2,15,407
Other current assets 14 17,993 13,041
TOTAL 10,13,932 7,26,816
Summary of significant accounting policies 2.1
Balance Sheet as at March 31, 2015
As per our report of even date
S. R. BATLIBOI & Co. LLP For and on behalf of the Board of Directors of ICAI Firm Registration number: 301003E Fullerton India Credit Company Limited Chartered Accountants
Sd/- Sd/- Sd/-per Shrawan Jalan Gan Chee Yen Shantanu Mitra Partner Chairman CEO and Managing Director Membership No: 102102 Sd/- Sd/- Pratik Gandhi Pankaj Malik Chief Financial Officer Head - Finance and Company Secretary
Place : Mumbai Place : Mumbai Date : May 20, 2015 Date : May 20, 2015

109Annual Report 2015 Fullerton India Credit Company Limited
Notes March 31, 2015 March 31, 2014
Rs. lakhs Rs. lakhs
INCOME
Revenue from operations 18 1,67,824 1,32,853
Other income 19 4,200 5,908
Total revenue (I) 1,72,024 1,38,761
EXPENSES
Employee benefit expense 20 29,556 25,480
Other expenses 21 24,783 21,719
Depreciation and amortisation expense 10&11 2,309 2,117
Finance costs 22 70,860 56,167
Provisions and write-offs 23 14,420 14,484
Total expenses (II) 1,41,928 1,19,967
Profit before tax (III) =(I)-(II) 30,096 18,794
Tax expenses
Income tax for the year 6,923 4,744
Provision related to previous years (158) 646
MAT credit entitlement (6,765) (5,390)
Total tax expense (IV) - -
Profit for the year (III)-(IV) 30,096 18,794
Earnings per equity share (Rs.) 24
Basic (Computed on the basis of total profit for the year) 1.62 1.01
Diluted (Computed on the basis of total profit for the year) 1.62 1.01
Summary of significant accounting policies 2.1
Statement of Profit and Loss for the year ended March 31, 2015
As per our report of even date
S. R. BATLIBOI & Co. LLP For and on behalf of the Board of Directors of ICAI Firm Registration number: 301003E Fullerton India Credit Company Limited Chartered Accountants
Sd/- Sd/- Sd/-per Shrawan Jalan Gan Chee Yen Shantanu Mitra Partner Chairman CEO and Managing Director Membership No: 102102 Sd/- Sd/- Pratik Gandhi Pankaj Malik Chief Financial Officer Head - Finance and Company Secretary
Place : Mumbai Place : Mumbai Date : May 20, 2015 Date : May 20, 2015

110
March 31, 2015 March 31, 2014
Rs. lakhs Rs. lakhs
A. CASH FLOW FROM OPERATING ACTIVITIES:
Net profit before taxation 30,096 18,794
Adjustment for computing operating profit before working capital changes:
Depreciation and amortisation 2,309 2,117
Interest on fixed deposits and bonds (3,086) (1,623)
Interest on investments (3,418) (1,944)
Profit on sale of fixed assets (38) (16)
Write off of fixed assets & intangible assets 66 27
Profit on sale of investments (1,926) (4,518)
Unrealised loss on investments 3 105
Provision for standard/sub standard assets and bad debts written off 14,417 14,383
Provision for employees benefits (86) 213
Amortisation of ancillary borrowing costs 1,466 1,511
Unamortised loan origination costs (3,807) (3,659)
Unamortised loan processing fees 5,149 5,305
Operating profit before working capital changes 41,145 30,695
Movements in working capital :
- (Increase)/decrease in long term loans and advances (1,96,719) (1,11,590)
- (Increase)/decrease in short term loans and advances (65,554) (42,006)
- (Increase)/decrease in other current assets (2,369) (1,506)
- (Increase)/decrease in trade receivables 13 (128)
- Increase/(decrease) in current liabilities 23,102 6,077
- Increase/(decrease) in other long term liabilities 652 378
- Increase/ (decrease) in short term Provision 34 -
Cash generated from operations (1,99,696) (1,18,082)
- Income taxes paid (5,209) (4,345)
Net cash from operating activities (A) (2,04,905) (1,22,426)
B. CASH FLOW FROM INVESTING ACTIVITIES:
Purchase of fixed assets and intangibles (2,866) (2,220)
Proceeds from sale of fixed assets 43 25
Investments in subsidiary company (800) -
Purchase of current investments (12,01,237) (17,25,855)
Sale/maturity of investments 11,97,536 17,26,669
Fixed deposit placed during the year (58,071) (39,694)
Fixed deposit matured during the year 19,639 37,939
Interest received on fixed deposits and bonds 2,154 1,178
Interest received on investments 115 517
Net cash from investing activities (B) (43,487) (1,441)
Cash Flow Statement for the year ended March 31, 2015

111Annual Report 2015 Fullerton India Credit Company Limited
March 31, 2015 March 31, 2014
Rs. lakhs Rs. lakhs
C. CASH FLOW FROM FINANCING ACTIVITIES
Proceeds from long term borrowings from banks and financial institutions 3,62,000 2,64,300
Proceeds from short term borrowings from banks and financial institutions 1,68,636 1,75,638
Repayment of long term borrowings from banks and financial institutions (1,43,607) (1,04,007)
Repayment of short term borrowings from banks and financial institutions (1,61,435) (2,04,793)
Payment of ancillary borrowing costs (1,373) (1,592)
Net cash used in financing activities (C ) 2,24,221 1,29,546
Net increase/(decrease) in cash and cash equivalents (A)+(B)+(C) (24,171) 5,679
Cash and cash equivalents as at the beginning of the year 33,105 27,426
Cash and cash equivalents as at the end of the year 8,934 33,105
(refer note 29 )
Components of cash and cash equivalents as at the end of the year
Cash and cheques on hand 1,151 819
With banks - on current account 7,782 12,671
- on deposit account - 19,615
8,934 33,105
Summary of significant accounting policies 2.1
Cash Flow Statement for the year ended March 31, 2015
As per our report of even date
S. R. BATLIBOI & Co. LLP For and on behalf of the Board of Directors of ICAI Firm’s Registration number: 301003E Fullerton India Credit Company Limited Chartered Accountants
Sd/- Sd/- Sd/-per Shrawan Jalan Gan Chee Yen Shantanu Mitra Partner Chairman CEO and Managing Director Membership No: 102102 Sd/- Sd/- Pratik Gandhi Pankaj Malik Chief Financial Officer Head - Finance and Company Secretary
Place : Mumbai Place : Mumbai Date : May 20, 2015 Date : May 20, 2015
Cash and cash equivalents as at the end of the year

112
Notes to financial Statements for the year ended March 31, 2015
(Amount in Rupees Lakhs unless otherwise stated)1. Corporate information Fullerton India Credit Company Limited (‘the Company’) is a public limited company domiciled in India and incorporated under the provisions
Company provides loans to small and medium enterprises for working capital and growth, loans for commercial vehicles and two-wheelers, home improvement loans, loans against property, personal loans, working capital loans for urban salaried and self-employed and loans for rural livelihood advancement and financing of various rural micro enterprises.
2. Basis of Preparation
section 133 of the Companies Act, 2013 (‘the Act’) read with rule 7 of the Companies (Accounts) Rules, 2014, the relevant provisions of the Act and
convention except in the case of interest on non-performing assets, dishonour charges and penal charges, which are recognised on realisation.
2.1 Summary of Significant Accounting Policies (a) Use of estimates
judgements, estimates and assumptions that affect the reported amounts of revenues, expenses, assets and liabilities and disclosure of contingent liabilities at the end of reporting period. Although these estimates are based on management’s knowledge of current events and actions, uncertainty about these assumptions and estimates could result in the outcomes requiring a material adjustment to the carrying amount of assets and liabilities in future periods.
(b) Tangible fixed assets Fixed assets are carried at cost, net of accumulated depreciation and impairment loss, if any. Cost includes purchase price and directly
attributable cost of bringing the asset to its working condition for the intended use.
Gain or loss arising from de-recognition of a fixed asset is measured as the difference between the net disposal proceeds and the carrying amount of the asset and is recognised in the Statement of Profit and Loss when the asset is derecognised.
(c) Intangible assets Costs relating to acquisition and development of computer software are capitalised in accordance with the AS 26 ‘Intangible Assets’ issued
by the Institute of Chartered Accountants of India (‘ICAI’) and are amortised using the straight line method over a period of five years, which is the management’s estimate of its useful life.
(d) Depreciation on tangible fixed assets Depreciation on tangible fixed assets is provided using the Straight Line Method (‘SLM’) as per the useful life of the asset estimated by the
management.
Useful life estimated by the Company(in years)
Useful Life as per Schedule II(in years)
Building 50 60
Computer Server and Other Accessories 4 6
Computer Desktop and Laptops 3 3
Furniture and Fixtures 5 10
Office Equipments 5 5
Handheld devices 2 5
Vehicles 4 8
Leasehold improvements are amortised over the period of the lease subject to a maximum lease period of 66 months.
Tangible assets having an original cost up to Rs. 5,000 individually are depreciated fully in the year of purchase.
(e) Impairment
amount is the greater of the asset’s net selling price and value in use. In assessing value in use, the estimated future cash flows are discounted to their present value using a pre-tax discount rate that reflects current market assessments of the time value of money and risk specific to the asset.
After impairment, depreciation is provided on the revised carrying amount of the asset over its remaining useful life.
(f) Investments Investments, which are readily realisable and intended to be held for not more than one year from the date on which such investments

113Annual Report 2015 Fullerton India Credit Company Limited
Notes to financial Statements for the year ended March 31, 2015
(Amount in Rupees Lakhs unless otherwise stated)are made, are classified as current investments. All other investments are classified as long-term investments. Current investments are carried in the financial statements at lower of cost and fair value determined in accordance with the NBFC directions. Investments in the units of mutual funds in the nature of current investments that have been valued at the net asset value declared by the mutual fund in respect of each particular scheme, in accordance with the NBFC directions. Long-term investments are carried at cost. However, provision for diminution in value is made to recognise a decline other than temporary in the value of the investments.
(g) Asset classification and Provisioning/write-off of Assets (i) Loans are classified as standard and non-performing assets in accordance with Company’s policy. A loan is classified as NPA, where
interest/installment is overdue for a period of 90 days and above, from the day it becomes due.
(ii) Loans are provided for/written off, in accordance with Company’s policy, subject to the minimum provision required as per Non–Banking Financial (Deposit Accepting or Holding) Companies Prudential Norms (Reserve Bank) Directions, 2007 as amended from time to time.
(h) Leases Where the Company is the lessor Assets given on operating leases are included in fixed assets. Lease income is recognised in the Statement of Profit and Loss on a straight-
line basis over the lease term. Costs, including depreciation are recognised as an expense in the Statement of Profit and Loss. Initial direct costs such as legal costs, brokerage costs, etc. are recognised immediately in the Statement of Profit and Loss.
Where the Company is the lessee Lease arrangements where the Lessor effectively retains, substantially, all the risks and benefits of ownership of the leased term, are
classified as operating leases. Operating lease payments are recognised as an expense in the Statement of Profit and Loss on a straight-line basis over the lease term.
(i) Revenue recognition Revenue is recognised to the extent that it is probable that the economic benefits will flow to the Company and the revenue can be reliably
measured.
Interest Income Interest income on loans given is recognised under the internal rate of return method.
Such interest, where installments are overdue for 90 days and above, is recognised only when actually realised. Any such income, recognised and remaining unrealised after the installments have become overdue for 90 days and above, is reversed.
Interest income on deposits with banks is recognised on a time proportion basis taking into account the amount outstanding and the applicable interest rate.
Income from Assignment of loans and receivables On sale of receivables under asset assignment arrangement, the profit arising on account of sale is recognised over the life of the receivables
assigned on an accrual basis and loss, (if any) arising on account of sale is accounted immediately.
Fee income Loan processing fee/document fee/stamp fee are recognised over the term of the loan in proportion to the interest accrued during the
year. For the agreements foreclosed or transferred through assignment, the unamortised portion of the fee is recognised as income to the Statement of Profit and Loss at the time of such foreclosure/transfer through assignment.
Additional charges such as penal, dishonour, foreclosure charges, etc. are recognised on realisation basis.
Income on discounted instruments Income on discounted instruments is recognised over the tenor of the instrument on straight line basis.
Commission and brokerage income Commission and brokerage income earned for the services rendered are recognised on accrual basis.
Dividend Income Dividend income is recognised when the shareholders’ right to receive payment is established by the balance sheet date.
Profit/Loss in sale of investments Profit/loss earned on sale of investments is recognised on trade date basis. On disposal of an investment, the difference between its
carrying amount and net disposal proceeds is charged or credited to the Statement of Profit and Loss.
(j) Foreign currency transactions i) Initial recognition Foreign currency transactions are recorded at exchange rate ruling at the date of transaction.
ii) Conversion Foreign currency monetary balances are reported using the exchange rate prevailing at the reporting date.

114
Notes to financial Statements for the year ended March 31, 2015
(Amount in Rupees Lakhs unless otherwise stated) Non-monetary balances, which are measured in terms of historical cost denominated in a foreign currency, are reported using the
exchange rate at the date of the transaction.
iii) Exchange differences Exchange differences arising on the settlement of monetary balances or on the restatement of the Company’s monetary balances
at rates different from those at which they were initially recorded during the year, or reported in the previous financial statements, are recognised as income or as expense in the year in which they arise.
(k) Retirement and Other Employee benefits i) Short Term Employee Benefits All short term employee benefits are accounted on undiscounted basis during the accounting period based on services rendered by
employees.
ii) Defined Contribution Plans a)
payable to the provident fund.
b) Superannuation is provided for on accrual basis, in accordance with the Company’s policy.
iii) Defined Benefit Plans Gratuity liability is provided for on the basis of an actuarial valuation on projected unit credit method made at the end of each financial
year. Actuarial gain or loss is recognised in full in the period in which they occur in the Statement of Profit and Loss.
iv) Leave benefits Accumulated leave balance, which is expected to be utilised within the next twelve months, is treated as short term employee benefit.
entitlement that has accumulated at the reporting date.
v) Other Benefits
contribution for branch sales incentives has been discontinued effective January 1, 2013. For amounts not due as at the end of the year (based on employment period), expense is provided for on the basis of an actuarial valuation made at the end of the financial year. Actuarial gains/losses are immediately taken to the Statement of Profit and Loss and are not deferred. Amounts due to employees after completion of required employment period are provided for on accrual basis.
(l) Income taxes Tax expense comprises current and deferred tax. Current income tax is measured at the amount expected to be paid to the tax authorities
enacted or substantively enacted at the reporting date.
Deferred income taxes reflects the impact of current year timing differences between taxable income and accounting income originating during the current year and reversal of timing differences of earlier years. Deferred tax is measured based on the tax rates and the tax laws enacted or substantively enacted at the balance sheet date. Deferred tax assets are recognised only to the extent that there is reasonable certainty that sufficient future taxable income will be available against which such deferred tax assets can be realised. In situations where the Company has unabsorbed depreciation or carry forward tax losses, all deferred tax assets are recognised only if there is virtual certainty supported by convincing evidence that they can be realised against future taxable profits.
At each balance sheet date, the Company re-assesses unrecognised deferred tax assets. It recognises unrecognised deferred tax assets to the extent that it has become reasonably certain or virtually certain, as the case may be that sufficient future taxable income will be available against which such deferred tax assets can be realised.
credit available as an asset only to the extent that there is convincing evidence that the Company will pay normal income tax during the specified period, i.e., the period for which MAT credit is allowed to be carried forward. In the year in which the Company recognises MAT credit as an asset in accordance with the Guidance Note on Accounting for Credit Available in respect of Minimum Alternative Tax under the Income Tax Act, 1961, the said asset is created by way of credit to the Statement of Profit and Loss and shown as “MAT Credit Entitlement.”
not have convincing evidence that it will pay normal tax during the specified period.
(m) Earnings per share Basic earnings per share is calculated by dividing the net profit or loss for the period attributable to equity shareholders (after deducting
attributable taxes) by the weighted average number of equity shares outstanding during the year.
For the purpose of calculating diluted earnings per share, the net profit or loss for the year attributable to equity shareholders and the weighted average number of shares outstanding during the year are adjusted for the effects of all dilutive potential equity shares.
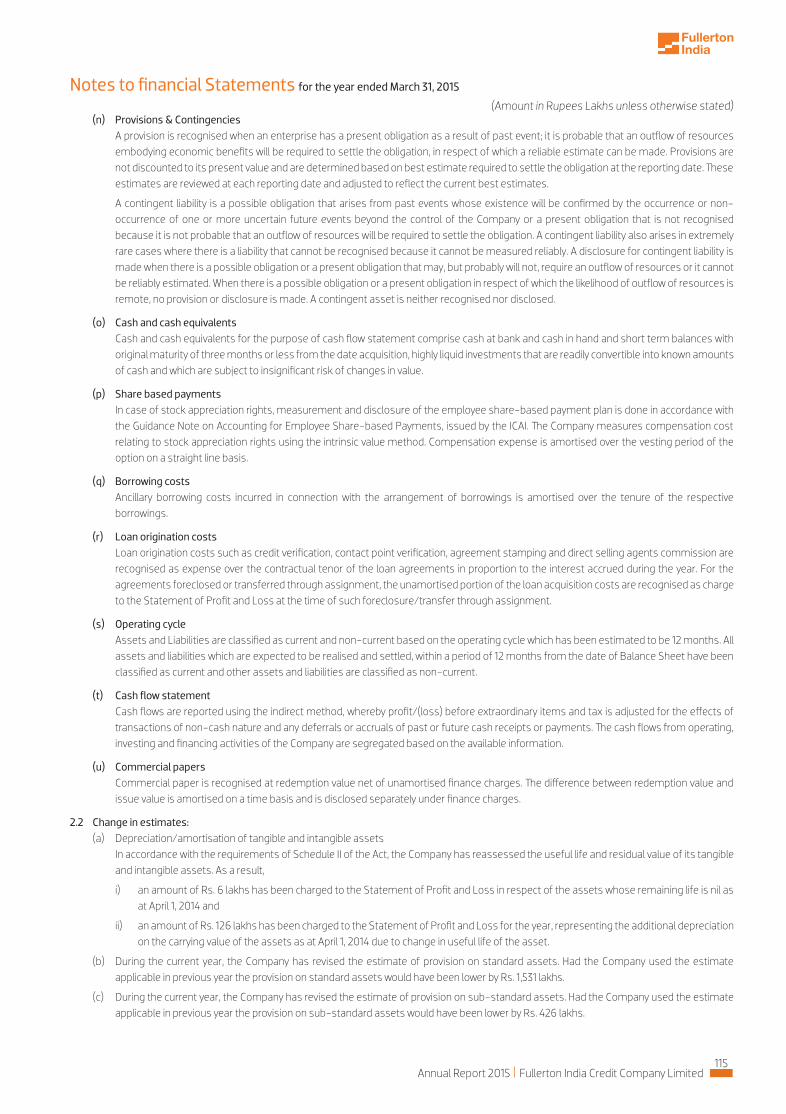
115Annual Report 2015 Fullerton India Credit Company Limited
Notes to financial Statements for the year ended March 31, 2015
(Amount in Rupees Lakhs unless otherwise stated) (n) Provisions & Contingencies A provision is recognised when an enterprise has a present obligation as a result of past event; it is probable that an outflow of resources
embodying economic benefits will be required to settle the obligation, in respect of which a reliable estimate can be made. Provisions are
estimates are reviewed at each reporting date and adjusted to reflect the current best estimates.
A contingent liability is a possible obligation that arises from past events whose existence will be confirmed by the occurrence or non-occurrence of one or more uncertain future events beyond the control of the Company or a present obligation that is not recognised because it is not probable that an outflow of resources will be required to settle the obligation. A contingent liability also arises in extremely rare cases where there is a liability that cannot be recognised because it cannot be measured reliably. A disclosure for contingent liability is made when there is a possible obligation or a present obligation that may, but probably will not, require an outflow of resources or it cannot be reliably estimated. When there is a possible obligation or a present obligation in respect of which the likelihood of outflow of resources is remote, no provision or disclosure is made. A contingent asset is neither recognised nor disclosed.
(o) Cash and cash equivalents Cash and cash equivalents for the purpose of cash flow statement comprise cash at bank and cash in hand and short term balances with
original maturity of three months or less from the date acquisition, highly liquid investments that are readily convertible into known amounts of cash and which are subject to insignificant risk of changes in value.
(p) Share based payments In case of stock appreciation rights, measurement and disclosure of the employee share-based payment plan is done in accordance with
relating to stock appreciation rights using the intrinsic value method. Compensation expense is amortised over the vesting period of the option on a straight line basis.
(q) Borrowing costs Ancillary borrowing costs incurred in connection with the arrangement of borrowings is amortised over the tenure of the respective
borrowings.
(r) Loan origination costs Loan origination costs such as credit verification, contact point verification, agreement stamping and direct selling agents commission are
recognised as expense over the contractual tenor of the loan agreements in proportion to the interest accrued during the year. For the agreements foreclosed or transferred through assignment, the unamortised portion of the loan acquisition costs are recognised as charge to the Statement of Profit and Loss at the time of such foreclosure/transfer through assignment.
(s) Operating cycle Assets and Liabilities are classified as current and non-current based on the operating cycle which has been estimated to be 12 months. All
assets and liabilities which are expected to be realised and settled, within a period of 12 months from the date of Balance Sheet have been classified as current and other assets and liabilities are classified as non-current.
(t) Cash flow statement Cash flows are reported using the indirect method, whereby profit/(loss) before extraordinary items and tax is adjusted for the effects of
investing and financing activities of the Company are segregated based on the available information.
(u) Commercial papers
issue value is amortised on a time basis and is disclosed separately under finance charges.
2.2 Change in estimates: (a) Depreciation/amortisation of tangible and intangible assets In accordance with the requirements of Schedule II of the Act, the Company has reassessed the useful life and residual value of its tangible
and intangible assets. As a result,
i) an amount of Rs. 6 lakhs has been charged to the Statement of Profit and Loss in respect of the assets whose remaining life is nil as at April 1, 2014 and
ii) an amount of Rs. 126 lakhs has been charged to the Statement of Profit and Loss for the year, representing the additional depreciation on the carrying value of the assets as at April 1, 2014 due to change in useful life of the asset.
(b) During the current year, the Company has revised the estimate of provision on standard assets. Had the Company used the estimate applicable in previous year the provision on standard assets would have been lower by Rs. 1,531 lakhs.
(c) During the current year, the Company has revised the estimate of provision on sub-standard assets. Had the Company used the estimate applicable in previous year the provision on sub-standard assets would have been lower by Rs. 426 lakhs.
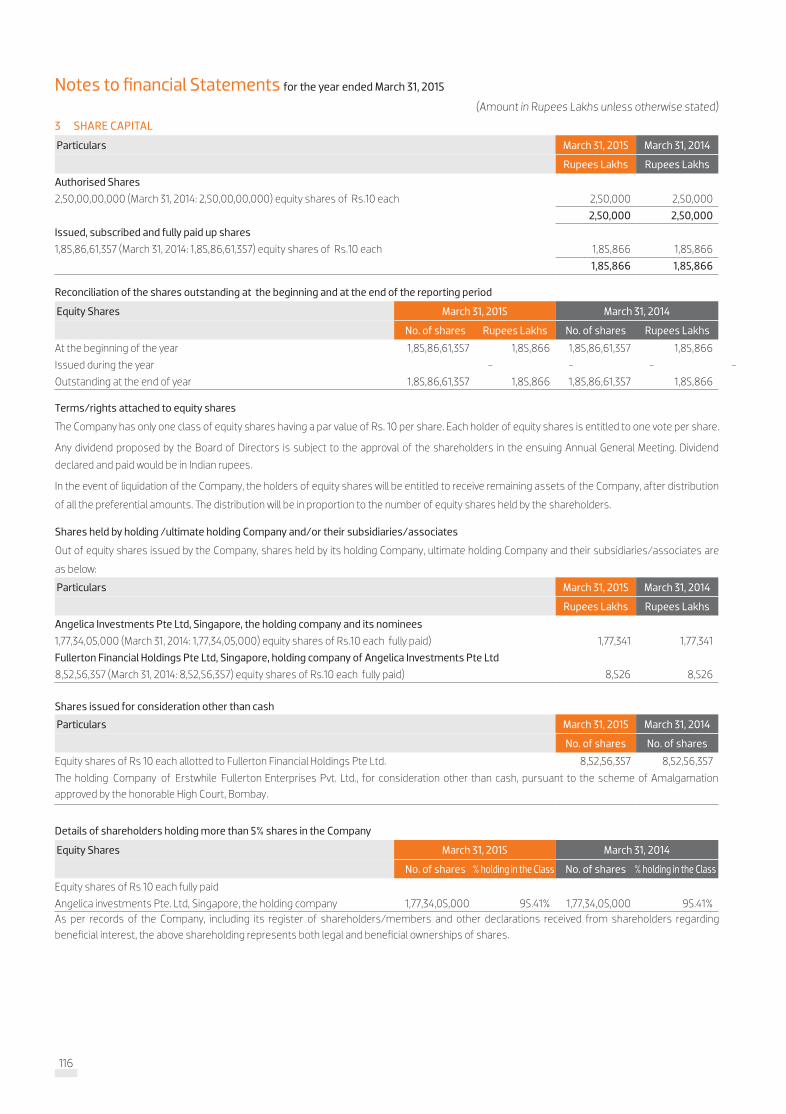
116
Notes to financial Statements for the year ended March 31, 2015
(Amount in Rupees Lakhs unless otherwise stated)
3 SHARE CAPITAL
Particulars March 31, 2015 March 31, 2014
Rupees Lakhs Rupees Lakhs
Authorised Shares
2,50,00,00,000 (March 31, 2014: 2,50,00,00,000) equity shares of Rs.10 each 2,50,000 2,50,000
2,50,000 2,50,000
Issued, subscribed and fully paid up shares
1,85,86,61,357 (March 31, 2014: 1,85,86,61,357) equity shares of Rs.10 each 1,85,866 1,85,866
1,85,866 1,85,866
Reconciliation of the shares outstanding at the beginning and at the end of the reporting period
Equity Shares March 31, 2015 March 31, 2014
No. of shares Rupees Lakhs No. of shares Rupees Lakhs
At the beginning of the year 1,85,86,61,357 1,85,866 1,85,86,61,357 1,85,866
Issued during the year - - - -
Outstanding at the end of year 1,85,86,61,357 1,85,866 1,85,86,61,357 1,85,866
Terms/rights attached to equity shares
Company has only one class of equity shares having a par value of Rs. 10 per share. Each holder of equity shares is entitled to one vote per share.
Any dividend proposed by the Board of Directors is subject to the approval of the shareholders in the ensuing Annual General Meeting. Dividend
declared and paid would be in Indian rupees.
In the event of liquidation of the Company, the holders of equity shares will be entitled to receive remaining assets of the Company, after distribution
Particulars March 31, 2015 March 31, 2014
Rupees Lakhs Rupees Lakhs
Angelica Investments Pte Ltd, Singapore, the holding company and its nominees
1,77,34,05,000 (March 31, 2014: 1,77,34,05,000) equity shares of Rs.10 each fully paid) 1,77,341 1,77,341
Fullerton Financial Holdings Pte Ltd, Singapore, holding company of Angelica Investments Pte Ltd
8,52,56,357 (March 31, 2014: 8,52,56,357) equity shares of Rs.10 each fully paid) 8,526 8,526
Shares held by holding /ultimate holding Company and/or their subsidiaries/associates
Out of equity shares issued by the Company, shares held by its holding Company, ultimate holding Company and their subsidiaries/associates are
as below:
Particulars March 31, 2015 March 31, 2014
No. of shares No. of shares
E
E
quity shares of Rs 10 each allotted to F
Fullerton
ullerton Financial Holdings Pte Ltd. 8,52,56,357 8,52,56,357
Shares issued for consideration other than cash
Details of shareholders holding more than 5% shares in the Company
Equity Shares March 31, 2015 March 31, 2014
No. of shares % holding in the Class No. of shares % holding in the Class
Equity shares of Rs 10 each fully paid
Angelica investments Pte. Ltd, Singapore, the holding company 1,77,34,05,000 95.41% 1,77,34,05,000 95.41%As per records of the Company, including its register of shareholders/members and other declarations received from shareholders regarding beneficial interest, the above shareholding represents both legal and beneficial ownerships of shares.
approved by the honorable High Court, Bombay.

117Annual Report 2015 Fullerton India Credit Company Limited
Notes to financial Statements for the year ended March 31, 2015
Particulars March 31, 2015 March 31, 2014
Rupees Lakhs Rupees Lakhs
General Reserve 96 96
(A) 96 96
Capital Reserve 349 349
(B) 349 349
Securities Premium Account 696 696
(C) 696 696
Reserve Fund under Section 45 - IC of the RBI Act, 1934
Balance as per the last financial statements 7,939 4,180
Add: Amount transferred from surplus balance in the statement of profit and loss 6,019 3,759
Closing Balance (D) 13,958 7,939
(Deficit) in the statement of profit and loss
Balance as per the last financial statements (68,307) (83,342)
Add: Profit for the year 30,096 18,794
Less: Transferred to Statutory Reserve [@ 20% of profit after tax (6,019) (3,759)
Net deficit in the statement of profit and loss (E) (44,230) (68,307)
Total reserves and surplus (A+B+C+D+E) (29,131) (59,227)
Non Current portion Current maturities
Particulars March 31, 2015 March 31, 2014 March 31, 2015 March 31, 2014
Rupees Lakhs Rupees Lakhs Rupees Lakhs Rupees Lakhs
Term Loans
Indian rupee loan from banks (secured)* 3,31,908 1,37,580 1,01,229 59,198
Indian rupee loan from banks (unsecured) 11,500 11,500 - -
Debentures
Debentures (secured)** 1,15,800 1,57,550 88,850 67,566
Debentures (unsecured) 30,000 27,500 2,500 2,500
Total 4,89,208 3,34,130 1,92,579 1,29,264
Secured Borrowings 4,47,708 2,95,130 1,90,079 1,26,764
Unsecured Borrowings 41,500 39,000 2,500 2,500
Less: Amount disclosed under the head other current liabilities (refer note 9) - - 1,92,579 1,29,264
Total 4,89,208 3,34,130 - -
* Indian rupee loan from banks are secured by first pari passu charge over all loan receivables except specific change on specific loan receivables for one of the financial institution.
** Debentures are secured by first pari passu charge over all loan receivables and immovable property.
4 RESERVE AND SURPLUS
5 LONG TERM BORROWINGS

118
Original maturity of loan(in no. of days)
Rate of interest
Due within 1 year Due 1 to 2 Years Due 2 to 3 Years More than 3 Years Total
No. of installments
Rupees Lakhs
No. of installments
Rupees Lakhs
No. of installments
Rupees Lakhs
No. of installments
Rupees Lakhs
Rupees Lakhs
Monthly repayment schedule
1096-1460 9% - 11% - - 6 25,000 - - - - 25,000
More than 1460 11% - 12% 12 1,632 12 1,632 12 1,632 1 201 5,097
Quarterly repayment schedule
366-720 9% - 11% 1 625 - - - - - - 625
731-10959% - 11% 6 6,250 8 8,750 2 2,500 - - 17,500
11% - 12% 14 11,271 5 3,237 - - - - 14,508
1096-14609% - 11% 23 43,007 30 55,651 9 17,875 - - 1,16,533
11% - 12% 19 16,944 11 9,097 - - - - 26,041
More than 14609% - 11% 2 2,000 16 12,417 20 18,417 26 22,167 55,000
11% -12 % 4 5,000 2 2,500 - - - - 7,500
Half yearly repayment schedule
731-1095 9% - 11% 2 3,333 2 3,333 1 1,667 - - 8,333
1096-1460 9% - 11% 1 2,500 2 5,000 1 2,500 - - 10,000
More than 1460 9% - 11% 3 8,667 10 24,729 12 27,229 19 31,374 91,999
Yearly repayment schedule
1096-1460 9% - 11% - - 1 3,750 1 3,750 - - 7,500
More than 14609% - 11% - - 1 2,500 1 2,500 2 5,000 10,000
11% - 12% - - 1 2,500 1 2,500 2 5,000 10,000
Bullet repayment schedule
731-10959% - 11% - - - - 1 7,500 - - 7,500
11% -12 % - - 1 10,000 - - - - 10,000
1096-1460 9% - 11% - - 2 21,500 - - - - 21,500
Total 87 1,01,229 110 1,91,596 61 88,070 50 63,742 4,44,637
Terms of repayment of term loan as on March 31, 2015
Original maturity of loan(in no. of days)
Rate of interest
Due within 1 year Due 1 to 2 Years Due 2 to 3 Years More than 3 Years Total
No. of installments
Rupees Lakhs
No. of installments
Rupees Lakhs
No. of installments
Rupees Lakhs
No. of installments
Rupees Lakhs
Rupees Lakhs
Monthly repayment schedule
More than 1460 11% - 12% 12 1,632 12 1,632 12 1,632 13 1,833 6,729
Quarterly repayment schedule
366-720 9% - 11% 4 2,500 1 625 - - - - 3,125
731-1095
9% - 11% - - 8 11,250 8 11,250 - - 22,500
11% - 12% 10 7,311 9 6,895 2 1,362 - - 15,568
12% - 13% 19 23,857 5 4,374 1 625 - - 28,856
1096-1460 11% - 12% - - 2 1,000 4 2,000 4 2,000 5,000
More than 1460
9% - 11% 1 278 4 1,110 4 3,613 - - 5,000
11% - 12% 14 11,120 28 20,356 24 38,523 - - 70,000
12% - 13% 2 2,500 4 5,000 2 2,500 - - 10,000
Bullet repayment schedule
731-109511% - 12% - - - - 1 10,000 - - 10,000
12% - 13% 1 10,000 - - - - - - 10,000
1096-1460 9% - 11% - - - - 1 11,500 - - 11,500
More than 1460 9% - 11% - - - - 1 10,000 - - 10,000
Total 63 59,198 73 52,242 60 93,005 17 3,833 2,08,278
Terms of repayment of term loan as on March 31, 2014
Notes to financial Statements for the year ended March 31, 2015
5 LONG TERM BORROWINGS (contd.)

119Annual Report 2015 Fullerton India Credit Company Limited
Original maturity of loan(in no. of days)
Rate of interest
Annualised Yield
Due within 1 year
Due 1 to 2 Years
Due 2 to 3 Years
More than 3 Years
Total
Rupees Lakhs Rupees Lakhs Rupees Lakhs Rupees Lakhs Rupees Lakhs
Issued at par and redeemable at par
366-7308% - 9% 20,500 - - - 20,500
9% - 11% 750 - - - 750
731-10959% - 11% 23,500 8,800 - - 32,300
11% - 12% 39,100 - - - 39,100
1096-1460 9% - 11% 7,500 18,500 7,500 - 33,500
More than 14609% - 11% - 1,000 1,000 89,000 91,000
11% - 12% - - - 20,000 20,000
Total 91,350 28,300 8,500 1,09,000 2,37,150
Terms of repayment of non-convertible debentures as on March 31, 2015
ParticularsFace Value (Rupees
Lakhs)Quantity Date of Redemption March 31, 2015 March 31, 2014
10.45% Series 27C 5 500 November 3, 2023 2,500 2,500
9.85% Series 24 10 400 May 22, 2023 4,000 4,000
10.60% Series 22 10 750 April 28, 2023 7,500 7,500
10.00% Series 29A-II 5 1,800 December 30, 2021 9,000 -
9.85% Series 29A-I 5 1,200 April 14, 2020 6,000 -
9.30% Series 30DII 10 250 January 29, 2020 2,500 -
9.42% Series 30B 10 500 December 9, 2019 5,000 -
9.90% Series 28 5 3,000 June 24, 2019 15,000 -
9.30% Series 30DI 10 250 January 29, 2019 2,500 -
10.90% Series 27F 5 1,000 January 7, 2019 5,000 5,000
11.00% Series 27E 5 1,000 December 10, 2018 5,000 5,000
9.30% Series 25 10 500 June 14, 2018 5,000 5,000
9.50% Series 23 10 1,000 May 8, 2018 10,000 10,000
10.05% Series 31A 10 500 March 12, 2018 5,000 -
9.20% Series 30C 10 250 January 23, 2018 2,500 -
10.00% Series 20E 10 100 January 15, 2018 1,000 1,000
10.29% Series 27G 5 360 January 27, 2017 1,800 1,800
10.00% Series-20D 10 100 January 15, 2017 1,000 1,000
Particulars of Secured Redeemable Non-convertible Debentures:
Original maturity of loan(in no. of days)
Rate of interest
Annualised Yield
Due within 1 year
Due 1 to 2 Years
Due 2 to 3 Years
More than 3 Years
Total
Rupees Lakhs Rupees Lakhs Rupees Lakhs Rupees Lakhs Rupees Lakhs
Issued at par and redeemable at par
366-730 9% - 11% - 750 - - 750
731-1095
9% - 11% 8,000 - 8,800 - 16,800
11% - 12% 1,500 30,000 - - 31,500
12% - 13% - 10,000 - - 10,000
1096-14609% - 11% - 7,500 1,000 - 8,500
11% - 12% 26,000 - - - 26,000
More than 14609% - 11% 21,000 23,500 18,500 45,000 1,08,000
11% - 12% 10,000 20,000 - 20,000 50,000
Issued at discount and redeemable at par
731-1095 Zero Coupon 11% to 12% 3,565 - - - 3,565
Total 70,065 91,750 28,300 65,000 2,55,115
Terms of repayment of non-convertible debentures as on March 31, 2014
Notes to financial Statements for the year ended March 31, 2015
5 LONG TERM BORROWINGS (contd.)
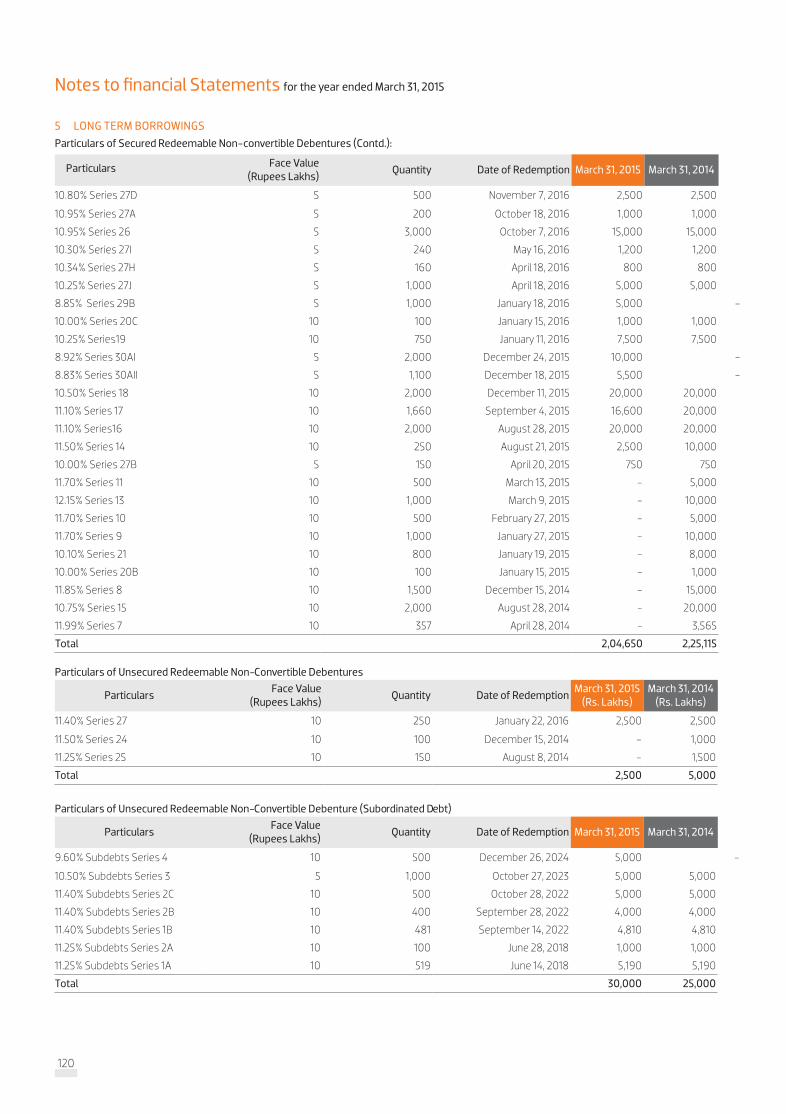
120
Particulars of Secured Redeemable Non-convertible Debentures (Contd.):
Particulars Face Value (Rupees Lakhs)
Quantity Date of Redemption March 31, 2015 March 31, 2014
10.80% Series 27D 5 500 November 7, 2016 2,500 2,500
10.95% Series 27A 5 200 October 18, 2016 1,000 1,000
10.95% Series 26 5 3,000 October 7, 2016 15,000 15,000
10.30% Series 27I 5 240 May 16, 2016 1,200 1,200
10.34% Series 27H 5 160 April 18, 2016 800 800
10.25% Series 27J 5 1,000 April 18, 2016 5,000 5,000
8.85% Series 29B 5 1,000 January 18, 2016 5,000 -
10.00% Series 20C 10 100 January 15, 2016 1,000 1,000
10.25% Series19 10 750 January 11, 2016 7,500 7,500
8.92% Series 30AI 5 2,000 December 24, 2015 10,000 -
8.83% Series 30AII 5 1,100 December 18, 2015 5,500 -
10.50% Series 18 10 2,000 December 11, 2015 20,000 20,000
11.10% Series 17 10 1,660 September 4, 2015 16,600 20,000
11.10% Series16 10 2,000 August 28, 2015 20,000 20,000
11.50% Series 14 10 250 August 21, 2015 2,500 10,000
10.00% Series 27B 5 150 April 20, 2015 750 750
11.70% Series 11 10 500 March 13, 2015 000,5 -
12.15% Series 13 10 1,000 March 9, 2015 000,01 -
11.70% Series 10 10 500 February 27, 2015 000,5 -
11.70% Series 9 10 1,000 January 27, 2015 000,01 -
10.10% Series 21 10 800 January 19, 2015 000,8 -
10.00% Series 20B 10 100 January 15, 2015 000,1 -
11.85% Series 8 10 1,500 December 15, 2014 000,51 -
10.75% Series 15 10 2,000 August 28, 2014 000,02 -
11.99% Series 7 10 357 April 28, 2014 565,3 -
Total 2,04,650 2,25,115
ParticularsFace Value
(Rupees Lakhs)Quantity Date of Redemption
March 31, 2015 (Rs. Lakhs)
March 31, 2014 (Rs. Lakhs)
11.40% Series 27 10 250 January 22, 2016 2,500 2,500
11.50% Series 24 10 100 December 15, 2014 000,1 -
11.25% Series 25 10 150 August 8, 2014 005,1 -
Total 2,500 5,000
Particulars of Unsecured Redeemable Non-Convertible Debentures
ParticularsFace Value
(Rupees Lakhs)Quantity Date of Redemption March 31, 2015 March 31, 2014
9.60% Subdebts Series 4 10 500 December 26, 2024 5,000 -
10.50% Subdebts Series 3 5 1,000 October 27, 2023 5,000 5,000
11.40% Subdebts Series 2C 10 500 October 28, 2022 5,000 5,000
11.40% Subdebts Series 2B 10 400 September 28, 2022 4,000 4,000
11.40% Subdebts Series 1B 10 481 September 14, 2022 4,810 4,810
11.25% Subdebts Series 2A 10 100 June 28, 2018 1,000 1,000
11.25% Subdebts Series 1A 10 519 June 14, 2018 5,190 5,190
Total 30,000 25,000
)tbeD detanidrobuS( erutnebeD elbitrevnoC -noN elbameedeR derucesnU fo sralucitraP
Notes to financial Statements for the year ended March 31, 2015
5 LONG TERM BORROWINGS

121Annual Report 2015 Fullerton India Credit Company Limited
Particulars March 31, 2015 March 31, 2014
Rupees Lakhs Rupees Lakhs
Interest accrued but not due on debentures 497 73
Employee benefits payable 753 545
Unamortised income
Unamortised loan processing fees 5,015 2,660
Unamortised income on asset assignment - 14
Others 2 2
Others 248 214
Total 6,515 3,508
Long Term Short Term
Particulars March 31, 2015 March 31, 2014 March 31, 2015 March 31, 2014
Rupees Lakhs Rupees Lakhs Rupees Lakhs Rupees Lakhs
Provision for employee benefits
Provision for gratuity (refer note 33) - - 170 271
Provision for superannuation - - 46 31
Provision for leave benefits - - 34 -
Other provisions
Provision for standard assets (refer note 2.2 (b)) 3,477 2,413 1,687 1,336
Provision for sub-standard assets (refer note 2.2 (c)) 4,494 2,250 - -
Provision for assigned loans - 251 - 632
Provision for security deposits 86 86 - -
Total 8,057 5,000 1,937 2,270
Particulars March 31, 2015 March 31, 2014
Rupees Lakhs Rupees Lakhs
Loan repayable on demand
Cash credit from banks (secured)* - 10,451
Cash credit from banks (unsecured) 5 -
Other loans and advances
Indian rupee loan from banks (secured)* 1,500 -
Commercial paper (unsecured) 88,910 72,749
Total 90,415 83,200
Secured borrowings 1,500 10,451
Unsecured borrowings 88,915 72,749
Total 90,415 83,200
*Cash Credit from banks and Indian rupee loan from bank is secured by first pari passu charge over all loan receivables.
Notes to financial Statements for the year ended March 31, 2015
6 OTHER LONG TERM LIABILITIES
7 PROVISIONS
8 SHORT TERM BORROWINGS

122
Particulars March 31, 2015 March 31, 2014Rupees Lakhs Rupees Lakhs
Other liabilities Current maturities of long term borrowings (refer note 5) 1,92,579 1,29,264 Expenses and other payable 7,051 5,349 (refer note 34 for details of dues to Micro Small and Medium Enterprises) Employee benefits payable 4,839 4,066 Bank balances (Book overdraft) 32,413 9,910 Interest accrued but not due
On debentures 11,461 13,553 On bank loans 359 447 On others 1 8
Undisputed statutory dues payable 896 717 Payable towards asset assignment 335 1,295 Others 5,542 4,616 Unamortised income
Unamortised loan processing fees 5,558 2,764 Unamortised income on asset assignment - 35 Others 31 45
Total 2,61,065 1,72,069
Notes to financial Statements for the year ended March 31, 2015
Particulars (Rupees Lakhs)
Office Equipments**
Furniture & Fixtures**
Computers & Accessories
Leasehold Improvements
Vehicles Land &
Building* Leased
assets Total
Cost At April 1, 2013 2,368 2,466 4,171 3,232 65 6 - 12,307 Addition 389 180 384 319 - - 96 1,369 Disposals 79 262 270 159 - - - 770 At March 31, 2014 2,678 2,384 4,285 3,392 65 6 96 12,906 Addition 518 232 647 95 65 - 28 1,585 Disposals 431 131 588 219 42 - - 1,411 At March 31, 2015 2,765 2,485 4,344 3,268 88 6 125 13,080 Depreciation - At April 1, 2013 1,878 1,965 3,641 2,666 27 - - 10,177 Charge for the year 292 250 298 251 37 - 13 1,142 Disposals 74 253 270 155 - - - 753 At March 31, 2014 2,096 1,962 3,669 2,762 65 - 13 10,567 Charge for the year 368 277 443 323 4 - 29 1,445 Disposals 430 124 588 216 42 - - 1,401 At March 31, 2015 2,034 2,115 3,524 2,868 27 - 42 10,611 Impairment - At April 1, 2013 8 14 3 13 - - - 38 Additions - - - - - - - - Charge for the year - - - - - - - - At March 31, 2014 8 14 3 13 - - - 38 Additions - - - - - - - - Charge for the year - - - - - - - - At March 31, 2015 8 14 3 13 - - - 38 Net Block At March 31, 2014 574 408 614 616 - 6 83 2,302 At March 31, 2015 723 356 818 386 61 6 83 2,432
All assets have been recognised at cost Capital Work in Progress At March 31, 2014 49 - 162 0 - - - 212 At March 31, 2015 38 1 197 2 - - - 237
* Mortgaged as security against Secured Non-Convertible debentures ** Refer note 2.2 (a)
9 OTHER CURRENT LIABILITIES
10 TANGIBLE ASSETS

123Annual Report 2015 Fullerton India Credit Company Limited
Particulars Computer Software
Total
Rupees Lakhs Rupees Lakhs Gross block At April 1, 2013 5,616 5,616 Additions 491 491 Disposals 13 13 At March 31, 2014 6,094 6,094 Additions 384 384 Disposals 319 319 At March 31, 2015 6,159 6,159 Depreciation At April 1, 2013 3,485 3,485 Charge for the year 976 976 Deductions - - At March 31, 2014 4,461 4,461 Charge for the year 864 864 Deductions 263 263 At March 31, 2015 5,062 5,062 Net block At March 31, 2014 1,633 1,633 At March 31, 2015 1,096 1,096 Capital Work in Progress At March 31, 2014 283 283 At March 31, 2015 890 890
Notes to financial Statements for the year ended March 31, 2015
Particulars March 31, 2015 March 31, 2014
Rupees Lakhs Rupees Lakhs
Non Trade Investments (valued at cost unless stated otherwise)
Investment in equity instruments (unquoted)
a) Wholly owned subsidiaries
1,00,00,000 (March 31, 2014: 20,00,000) equity shares of Rs. 10 each fully paid-up in Fullerton India Home Finance Company Limited
1,000 200
23,575 (March 31, 2014: 23,575) equity shares of Rs. 10 each fully paid-up in Fullerton India Foundation For Social & Economic Development
2 2
b ) Others
50,000 (March 31, 2014: 50,000) equity shares of Rs. 10 each fully paid-up in Alpha Micro Finance Consultants Private Limited
5 5
(A) 1,007 207
Less: Provision for diminution in value (B) (2) -
Net Value {(A)-(B)} 1,005 207
Aggregate amount of unquoted investments 1,007 207
11 INTANGIBLE ASSETS
12 NON-CURRENT INVESTMENTS

124
Notes to financial Statements for the year ended March 31, 2015
13 LOANS AND ADVANCES
Non-current Current
Particulars March 31, 2015 March 31, 2014 March 31, 2015 March 31, 2014
Rupees Lakhs Rupees Lakhs Rupees Lakhs Rupees Lakhs
Non Current bank balances (refer note 17) - 1,085 - -
Unamortised ancillary cost of borrowings 1,726 1,988 1,346 1,177
Unamortised loan Origination costs 4,514 2,057 2,952 1,602
Interest accrued and due
On secured loans - - 324 292
On unsecured loans - - 600 649
Interest Accrued but not due
On deposits placed with banks - 125 1,385 434
On government securities - - 8 -
On debentures and bonds - - 105 -
On secured loans - - 3,599 2,569
On unsecured loans - - 7,674 6,317
Total 6,240 5,255 17,993 13,041
14 OTHER ASSETS
Non-current Current
Particulars March 31, 2015 March 31, 2014 March 31, 2015 March 31, 2014
Rupees Lakhs Rupees Lakhs Rupees Lakhs Rupees Lakhs
A Portfolio loans
a. Secured, considered good*
Loans 3,28,881 1,95,652 45,023 41,870
b. Secured, considered doubtful**
Loans 12,722 7,039 - -
c. Unsecured, considered good*
Loans 2,39,584 1,90,406 2,30,803 1,71,881
d. Unsecured, considered doubtful**
Loans 3,963 3,452 - -
Sub-Total 5,85,150 3,96,549 2,75,826 2,13,751
B Security deposits
Unsecured, considered good 1,407 1,339 38 53
Unsecured, considered doubtful 86 86 - -
Sub-Total 1,493 1,425 38 53
C Advances recoverable in cash or in kind or for value to be received
Unsecured, considered good 440 1,158 - -
Sub-Total 440 1,158 - -
D Other loans and advances
Retained interest receivable on asset assignment - 34 - 85
Advance Income Tax (net of provision for tax ) 369 906 - -
MAT credit entitlement 14,136 7,371 - -
Prepaid expenses 34 77 638 686
Loans and advances to employees 6 11 9 7
Others 6 5 759 825
Sub-Total 14,551 8,404 1,406 1,603
E Capital advances
Unsecured, considered good 158 233 - -
Sub-Total 158 233 - -
Total (A+B+C+D+E) 6,01,792 4,07,769 2,77,270 2,15,407
* Represents standard assets in accordance with Company’s asset classification policy [refer note 2.1 (g)].
** Represents non-performing assets in accordance with Company’s asset classification policy [refer note 2.1 (g)].
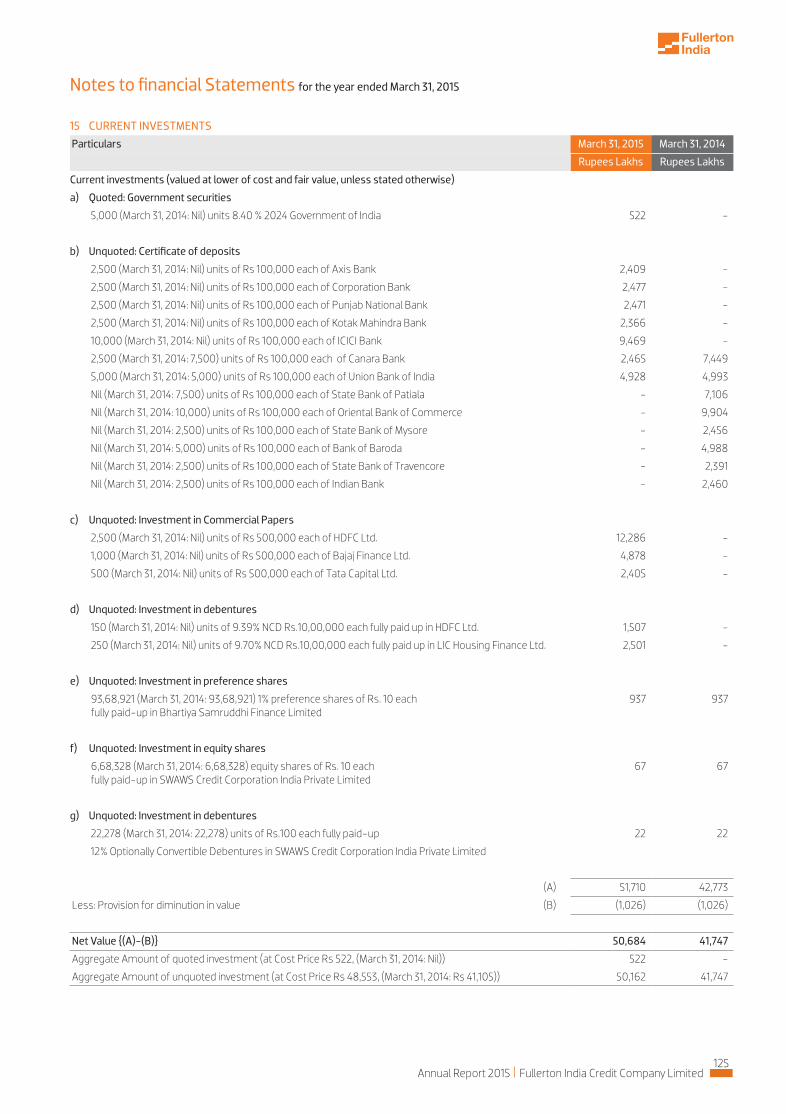
125Annual Report 2015 Fullerton India Credit Company Limited
Particulars March 31, 2015 March 31, 2014
Rupees Lakhs Rupees Lakhs
Current investments (valued at lower of cost and fair value, unless stated otherwise)
a) Quoted: Government securities
5,000 (March 31, 2014: Nil) units 8.40 % 2024 Government of India 522 -
b) Unquoted: Certificate of deposits
2,500 (March 31, 2014: Nil) units of Rs 100,000 each of Axis Bank 2,409 -
2,500 (March 31, 2014: Nil) units of Rs 100,000 each of Corporation Bank 2,477 -
2,500 (March 31, 2014: Nil) units of Rs 100,000 each of Punjab National Bank 2,471 -
2,500 (March 31, 2014: Nil) units of Rs 100,000 each of Kotak Mahindra Bank 2,366 -
10,000 (March 31, 2014: Nil) units of Rs 100,000 each of ICICI Bank 9,469 -
2,500 (March 31, 2014: 7,500) units of Rs 100,000 each of Canara Bank 2,465 7,449
5,000 (March 31, 2014: 5,000) units of Rs 100,000 each of Union Bank of India 4,928 4,993
Nil (March 31, 2014: 7,500) units of Rs 100,000 each of State Bank of Patiala - 7,106
Nil (March 31, 2014: 10,000) units of Rs 100,000 each of Oriental Bank of Commerce - 9,904
Nil (March 31, 2014: 2,500) units of Rs 100,000 each of State Bank of Mysore - 2,456
Nil (March 31, 2014: 5,000) units of Rs 100,000 each of Bank of Baroda - 4,988
Nil (March 31, 2014: 2,500) units of Rs 100,000 each of State Bank of Travencore - 2,391
Nil (March 31, 2014: 2,500) units of Rs 100,000 each of Indian Bank - 2,460
c) Unquoted: Investment in Commercial Papers
2,500 (March 31, 2014: Nil) units of Rs 500,000 each of HDFC Ltd. 12,286 -
1,000 (March 31, 2014: Nil) units of Rs 500,000 each of Bajaj Finance Ltd. 4,878 -
500 (March 31, 2014: Nil) units of Rs 500,000 each of Tata Capital Ltd. 2,405 -
d) Unquoted: Investment in debentures
150 (March 31, 2014: Nil) units of 9.39% NCD Rs.10,00,000 each fully paid up in HDFC Ltd. 1,507 -
250 (March 31, 2014: Nil) units of 9.70% NCD Rs.10,00,000 each fully paid up in LIC Housing Finance Ltd. 2,501 -
e) Unquoted: Investment in preference shares
93,68,921 (March 31, 2014: 93,68,921) 1% preference shares of Rs. 10 each fully paid-up in Bhartiya Samruddhi Finance Limited
937 937
f) Unquoted: Investment in equity shares
6,68,328 (March 31, 2014: 6,68,328) equity shares of Rs. 10 each fully paid-up in SWAWS Credit Corporation India Private Limited
67 67
g) Unquoted: Investment in debentures
22,278 (March 31, 2014: 22,278) units of Rs.100 each fully paid-up 22 22
12% Optionally Convertible Debentures in SWAWS Credit Corporation India Private Limited
(A) 51,710 42,773
Less: Provision for diminution in value (B) (1,026) (1,026)
Net Value {(A)-(B)} 50,684 41,747
Aggregate Amount of quoted investment (at Cost Price Rs 522, (March 31, 2014: Nil)) 522 -
Aggregate Amount of unquoted investment (at Cost Price Rs 48,553, (March 31, 2014: Rs 41,105)) 50,162 41,747
Notes to financial Statements for the year ended March 31, 2015
15 CURRENT INVESTMENTS

126
Non-current Current
Particulars March 31, 2015 March 31, 2014 March 31, 2015 March 31, 2014
Rupees Lakhs Rupees Lakhs Rupees Lakhs Rupees Lakhs
Other receivable
Unsecured, considered good - - 254 267
Total - - 254 267
Non-current Current
Particulars March 31, 2015 March 31, 2014 March 31, 2015 March 31, 2014
Rupees Lakhs Rupees Lakhs Rupees Lakhs Rupees Lakhs
Cash and cash equivalents:
Cash on hand - - 1,151 819
Balances with Banks
- On Current accounts - - 7,782 12,671
- Deposits with original maturity of less than 3 months* - - - 19,615
(A) - - 8,934 33,105
Other bank balances
- Deposits with original maturity for more than 12 months* - 1,085 20,400 5,588
- Deposits with original maturity for more than 3 months* - - 24,706 -
but less than 12 months
(B) - 1,085 45,106 5,588
- 1,085 54,039 38,693
Less: amount disclosed under non current assets (refer note14) - (1,085) - -
Total {(A)+(B)} - - 54,039 38,693
* Rs. Nil lakhs (March 31, 2014 : Rs. 6,188 lakhs) Pledged against working capital limit sanctioned by banks and pledged as cash collateral in connection with asset assignment.
ParticularsYear ended
March 31, 2015Year ended
March 31, 2014Rupees Lakhs Rupees Lakhs
Interest income on loans 1,50,527 1,20,694 Income from asset assignment 140 463 Interest on bank deposits 3,003 814 Interest on investments 3,500 2,753 Other operating revenue
Processing charges 6,822 2,669 Ancillary income from operations 3,832 5,460
Total 1,67,824 1,32,853
ParticularsYear ended
March 31, 2015Year ended
March 31, 2014Rupees Lakhs Rupees Lakhs
Profit on sale of investments 1,941 4,488 Miscellaneous income 2,259 1,419 Total 4,200 5,908
Notes to financial Statements for the year ended March 31, 2015
16 TRADE RECEIVABLE
17 CASH AND BANK BALANCES
18 REVENUE FROM OPERATIONS
19 OTHER INCOME
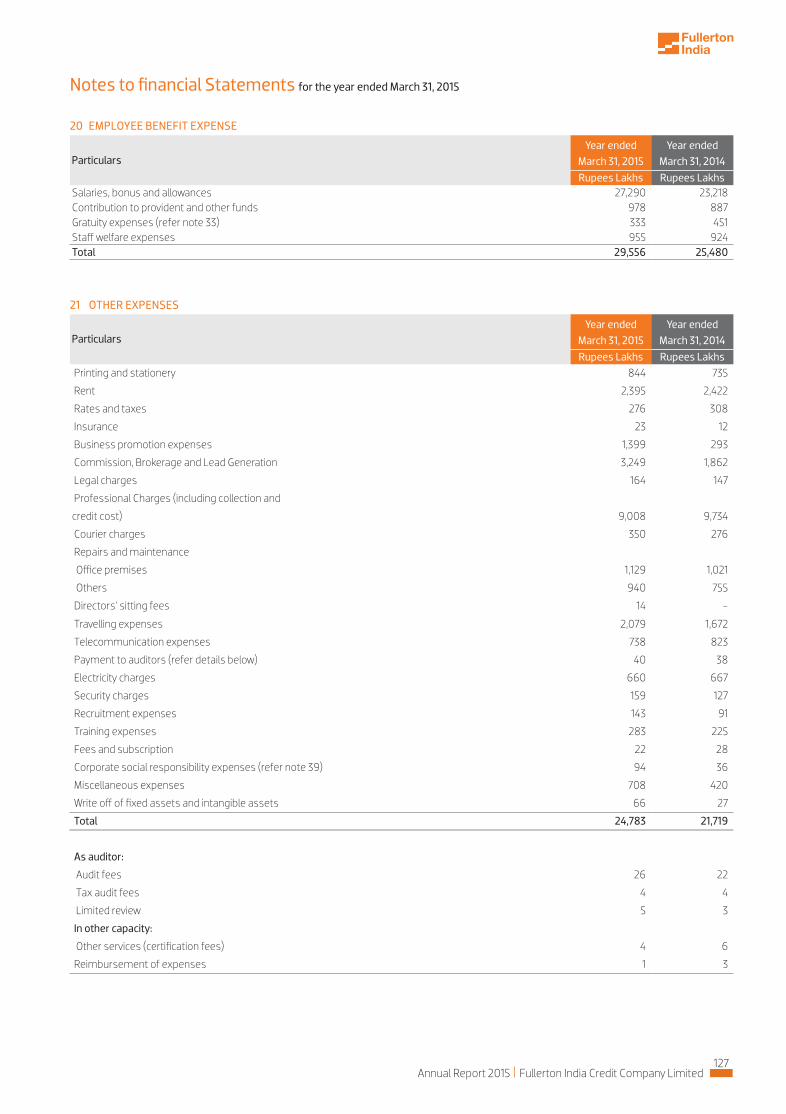
127Annual Report 2015 Fullerton India Credit Company Limited
ParticularsYear ended
March 31, 2015Year ended
March 31, 2014Rupees Lakhs Rupees Lakhs
Salaries, bonus and allowances 27,290 23,218 Contribution to provident and other funds 978 887 Gratuity expenses (refer note 33) 333 451 Staff welfare expenses 955 924 Total 29,556 25,480
ParticularsYear ended
March 31, 2015Year ended
March 31, 2014Rupees Lakhs Rupees Lakhs
Printing and stationery 844 735
Rent 2,395 2,422
Rates and taxes 276 308
Insurance 23 12
Business promotion expenses 1,399 293
Commission, Brokerage and Lead Generation 3,249 1,862
Legal charges 164 147
Professional Charges (including collection and
credit cost) 9,008 9,734
Courier charges 350 276
Repairs and maintenance
Office premises 1,129 1,021
Others 940 755
Directors' sitting fees 14 -
Travelling expenses 2,079 1,672
Telecommunication expenses 738 823
Payment to auditors (refer details below) 40 38
Electricity charges 660 667
Security charges 159 127
Recruitment expenses 143 91
Training expenses 283 225
Fees and subscription 22 28
Corporate social responsibility expenses (refer note 39) 94 36
Miscellaneous expenses 708 420
Write off of fixed assets and intangible assets 66 27
Total 24,783 21,719
As auditor:
Audit fees 26 22
Tax audit fees 4 4
Limited review 5 3
In other capacity:
Other services (certification fees) 4 6
Reimbursement of expenses 1 3
Notes to financial Statements for the year ended March 31, 2015
20 EMPLOYEE BENEFIT EXPENSE
21 OTHER EXPENSES

128
ParticularsYear ended
March 31, 2015Year ended
March 31, 2014Rupees Lakhs Rupees Lakhs
Interest
On loans from banks 32,662 17,480
On debentures 27,360 24,824
Premium/Discount on redemption of debentures 176 493
Discount on commercial papers 8,635 11,316
Amortisation of ancillary borrowing costs 1,466 1,511
Interest on advance tax 1 31
Bank charges and Others 560 512
Total 70,860 56,167
ParticularsYear ended
March 31, 2015Year ended
March 31, 2014Rupees Lakhs Rupees Lakhs
Bad debts written off during the year (net of recoveries) 11,520 11,543
Provision against assigned loans (761) (91)
Provision against standard assets (refer note 2.2 (b)) 1,415 2,367
Provision against sub standard assets (refer note 2.2 (c)) 2,244 564
Provision for diminution in value of investments 2 150
Unrealised loss on investments - (49)
Total 14,420 14,484
ParticularsYear ended
March 31, 2015Year ended
March 31, 2014Rupees Lakhs Rupees Lakhs
Profit after Tax 30,096 18,794
Weighted average number of shares used in computing basic earnings per share 1,85,86,61,357 1,85,86,61,357
Add: Weighted average number of equity shares for Nil
consideration arising on grant of equity stock options - -
Weighted average number of equity shares in calculating diluted EPS 1,85,86,61,357 1,85,86,61,357
Earnings per Share :
Basic (Rs.) 1.62 1.01
Diluted (Rs.) 1.62 1.01
[Nominal value of shares is Rs. 10 each (Previous Year : Rs. 10)]
25. SEGMENT INFORMATION
segment, i.e. domestic.
Notes to financial Statements for the year ended March 31, 2015
22 FINANCE COSTS
23 PROVISIONS AND WRITE OFFS
24 EARNINGS PER SHARE

129Annual Report 2015 Fullerton India Credit Company Limited
ParticularsYear ended
March 31, 2015Year ended
March 31, 2014Rupees Lakhs Rupees Lakhs
Total numbers of loans assigned – 668
Total book value of the loans assigned – 11,535
Sale consideration received for the loan asset assigned – 11,535
Income from asset assignment recognised in the statement of profit and loss 140 463
Particulars As at March 31, 2015
As at March 31, 2014
Credit enhancements provided and outstanding:
Interest subordination – 21
Cash collateral – 4,961
26. ASSIGNMENT OF LOANS
During the year Company has not transferred any loans through direct assignment. However, the information on direct assignment activity of the
Company as an originator in earlier years is given below:
given below:
ParticularsYear ended
March 31, 2015Year ended
March 31, 2014Rupees Lakhs Rupees Lakhs
No of transactions assigned by the Company NIL 2
Total amount outstanding 5,941 9,453
Total amount of exposures retained by the company to comply with MRR as on the date of balance sheet 660 1,050
a) Off-balance sheet exposures - -
First loss - -
Others - -
b) On-balance sheet exposures 660 1,050
First loss - -
Others 660 1,050
Amount of exposures to assigned transactions other than MRR
a) Off-balance sheet exposures
i) Exposure to own assignment
First loss - -
Others - -
ii) Exposure to third party assigned transactions
First loss - -
Others - -
b) On-balance sheet exposures
i) Exposure to own assignment
First loss - -
Others - -
ii) Exposure to third party assigned transactions
First loss - -
Others - -
Notes to financial Statements for the year ended March 31, 2015

130
27. RELATED PARTY DISCLOSURES
Names and other details of related parties
28. LEASES
a) Where the Company is the lessee:
b) Where the Company is the lessor:
market conditions.
Ultimate Holding Company Temasek Holdings (Private) Limited
Holding CompaniesAngelica Investments Pte Ltd, Singapore (‘Angelica’)
Fullerton Financials Holdings Pte Ltd (Holding Company of Angelica)
Fellow Subsidiary
Fullerton Securities & Wealth Advisors Ltd.
Fullerton Financial Holdings (International) Pte Ltd
Temasek International (Private) Limited
SubsidiaryFullerton India Foundation for Social & Economic Development (Not for profit Company)
Fullerton India Home Finance Company Ltd.
Key Management Personnel Mr. Shantanu Mitra, Chief Executive Officer and Managing Director
Transactions during the year Holding Companies Subsidiaries
Key Management Personnel
Fellow Subsidiary Total
March 31, 2015
March 31, 2014
March 31, 2015
March 31, 2014
March 31, 2015
March 31, 2014
March 31, 2015
March 31, 2014
March 31, 2015
March 31, 2014
Reimbursement for expenses incurred on behalf of the Company
3 - - - - 35 12 38 12
Expenses incurred by the Company on behalf of others
- - - 4 - - 1 - 1 4
Investment on equity shares - - 800 - - - - - 800 -
Salary and employee benefits
Mr. Shantanu Mitra - - - - 720 643 - - 720 643
Balance outstanding as at the year end
Investment in equity shares
Fullerton India Home Finance Company Ltd - - 1,000 200 - - - - 1,000 200
Fullerton India Foundation for Social & Economic Development
- - 2 2 - - - - 2 2
Other Receivables
Fullerton India Home Finance Company Ltd - - - 1 - - - - - 1
Fullerton India Foundation for Social & Economic Development
- - - 0 - - - - - 0
(Rupees Lakhs)
ParticularsYear ended
March 31, 2015Year ended
March 31, 2014Rupees Lakhs Rupees Lakhs
Operating lease payments recognised during the year 2,756 2,728
Minimum Lease Obligations
Not later than one year 2,374 2,620
Later than one year but not later than five years 2,327 3,697
Later than five years 533 473
Notes to financial Statements for the year ended March 31, 2015

131Annual Report 2015 Fullerton India Credit Company Limited
ParticularsYear ended
March 31, 2015Year ended
March 31, 2014Rupees Lakhs Rupees Lakhs
Operating lease rental recognised during the year 31 10
Minimum Lease Obligations
Not later than one year 32 21
Later than one year but not later than five years 53 74
Later than five years - -
29. CASH AND CASH EQUIVALENTS FOR THE PURPOSE OF CASH FLOW STATEMENT
ParticularsMarch 31, 2015 March 31, 2014
Rupees Lakhs Rupees Lakhs
Cash and Bank Balance (refer note 17 ) 54,039 38,693
Less: Other bank balances (refer note 17) (45,106) (5,588)
Balance considered as Cash and Cash Equivalents for Cash Flow Statement 8,934 33,105
ParticularsMarch 31, 2015 March 31, 2014
Rupees Lakhs Rupees Lakhs
Credit enhancement provided by the Company for the loans under assignment arrangements (including cash collaterals and interest subordination)
- 4,982
Contingent liability for litigations pending against the Company 20 22
30. CONTINGENT LIABILITY AND COMMITMENTS
a) Contingent liabilities:
b) Capital and other commitments
Estimated amount of contracts remaining to be executed on capital account and not provided for as at March 31, 2015 is Rs. 775 Lakhs (March 31,
2014: Rs. 594 Lakhs).
Loans sanctioned not yet disbursed as at March 31, 2015 were Rs. 5,578 Lakhs (March 31, 2014: Rs. 2,014 Lakhs).
c)
necessary.
management does not reasonably expect that these legal actions, when ultimately concluded and determined, will have a material and adverse
effect on the Company’s results of operations or financial condition.
31. EXPENDITURE IN FOREIGN CURRENCY
Expenditure in Foreign Currency (Accrual Basis)Year ended
March 31, 2015Year ended
March 31, 2014Rupees Lakhs Rupees Lakhs
Travelling 39 12
Bank charges and Others 31 -
Training expenses 55 79
Business promotion expenses 6 6
Repairs and maintenance 10 -
Miscellaneous expenses - 1
Total 141 98
Notes to financial Statements for the year ended March 31, 2015

132
32. EMPLOYEE STOCK APPRECIATION RIGHTS
Grant 1 Grant 2 Grant 3 Grant 4
Date of Grant 30-Nov-11 1-Apr-13 1-Apr-13 1-Apr-14
Value of the Grant Rs. 568 Lakhs Rs. 706 Lakhs Rs. 741 Lakhs Rs. 750 Lakhs
Performance Condition Achievement of Profit
before tax (PBT) and Return
on Equity (ROE) targets as
per approved business plan
Achievement of Profit
before tax (PBT) and Return
on Equity (ROE) targets as
per approved business plan
Achievement of Profit
before tax (PBT) and Return
on Equity (ROE) targets as
per approved business plan
Achievement of Profit
before tax (PBT) and Return
on Equity (ROE) targets as
per approved business plan
Graded Vesting (subject
to achievement of
performance condition
given above)
Tranche I: 33% vesting on
1st December 2013
Tranche I: 33% vesting on
1st December 2015
Tranche I: 33% vesting on
1st December 2016
Tranche I: 33% vesting on 1st
December 2017
Tranche II: 33% vesting on
1st December 2014
Tranche II: 33% vesting on
1st December 2016
Tranche II: 33% vesting on
1st December 2017
Tranche II: 33% vesting on
1st December 2018
Tranche III: 34% vesting on
1st December 2015
Tranche III: 34% vesting on
1st December 2017
Tranche III: 34% vesting on
1st December 2018
Tranche III: 34% vesting on
1st December 2019
Vesting period (including
performance period)
Tranche I: 2 years Tranche I: 2 years 8 months Tranche I: 3 years 8 months Tranche I: 3 years 8 months
Tranche II: 3 years Tranche II: 3 years 8
months
Tranche II: 4 years 8
months
Tranche II: 4 years 8 months
Tranche III: 4 years Tranche III: 4 years 8
months
Tranche III: 5 years 8
months
Tranche III: 5 years 8
months
Exercise period Within 30 days from each vesting date but not later than 2 years from the date of last vesting.
Particulars Grant 1 Grant 2 Grant 3 Grant 4
As at March 31, 2015 Rs. 19.59 Rs. 14.53 Rs. 14.53 Rs. 12.38
As at March 31, 2014 Rs. 15.36 Rs. 11.74 Rs. 11.74 Nil
As at March 31, 2013 Rs. 12.78 Nil Nil Nil
Exercise price Vest 1 Rs. 12.78 Nil Nil Nil
Exercise price Vest 2 Rs. 15.36 Nil Nil Nil
Fair value is computed using the method provided in the scheme for estimating the valuation of the grant which is linked to the Net Book Value of the
business.
Adjustment has been made for the resignations during the year ended March 31, 2015 and the consequential impact of forfeiture of the grant.
33. RETIREMENT AND OTHER EMPLOYEE BENEFITS
days salary (last drawn salary) for each completed year of service.
in the balance sheet for the plan.
ParticularsMarch 31, 2015 March 31, 2014
Rupees Lakhs Rupees Lakhs
Grants Outstanding at the beginning of the year 1,420 491
Grant made during the year 750 1,447
Grants forfeited on resignation of employee 209 402
Grants vested 111 128
Grants exercised 97 116
Grants outstanding – unvested 1,839 1,409
Grants outstanding – vested and exercisable 26 11
Expenses arising from grants made 686 475
Notes to financial Statements for the year ended March 31, 2015
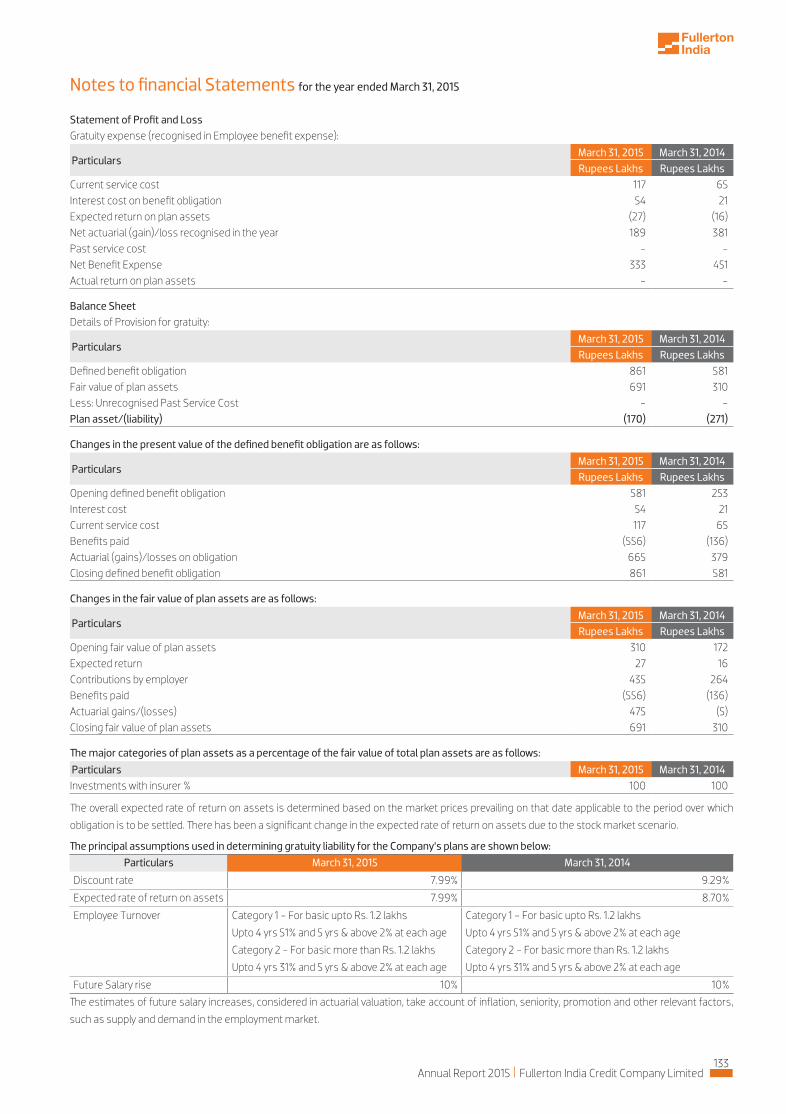
133Annual Report 2015 Fullerton India Credit Company Limited
Statement of Profit and Loss Gratuity expense (recognised in Employee benefit expense):
ParticularsMarch 31, 2015 March 31, 2014Rupees Lakhs Rupees Lakhs
Current service cost 117 65Interest cost on benefit obligation 54 21Expected return on plan assets (27) (16)Net actuarial (gain)/loss recognised in the year 189 381Past service cost - -Net Benefit Expense 333 451Actual return on plan assets - -
Changes in the present value of the defined benefit obligation are as follows:
ParticularsMarch 31, 2015 March 31, 2014Rupees Lakhs Rupees Lakhs
Opening defined benefit obligation 581 253Interest cost 54 21Current service cost 117 65Benefits paid (556) (136)Actuarial (gains)/losses on obligation 665 379Closing defined benefit obligation 861 581
Changes in the fair value of plan assets are as follows:
ParticularsMarch 31, 2015 March 31, 2014Rupees Lakhs Rupees Lakhs
Opening fair value of plan assets 310 172Expected return 27 16Contributions by employer 435 264Benefits paid (556) (136)Actuarial gains/(losses) 475 (5)Closing fair value of plan assets 691 310
Particulars March 31, 2015 March 31, 2014Investments with insurer % 100 100
Balance SheetDetails of Provision for gratuity:
ParticularsMarch 31, 2015 March 31, 2014Rupees Lakhs Rupees Lakhs
Defined benefit obligation 861 581Fair value of plan assets 691 310Less: Unrecognised Past Service Cost - -Plan asset/(liability) (170) (271)
Notes to financial Statements for the year ended March 31, 2015
such as supply and demand in the employment market.
Particulars March 31, 2015 March 31, 2014
Discount rate 7.99% 9.29%
Expected rate of return on assets 7.99% 8.70%
Employee Turnover Category 1 - For basic upto Rs. 1.2 lakhs
Upto 4 yrs 51% and 5 yrs & above 2% at each age
Category 2 - For basic more than Rs. 1.2 lakhs
Upto 4 yrs 31% and 5 yrs & above 2% at each age
Category 1 - For basic upto Rs. 1.2 lakhs
Upto 4 yrs 51% and 5 yrs & above 2% at each age
Category 2 - For basic more than Rs. 1.2 lakhs
Upto 4 yrs 31% and 5 yrs & above 2% at each age
Future Salary rise 10% 10%

134
Amounts for the current period and previous periods are as follows:
34.
confirmations from all suppliers. Based on the information received by the Company, some of the suppliers have confirmed to be registered under
MSMED Act, 2006. Accordingly the disclosure relating to amount unpaid as at the year ended together with interest paid/payable is disclosed
below:
35. a sa yrlewej dlog tsniaga naol gnidnatstuo eht 2102 ,12 hcraM detad 21-1102/10.01.30/562.oN.DP.CC.SBND on ralucric IBR eht yb deriuqer sA
percentage of total assets is Nil (March 31, 2014: Nil)
ParticularsMarch 31, 2015 March 31, 2014 March 31, 2013 March 31, 2012 March 31, 2011
Rupees Lakhs Rupees Lakhs Rupees Lakhs Rupees Lakhs Rupees Lakhs
Defined benefit obligation 861 581 253 229 186
Plan assets 691 310 172 148 180
Surplus/(deficit) (170) (271) (81) (81) (6)
Experience adjustments on plan liabilities 498 117 64 56 (36)
Experience adjustments on plan assets 477 (5) - (7) (4)
Sr No
ParticularsMarch 31, 2015 March 31, 2014
Rupees Lakhs Rupees Lakhs
1supplier as at the end of each accounting year
13 17
2Development Act, 2006, along with the amounts of the payment made to the supplier beyond the appointed day during each accounting year
- -
3but beyond the appointed day during the year) but without adding the interest specified under Micro Small and Medium Enterprise Development Act, 2006.
- -
4 - -
5when the interest dues as above are actually paid to the small enterprise for the purpose of disallowance as a deductible expenditure under section 23 of the Micro Small and Medium Enterprise Development Act, 2006.
- -
Notes to financial Statements for the year ended March 31, 2015
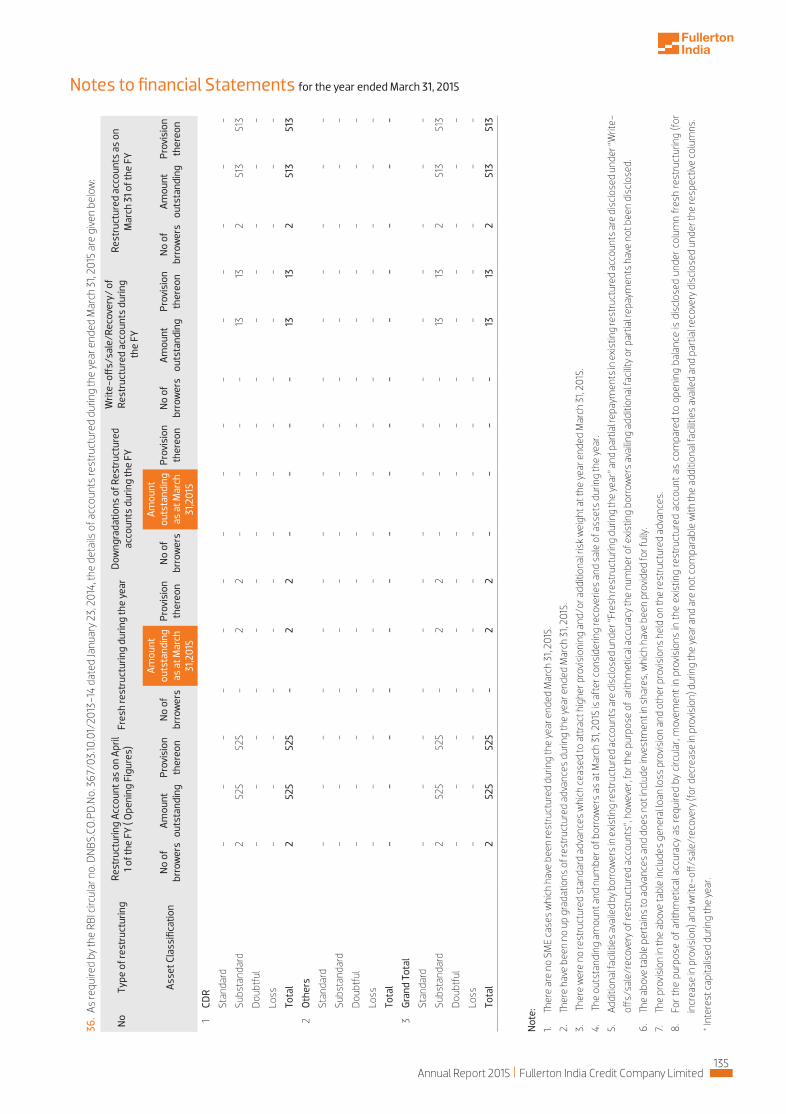
135Annual Report 2015 Fullerton India Credit Company Limited
36.
As re
quire
d by
the
RBI c
ircul
ar n
o. D
NBS
.CO
.PD
.No.
367
/03.
10.0
1/20
13-1
4 da
ted
Janu
ary
23, 2
014,
the
deta
ils o
f acc
ount
s re
stru
ctur
ed d
urin
g th
e ye
ar e
nded
Mar
ch 3
1, 20
15 a
re g
iven
belo
w:
Not
e:
1. 2.
3.
4.
5.
Addi
tiona
l fac
ilitie
s av
aile
d by
bor
row
ers
in e
xist
ing
rest
ruct
ured
acc
ount
s ar
e di
sclo
sed
unde
r “Fr
esh
rest
ruct
urin
g du
ring
the
year
” and
par
tial r
epay
men
ts in
exi
stin
g re
stru
ctur
ed a
ccou
nts
are
disc
lose
d un
der “
Writ
e-
offs/
sale
/rec
over
y of
rest
ruct
ured
acc
ount
s”, h
owev
er, f
or th
e pu
rpos
e of
arit
hmet
ical
acc
urac
y th
e nu
mbe
r of e
xist
ing
borr
ower
s av
ailin
g ad
ditio
nal f
acilit
y or
par
tial r
epay
men
ts h
ave
not b
een
disc
lose
d.
6.
7.
8.
For
the
purp
ose
of a
rithm
etic
al a
ccur
acy
as re
quire
d by
circ
ular
, mov
emen
t in
prov
isio
ns in
the
exis
ting
rest
ruct
ured
acc
ount
as
com
pare
d to
ope
ning
bal
ance
is d
iscl
osed
und
er c
olum
n fr
esh
rest
ruct
urin
g (fo
r
incr
ease
in p
rovi
sion
) and
writ
e-off
/sal
e/re
cove
ry (f
or d
ecre
ase
in p
rovi
sion
) dur
ing
the
year
and
are
not
com
para
ble
with
the
addi
tiona
l fac
ilitie
s av
aile
d an
d pa
rtia
l rec
over
y di
sclo
sed
unde
r the
resp
ectiv
e co
lum
ns.
* In
tere
st c
apita
lised
dur
ing
the
year
.
No
Type
of r
estr
uctu
ring
Rest
ruct
urin
g Ac
coun
t as
on A
pril
1 of t
he F
Y ( O
peni
ng F
igur
es)
Fres
h re
stru
ctur
ing
durin
g th
e ye
arD
owng
rada
tions
of R
estr
uctu
red
acco
unts
dur
ing
the
FY
Writ
e-off
s/sa
le/R
ecov
ery/
of
Rest
ruct
ured
acc
ount
s du
ring
the
FY
Res
truc
ture
d ac
coun
ts a
s on
M
arch
31 o
f the
FY
Ass
et C
lass
ifica
tion
No
of
brro
wer
sA
mou
nt
outs
tand
ing
Prov
isio
n th
ereo
nN
o of
br
row
ers
Am
ount
ou
tsta
ndin
g as
at M
arch
31
,201
5
Prov
isio
n th
ereo
nN
o of
br
row
ers
Am
ount
ou
tsta
ndin
g as
at M
arch
31
,201
5
Prov
isio
n th
ereo
nN
o of
br
row
ers
Am
ount
ou
tsta
ndin
gPr
ovis
ion
ther
eon
No
of
brro
wer
sA
mou
nt
outs
tand
ing
Prov
isio
n th
ereo
n
1CD
R
Stan
dard
- -
- -
- -
- -
- -
- -
- -
-
Subs
tand
ard
2 5
25
525
-
2
2
- -
- -
13
13
2
513
5
13
Dou
btfu
l -
- -
- -
- -
- -
- -
- -
- -
Loss
- -
- -
- -
- -
- -
- -
- -
-
Tota
l2
525
5
25
- 2
2
-
- -
- 13
13
2
5
13
513
2O
ther
s
Stan
dard
- -
- -
- -
- -
- -
- -
- -
-
Subs
tand
ard
- -
- -
- -
- -
- -
- -
- -
-
Dou
btfu
l -
- -
- -
- -
- -
- -
- -
- -
Loss
- -
- -
- -
- -
- -
- -
- -
-
Tota
l -
- -
- -
- -
- -
- -
- -
- -
3Gr
and
Tota
l
Stan
dard
- -
- -
- -
- -
- -
- -
- -
-
Subs
tand
ard
2
525
5
25
- 2
2
-
- -
- 13
13
2
5
13
513
Dou
btfu
l -
- -
- -
- -
- -
- -
- -
- -
Loss
- -
- -
- -
- -
- -
- -
- -
-
Tota
l 2
5
25
525
-
2
2
- -
- -
13
13
2
513
5
13
Notes to financial Statements for the year ended March 31, 2015

136
37. As required by the RBI circular no DNBS.PD.CC. No. 256 /03.10.042 / 2011-12 dated March 2, 2012 the details of frauds noticed / reported are as below:
ParticularsYear ended
March 31, 2015Year ended
March 31, 2014Rupees Lakhs Rupees Lakhs
Amount involved 187 48
Amount recovered 8 4
Amount written off/provided 179 44
Balance - -
38. Additional information as per Annexure 4 of Non-Banking Financial Companies – Corporate Governance (Reserve Bank) Directions, 2015 as
amended vide notification no. DNBR (PD) CC.No. 029/ 03.10.001/ 2014-15 dated April 10, 2015.
i) Capital ratio, along with details of Tier II capital
Items ParticularsMarch 31, 2015 March 31, 2014
Rupees Lakhs Rupees Lakhs
i) CRAR (%) 19.55% 22.45%
ii) CRAR - Tier I Capital (%) 15.92% 18.38%
iii) CRAR - Tier II Capital (%) 3.63% 4.07%
iv) Amount of subordinated debt raised as Tier-II capital 30,000 25,000
v) Amount raised by issue of Perpetual Debt Instruments - -
ii) Details of Investments
Sr No
ParticularsMarch 31, 2015 March 31, 2014
Rupees Lakhs Rupees Lakhs
A Value of Investments
(i) Gross Value of Investments
(a) In India 52,717 42,980
(b) Outside India, - -
(ii) Provisions for Depreciation
(a) In India 1,028 1,026
(b) Outside India, - -
(iii) Net Value of Investments
(a) In India 51,689 41,954
(b) Outside India, - -
B Movement of provisions held towards depreciation on investments
i) Opening balance 1,026 876
ii) Add : Provisions made during the year 2 247
iii) Less : Write-off / write-back of excess provisions during the year - 97
iv) Closing balance 1,028 1,026
iii) Derivatives
disclosure is made for the same.
iv) Securitisation
a)
b)
c)
previous year.
Notes to financial Statements for the year ended March 31, 2015

137Annual Report 2015 Fullerton India Credit Company Limited
vi) Exposuresa) Exposure to real estate sector
Sr No
ParticularsMarch 31, 2015 March 31, 2014
Rupees Lakhs Rupees Lakhs
a) Direct exposure
i) Residential Mortgages - Lending fully secured by mortgages on residential property that is or will be occupied by the borrower or that is rented
9,283 4,837
ii) Commercial Real Estate - Lending secured by mortgages on commercial real estates (office buildings, retail space, multi-purpose commercial premises, multi-family residential buildings, multi-tenanted commercial premises, industrial or warehouse space, hotels, land acquisition, development and construction, etc.). Exposure would also include non-fund based limits
- -
iii) Investments in Mortgage Backed Securities (MBS) and other securitised exposures -
a Residential - -
b Commercial Real Estate - -
v) Asset Liability Management Maturity pattern of certain items of Assets and Liabilities:
* Represents interest bearing loans
**Investments includes deposit with banks
Figures in bracket relate to previous year.
could be personal use in case of salaried individuals. As such, there is no direct real estate exposure except as disclosed above.
b) Exposure to capital market
c) Details of financing of parent company products
d) Details of Single Borrower Limit (SGL) / Group Borrower Limit (GBL) exceeded by the NBFC
e) Unsecured advances:
Particulars Up to 30/31 days
Over 1 month upto 2 months
Over 2 months upto 3 months
Over 3 months & up to 6 months
Rupees Lakhs Rupees Lakhs Rupees Lakhs Rupees Lakhs
Advances* 27,834 25,702 25,148 72,628
(22,597) (20,751) (19,549) (56,492)
Investments**
50,684 45 1,073 3,991
(44,247) (5,100) (2,588) (5,441)
Borrowings 3,442 29,757 6,004 71,240
(30,012) (18,092) (17,446) (77,109)
Particulars Over 6 onths & Over 1 year & up up to 1 year to 3 years
Over 3 years & up to 5 years
Over 5 years Total
Rupees Lakhs Rupees Lakhs Rupees Lakhs Rupees Lakhs Rupees Lakhs
Advances* 1,24,514 2,85,595 82,539 2,12,523 8,56,482
(94,362) (2,19,501) (53,341) (1,21,457) (6,08,049)
Investments**
39,996 0 - - 95,790
(9,574) (1,085) (0) - (68,035)
Borrowings 1,72,552 3,16,465 1,19,933 52,810 7,72,203
(69,804) (2,65,298) (36,023) (32,810) (5,46,594)
vii) Registration with other financial sector regulator.
Name of Regulator Status Registration Details
Insurance Regulatory and Development Authority
Corporate Agent License No. ICI 2546641 Valid till August 21, 2015
Notes to financial Statements for the year ended March 31, 2015
m

138
viii) No penalties were imposed by RBI and any other regulator during the current and previous year.
ix) Refer note 27 for related party transactions during the current and previous year.
LT – Long Term ST – Short TermNCD – Non Convertible Debentures SD – Subordinated DebtCP – Commercial Paper TL – Term LoanSTD – Short Term Debt
xi) Net Profit or Loss for the period, prior period items and changes in accounting policies.
statements are consistent with those of the previous year.
xii) Revenue has been recognised in accordance with the revenue recognition policy of the Company and there are no deviations to the same (refer note 2).
xiv) Draw down from reserves
xv) Concentration of Deposits, Advances, Exposures and NPAs
Concentration of Deposits
x) Ratings assigned by credit rating agencies and migration of ratings during the year
2014-15 2013-14 Remarks
Particulars ICRA India Rating CARE ICRA India Rating
LT
NCD / SD ICRA AA+ with Stable Outlook
IND AA+ with Stable Outlook
AAA ICRA AA+ with Stable Outlook
IND AA+ with Stable Outlook
TL ICRA AA+ with Stable Outlook
IND AA+ with Stable Outlook
- ICRA AA+ with Stable Outlook
IND AA+ with Stable Outlook
ST
STD ICRA A1+ IND A1+ - ICRA A1+ IND A1+
CP ICRA A1+ - - ICRA A1+ –
Company Ratings
LT ICRA AA+ with Stable Outlook
IND AA+ with Stable Outlook
- ICRA AA+ with Stable Outlook
IND AA+ with Stable Outlook
Subject to annual surveillance
ST ICRA A1+ IND A1+ - ICRA A1+ IND A1+
xiii) Break up of ‘Provisions and Contingencies’ shown under the head Expenditure in Profit and Loss Account
* Income tax is Minimum Alternative Tax (MAT) and the Company has created a MAT asset for the same, hence profit before tax and profit after tax are same and has no impact on the Statement of Profit and Loss.
Break up of ‘Provisions and Contingencies’ shown under the head Expenditure in Profit and Loss Account
March 31, 2015 March 31, 2014
Rupees Lakhs Rupees Lakhs
Provisions for depreciation in carrying value of Investment 2 150
Provision towards non-performing assets 2,244 564
Provision made towards income tax* 6,765 5,390
Provision on assigned loans (761) (91)
Provision for standard assets 1,415 2,367
Concentration of AdvancesMarch 31, 2015 March 31, 2014
Rupees Lakhs Rupees Lakhs
Total Advances to twenty largest borrowers 36,745 18,306
Percentage of Advances to twenty largest borrowers to Total Advances of the Company 4% 3%
Notes to financial Statements for the year ended March 31, 2015

139Annual Report 2015 Fullerton India Credit Company Limited
Concentration of Non-Performing AccountsMarch 31, 2015 March 31, 2014
Rupees Lakhs Rupees Lakhs
Total Exposure to top four NPA accounts 4,993 1,534
March 31, 2015 March 31, 2014
Rupees Lakhs Rupees Lakhs
Total Exposure to twenty largest borrowers / customers 36,745 18,306
Percentage of Exposures to twenty largest borrowers / customers to Total Exposure of the Company on borrowers / customers
4% 3%
Sector wise Non-Performing Accounts
Sr No
Sector
Percentage of NPAs to Total Advances in that sector
March 31, 2015 March 31, 2014
1 Agriculture and allied activities 0.0% 0.0%
2 MSME 3.3% 0.6%
3 Corporate borrowers* 4.4% 2.5%
4 Services 0.0% 0.0%
5 Unsecured personal loans 0.8% 1.0%
6 Auto loans (Commercial Vehicle) 4.3% 7.1%
7 Other personal loans (incl. TW, used car, Loan against property) 1.4% 1.8%
*NPA% shown above are mutually exclusive.
xvi) Movement of NPAs, provision, net NPA
Sr No
ParticularsMarch 31, 2015 March 31, 2014
Rupees Lakhs Rupees Lakhs
(i) Net NPA to Net Advances (%) 1.41% 1.34%
(ii) Movement in Gross NPAs
(a) Opening Balance 10,492 9,864
(b) additions during the year 33,526 26,315
Sub Total (A) 44,018 36,178
(a) Up gradations 2,117 1,726
(b) Recoveries 5,148 4,012
(c) Write-Offs 20,068 19,949
Sub Total (B) 27,333 25,687
Gross NPAs as on 31 Mar (A-B) 16,685 10,492
(iii) Movement in provisions for NPAs
(a) Opening Balance 2,346 1,686
(a) Provisions made during the year 5,873 3,615
(b) Write off / Write back of excess provisions 3,629 2,955
(b) Closing Balance 4,589 2,346
(iv) Movement in Net NPAs
(a) Opening Balance 8,146 8,178
(b) additions during the year 27,653 22,700
(c) Reductions during the Year 23,703 22,732
(d) Closing Balance 12,096 8,146
Notes to financial Statements for the year ended March 31, 2015

140
xvii) years.
xvii) earlier years.
39. CSR EXPENSESi) Gross amount required to be spent by the Company during the year Rs. 260 Lakhs
ii) Amount spent during the year:
40.
xix) Disclosure on complaints
(a) No. of complaints pending at the beginning of the year 72
(b) No. of complaints received during the year 9,510
(c) No. of complaints redressed during the year 9,413
(d) No. of complaints pending at the end of the year 169
Amount spent in cash
Yet to be paid in cash
Total
Rupees Lakhs Rupees Lakhs
i) Construction / acquistion of any asset - - -
ii) On purpose other than (i) above 94 - 94
As per our report of even date
S. R. BATLIBOI & Co. LLP For and on behalf of the Board of Directors of ICAI Firm’s Registration number: 301003E Fullerton India Credit Company Limited Chartered Accountants
Sd/- Sd/- Sd/-per Shrawan Jalan Gan Chee Yen Shantanu Mitra Partner Chairman CEO and Managing Director Membership No: 102102 Sd/- Sd/- Pratik Gandhi Pankaj Malik Chief Financial Officer Head - Finance and Company Secretary
Place : Mumbai Place : Mumbai Date : May 20, 2015 Date : May 20, 2015
Notes to financial Statements for the year ended March 31, 2015
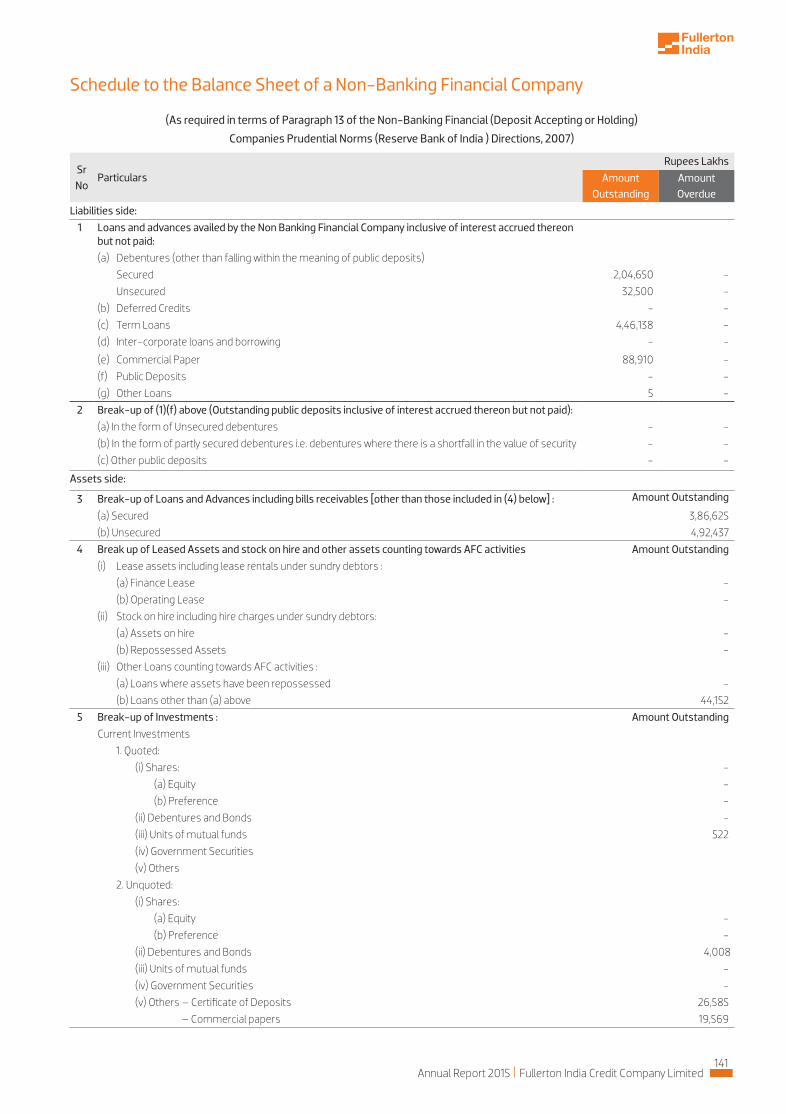
141Annual Report 2015 Fullerton India Credit Company Limited
Schedule to the Balance Sheet of a Non-Banking Financial Company
(As required in terms of Paragraph 13 of the Non-Banking Financial (Deposit Accepting or Holding)
Companies Prudential Norms (Reserve Bank of India ) Directions, 2007)
Sr No
ParticularsRupees Lakhs
Amount Outstanding
Amount Overdue
Liabilities side:
1
Loans and advances availed by the Non Banking Financial Company inclusive of interest accrued thereon but not paid:
(a) Debentures (other than falling within the meaning of public deposits)
Secured 2,04,650 -
Unsecured 32,500 -
(b) Deferred Credits - -
(c) Term Loans 4,46,138 -
(d) Inter-corporate loans and borrowing - -
(e) Commercial Paper 88,910 -
(f) Public Deposits - -
(g) Other Loans 5 -
2 Break-up of (1)(f) above (Outstanding public deposits inclusive of interest accrued thereon but not paid):
(a) In the form of Unsecured debentures - -
(b) In the form of partly secured debentures i.e. debentures where there is a shortfall in the value of security - -
(c) Other public deposits - -
Assets side:
3 Break-up of Loans and Advances including bills receivables [other than those included in (4) below] :
(a) Secured 3,86,625
(b) Unsecured 4,92,437
4 Break up of Leased Assets and stock on hire and other assets counting towards AFC activities
(i) Lease assets including lease rentals under sundry debtors :
(a) Finance Lease -
(b) Operating Lease -
(ii) Stock on hire including hire charges under sundry debtors:
(a) Assets on hire -
(b) Repossessed Assets -
(iii) Other Loans counting towards AFC activities :
(a) Loans where assets have been repossessed -
(b) Loans other than (a) above 44,152
5 Break-up of Investments :
Current Investments
1. Quoted:
(i) Shares: -
(a) Equity -
(b) Preference -
(ii) Debentures and Bonds -
(iii) Units of mutual funds 522
(iv) Government Securities
(v) Others
2. Unquoted:
(i) Shares:
(a) Equity -
(b) Preference -
(ii) Debentures and Bonds 4,008
(iii) Units of mutual funds -
(iv) Government Securities -
(v) Others – Certificate of Deposits 26,585
– Commercial papers 19,569
Amount Outstanding
Amount Outstanding
Amount Outstanding

142
Schedule to the Balance Sheet of a Non-Banking Financial Company
Sr No
ParticularsRupees Lakhs
Amount Outstanding
Amount Overdue
Assets side:
5 Long Term Investments
1. Quoted:
(i) Shares:
(a) Equity -
(b) Preference -
(ii) Debentures and Bonds -
(iii) Units of mutual funds -
(iv) Government Securities -
(v) Others -
2. Unquoted:
(i) Shares:
(a) Equity 1,005
(b) Preference -
(ii) Debentures and Bonds -
(iii) Units of mutual funds -
(iv) Government Securities -
(v) Others -
Sr No
CategoryMarket Value / Break up or fair
value or NAV
Book Value (Net of
Provisions)
7 Investor group-wise classification of all investments (current and long term) in shares and securities (both quoted and unquoted):
1. Related Parties
(a) Subsidiaries 1,000 1,000
(b) Companies in the same management - -
(c) Other related parties - -
2. Other than related parties 50,689 50,689
Total 51,689 51,689
Sr No
CategoryAmount net of Provision
Secured Unsecured Total
6 Borrower group-wise classification of all leased assets, stock-on-hire and loans and advances :
1. Related Parties
(a) Subsidiaries - - -
(b) Companies in the same group - - -
(c) Other related parties - - -
2. Other than related parties 3,83,247 4,91,226 8,74,473
Total 3,83,247 4,91,226 8,74,473
Sr No
Category Amount
8 Other Information
(i) Gross Non-Performing Assets
(a) Related parties
(b) Other than related parties 16,685
(ii) Net Non-Performing Assets
(a) Related parties
(b) Other than related parties 12,096
(iii) Assets acquired in satisfaction of debt -
-

143Annual Report 2015 Fullerton India Credit Company Limited
Sr. No.
ParticularsFullerton India Home Finance Company Ltd
Fullerton India Foundation for Social & Economic
Development
1 Financial years of the subsidiary Company ended on March 31, 2015 March 31, 2015
2 Reporting currency INR INR
3 Shares of the subsidiary held on the above date and extent of holding
a) Equity Shares (of Rs 10 each) 1,00,00,000 23,575
b) Extent of holding 100% 100%
4 Net aggregate amount of Profit/(Losses) of the Subsidiary for the period so far as it concerns members of Fullerton India Credit Company Ltd.
i) Not dealt within the accounts of the Holding Company
a) For the financial year of the Subsidiary 21,91,878 (13,736)
b) For the previous financial years of the Subsidiary/since it became the Holding company's subsidiary 49,92,773 (99,276)
ii) Deal within the Holding company's accounts
a) For the financial year of the Subsidiary Nil Nil
b) For the previous financial years of the Subsidiary/since it became the Holding company's subsidiary Nil Nil
5 Material changes if any between the end of financial year of the subsidiary company and that of the Holding Company
Nil Nil
6 Additional information on Subsidiary Companies
Share Capital 10,00,00,000 2,35,750
Reserves and Surplus 49,92,773 (99,276)
Total Assets 10,51,10,904 2,35,750
Total Liabilities 1,18,131 (99,276)
Investment (except in case of investment in subsidiaries) - -
Turnover 39,05,892 -
Profit before Taxation 33,98,799 (13,736)
Provision for Taxation 12,06,921 -
Profit after Taxation 21,91,878 (13,736)
Proposed Dividend (including Dividend Distribution Tax thereon) - -
7 Operation commenced No No
Statement containing salient features of the financial statement of subsidiaries/associate companies/joint ventures
(Pursuant to first proviso to sub-section (3) of section 129 read with rule 5 of Companies (Accounts) Rules, 2014)
Part A : Subsidiaries
No subsidiaries were sold or liquidated during the year.
Part B : Associates and Joint Ventures
For and on behalf of the Board of Directors of Fullerton India Credit Company Limited
Sd/- Sd/- Gan Chee Yen Shantanu Mitra Chairman CEO and Managing Director
Sd/- Sd/- Pratik Gandhi Pankaj Malik Chief Financial Officer Head - Finance and Company Secretary
Place : Mumbai Date : May 20, 2015

144