29
Corporate Overview

Corporate Overview

Introduction to Cumberland Farms

Cumberland Farms Snapshot
Company Overview Family-owned fuel retailer and convenience store operator with 563
locations across Connecticut, Rhode Island, Massachusetts, Vermont, New Hampshire, Maine, New York and Florida
Market leading position in the Northeast
Own ~88% of the store locations
In early 2009, Cumberland Farms launched a long-term rebranding campaign under the Accelerate In-Store Mix (“AIM”) format featuring a food-centric concept, enhanced interior design and a new logo
Achieved significant Average Per Store Week (“APSW”) growth from this initiative as well as closing / selling non-core locations
The Company was founded in 1939 by the Haseotes family
New Store Design (AIM Format)
Targeting +80% AIM formatted stores in next 2 years (70% today)
58%
42% 31%
69%
Strong Financial Results (LTM 9/30/18)
Segment Breakdown (LTM 9/30/18)
Revenue Gross Profit
Merchandise
Fuel
Total Revenue: $4.0 billion
Merchandise Sales: $1.2 billion
Fuel Gallons: 1.0 billion
Adjusted EBITDA: $149.4 million
Merchandise
Fuel

Established Brand with a Long Operating History
Ari Haseotestakes over
responsibilities of retail division
20082017
AIM next generation
launch
Early 1980’sLaunched coffee
offering
1939Founded by Vasilios
and Aphrodite Haseotes in
Cumberland, RI
2009Began investing in
AIM concept stores to better serve
customers
Mid 1950’sBegan selling and
producing ice cream and dairy products
1986Acquired
Northeast and Mid-Atlantic
marketing assets of Gulf Oil
1976Private label
beverage and bakery commissary
Enhanced breakfast offering as a part of
the AIM initiative
Late 2000’s
~2012Introduced pizza
offering as a part of the AIM initiative
Late 1990’sExpanded hot and
cold beverage offering
Exercised its option to acquire all outstanding
shares ofGulf Oil LP
2005
Product introductions
1971Opened first
fuel station inPutnam, CT
2015Sold Gulf and
Assured Dealer businesses
to ArcLight Capital Partners
2014Opened the
Culinary Center at its
Distribution Facility in
Westborough, MA

Recap of Recent Strategic Activity
Sale of Gulf Oil and Assured Dealer Division Singularly Focused on Retail Business With Four Key Tenets
Full Adoption of Mission, Vision and
Values based Culture
Continued Capital Investment in Store
Base
Deployment of Food & Beverage
Offerings
Focused Effort to Enhance Guest and
Team Member Experience and
Increase Efficiency
1
2
3
4
Two divisions divested on December 29, 2015 to ArcLight Capital Partners
Gulf Oil division was reported as a separate entity
Assured Dealer division was historically reported with the Retail segment in Cumberland Farms’ financial statements
Cumberland entered into a fuel supply agreement with the purchaser through 2019
Divestitures have further streamlined Company operations and have resulted in a more focused C-store business
Our Mission: To deliver the friendliest, cleanest and most
convenient customer experience by firstbeing the best place to work.
AIM Investments
142 155 165 174 176 20228 67 104 134 172 182170
222 269 308 348 384
FY 2013 FY 2014 FY 2015 FY 2016 FY 2017 FY 2018
AIM Remodels Major Capital Projects
Grow Foodservice Sales
Net Promoter Score
7% 16%
27% 21% 24%
43% 27%
33% 37% 37% 35% 46%
FY 2013 FY 2014 FY 2015 FY 2016 FY 2017 FY 2018
All CFI Shoppers AIM Shoppers
Pizza Coffee Breakfast
Number of locations

FLFLFLFLFLFLFLFLFLFLFLFLFLFLFLFLFLFLFLFLFLFLFLFLFLFLFLFLFLFLFLFLFLFLFLFLFLFLFLFLFLFLFLFLFLFLFLFLFL
CTCTCTCTCTCTCTCTCTCTCTCTCTCTCTCTCTCTCTCTCTCTCTCTCTCTCTCTCTCTCTCTCTCTCTCTCTCTCTCTCTCTCTCTCTCTCTCTCTRIRIRIRIRIRIRIRIRIRIRIRIRIRIRIRIRIRIRIRIRIRIRIRIRIRIRIRIRIRIRIRIRIRIRIRIRIRIRIRIRIRIRIRIRIRIRIRIRI
MAMAMAMAMAMAMAMAMAMAMAMAMAMAMAMAMAMAMAMAMAMAMAMAMAMAMAMAMAMAMAMAMAMAMAMAMAMAMAMAMAMAMAMAMAMAMAMAMA
NJNJNJNJNJNJNJNJNJNJNJNJNJNJNJNJNJNJNJNJNJNJNJNJNJNJNJNJNJNJNJNJNJNJNJNJNJNJNJNJNJNJNJNJNJNJNJNJNJPAPAPAPAPAPAPAPAPAPAPAPAPAPAPAPAPAPAPAPAPAPAPAPAPAPAPAPAPAPAPAPAPAPAPAPAPAPAPAPAPAPAPAPAPAPAPAPAPA
NYNYNYNYNYNYNYNYNYNYNYNYNYNYNYNYNYNYNYNYNYNYNYNYNYNYNYNYNYNYNYNYNYNYNYNYNYNYNYNYNYNYNYNYNYNYNYNYNY
NHNHNHNHNHNHNHNHNHNHNHNHNHNHNHNHNHNHNHNHNHNHNHNHNHNHNHNHNHNHNHNHNHNHNHNHNHNHNHNHNHNHNHNHNHNHNHNHNH
VTVTVTVTVTVTVTVTVTVTVTVTVTVTVTVTVTVTVTVTVTVTVTVTVTVTVTVTVTVTVTVTVTVTVTVTVTVTVTVTVTVTVTVTVTVTVTVTVT
MEMEMEMEMEMEMEMEMEMEMEMEMEMEMEMEMEMEMEMEMEMEMEMEMEMEMEMEMEMEMEMEMEMEMEMEMEMEMEMEMEMEMEMEMEMEMEMEME
Leading C-Store Retailer in the Northeast and Florida
Company-operated convenience store network
Revenue from motor fuel sales, food sales, convenience merchandise and service sales
As of December 31, 2018, operated 563 stores
Approximately 88% owned stores
Many new AIM stores anticipated to be over 5,000 sq. ft., although now studying a more compact model
Up to 20 fueling positions for new AIM stores
560,000 sq. ft. owned manufacturing and distribution facility in Westborough, MA services all Northeast stores
Northeast
Florida
Northeast Stores:
515
Florida Stores:
48
Total Stores: 563
Second highest brand equity according to the Nielsen’s 2017 Store Choice Driver Report

39%
18%
14%
11%
5%
4% 3% 3% 3%
In-Store Operations
Key Categories Merchandise Mix
Cigarettes Foodservice Other Packaged BeveragesBeer & WineOther Tobacco
CandySalty Snacks
Dairy
Cigarettes
Foodservice
Private Label
Lower margin item, but crucial traffic driver Pricing driven by taxes in respective states Despite challenging regulatory environment, industry-
wide volume declines are mitigated as convenience stores gain share due to decisions by some retail channels to exit the category
Cigarettes represent 34.5% of merchandise sales when adjusted for the national state average excise taxes
Key focus area is currently slightly below industry average and represents a high margin opportunity
Coffee offering is key traffic driver “Chill Zone” (frozen / fountain beverage) Sandwich cases and fresh food / fresh bakery offering Opened Culinary Center in 2014 in order to supply
stores with fresh sandwiches, pizza and other fresh packaged products
Represents 10% of in-store sales Strong heritage in dairy products create logical and
compelling brand extension possibilities Important enhancement to overall store
experience and brand strength Expected to be key future margin driver
Sales Split
Foodservice Offering Private Label Offering
Representative Products

9.9%
21.8% 24.3%
Legacy Stores AIM Stores NACS Top Quartile
Foodservice and Private Label Growth
Private Label Foodservice Cumberland Farms has been driving higher margin foodservice
sales (fountain drinks, coffee, frozen drinks and sandwiches)
Coffee, one of the more popular offerings, is 7.1% of total merchandise sales as of March 31, 2018
Foodservice and dispensed beverage sales in AIM stores represent 21.8% of total merchandise sales vs. 9.9% in legacy stores
Cumberland has significantly closed the gap with NACS Top Quartile over the past few years as AIM store count increases
In fiscal 2007, foodservice comprised only 6.5% of merchandise sales in legacy stores
Private label products represent 10% of in-store sales
Marketed under the Cumberland Farms, Farmhouse and Farmhouse Premium brands
Base private label offering includes dairy products and other “everyday essentials” such as bread, water, sandwiches, juice, soda and chips
Farmhouse brand has expanded to candy and salty and sweet snacks –also markets hot, iced and take-home coffee products
Private label products are a key driver of margins and enhance the overall in-store customer experience and brand strength
Above average penetration compared to national brands within competing product categories
Continued focus on developing more differentiated and unique premium quality and priced products
Foodservice and Dispensed Beverages as% of Total Merchandise Sales

Merchandise Distribution & Supply
Competitive Advantage of a Closed-Loop System vs. Outsourced Model
Distribution and Supply Overview
Controlled number of stock keeping units (“SKUs”) at warehouse increases inventory turns
Increases freshness of inventory at store level Stores receive multiple
deliveries per week
Vendor consolidation (ice cream, dairy, perishables, bakery, foodservice, private label) provides fewer deliveries to each individual store
Increases speed-to-market on new items or product changes
Provides clear line of sight to total delivered cost of goods
Self-distribute three-fourths of merchandise (excluding motor fuel) through Westborough, MA warehouse and distribution facility
560,000 sq. ft. facility on 4.1 million sq. ft. of land with commissary and freezer capabilities
Fleet of leased and owned trucks supplies 500+ convenience stores and provides improved inventory management
Distribution service agreement with wholesale distributor; primary distributor of food products and convenience merchandise to Florida stores
Distribution center in the Northeast supplies this wholesale distributor weekly with foodservice and private label products
Remaining one-fourth of the merchandise is delivered via direct store delivery (e.g. Coca-Cola, Pepsi / Frito Lay and beer)
AdvantageCost
SavingsOperating
Efficiencies

Fuel Operations
(1)
Fuel Sales Overview
Fuel represents 68% of revenues and 42% of gross profit
Cumberland Farms established its SmartPay program in 2013 to provide greater savings for customers and promote brand loyalty
Payment program allows customers to save $0.10 on every gallon of fuel purchased and receive rewards for every 50 gallons of fuel purchased
Fuel breakdown as a percentage of FY2017 gallons:
Unleaded: 85%
Unleaded Plus: 5%
Super Unleaded: 7%
Diesel: 3%
Cumberland Farms was rated the nation’s favorite fueling station in a study by Market Force in May 2018

Leading Position and Scale in Attractive Markets
____________________(1) Population from 2016 U.S. Census (as of July 1, 2017), Number of stores from NACS 2016 SOI Report.(2) NACS Report as of December 31, 2016.(3) Represents store count as of September 30, 2018.(4) Market efficiency defined as gas gallon market share divided by gas outlet share.
CFI convenience stores and fuel stations are generally situated on well-traveled thoroughfares or other easily accessible sites in the Northeast and Florida
Population density, employment and personal income data are very favorable in the Northeast as compared to other regions of the U.S. (1)
Northeast has second fewest number of convenience stores per capita in the U.S. (1)
Lack of developable land combined with the regulatory and permitting considerations for fuel stations limit the threat of competition from new entrants
CFI’s Leading Position in Northeast Markets
U.S. Average
U.S. Convenience Stores per Capita (1)
Market Share by Store Count
(3)
Stores per 10,000 People
(4)(2)Market CFI Market MarketState Sites Sites Share Efficiency
RI 509 46 9.0% 1.42
MA 3,392 207 6.1% 1.62
NH 900 47 5.2% 1.09
ME 1,028 43 4.2% 1.38
CT 1,695 71 4.2% 1.73
VT 592 19 3.2% 1.12
NY 8,570 82 1.0% 1.21
Northeast 16,686 515 3.1%
FL 9,930 48 0.5% 0.98
Total 26,616 563 2.1%
3.57
4.37 4.63
5.71
0.00
1.00
2.00
3.00
4.00
5.00
6.00
West Northeast Midwest South

32%39%
46%38% 39%
43%
2015 2016 2017
Unaided Aided
Significant Brand Awareness and Customer Loyalty
CF Total AIM Competitors (4)
Is easy to get to 61% 77% 46%
My family has always shopped there 32% 43% 18%
Is a place I would go out of my way to shop at 26% 35% 14%
Is a store I trust 58% 71% 39%
Is a newer store 52% 82% 24%
Has a good reputation 61% 73% 40%
Has food or snacks that I crave 52% 62% 38%
The area where I make my coffee / get my fountain beverage is always clean 50% 62% 31%
The employees know me 20% 26% 14%
Their food is fresh 41% 51% 25%
Has a loyalty program that allows me to save money on gas or merchandise 39% 53% 22%
Is fast to get my hot food 38% 49% 25%
Restrooms are always clean 36% 47% 24%
Cumberland Farms Customer Loyalty Consumer Perceptions of Top Store Attributes 2018 – Cumberland Farms vs. Competition
Cumberland Farms Brand Awareness
Cumberland Farms has strong loyalty among customers
Unaided and aided awareness is growing
82 83 82
54% 53% 55%
2015 2016 2017
69 70 70
38% 35% 37%
2015 2016 2017
Brand Awareness
Performance of both Legacy and AIM stores is strong versus competitors
Relative strength for CF (index >= 120)
Legacy Store Model Loyalty Trends
AIM Store Model Loyalty Trends
Total PromotersCustomer Loyalty Index

33% 37% 37% 38%
56% 57% 58% 54%
2014 2015 2016 2017
All Stores New Stores
0100200300400500600700800
0
20,000
40,000
60,000
80,000
100,000
Jan-13 Feb-14 Mar-15 Mar-16 Apr-17 Apr-18
Number of Transactions Number of Enrollments
26%
28%
33%
13%
SmartPay Introduction
Introduction of SmartPay Loyalty Program Fuel Volume Breakdown by Method of Payment SmartPay program launched in 2013 to provide greater savings for
customers and promote brand loyalty
Payment program allows customers to save $0.10 on every gallon of fuel purchased
Receive rewards for every 50 gallons of fuel purchased, plus free monthly product coupons on favorite items such as Farmhouse Blend coffee and Hyper-Freeze beverages
Pizza and breakfast sandwich loyalty clubs launched in FY ‘18
Enables customers to activate fuel pump from mobile device as well as pay for in-store merchandise
SmartPay gallons have grown to ~26% of total gallons sold as of March 31, 2018
Offers two mobile apps for personal and business uses
Awareness of SmartPay Continues to Grow
Cumulative Number of SmartPay Enrollments and Transactions
Num
ber o
f Tra
nsac
tions
(000
’s) N
umber of Enrollm
ents (000’s)
SmartPay Platform Drives Volume and Value
SmartPay Debit CashCredit
The number of customers who are aware of CFI’s SmartPay loyalty program is higher in new stores

But first, why SmartPay?
$116
$25
$51
$-
$20
$40
$60
$80
$100
$120
$140
Payroll Benefits Credit Card Fees
2013 Expenses in $ MM
Card Processing Fees growing at an unsustainable rate – prior to launch, CAGR was ~17%, and the second largest category of expense overall
Through SmartPay, we believed we could:
Solve what was/is known to be a major pain point for consumers (gasoline prices)
Remove friction from the transaction/create a novel way to transact with Cumberland Farms
Insulate Cumberland Farms from rising cost of processing

CF Total CF New Store All Others 7-Eleven Hess Mobil Stewarts Speed-way
2018 2017 2018 2017 2018 2017 2018 2017 2018 2017 2018 2017 2018 2017 2018 2017
Base: Total respondents (unweighted) 2004 2001 821 806 1981 1973 227 249 150 160 204 163 86 53 147 148Base: Total respondents (weighted) 2004 2001 915 924 1978 1972 258 248 147 147 222 175 73 39 141 159
Is easy to get to 61% 57% 77% 70% 46% 44% 50% 44% 37% 41% 51% 54% 58% 72% 49% 46%
My family has always shopped there 32% 30% 43% 42% 18% 18% 25% 17% 9% 23% 21% 18% 31% 45% 18% 22%
Is a newer store 52% 51% 82% 81% 24% 23% 21% 18% 12% 28% 30% 26% 37% 42% 31% 36%
Has a loyalty program that allows me to save money on gas or merchandise 39% 38% 53% 54% 22% 23% 14% 20% 22% 35% 29% 27% 26% 30% 35% 34%
Is a store I trust 58% 52% 71% 67% 39% 37% 37% 30% 35% 39% 48% 47% 65% 73% 45% 40%
Is a place I would go out of my way to shop at 26% 25% 35% 37% 14% 16% 13% 12% 10% 27% 16% 16% 27% 30% 13% 16%
Has a good reputation 61% 59% 73% 72% 40% 41% 41% 37% 33% 44% 41% 48% 60% 69% 38% 43%
Has foods or snacks that I crave 52% 50% 62% 61% 38% 40% 41% 41% 34% 48% 43% 44% 51% 53% 41% 39%
The area where I make my coffee or get my fountain beverage is always clean 50% 62% 31% 29% 27% 41% 43% 37%
The employees know me 20% 21% 26% 28% 14% 13% 11% 13% 8% 10% 23% 13% 24% 25% 17% 14%
Restrooms are always clean 36% 36% 47% 49% 24% 25% 22% 16% 17% 23% 30% 29% 35% 49% 28% 26%
Is fast to get my hot food 38% 49% 24% 18% 17% 25% 39% 26%
Their food is fresh 41% 41% 51% 51% 25% 26% 25% 24% 21% 30% 28% 29% 40% 56% 24% 30%
New CF Stores –vs.– CompetitionTop Tier – the things that are most
important*
Relative weakness for CF (index <=80) Relative strength for CF (index >= 120)
Index calculated by dividing Total CF score by competitive score and multiplying by 100
Competitive Comparison of Attribute Scores
Q13. Please rate how well each of the following statements describes the following convenience stores using a six point scale.
*Derived importance from Key Drivers Analysis
SmartPay Consumer Rating Metrics

SmartPay Consumer Rating Metrics

SmartPay Consumer Rating Metrics

SmartPay Financial Metrics
1.31%
1.25%
1.26%
1.30%
1.27%
1.21%
1.14%
1.16%
1.18%
1.20%
1.22%
1.24%
1.26%
1.28%
1.30%
1.32%
FY13 FY14 FY15 FY16 FY17 FY18
Adjusted CC Fees % of Total Revenue

SmartPay Financial Metrics
-0.1
-0.05
0
0.05
0.1
0.15
0.2
Historical DTC & DTLC
DTC DTLC Linear (DTC) Linear (DTLC)

SmartPay Roadmap
Mobile Strategy & EnhancementsGiven our strong performance to date with SmartPay, leveraging the current platform as the foundation for future innovations is critical to our mobile strategy
A 12-month roadmap was designed to enhance the mobile offering and meet changing customer needs
Consumer Needs &
Expectations
Cumberland Farms
Strategy
Technology / Digital Trends

SmartPay Roadmap
Mobile CheckoutWith increasing consumer interest in mobile scan & pay, functionality was added to our existing platform to deliver an accelerated experience for the coffee drinker
• Customer is able to select their desired item, add to their mobile cart, purchase, and leave the store without interacting with an associate or waiting in a queue
• During the first three weeks of the soft launch, the usage increased by 2.8x amongst the 68% of users who shopped the brand for 3+ years
• 83% of participants reported an “excellent experience” with the functionality, citing speed as the main driver of rating

SmartPay Roadmap
Additional Planned EnhancementsEnhancements for May 2019 launch are designed to accomplish three critical goals, positioning the mobile platform as a key strategic benefit and differentiator for the brand
Lower the Barrier to Entry
• Additional Payment Options: Expanding beyond ACH with credit, debit, Venmo, PayPal
• Integration with mobile banking to expedite the enrollment process for ACH accounts
Drive Transactions
• Exclusive pricing and offers
• Mobile checkout to drive peak daypart coffee purchases
• Sub-accounts: allow user to set up an account for another individual from the same funding source (children, spouse, etc.)
Enhance Speed
• Integrated barcode: applies selected coupons and payment method into a single register-scan
• Mobile checkout to drive peak daypart coffee purchases without register interaction
Future Considerations & Functionality: mobile order ahead, delivery, curbside / at pump pick up

Growth Strategy

Multi-Pronged Growth Strategy
Growth Strategy
Shifting merchandise mix towards higher-margin, differentiated items (e.g., private label and foodservice items such as coffee, frozen and fountain drinks, pizza, fresh sandwiches and bakery)
Focusing intensively upon brand development, consumer research and understanding and product innovation
Investing in technologies to drive efficiency and allow for more rapid, profitable and accurate decision making (i.e. fuel pricing software to optimize gross profit / volume dynamic and a supply chain management system)
Investing in technologies to drive customer loyalty and drive down credit card processing fees (i.e. SmartPay)
Utilizing AIM Concept stores to grow sales (APSW) and increase store productivity
Aggressively managing general & administrative expenses to enhance productivity and streamline business model
Investing in Team Members – recruiting, compensation / benefits, talent development and engagement
Enhance Sales and Profitability of Existing Stores
Remodeling Existing Locations & Building
New Locations in AIM Format
Manage Expenses & Improve Cost
Structure

5
42
58
30
1410 9
2
7
4
5
8
19
119
1912
2
5
68 7
1
3
15
20
1320 11
7
46
66
43
53
47
3941
37
2%
10%
21%
30%
41% 48%
55%
62%
69%
0
10
20
30
40
50
60
70
FY 2010 FY 2011 FY 2012 FY 2013 FY 2014 FY 2015 FY 2016 FY 2017 FY 2018
Cumberland Farms began investing in AIM stores in 2009 and has rapidly increased the AIM site count since then to 384 AIM stores
Multi-year initiative features an expanded focus on foodservice and an enhanced in-store experience through re-imaging and improved brand management
AIM stores are outperforming their legacy counterparts in all of the major merchandise categories and have also seen improved loyalty among customers
The investment in AIM stores has been financed with internal cash flow from operations, the proceeds from the sale of stores in non-strategic locations and minimal debt
Overview of AIM Concept
AIM Capital Project Count by YearAIM Conversion
New Stores Offset Raze & Rebuild AIM Conversion AIM % of TotalStore Count
(# of Stores)
Example of AIM Store TransformationBefore After
APSW Merchandise $21K APSW Gallons 13K
APSW Merchandise $48K APSW Gallons 42K

Overview of AIM Concept
Examples of AIM Store Transformation
AfterBefore
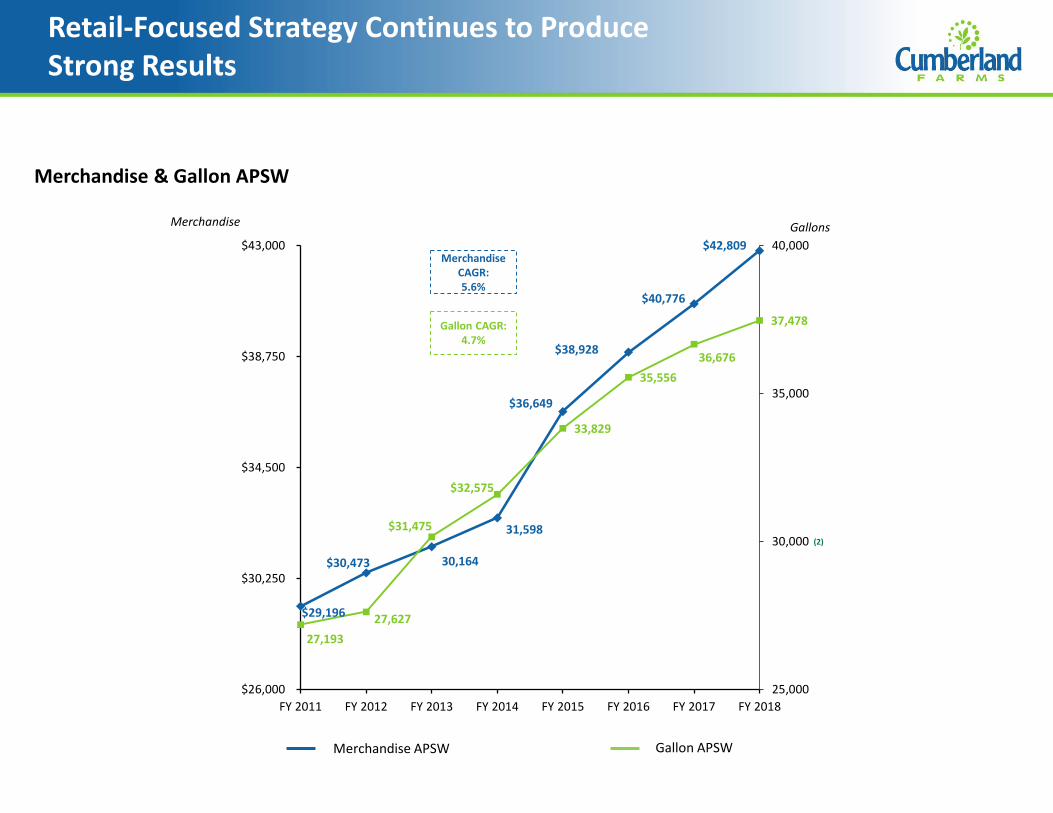
$29,196
$30,473
$31,475
$32,575
$36,649
$38,928
$40,776
$42,809
27,193 27,627
30,164
31,598
33,829
35,556 36,676
37,478
25,000
30,000
35,000
40,000
$26,000
$30,250
$34,500
$38,750
$43,000
FY 2011 FY 2012 FY 2013 FY 2014 FY 2015 FY 2016 FY 2017 FY 2018
Merchandise APSW
Merchandise & Gallon APSW
Gallon APSW
GallonsMerchandise
Merchandise CAGR:5.6%
Gallon CAGR:4.7%
(2)
Retail-Focused Strategy Continues to Produce Strong Results

Operations Strategy

Overview of Operations Strategy


![[Translation for Reference and Convenience Purposes … · [Translation for Reference and Convenience Purposes Only] ITOCHU Corporation CORPORATE GOVERNANCE - 2 - President of the](https://static.documents.pub/doc/80x56/5b5e71387f8b9a8b4a8c5006/translation-for-reference-and-convenience-purposes-translation-for-reference.jpg)


