About the Steven H. Sandell Grant Program This paper received funding from the Steven H. Sandell Grant Program for Junior Scholars in Retirement Research. Established in 1999, the Sandell program’s purpose is to promote research on retirement issues by scholars in a wide variety of disciplines, including actuarial science, demography, economics, finance, gerontology, political science, psychology, public administration, public policy, sociology, social work, and statistics. The program is funded through a grant from the Social Security Administration (SSA). For more information on the Sandell program, please visit our website at http://crr.bc.edu/opportunities/steven_h._sandell_grant_program_2.html, send e-mail to [email protected], or call Marina Tsiknis at (617) 552-1092.
About the Center for Retirement Research
The Center for Retirement Research at Boston College, part of a consortium that includes parallel centers at the University of Michigan and the National Bureau of Economic Research, was established in 1998 through a grant from the Social Security Administration. The Center’s mission is to produce first-class research and forge a strong link between the academic community and decision-makers in the public and private sectors around an issue of critical importance to the nation’s future. To achieve this mission, the Center sponsors a wide variety of research projects, transmits new findings to a broad audience, trains new scholars, and broadens access to valuable data sources.
Center for Retirement Research at Boston College Hovey House
The Brookings Institution Massachusetts Institute of Technology
Syracuse University Urban Institute
Abstract
I examine the determinants and consequences of corporate pension plan investments in hedge
funds and private equity, commonly referred to as ‘alternative assets’. I find that highly
leveraged firms with low market-to-book ratios and volatile earnings performance are more
likely to invest in alternative assets, indicating that financially constrained firms choose
alternative investments to increase asset returns and minimize pension contributions. I also find a
nonlinear relationship between plan funding status and alternative investing – very underfunded
and well-funded plans are less likely to make alternative investments compared to moderately
underfunded plans, suggesting that such plan sponsors may avoid these investments to minimize
contribution volatility. I find that plans with alternative investments earn higher returns in the
pre-crisis period, but also perform more poorly during the crisis period, suggesting that the
potential diversification benefits from investing in this asset category may be overstated.
2
1. Introduction
“In 2005, GM’s pension fund earned 13%. For a simplistic comparison, take the S&P 500, which had a total return for the year of only 4.9 %. ..Up until 2003, the folks at GM Asset Management had mainly invested in the usual suspects: U.S. large-cap equities and high-grade bonds. After the bubble burst in 2000, the fund suffered two losing years, and the plans ended 2002 underfunded by a colossal $19 billion. By federal rules, that meant the company would have to contribute many billions to its fund in the upcoming years. So, in 2003, GM decided to push the envelope…GM Asset Management adopted a radical new investment philosophy. A big chunk of new money was dedicated straight-out to hedge funds and other alpha-chasing vehicles, such as emerging-market securities, private-equity firms, junk-bond portfolios, and derivatives.”
Carol J. Loomis, Fortune Magazine, April 2006.
This study examines the determinants and consequences of corporate defined-benefit
pension plan investments in ‘alternative assets’. While there is no universally accepted definition
of the term ‘alternative asset’, this term is commonly used to refer to hedge funds, private equity,
securitized assets (such as collateralized mortgage obligations) and real assets such as
commodities, timber, oil and gas (Edwards and Gaon 2003). The Goldman Sachs / Frank Russell
Survey of Alternative Investments (1995) defines these investments as private, illiquid
investments other than the traditional investments of stock, fixed-income securities, real estate
and cash or cash equivalents. Recent surveys report that corporate pension plans are increasingly
moving assets away from common stocks and bonds into hedge funds and private equity funds.
One such study reported that “retirement plans will be the largest cumulative investors in hedge
funds in the period 2006 to 2010, accounting for 65% of the total inflows into hedge funds”
(Bank of New York 2006). The Pensions & Investments survey of the 200 largest defined benefit
sponsors in the U.S. reported that hedge funds, venture capital and private equity were amongst
the top growing asset classes since 2000 (Pensions & Investments 2008).
3
Alternative investments by public and corporate pension funds have been the focus of
much regulatory attention in recent times. The SEC stated in a staff report, “Our immediate
concerns stems from the increasing presence of these (institutional) investors in hedge funds
over which neither the Commission nor any other regulatory authority exercises meaningful
oversight” (SEC 2003). Members of the U.S. House of Representatives suggested in a hearing of
the House Financial Services Committee in March 2007, that pension fund investments in hedge
funds may deserve Congressional scrutiny ‘to protect ordinary investors from the risks that these
investments represent’. The Financial Accounting Standards Board has also announced a
proposal to improve disclosures of pension investments in alternative assets. To quote FASB
Chairman Robert Herz, “A lot of institutional investors, including pension funds, have been
going to alternative investments – hedge funds, private equity, structured notes. Users might
want to know that they’re invested in volatile instruments.”1
In this study, I examine the motivations for firms’ decisions to allocate pension assets to
alternative investments, mainly hedge funds and private equity funds. These investments have
distinctive legal and institutional characteristics that distinguish them from the more traditional
pension fund investments such as mutual funds. There is some evidence that these alternative
investing strategies are able to earn superior returns to benchmarks such as the S&P 500.
However, returns are volatile, and accompanied by greater possibilities of extreme outcomes.
The literature has proposed several theories to explain observed asset allocations in
pension plans. I test two hypotheses that could be particularly relevant to investments in
alternative assets. The first is a ‘risk-shifting’ hypothesis, which characterizes the defined benefit
pension obligations of a firm as being similar to regular corporate debt. Shareholders of a firm
1 Financial Accounting Standards Board. September 12, 2007. “Pension minutes of the Aug 29, 2007 Board meeting”.
4
sponsoring a pension plan essentially hold a put option on the assets of the pension plan. This put
option is exercisable in bankruptcy and amounts to the right to “sell” the pension assets at a price
equal to the pension liabilities. Shareholders of financially distressed firms, therefore, have an
incentive to maximize the value of the “pension put” by underfunding the pension plan and
allocating plan assets to volatile investments (Sharpe 1976). Academics and commentators have
long argued that the institutional arrangements in the United States exacerbate these incentives,
as the Pension Benefit Guaranty Corporation guarantees pension benefits to employees of
bankrupt firms, but charges insurance premiums that are not based on a fair valuation of the
‘pension put’, i.e of the plan sponsor’s option to default. The testable implications of this theory
are that firms closer to financial distress, with poorly funded pension plans, would be more likely
to invest in alternative assets.
An alternative hypothesis, advanced by Campbell and Viceira (2005) is that pension
plans, being large, long-term investors, are particularly suited for investing in private equity and
alternative assets, which tend to be illiquid. They propose that pension plans could be a cost-
efficient vehicle for corporate shareholders to optimally diversify their portfolios. A testable
implication of this argument is that pension plans with younger beneficiaries (or equivalently, a
longer investment horizon) are more likely to invest in alternative assets than pension plans with
older beneficiaries, whose obligations will fall due sooner.
I test these hypotheses using data on pension plan asset allocation disclosed in 10-K
filings by S&P 500 plan sponsors. In cross-sectional tests, I find that firms that are highly
leveraged, have lower market-to-book ratios and more volatile earnings are significantly more
likely to allocate pension asset towards hedge funds and private equity. I find that very
underfunded plans are not more likely to invest in alternative assets, contrary to the risk-shifting
5
hypothesis; instead, moderately underfunded plans are more likely to make alternative
investments than very underfunded plans or well-funded plans, suggesting that such very
underfunded or overfunded plans may be concerned about minimizing contribution volatility.
Overall, the evidence is not strongly in support of the risk-shifting hypothesis, but suggests rather
that financially constrained plan sponsors invest in alternative assets, probably to boost returns
and minimize pension contributions. I do not find that pension plans with a longer horizon are
more likely to have these investments, again contrary to the investment horizon hypothesis.
While alternative investments may be attractive due to the prospect of earning higher
returns, on average, fund managers also cite potential diversification benefits as a motivation for
alternative investing (Healey and Hardy 1997, Chemla 2004). Against this background, it is
natural to ask whether pension plans making alternative investments actually earn higher returns
and obtain these diversification benefits. I investigate the consequences of alternative
investments for actual pension returns both in periods before and during the recent financial
crisis. I find that plans with alternative investments earned higher average returns in the pre-
crisis period, but actually performed slightly weaker during the crisis period, suggesting that
alternative investments did not bring substantial diversification benefits in the periods examined.
The findings in this study contribute to the literature on the determinants and
consequences of pension plan investment strategies. Prior studies (Friedman 1983, Bodie, Light,
Morck and Taggart 1985, Amir and Benartzi 1999, Coronado and Liang 2005 and Rauh 2008)
have examined pension asset allocation from the perspective of the decision to invest pension
plan assets in common stock versus bonds. I apply theories from this literature to study the
determinants of investments in alternative assets. Alternative assets could be a new testing
ground for theories of pension asset allocation, as they have distinct characteristics deriving from
6
their legal and institutional status. These investments also constitute an increasing proportion of
corporate and public pension plan assets. This makes it important to understand the motivations
for plan sponsors’ decisions to invest in these asset classes.
2. Institutional background
The term ‘alternative assets’ lacks authoritative definition but is commonly used in the
asset management industry, in the press and by pension plan sponsors in their SEC filings. The
Goldman Sachs / Frank Russell Survey of Alternative Investments defines them as private,
illiquid investments other than the traditional investments of stock, fixed-income securities, real
estate and cash or cash equivalents. The term ‘alternative investments’ typically refers to private
equity funds, hedge funds and real assets such as timber or farmland. The entire sample of firms
in this study referred to private equity and/or venture capital funds and hedge funds in their
disclosures; therefore, I concentrate on these asset types in the following discussion.
2.1 Hedge funds
There is no generally accepted definition of the term “hedge fund” in securities law. They
are unregulated private investment vehicles intended for wealthy individuals, families and
institutional investors. They are usually organized as limited partnerships, where the investors
are limited partners and the fund managers are general partners. Hedge funds are distinguished
from other investment vehicles (such as mutual funds) by the fact that they are exempt from the
regulations that govern the activities of mutual funds, namely the Securities Act of 1933, the
Investment Company Act of 1940 (which regulates mutual funds) and the Investment Advisors
Act of 1940. Most hedge funds utilize the “private placement” or “private offering” exception
available under the Securities Act of 1933, which exempts hedge funds from registration with the
SEC, but in turn requires that the fund only sell securities to “accredited investors”. Accredited
7
investors are individuals and institutions that meet certain income or net worth requirements.2
The rationale for these requirements is to limit investments in hedge funds to financially
sophisticated investors who might not need the protections offered by federal securities laws.
Prior studies on hedge fund performance have concluded that hedge funds have earned
positive risk-adjusted returns over the periods examined (using data commencing from the early
1990s) and have Sharpe ratios that are superior to traditional investments. However, there are
significant caveats. Data on hedge fund returns are known to suffer from several biases, such as
selection bias (which arises from the voluntary nature of hedge fund reporting) and survivorship
bias (which may inflate historical returns if reported average returns do not include hedge funds
that failed to survive), which could affect risk and return measurement. Prior studies have also
raised concerns about the appropriateness of traditional mean-variance analysis in assessing
hedge fund performance. The unconditional distribution of hedge fund returns has been shown to
be distinctly non-normal, with negative skewness and excess kurtosis (fat tails). This implies that
these investments carry a greater possibility of generating extreme outcomes (Brooks and Kat
2001, Malkiel and Saha 2005).
The SEC, in its 2003 Staff Report, identified several issues arising from the unregulated
status of these funds. Chief among these are the SEC’s inability to detect fraud and misconduct
amongst hedge fund advisors at early stages, lack of independent oversight or assurance
regarding the valuation of portfolio securities, and lack of transparency arising from the absence
of minimum disclosure requirements for hedge funds.
2.2 Private Equity
2 To qualify as an accredited investor, individuals must have income in excess of $200,000 in each of the two most recent years, or joint income with a spouse in excess of $300,000 in each of those years, and a reasonable expectation of reaching that income level in the current year; or a net worth exceeding $1 million at the time of purchase. An institutional investor must have assets in excess of $5 million or must be a bank, insurance company, or investment company.
8
The organized private equity market consists of professionally managed equity
investments in unregistered securities of private and public companies. Similar to hedge funds,
private equity securities are exempt from registration with the SEC. These investments are also
organized as limited partnerships, with institutional investors as limited partners and professional
managers as general partners. Institutional investors typically outsource to professional managers
the tasks of identifying investments, performing due diligence, structuring the investments,
monitoring the investments on an ongoing basis, and managing exits from the investments.
Professional managers play an active role in monitoring and advising their portfolio companies.
Firms seeking capital in the private equity market can be of many kinds. Issuers of
“venture capital” are firms developing new, innovative technologies that are projecting potential
for growth in the future, but are in the early stages of R & D or commercialization. More mature
firms also use the private equity market to finance expansion, changes in capital structure or
ownership. Firms seeking private equity financing tend to be those that are unable to raise funds
through other markets such as bank loans or the public equity markets, or are too risky to be able
to issue debt. Investments in these firms might also require extensive due diligence and
monitoring from potential investors because of the unique risks involved or because little public
information is available (Fenn, Liang and Prowse 1995).
Private equity limited partnerships are usually structured to last for ten years, during
which time the investors forgo control over management of the partnership. Private equity
investments, therefore, are long-term and illiquid in nature. There is usually no secondary market
in which these investments can be traded, and investors usually exit via a public offering, a
private sale, or a repurchase of shares by the investee.
2.3 Distinguishing features
9
Alternative investments such as hedge funds and private equity have several legal,
institutional and statistical characteristics that distinguish them from more typical pension fund
investments such as publicly traded stocks and bonds. Recent studies have suggested that these
strategies are able to earn superior returns to public equity market benchmarks (Kaplan and
Schoar 2003, Ljungqvist and Richardson 2003, Edwards and Gaon 2003) but also that returns are
volatile and heterogeneous, i.e. there is a substantial divergence between the performance of the
top funds and the bottom funds.
The largely unregulated status of these investing vehicles means that they are not subject
to the stringent reporting and transparency requirements of public equity and bond issues. The
lack of an active secondary market also renders these investments illiquid (especially private
equity and venture capital investments) and means that reported fair values are often based on
unobservable inputs rather than on quoted prices in active markets.
3. Hypothesis development
There is limited evidence on the determinants of pension plans’ decisions to invest in
alternative assets. Healey and Hardy (1997) use responses to the Goldman Sachs / Frank Russell
Survey of Alternative Investments to analyze pension fund managers’ incentives and deterrents
to investing in alternative assets. Most managers surveyed identified the ability of alternative
investments to earn higher returns as the main determinant of investment allocation to this asset
class. The deterrents to investing in alternative assets included perceived risk and illiquidity.
Companies that issued private equity were perceived to be those who could not access public
equity or debt markets. The high level of due diligence and monitoring required while making
investments in private equity and hedge funds was another deterrent. Chemla (2004), using data
10
from the Pensions & Investments survey 2001, concludes that plan size is a major explanatory
factor in U.S. and Canadian pension funds’ allocation to private equity and venture capital.
A stream of research in corporate finance has analyzed corporate pension plan funding
and asset allocation incentives in general. I review this literature below and develop hypotheses
about investments in alternative assets.
3.1 Risk-shifting
Jensen and Meckling (1976) describe the agency conflicts that can arise between equity-
holders and bondholders, rooted in the fundamentally different nature of their claims and in
equity-holders’ limited liability. If an investment yields very large returns, much above the face
value of debt, equityholders reap the benefits. If the investment fails, bondholders bear the
consequences. Therefore, as described by Harris and Raviv (1992), equity-holders have
incentives in ‘going for broke’, especially when the firm is close to financial distress. This
agency problem could manifest itself in equity-holders pursuing excessively risky projects when
the firm is distressed, possibly at the expense of bondholders.
Funding and asset allocation in defined benefit pension plans in the United States,
provides a particularly strong setting to study these risk-shifting incentives. The obligations of a
defined-benefit pension plan resemble regular secured corporate debt. Pension liabilities are
secured against the assets in the pension plan. If the firm terminates in bankruptcy with an
underfunded pension plan (i.e. the pension assets are insufficient to meet the liabilities), the
employees are bound to accept the reduced pensions that can be afforded to them with the assets
in the pension plan. In other words, equity-holders of a firm with a defined-benefit pension plan
essentially hold a put option on the pension assets, exercisable in bankruptcy. This option
consists of the right to sell the pension assets to the beneficiaries, at a strike price equal to the
11
value of the pension liabilities. Shareholders, therefore, have an incentive to maximize the value
of this put option by underfunding the plan and investing pension assets in volatile securities.
Commentators have argued that the institutional arrangements in the United States
exacerbate these incentives. In 1974, the Employee Retirement Income Security Act (ERISA)
was enacted. ERISA created the Pension Benefit Guaranty Corporation (PBGC), an independent
government agency that insures corporate defined benefit pension plans. If a corporation enters
bankruptcy with an underfunded pension plan, the PBGC takes over the pension plan and
provides all beneficiaries a guaranteed pension, up to a maximum that is determined every year
by law. In order to pay the beneficiaries, the PBGC takes over the dedicated assets in the pension
plan; but to the extent to which the plan is underfunded, the PBGC has only the same claim on
the general assets of the corporation as an unsecured creditor. Plan sponsors, in return, pay for
this PBGC insurance via premiums that are a function of the number of employees and the
funding status of the plan.3
Sharpe (1976) and Treynor (1977) argue that PBGC insurance exacerbates risk-shifting
incentives of plan sponsors. With the advent of PBGC insurance, pension beneficiaries may only
have a muted incentive to monitor the sponsors’ pension investment policy. However, the
insurance premiums collected by the PBGC do not reflect either the credit quality of the sponsor
or the risks taken with the pension plan assets (Jin, Merton and Bodie 2006). This creates an
incentive for financially distressed firms to invest pension assets in volatile investments, so as to
maximize the value of the put option, net of the insurance premium owed to the PBGC.
The risk-shifting theory, or “PBGC insurance” effect, predicts that firms for which the
pension put option is more valuable have an incentive to maximize the value of this option, by
3 The PBGC insurance premium, however, does not depend upon the way in which plan assets are invested, i.e. on the asset allocation profile of the plan, or on the financial health of the sponsor (i.e. the probability of the plan sponsor defaulting on its obligation).
12
investing pension assets in more high-risk asset classes. The put option is more likely to be
valuable for firms with underfunded pension plans that are subject to high financial and
operating risks. The testable prediction in the context of alternative investments is therefore:
Hypothesis 1: Firms subject to relatively higher financial and operating risks, and have more
underfunded pension plans, are more likely to allocate plan assets to alternative investments.
This prediction has been tested using pension plan investments in common stocks as a
proxy for the risk of pension plan assets. The empirical results, however, have been weak and
contradictory. Friedman (1983) uses data from 1977 and finds that corporations with highly
leveraged balance sheets and more volatile earnings tend to hold less equity and more debt in
their pension plans, contrary to the predictions of the PBGC insurance effect. Amir and Benartzi
(1999) also find that firms attempt to offset risk by choosing more conservative asset allocations.
Rauh (2008) re-examines this question using a panel of data from 1987-2003 and finds similar
results. These studies have concluded that the decisions to allocate pension assets between equity
and debt in reality appear to be more consistent with ‘risk-offsetting’, where firms with high
business risk or highly levered balance sheets tend to offset some of that risk by holding lesser
common stocks and more bonds in their pension plans.
3.2 Investment horizon
The lack of conclusive evidence to support the risk-shifting theory has motivated the
search for alternative theories to explain observed pension plan asset allocations. The argument
of Campbell and Viceira (2005) is particularly relevant in this context. They suggest that
individual investors may be limited in their ability to optimally diversify their portfolios on their
own, for reasons such as limited information, lack of financial expertise, limited access to certain
asset classes, transaction fees, and constraints on borrowing and short-selling. Therefore, they
13
argue that defined-benefit pension funds can be cost-efficient vehicles for corporate shareholders
to implement their optical asset allocation.
Since pension plans are large relative to individual investors and have predictable inflows
and outflows, Campbell and Viceira (2005) argue that they are particularly well suited to hold
asset classes where liquidity is limited, such as private equity and alternative investments. This
suggests that pension plans with longer investment horizons are more likely to hold these
investments. Similarly, Healey and Hardy (1997) survey pension fund managers and find that
illiquidity is one of the major deterrents to investments in alternative assets. Pension funds with
longer investment horizons could perceive illiquidity to be less of a deterrent. The testable
prediction follows:
Hypothesis 2: Pension plans with longer investment horizons are more likely to allocate plan
assets to alternative investments.
Empirically, asset allocation is associated with the demographic profile of the pension
plan. Friedman (1983) and Amir and Benartzi (1999) show that pension plans with younger
workers (or longer horizons) tend to be invested more in equities, and that plans with older
beneficiaries (or shorter horizons) tend to invest more in bonds.
4. Research design
I test Hypothesis 1 and 2 with the following cross-sectional specifications:
Equation 1a uses DUMMYALT, an indicator variable that is set to one if the plan has any
alternative investments (and to zero otherwise) as the dependent variable, and Equation 1b
uses %ALT, the proportion of plan assets allocated to alternative investments. Equation 1a is
estimated using logistic regression and Equation 1b using OLS.
I follow previous literature (Friedman 1983, Amir and Benartzi 1999 and Rauh 2008) as
well as the Standard and Poor’s Corporate Ratings Criteria (2003) in my choice of proxies for
financial and operating risk. I control for the size of the firm and the size of the pension plan with
FIRMSIZE (the natural logarithm of total assets of the firm) and PLANSIZE (the natural
logarithm of fair value of plan assets). I also include LEVERAGE (the ratio of debt to total assets)
and FUNDING (the fair value of plan assets less the projected benefit obligation, scaled by the
projected benefit obligation) to reflect financial risk. I include MTB (the market-to-book ratio),
ROA (profitability), σ(ROA) (standard deviation of profitability over the past five years), CFO
(cash flows from operations scaled by total assets) and σ(CFO) (standard deviation of cash flows
over the past five years) to capture fundamental growth prospects and business risk.
Prior evidence on the relationship between plan funding and asset allocation has been
very mixed. For example, Friedman (1983) finds that the plan funding status has no effect on
asset allocation. On the other hand, Bodie, Light, Morck and Taggart (1985) find that poorly
funded plans are more likely to invest in riskier assets such as equities. In the face of these mixed
15
results, Bader (1991) suggests that plan sponsors may be attempting to instead manage the
volatility of their contributions. While required contributions, calculated per ERISA rules, are
somewhat predictable for moderately funded plans, they become less predictable as plans
become deeply underfunded (they could be subject to accelerated funding requirements), or as
plans become very overfunded (they are unable to make tax-deductible contributions if plan
funding exceeds a certain limit) (Amir and Benartzi 1999). Therefore, both deeply underfunded
and deeply overfunded plans may be particularly concerned about minimizing contribution
volatility, and may invest in low-risk asset classes such as bonds. Amir and Benartzi (1999) find
evidence consistent with this prediction, i.e. that moderately funded plans are more likely to
invest in equities. To capture any such non-linearities in the relationship between plan funding
and asset allocation, I also incorporate FUNDING2, the square of the plan funding status.
To test Hypothesis 2, I include HORIZON, calculated as the ratio of the plan service cost
to the sum of service cost and interest cost. The larger the service cost relative to the interest cost,
the younger the plan beneficiaries are on average, and the longer the investment horizon of the
plan. I make this approximation as the duration of plan liabilities is not required disclosure. I
control for actual returns and lagged actual returns of the plan, and for the proportion assets
devoted to other risky asset categories such as equities and real estate. Further, I include
indicator variables to capture the current status of the plan and any history of plan amendments:
FROZEN1 is set to one if the plan has been frozen since the pre-2002 period; FROZEN2 is set to
one for years after a freeze or reduction of benefits instituted after 2002, and CASHBAL is set to
one for years following a cash-balance conversion. I include year and industry fixed-effects at
the two-digit SIC code level, and cluster all standard errors at the firm level. Detailed variable
definitions and data sources are in Appendix A.
16
5. Empirical results
5.1 Sample selection
Table I summarizes the sample selection. The sample selection starts with all S&P 500
firms that have defined benefit pension plans. I restrict the examination to S&P 500 firms to
strike a balance between sample size and data collection requirements. The primary data required
for this study are pension asset allocation disclosures, which are governed by SFAS 132(R) that
requires all pension plans to report the allocation of plan assets to equity, bonds, real estate and
other investments (FASB 2003). As SFAS 132(R) was issued in 2003, asset allocation
disclosures are usually available from fiscal years ending in December 2003 and later, and for
some firms that voluntarily disclose for fiscal year 2002 as well. Asset allocation disclosures
were examined and data on the proportion of pension plan assets invested in equities, fixed
income, real estate, cash or cash equivalents and alternative assets were hand-collected for fiscal
years 2002 to 2008, the period for which SFAS 132(R) was in effect. This yields a total of 2,267
observations for 327 unique firms. I eliminate firms from the utilities and financial services
industries by two-digit SIC codes due to difficulty in defining fundamental ratios consistently for
these industries. Eliminating observations with insufficient observations for the control variables
leaves a final sample of 1,469 observations from 255 unique firms.
The quality of asset allocation disclosure varies widely between firms (see Appendix B
for examples of asset allocation disclosures from 10-K filings). Even though SFAS 132R only
requires disclosures of plan assets allocated to equities, bonds, real estate and “all other” asset
categories, several firms voluntarily disaggregate or disclose the nature of investments that fall
into the “all other” category. Alternative investments are typically disclosed as part of “all other”.
Some issuers provide detailed breakdowns of the types of alternative investments and the
17
allocations made to them (private equity, hedge funds, venture capital, real assets) while others
disclose only an allocation to ‘limited partnerships’ or simply to ‘alternative assets’. There also
exist firms that disclose a material category of opaque ‘other’ assets with no supporting detail.
These firms do not provide the reader with sufficient information to identify what the ‘other’
assets could be. As these opaque ‘other’ assets could potentially be alternative assets that are not
explicitly disclosed as such, the investments in alternative assets is measured with some noise.
5.2 Pension plan asset allocation
Table II describes pension asset allocation for the whole sample as well as distributions
by year. Panel A describes investment in equities and fixed income. The mean (median) equity
investment in the sample is 62.23% (64%). The mean (median) investment in fixed income in the
sample is 30.12% (29%). While the proportion of plan assets invested in equity increased from
2002 to 2004, it declined quite significantly in 2007 and 2008. The proportion of assets invested
in debt, on the other hand, increased over 2007 and 2008. There are two possible explanations
for this trend. First, defined-benefit pension assets and liabilities were off-balance sheet until
2006. From fiscal year 2006 onwards, Statement of Financial Accounting Standards 158
“Employers’ Accounting for Defined-Benefit Pension and other Postretirement Plans” came into
effect, requiring all defined-benefit plan sponsors to recognize the net funded status of defined-
benefit plans on the balance sheet. The requirement to recognize the funded status on-balance-
sheet could incentivize plan sponsors to minimize the volatility of the funded status, by moving
away from equity and towards fixed income investments (Amir, Guan and Oswald 2010).
Second, the financial crisis in 2008 and onwards and the resulting fall in equity values could
have contributed to the decline in the proportion of plan assets invested in equities, if plan
sponsors do not rebalance portfolios annually.
18
Table II, Panel B describes allocations to real estate. The mean (median) allocation to real
estate investments in the sample is 1.76% (0%). Amongst firms with some real estate
investments (about 34% of the sample), the mean (median) allocation to real estate is 5.22%
(5%). The mean (median) allocation to cash or cash equivalents, described in Panel C, is 1.21%
(0%) for the whole sample, and 5.93% (3%) amongst firms with some allocation to cash or cash
equivalents. The mean (median) proportion of plan assets disclosed in an opaque category of
‘other’ assets is 2.48% (0%) for the whole sample, and 6.14% (4.2%) amongst firms with this
category.
Table II, Panel E describes plan allocations to alternative assets, the main variable of
interest. The mean (median) allocation in the whole sample to alternative assets is 2.19% (0%).
Amongst firms with some allocation to alternative assets (17.3% of the sample), the mean
(median) allocation is 12.64% (10%). Even though the magnitude of alternative investing is
modest, the allocations to alternative assets have increased steadily from a sample average of
0.62% in 2002 to 3.62% in 2008. Amongst firms with this category, the mean allocation has
increased from 6.94% in 2002 to 16.94% in 2008. The most commonly disclosed types of
alternative investments are private equity funds and hedge funds.
5.3 Explanatory variables
Table III describes the independent variables used to explain alternative investing by
pension plans. The mean (median) firm size in total assets is $38.6bn ($10.5bn). The sample,
therefore, consists of mostly larger firms that are more likely to sponsor defined-benefit plans.
The mean (median) leverage 25.1% (23.4%), and the mean (median) market-to-book ratio is 2.75
(2.78). Earnings (measured before pension expenses) are 6.6% (6.6%) of total assets, and the
mean (median) volatility of profitability is 2.6% (1.8%). Cash flows from operations are 11.7%
19
(11.3%) of total assets, and the mean (median) volatility of cash flows scaled by assets is 3.2%
(2.5%). The mean (median) fair value of pension assets is $4.19bn ($1.11bn). The mean
(median) plan is underfunded to the tune of 16.5% (17.5%) of the projected benefit obligation,
while the mean (median) plan service cost is 33.5% (33.4%) of the sum of service cost and
interest cost. 11.2% of firm-year observations have some kind of plan amendment (soft freeze,
hard freeze, or reduction in benefit formula) in place before 2002, while another 15% of firm-
year observations have plan amendments introduced in 2002 or after. 10.7% of observations are
cash-balance conversions.
5.4 Correlations
Table IV displays Spearman correlations of the explanatory variables with the dependent
variables of interest. Both %ALT and DUMMYALT are similarly correlated with the explanatory
variables. Larger firms and larger pension plans are significantly more likely to have alternative
investments. Firms investing in alternative assets are also likely to have higher leverage, lower
profitability, and weakly lower cash flows from operations; this suggests that financially
constrained firms could be resorting to alternative investing to minimize pension contributions.
However, earnings volatility is negatively correlated with alternative investing, contrary to
expectation. Also contrary to expectation is the positive association with FUNDING; this could
potentially result from the fact that plans with high allocations to alternative assets earn higher
investment returns, resulting in improved funding positions for these plans. In the regression
tests, I control for actual plan returns in previous years to attempt to control for this effect.
HORIZON is negatively associated with alternative investing – i.e., plans with older beneficiaries
and a lower horizon are more likely to invest in alternative assets, contrary to Hypothesis 2. This
20
suggests again that plans that are expecting to pay out benefits soon resort to alternative
investments to generate returns and improve plan funding in the near term.
Plans with alternative assets tend to have lower investments in equities but higher
investments in real estate. These plans are less likely to have a plan freeze in place from pre-
2002. Therefore, plans which have not negotiated - or were not able to negotiate benefit
reductions in the past are more likely to invest in alternatives. These plans are, however, also
more likely to institute plan amendments more recently.
5.5 Determinants of alternative investing
Table V displays the results of estimating Equation (1). The first two models examine the
determinants of the decision to invest in alternative assets, using the indicator DUMMYALT and
logistic regression (Equation 1a). Consistent with the univariate results, highly leveraged firms
are more likely to invest in alternative assets. Firms with lower market-to-book ratios and more
volatile earnings are also more likely to invest in alternative assets; taken together, the results
point to alternative investing by financially constrained firms that are seeking high investments
returns so as to reduce pension contributions.
Larger plans are significantly more likely to make alternative investments, consistent
both with larger plans having the superior expertise and resources needed to evaluate such
investments, and with larger plans having more opportunities to participate in alternative
investments. Contrary to expectation, FUNDING remains positively and significantly associated
with alternative investing; better-funded plans, on average, are more likely to make alternative
investments, even after controlling for lagged actual plan returns. To explore the implications of
plan funding further, I add FUNDING2 as an additional explanatory variable. While FUNDING
remains positive and significant, the coefficient on FUNDING2 is negative and significant,
21
suggesting a non-linear relationship between plan funding and the likelihood of alternative
investing. The likelihood of alternative investing, therefore, increases as we move from very
underfunded to moderately underfunded plans; however, it declines when moving from
moderately underfunded plans to overfunded plans. Severely underfunded plans as well as well-
funded plans are therefore less likely to invest in alternative assets; this suggests, consistent with
Amir and Benartzi (1999), that these plan sponsors attempt to minimize contribution volatility,
which is likely to be a particular concern for such plans.
Overall, there is no evidence that very weakly funded plans invest in alternative assets as
a “gamble for solvency”, suggesting that the PBGC insurance effect, if any, is limited. However,
firms with alternative investments have a distinct profile – high leverage, low market-to-book
ratio, and volatile earnings. The high leverage, poor fundamental performance and low growth
expectations of these firms suggest that they may be financially constrained, and incentivized to
minimize pension contributions by increasing allocations to investments with high expected
returns. The effect of HORIZON is also insignificant, providing no evidence consistent with the
‘investment horizon’ hypothesis. In untabulated specifications, I try alternative measures of plan
horizon but continue to find insignificant results.4
The third and fourth models in Table V estimate Equation (1b), on the continuous
dependent variable %ALT, using ordinary least squares. Consistent with the DUMMYALT
specifications, highly leveraged firms with volatile earnings have more alternative investments.
The nonlinear association with FUNDING also remains. Inconsistent with the DUMMYALT
specifications and with Hypothesis 1, cash flow volatility is negatively and significantly
4 I estimate a weighted-average duration of plan obligations using the relationship between the PBO and ABO, following Amir and Benartzi (1999): ln(PBO/ABO) / ln(1+g), where ‘g’ is the assumed salary growth rate. Missing ABO disclosures for many observations means that this measure can only be calculated for 1,199 observations in the final sample.
22
associated with %ALT; i.e., firms with volatile cash flows are less likely to have high alternative
investments. Firms with plan freezes that were already in place at the beginning of the sample
period are significantly less likely to make alternative investments, suggesting that alternative
investing may be resorted to by plan sponsors that have been unable to negotiate reductions in
pension obligations, as a way to earn their way to stronger funding positions.
5.6 Consequences of alternative investing for plan returns
Apart from the possibility of higher returns, another motivation for alternative investing
is greater diversification of investments, as many alternative investment types are believed to be
relatively uncorrelated with, or only moderately correlated with public equity markets. In fact,
Edwards and Gaon (2003) state that the term ‘alternative’ assets is typically used to describe an
asset ‘capable of generating returns that are relatively uncorrelated with returns on long positions
in either stocks or bonds’. Diversification is cited as an important motivation for alternative
investing not only in surveys of fund managers (Healey and Hardy 1997, Chemla 2004), but also
directly by plan sponsors in 10-K filings, while explaining their investment strategies. Plan
sponsors with alternative investments also assume higher expected rates of return on their plan
assets: in the final sample, plan sponsors with DUMMYALT=1 assumed an average expected
return of 8.38% on plan assets, whereas plan sponsors with DUMMYALT=0 assumed only 8.20%
in the same period. This raises some natural questions: first, do plans with alternative
investments actually earn higher returns than other plans? Second, do alternative investments
indeed bring about the expected diversification benefits?
The financial crisis spanning years 2008 and after provide a natural laboratory for
exploring these questions. If alternative investments provide returns relatively uncorrelated with
equity markets, then we should observe plans with significant alternative investments performing
23
better during the crisis period, relative to plans without these investments, after controlling for
the allocations to other asset classes during that time. I examine the determinants of actual plan
The dependent variable ARRt measures the actual rate of return on pension assets over
year ‘t’. PLANSIZE is included as a control because larger plans are believed to earn higher
returns on average, due to superior expertise or investment opportunities and also from
economies of scale in administration and investment management. Equity and real estate
investments are, on average, riskier than fixed income and thus plans with a higher allocation to
these categories are expected to earn higher returns. %ALT, the proportion of plan assets devoted
to alternative investments, is the variable of interest. In alternative specifications, I use
DUMMYALT. I also control for past years’ returns to capture any possible mean-reversion over
time in performance. Note that all asset allocation variables are measured at the end of the
previous year, so as to mitigate feedback effects and capture the effect of asset allocation
decisions on subsequent performance.
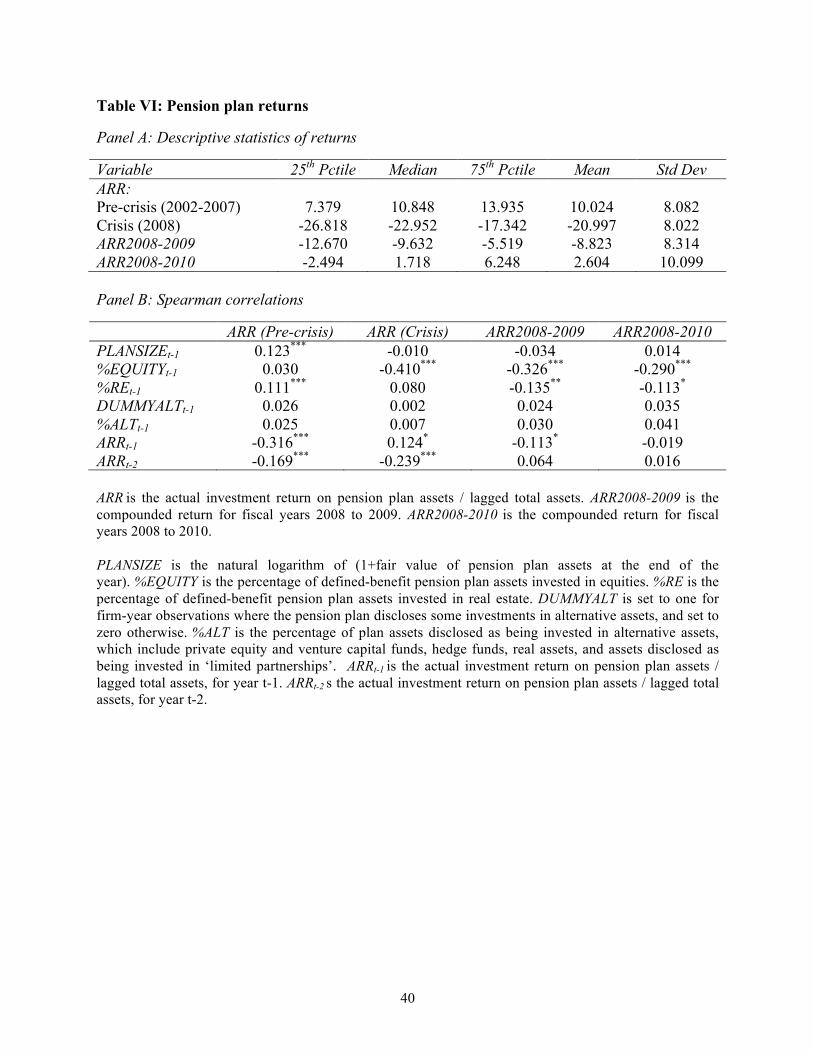
Table VI describes the actual returns earned by pension plans during the sample period
(2002-2008) and during later years of the crisis. In the 2002-2007 period, the mean (median)
annual actual return was 10.02% (10.85%) of total plan assets, and during 2008 the returns
dropped to a mean (median) of about -21% (-23%). Compounded returns over 2008-2009 were -
8.82% (-9.63%), and over the 2008-2010 period were 2.6% (1.72%). Panel B describes
Spearman correlations of returns with the explanatory variables from Equation 2. As expected,
24
plan size is very strongly positively correlated with returns, but only in the pre-crisis period.
While plans with real estate allocations performed better in the pre-crisis period, plans with
higher equity or real estate allocations performed significantly worse in the crisis periods.
Table VII presents the results of estimating Equation 2. Panel A presents results
comparing the Equation 2 results across the pre-crisis and crisis periods. In the pre-crisis period,
larger plans and plans with higher allocations to equity and real estate produce higher actual
returns on average. Plans with allocations to alternative assets also earn higher returns;
alternative assets, therefore, exerted a positive influence on returns in the pre-crisis time frame.
During the crisis period, plans with high equity allocations performed significantly worse,
unsurprisingly, and larger plans no longer earn higher returns. The coefficient on DUMMYALT is
actually negative and significant at 10% - therefore, plans with alternative allocations actually
performed weakly worse that plans without. The coefficient on %ALT is also negative but
insignificant. The last two columns of Panel A present the results for the pooled sample spanning
both pre-crisis and crisis periods, with an interaction effect for the year 2008. Consistent with the
sub-sample results, the coefficient on CRISIS*DUMMYALT is negative and significant at 10%.
Table VII, Panel B presents the results of estimating a modified version of Equation 2,
where the dependent variables are compounded returns over the two or three year period
following 2008, and the independent variables are all measured as at the end of year 2007.
Consistent with the Panel A results, firms with high equity or real estate allocations before the
crisis performed significantly worse during the crisis. The effect of alternative allocations on
subsequent returns is negative but insignificant. Therefore, overall, there seems to be very little
evidence that plans with allocations to alternative assets weathered the market crisis better than
25
their peers who invested only in ‘traditional’ stocks and bonds. If anything, the evidence
indicates that they performed slightly worse.
5.7 Sensitivity checks
I perform various sensitivity checks on the results. I control for the actuarial assumptions
used to measure the funded status and pension cost, namely the salary growth rate, discount rate
and expected rate of return. Several papers (Amir and Gordon 1996, Godwin, Goldberg and
Duchac 1996, Asthana 1999 and Bergstresser, Desai and Rauh 2006) show evidence consistent
with firms choosing actuarial assumptions opportunistically in order to achieve reporting
objectives such as minimizing reported funding status, maximizing reported income, and
avoiding covenant violation. Actuarial assumptions could be a potential correlated omitted
variable in the tests. Controlling for these assumptions, however, has no impact on the inferences.
Pension funding levels and asset allocation are also related to tax status. Thomas (1988)
shows that firms that pay more taxes tend to have better-funded pension plans. Frank (2002)
shows that firms with higher marginal tax rates tend to allocate a greater share of pension assets
to bonds. These results are consistent with firms choosing funding and asset allocation strategies
so as to maximize the tax arbitrage from funding pension plans and investing pension assets in
relatively highly taxed securities, i.e. bonds. This tax arbitrage arises because contributions to
defined benefit pension plans are tax-deductible and the income earned on pension assets is tax-
exempt. I also replicate the results controlling for the firm’s marginal tax rate. The coefficient on
this variable is insignificant and the inferences remain unchanged.
6. Conclusion
The number of defined-benefit pension plan sponsors disclosing investments in
‘alternative’ assets such as hedge funds and private equity has increased steadily over recent
26
years, as have the proportions of plan assets devoted to them. In this study, I examine the
determinants and consequences of pension plan investments in alternative assets.
The evidence shows that plan sponsors making alternative investments have a distinct
profile: they tend to be highly leveraged, have volatile performance, and poor growth
expectations. This points to potentially financially constrained plan sponsors undertaking
alternative investments as a way to boost returns and thereby minimize pension contributions. I
also find a nonlinear relationship between funding status and alternative investments –
moderately underfunded plans are more likely to undertake these investments than either very
underfunded or very well-funded plans, consistent with such very underfunded or overfunded
plans attempting to minimize contribution volatility. I do not find any evidence that alternative
investing is associated with the investing horizon of the plan.
While plans with alternative investments earn higher returns in the pre-crisis period, they
do not perform significantly better during the crisis, and in fact perform slightly more weakly
than other plans. While this deserves further investigation, it suggests at first glance that the
purported diversification benefits from alternative assets may not have been realized.
This study takes the first step towards understanding the drivers and consequences of a
new and potentially important investment trend amongst corporate defined-benefit plan sponsors.
Anecdotal and survey evidence suggests that public pension plans also invest aggressively in
alternative assets; future research may examine the drivers of alternative investing in the arena of
public plans. Future research may also examine the determinants of investing in each class of
assets included in the broader category of ‘alternative assets’.
References
Amir, E. and E.A. Gordon. 1996. “Firms’ choice of estimation parameters: empirical evidence from SFAS 106” Journal of Accounting, Auditing and Finance 11(3): 427-452.
27
Amir, E., Y. Guan and D. Oswald. 2010. “The effect of pension accounting on corporate pension asset allocation” Review of Accounting Studies 15: 345-366. Amir, E. and S. Benartzi. 1998. “The expected rate of return on pension funds and asset allocation as predictors of portfolio performance” The Accounting Review 73(3): 335-352. Amir, E. and S. Benartzi. 1999. “Accounting recognition and the determinants of pension plan asset allocation” Journal of Accounting, Auditing and Finance 14(3): 321-343. Asthana, S. 1999. “Determinants of funding strategies and actuarial choices for defined benefit pension plans” Contemporary Accounting Research 16(1): 39-74. Bader, L.N. 1991. The Financial Executive’s Guide to Pension Plans (April 1991 update). New York: Salomon Brothers, Inc. Bergstresser, D., M. Desai and J. Rauh. 2006. “Earnings manipulation, pension assumptions and managerial investment decisions” The Quarterly Journal of Economics 2006 (Feb): 157-195. Bodie, Z., Light, J., Morck, R. and R. Taggart. 1985. “Corporate pension policy: an empirical investigation” Financial Analysts Journal 41(5) : 10-16. Brooks, C. and H. Kat. 2001. “Statistical properties of hedge fund index returns and their implications for investors” Working paper, Cass Business School. Campbell, J.Y. and L.M. Viceira. 2005. “Strategic asset allocation for pension plans”, in The Oxford Handbook of Pensions and Retirement Income, Clark,G.L., Munnell, A.H. and J.M. Orszag eds., Oxford, Oxford University Press: 441-455. Chemla, G. 2004. “Pension fund investment in private equity and venture capital in the US and Canada” Journal of Private Equity 7(2): 64-71. Coronado, J. and N. Liang. 2005. “The influence of PBGC insurance on pension fund finances” Pension Research Council Working paper. Edwards, F.R. and S. Gaon. 2003. “Hedge funds: What do we know ?” Journal of Applied Corporate Finance 15(4): 58-71. Fenn, G., N. Liang and S. Prowse. 1995. “The economics of the private equity market”. Washington, DC: The Board of Governors of the Federal Reserve System. Financial Accounting Standards Board. December 2003. “Statement of Financial Accounting Standards 132(R): Employers’ Disclosures about Pensions and Other Postretirement Benefits – an amendment of FASB Statements No. 87, 88 and 106”. Norwalk, CT: FASB.
28
Financial Accounting Standards Board. September 12, 2007. “Pension minutes of the Aug 29, 2007 Board meeting”. Norwalk, CT: FASB. Financial Accounting Standards Board. March 2008. “Proposed FASB Staff Position FAS 132 (R)-a”. Norwalk, CT: FASB. Frank, M.M. 2002. “The impact of taxes on corporate defined benefit pension plan asset allocation” Journal of Accounting Research 40(4): 1163-1190. Friedman, B.M. 1983. “Pension funding, pension asset allocation and corporate finance: Evidence from individual company data” in Financial Aspects of the U.S. Pension System Zvi Bodie and John Shoven, eds., Chicago, University of Chicago Press: 107-147. Godwin, J.H., S.R. Goldberg and J.E. Duchac. 1996. “An empirical analysis of factors associated with changes in pension-plan interest rate assumptions” Journal of Accounting, Auditing and Finance 11(2): 305-322. Goldman, Sachs and Company and Frank Russell Capital. 1995. “Survey of Alternative investments by Pension funds, endowments and foundations”. Harris, M. and A. Raviv. 1992. “The theory of capital structure” Journal of Finance 46(1): 297-354. Healey, T. and D. Hardy. 1997. “Growth in Alternative Investments” Financial Analysts Journal 53(4): 58-65. Jensen, M.C. and W.H. Meckling. 1976. “Theory of the firm: managerial behaviour, agency costs and ownership structure” Journal of Financial Economics 3(4): 305-360. Jin, L., R.C. Merton and Z. Bodie. 2006. “Do a firm’s equity returns reflect the risk of its pension plan?” Journal of Financial Economics 81(1): 1-26. Ljungqvist, A. and M. Richardson. 2003. “The cash flow, return and risk characteristics of private equity” Working paper. Loomis, C.J. April 17, 2006. “GM beats the market!” Fortune Magazine. Malkiel, B. and A. Saha. 2005. “Hedge funds: risk and return” Financial Analysts Journal 61(6): 80-87. Pensions & Investments. Jan 21, 2008. “P&I 1000: The largest retirement plans”, www.pionline.com Rauh, J.D. 2008. “Risk shifting versus risk management: investment policy in corporate pension plans”. Review of Financial Studies 22(7): 2487-2533.
29
Schoar, A. and S. Kaplan. “Private equity performance: returns, persistence and capital flows” Journal of Finance 60(4). Sharpe, W.F. 1976. “Corporate pension funding policy” Journal of Financial Economics 3: 183-193. Standard & Poors, 2003. “Corporate ratings criteria”. The Bank of New York and Casey, Quirk and Associates. October 2006. “Institutional demand for hedge funds: A global perspective” The Bank of New York Thought Leadership Series. New York, NY and Darien, CT. Thomas, J.K. 1988. “Corporate taxes and defined benefit pension plans” Journal of Accounting and Economics 10: 199-237. Treynor, J.L. 1977. “The principles of corporate pension finance” Journal of Finance 32(2): 627-638. United States Securities and Exchange Commission, Staff Report. September 2003. “Implications of the growth of hedge funds”. Washington, D.C.: SEC.
30
Appendix A: Variable definitions
Variable name Definition and data sources
%EQUITY %EQUITY is the percentage of defined-benefit pension plan assets invested in equities. %RE is the percentage of defined-benefit pension plan assets invested in real estate. Source: hand-collected from 10-K filings.
%FI %FI is the percentage of defined-benefit pension plan assets invested in fixed income instruments. Source: hand-collected from 10-K filings.
%RE %RE is the percentage of defined-benefit pension plan assets invested in real estate. Source: hand-collected from 10-K filings.
%CCE %CCE is the percentage of defined-benefit pension plan assets invested in cash or cash equivalents. Source: hand-collected from 10-K filings.
%OTHER %OTHER is the percentage of defined-benefit pension plan assets disclosed as being invested in ‘other’ assets, without further description. Source: hand-collected from 10-K filings.
%ALT %AI is the percentage of defined-benefit pension plan assets invested in alternative assets, which include private equity and venture capital funds, hedge funds and real assets. Assets disclosed as being invested in ‘limited partnerships’ are also included in %AI. Source: hand-collected from 10-K filings.
DUMMYALT DUMMYALT is set to one for firm-year observations where the pension plan discloses some investments in alternative assets (%ALT>0), and set to zero otherwise.
FIRMSIZE FIRMSIZE is the natural logarithm of (1+total assets at the end of the year). Source: Compustat.
LEVERAGE LEVERAGE is (long-term debt + debt in current liabilities) / total assets at the end of the year. Source: Compustat.
ROA ROA is income before extraordinary items and before pension expense / total assets at the end of the year. Source: Compustat.
σ(ROA) σ(ROA) is the standard deviation of ROA over the past five years, with a minimum of three years’ data required. Source: Compustat.
MTB MTB is market value of equity / book value of equity. Source: Compustat.
CFO CFO is cash from operating activities before pension contributions / total assets at the end of the year. Source: Compustat.
σ(CFO) σ(CFO) is the standard deviation of CFO over the past five years, with a minimum of three years’ data required. Source: Compustat.
PLANSIZE PLANSIZE is the natural logarithm of (1+fair value of pension plan assets at the end of the year). Source: Compustat.
FUNDING
FUNDING is the (fair value of pension plan assets – projected benefit obligation) / projected benefit obligation, all defined at the end of the year. Source: Compustat.
FUNDING2 FUNDING2 is FUNDING*FUNDING. Source: Compustat. HORIZON HORIZON is service cost / (service cost + interest cost). Source: Compustat.
ARR ARR is the actual investment return on pension plan assets / lagged total assets. Source: Compustat.
31
FROZEN1 FROZEN1 is set to one for pension plans that were frozen before 2002, and to zero otherwise. Source: hand-collected from 10-K filings.
FROZEN2
FROZEN2 is set to one for years following a pension freeze that became effective in 2002 or after, and to zero otherwise. Source: hand-collected from 10-K filings.
CASHBAL
CASHBAL is set to one for years following a conversion of the plan into a cash-balance plan, and to zero otherwise. Source: hand-collected from 10-K filings.
ARR2008-2009 ARR2008-2009 is the compounded return for fiscal years 2008 to 2009. ARR2008-2010 ARR2008-2010 is the compounded return for fiscal years 2008 to 2010.
32
Appendix B: Examples of asset allocation disclosures from 10-K filings
Disclose and disaggregate alternative investments (Included in Alternatives sample) 3M
Target % of Plan Assets Asset Category Allocation 2006 2005 U.S. qualified pension plan
Large Capitalization Domestic Equities 31% 30% Small and Mid-Size Capitalization Domestic Equities 12% 11% International Equities 14% 14% Fixed Income 33% 32% Hedge Funds 10% 10% Cash –% 3%
Total 100% 100% Disclose, but do not disaggregate alternative investments (Included in Alternatives sample) At December 31, 2006 2005 Asset Category Equity securities 62.5 % 63.4 % Debt securities 16.3 17.5 Real estate 4.5 3.2 Other Total
16.7 100.0 %
15.9 100.0 %
Other assets include cash and cash equivalents (primarily held for the payment of benefits), private equity and investments in absolute return strategies.
Opaque disclosures of ‘Other’ investments (Not included in Alternatives sample)
Citigroup
Target asset allocation
U.S. pension at December
assets 31
U.S. postretirement at December 31
assets
Asset Category 2007 2006 2005 (1) 2006 2005 (1) Equity securities 15% to 40% 35 % 44 % 35 % 44 % Debt securities 13.5 to 43.5 18 13 18 13 Real estate 6 to 12 7 5 7 5 Other investments 18 to 49.5 40 38 40 38 Total 100 % 100 % 100 % 100 % (1) Reclassified to conform to the current period’s presentation.
33
Table I: Sample selection
Criterion Number of Number of observations firms
S&P 500 firms with defined-benefit pension plans from 2267 327 2002-2008 Firms from utilities or financial services (377) (56) Firms with missing data for control variables (401) (16) Final sample 1469 255
34
Table II: Descriptive statistics of pension plan asset allocation
%ALT for whole sample %ALT for sample with ALT>0 Mean Median Obs Mean Median Obs 2002 0.620 0 112 6.94 6.50 10 2003 1.406 0 198 10.31 9.00 27 2004 1.562 0 213 10.73 9.00 31 2005 1.665 0 239 11.05 8.95 36 2006 2.380 0 245 11.44 10.00 51 2007 3.092 0 233 14.41 11.00 50 2008 3.621 0 229 16.94 13.00 49 Whole 2.186 0 1469 12.64 10.00 254 sample %EQUITY is the percentage of defined-benefit pension plan assets invested in equities. %FI is the percentage of defined-benefit pension plan assets invested in fixed income instruments. %RE is the percentage of defined-benefit pension plan assets invested in real estate. %CCE is the percentage of defined-benefit pension plan assets invested in cash or cash equivalents. %OTHER is the percentage of defined-benefit pension plan assets disclosed as being invested in ‘other’ assets, without further description. %AI is the percentage of defined-benefit pension plan assets invested in alternative assets, which include private equity and venture capital funds, hedge funds and real assets. Assets disclosed as being invested in ‘limited partnerships’ are also included in %AI.
36
Table III: Descriptive statistics of explanatory variables
Variable 25th Pctile Median 75th Pctile Mean Std Dev FIRMSIZE 8.382 9.258 10.148 9.350 1.323 LEVERAGE 0.159 0.234 0.329 0.251 0.139 ROA 0.036 0.066 0.105 0.066 0.081 σ(ROA) 0.011 0.018 0.030 0.026 0.027 MTB 1.809 2.781 4.210 2.754 0.176 CFO 0.074 0.113 0.153 0.117 0.070 σ(CFO) 0.015 0.025 0.039 0.032 0.025 PLANSIZE 5.745 7.020 8.059 6.947 1.715 FUNDING -0.284 -0.175 -0.068 -0.165 0.186 FUNDING2 0.010 0.034 0.086 0.062 0.086 HORIZON 0.252 0.334 0.426 0.335 0.143 ARRt-1 4.946 9.907 13.134 7.641 9.822 ARRt-2 -3.034 9.605 13.108 6.291 11.205 FROZEN1 0 0 0 0.112 0.316 FROZEN2 0 0 0 0.150 0.357 CASHBAL 0 0 0 0.107 0.309 FIRMSIZE is the natural logarithm of (1+total assets at the end of the year). LEVERAGE is (long-term debt + debt in current liabilities) / total assets at the end of the year. ROA is income before extraordinary items and before pension expense / total assets at the end of the year. σ(ROA) is the standard deviation of ROA over the past five years, with a minimum of three years’ data required. MTB is market value of equity / book value of equity. CFO is cash from operating activities before pension contributions / total assets at the end of the year. σ(CFO) is the standard deviation of CFO over the past five years, with a minimum of three years’ data required. PLANSIZE is the natural logarithm of (1+fair value of pension plan assets at the end of the year). FUNDING is the (fair value of pension plan assets – projected benefit obligation) / projected benefit obligation, all defined at the end of the year. FUNDING2 is FUNDING*FUNDING. HORIZON is service cost / (service cost + interest cost). ARRt-1 is the actual investment return on pension plan assets / lagged total assets, for year t-1. ARRt-2 s the actual investment return on pension plan assets / lagged total assets, for year t-2. All source data are from Compustat. FROZEN1 is set to one for pension plans that were frozen before 2002. FROZEN2 is set to one for years following a pension freeze that became effective in 2002 or after. CASHBAL is set to one for years following a conversion of the plan into a cash-balance plan. FROZEN1, FROZEN2 and CASHBAL are hand-collected from disclosures made in SEC 10-K filings.
FROZEN1 -0.117*** -0.118*** FROZEN2 0.086*** 0.088*** CASHBAL -0.013 -0.016 *, **, *** indicate statistical significance at the 10%, 5% and 1% level respectively. DUMMYALT is set to one for firm-year observations where the pension plan discloses some investments in alternative assets, and set to zero otherwise. %ALT is the percentage of plan assets disclosed as being invested in alternative assets, which include private equity and venture capital funds, hedge funds, real assets, and assets disclosed as being invested in ‘limited partnerships’. FIRMSIZE is the natural logarithm of (1+total assets at the end of the year). LEVERAGE is (long-term debt + debt in current liabilities) / total assets at the end of the year. ROA is income before extraordinary items and before pension expense / total assets at the end of the year. σ(ROA) is the standard deviation of ROA over the past five years, with a minimum of three years’ data required. MTB is market value of equity / book value of equity. CFO is cash from operating activities before pension contributions / total assets at the end of the year. σ(CFO) is the standard deviation of CFO over the past five years, with a minimum of three years’ data required. PLANSIZE is the natural logarithm of (1+fair value of pension plan assets at the end of the year). FUNDING is the (fair value of pension plan assets – projected benefit obligation) / projected benefit obligation, all defined at the end of the year. FUNDING2 is FUNDING*FUNDING. HORIZON is service cost / (service cost + interest cost). ARRt-1 is the actual investment return on pension plan assets / lagged total assets, for year t-1. ARRt-2 s the actual investment return on pension plan assets / lagged total assets, for year t-2. All source data are from Compustat. %EQUITY is the percentage of defined-benefit pension plan assets invested in equities. %RE is the percentage of defined-benefit pension plan assets invested in real estate. FROZEN1 is set to one for pension plans that were frozen before 2002. FROZEN2 is set to one for years following a pension freeze that became effective in 2002 or after. CASHBAL is set to one for years following a conversion of the plan into a cash-balance plan. %EQUITY, %RE, FROZEN1, FROZEN2 and CASHBAL are hand-collected from disclosures made in SEC 10-K filings.
38
Table V: Determinants of pension plan investment in alternative assets
*, **, *** indicate statistical significance at the 10%, 5% and 1% level respectively. Standard errors are in parentheses. Standard errors are clustered at the firm level. Specifications in Panel A are estimated using logistic regression, and specifications in Panel B are estimated using OLS. DUMMYALT is set to one for firm-year observations where the pension plan discloses some investments in alternative assets, and set to zero otherwise. %ALT is the percentage of plan assets disclosed as being invested in alternative assets, which include private equity and venture capital funds, hedge funds, real assets, and assets disclosed as being invested in ‘limited partnerships’. FIRMSIZE is the natural logarithm of (1+total assets at the end of the year). LEVERAGE is (long-term debt + debt in current liabilities) / total assets at the end of the year. ROA is income before extraordinary items and before pension expense / total assets at the end of the year. σ(ROA) is the standard deviation of ROA over the past five years, with a minimum of three years’ data required. MTB is market value of equity / book value of equity. CFO is cash from operating activities before pension contributions / total assets at the end of the year. σ(CFO) is the standard deviation of CFO over the past five years, with a minimum of three years’ data required. PLANSIZE is the natural logarithm of (1+fair value of pension plan assets at the end of the year). FUNDING is the (fair value of pension plan assets – projected benefit obligation) / projected benefit obligation, all defined at the end of the year. FUNDING2 is FUNDING*FUNDING. HORIZON is service cost / (service cost + interest cost). ARRt-1 is the actual investment return on pension plan assets / lagged total assets, for year t-1. ARRt-2 s the actual investment return on pension plan assets / lagged total assets, for year t-2. All source data are from Compustat. %EQUITY is the percentage of defined-benefit pension plan assets invested in equities. %RE is the percentage of defined-benefit pension plan assets invested in real estate. FROZEN1 is set to one for pension plans that were frozen before 2002. FROZEN2 is set to one for years following a pension freeze that became effective in 2002 or after. CASHBAL is set to one for years following a conversion of the plan into a cash-balance plan. %EQUITY, %RE, FROZEN1, FROZEN2 and CASHBAL are hand-collected from disclosures made in SEC 10-K filings.
ARR (Pre-crisis) ARR (Crisis) ARR2008-2009 ARR2008-2010 PLANSIZEt-1 0.123*** -0.010 -0.034 0.014 %EQUITYt-1 0.030 -0.410*** -0.326*** -0.290*** %REt-1 0.111*** 0.080 -0.135** -0.113* DUMMYALTt-1 0.026 0.002 0.024 0.035 %ALTt-1 0.025 0.007 0.030 0.041 ARRt-1 -0.316*** 0.124* -0.113* -0.019 ARRt-2 -0.169*** -0.239*** 0.064 0.016 ARR is the actual investment return on pension plan assets / lagged total assets. ARR2008-2009 is the compounded return for fiscal years 2008 to 2009. ARR2008-2010 is the compounded return for fiscal years 2008 to 2010. PLANSIZE is the natural logarithm of (1+fair value of pension plan assets at the end of the year). %EQUITY is the percentage of defined-benefit pension plan assets invested in equities. %RE is the percentage of defined-benefit pension plan assets invested in real estate. DUMMYALT is set to one for firm-year observations where the pension plan discloses some investments in alternative assets, and set to zero otherwise. %ALT is the percentage of plan assets disclosed as being invested in alternative assets, which include private equity and venture capital funds, hedge funds, real assets, and assets disclosed as being invested in ‘limited partnerships’. ARRt-1 is the actual investment return on pension plan assets / lagged total assets, for year t-1. ARRt-2 s the actual investment return on pension plan assets / lagged total assets, for year t-2.
41
Table VII: Determinants of pension plan returns
Panel A: Comparison of pre-crisis and crisis periods
(3.353) (3.390) (4.183) (4.155) Observations 277 277 266 266 R2 13.4% 13.4% 10.3% 10.3% ARR is the actual investment return on pension plan assets / lagged total assets. ARR2008-2009 is the compounded return for fiscal years 2008 to 2009. ARR2008-2010 is the compounded return for fiscal years 2008 to 2010. PLANSIZE is the natural logarithm of (1+fair value of pension plan assets at the end of the year). %EQUITY is the percentage of defined-benefit pension plan assets invested in equities. %RE is the percentage of defined-benefit pension plan assets invested in real estate. DUMMYALT is set to one for firm-year observations where the pension plan discloses some investments in alternative assets, and set to zero otherwise. %ALT is the percentage of plan assets disclosed as being invested in alternative assets, which include private equity and venture capital funds, hedge funds, real assets, and assets disclosed as being invested in ‘limited partnerships’. ARRt-1 is the actual investment return on pension plan assets / lagged total assets, for year t-1. ARRt-2 s the actual investment return on pension plan assets / lagged total assets, for year t-2. CRISIS is set to zero for years 2002-2007, and to one for 2008.
RECENT WORKING PAPERS FROM THE CENTER FOR RETIREMENT RESEARCH AT BOSTON COLLEGE
Social Security Reform and Male Labor Force Participation Around the World Jocelyn E. Finlay and Günther Fink, June 2011 An In-Depth Look into Intergenerational Flows Oksana Leukhina and Marika Santoro, May 2011 Who Retires Early? Henry J. Aaron and Jean Marie Callan, May 2011 The Potential Impact of the Great Recession on Future Retirement Incomes Barbara A. Butrica, Richard W. Johnson, and Karen E. Smith, May 2011 Immigrant Diversity and Social Security: Recent patterns and Future Prospects Melissa M. Favreault and Austin Nichols, May 2011 Why Aren’t More Families Buying Life Insurance? Matthew S. Chambers, Don E. Schlagenhauf, and Eric R. Young, March 2011 Changes in Firm Pension Policy: Trends Away From Traditional Defined Benefit Plans Kandice A. Kapinos, February 2011 Interdependent Durations in Joint Retirement Bo Honoré and Áureo de Paula, February 2011 Health and Retirement Effects in a Collective Consumption Model of Elderly Households Arthur Lewbel and Shannon Seitz, February 2011 Age Differences in Job Displacement, Job Search, and Reemployment Richard W. Johnson and Corina Mommaerts, January 2011 The Earnings and Social Security Contributions of Documented and Undocumented Mexican Immigrants Gary Burtless and Audrey Singer, January 2011
How Important Are Intergenerational Transfers for Baby Boomers? Alicia H. Munnell, Anthony Webb, Zhenya Karamcheva, and Andrew Eschtruth, January 2011 Effect of Informal Care on Work, Wages, and Wealth Courtney Harold Van Houtven, Norma B. Coe, and Meghan Skira, December 2010
All working papers are available on the Center for Retirement Research website (http://crr.bc.edu) and can be requested by e-mail ([email protected]) or phone (617-552-1762).