38
CaixaBank Fixed Income Presentation November 2013

CaixaBank Fixed Income Presentation November 2013

Disclaimer
The purpose of this presentation is purely informative and the information contained herein is subject to, and must be read in conjunction with, all other publicly available information. In particular, regarding the data provided by third parties, neither CaixaBank, S.A. (“CaixaBank”), nor any of its administrators, directors or employees, is obliged, either explicitly or implicitly, to vouch that these contents are exact, accurate, comprehensive or complete, nor to keep them updated, nor to correct them in the case that any deficiency, error or omission were to be detected. Moreover, in reproducing these contents in any medium, CaixaBank may introduce any changes it deems suitable, may omit partially or completely any of the elements of this document, and in case of any deviation between such a version and this one, assumes no liability for any discrepancy. This document has at no time been submitted to the Comisión Nacional del Mercado de Valores (CNMV – the Spanish Stock Markets regulatory body) for approval or scrutiny. In all cases its contents are regulated by the Spanish law applicable at time of writing, and it is not addressed to any person or legal entity located in any other jurisdiction. For this reason it may not necessarily comply with the prevailing norms or legal requisites as required in other jurisdictions. CaixaBank cautions that this presentation might contain forward-looking statements. While these statements represent our judgment and future expectations concerning the development of our business, a number of risks, uncertainties and other important factors could cause actual developments and results to differ materially from our expectations. Statements as to historical performance, historical share price or financial accretion are not intended to mean that future performance, future share price or future earnings for any period will necessarily match or exceed those of any prior year. Nothing in this presentation should be construed as a profit forecast. This presentation on no account should be construed as a service of financial analysis or advice, nor does it aim to offer any kind of financial product or service. In particular, it is expressly remarked here that no information herein contained should be taken as a guarantee of future performance or results. In making this presentation available, CaixaBank gives no advice and makes no recommendation to buy, sell or otherwise deal in CaixaBank shares, or any other securities or investment whatsoever. Any person at any time acquiring securities must do so only on the basis of such person’s own judgment as to the merits or the suitability of the securities for its purpose and only on such information as is contained in such public information having taken all such professional or other advice as it considers necessary or appropriate in the circumstances and not in reliance on the information contained in this presentation. Without prejudice to legal requirements, or to any limitations imposed by CaixaBank that may be applicable, permission is hereby expressly refused for any type of use or exploitation of the contents of this presentation, and for any use of the signs, trademarks and logotypes which it contains. This prohibition extends to any kind of reproduction, distribution, transmission to third parties, public communication or conversion into any other medium, for commercial purposes, without the previous express permission of CaixaBank and/or other respective proprietary title holders. Any failure to observe this restriction may constitute a legal offence which may be sanctioned by the prevailing laws in such cases. In so far as it relates to results from investments, this financial information from the CaixaBank Group for 9M 2013 has been prepared mainly on the basis of estimates.
2

Highlights
Largest customer base in Spain with circa 20% market share in key retail products
Recent acquisitions (BCIV and BdV) strengthen regional footprint and market share leadership, generating significant cost savings
Caixabank is the sole purely domestic Spanish bank with an investment grade rating by all 3 agencies
NII +1% qoq due to improved funding costs: price of new time deposits falls to 137 bps
Sound capital position: Core Capital BIS 2.5 of 12.5%
Early delivery of BIS 3 targets: Core Capital FL already at 8.3% (pre-DTA reform)
CaixaBank stands out for the quality of its capital and for its low leverage
Leading retail franchise in Spain
Q3 results: NII turns ahead of expectations
Robust capital position
3
The stock of NPLs was reduced by €173 million in Q3
80% of NPLs backed by real collateral, 23% not past due
Coverage ratio still high at 65% even after reclassifying refinanced loans in Q2
€16.6 billion in credit provisions, €4.4 of which are generic provisions
€1.5 billion of real estate assets sold or rented year-to-date
Asset Quality stabilization
Delivering on synergies and rightsizing actions
Restructuring process continues as planned: 212 branches closed and 1,070 net departures in Q13
Synergy targets confirmed: €265 M of the €243 M expected for 2013 already booked

Share of client income flows grows on the back of strong distribution network
Capture of key income flows from customers reinforces loyalty and facilitates cross-selling
386,300 payrolls captured from January to September 2013 (+135% vs 2012)
Significant market share gain (+126 bps YTD)
4
Commercial activity
2013: latest available figures Peers: Santander, BBVA, Bankia, Sabadell and Popular Source: Social Security and FRS Inmark
14.4 14.8 15.1 15.7 15.9
20.0 21.3
12.0 12.9
6.0
11.2
1.1
6.3
8.6
8.9
2.6
2.7
2007 2008 2009 2010 2011 2012 2013
Peer 1
Peer 2
Peer 4
Undisputed leadership in payrolls Payrolls market share, %
Peer 3
Peer 5

Control of client incomes enhances share of wallet and increases cross-selling opportunities
5
2013: Latest data available Peers: Santander, BBVA, Bankia, Sabadell and Popular Source: Bank of Spain, INVERCO, ICEA and FRS Inmark
High market shares in key retail products
Market share, %
Retail strength results in the highest customer penetration among peers
Customer penetration, %
20.4 21.0 21.6 21.0 21.0
26.1 27.4
16.0 15.5
9.8
14.1
1.8
8.6
11.0 13.5
4.0 4.7
2007 2008 2009 2010 2011 2012 2013
Peer 2
Peer 1
Peer 4
(1) Loans + deposits (2) Other Resident Sectors according to Bank of Spain (3) Includes PPIs + PPAs
Peer 3
Peer 5
“Non-traditional” products also show high market share growth
2007 market share growth
17.8%
17.6%
14.1%
11.2%
5.6%
9.1%
9.8%
11.5%
9.4% Business volume(1)
Demand deposits
Deposits(2)
Loans(2)
Mutual funds
Pension plans(3)
Saving insurance
POS terminal turnover
14.7%
15.3%
14.2%
15.2%
14.2%
17.9%
19.8%
23.6%
+5.3%
+3.8%
+4.4%
+6.1%
+8.6%
+6.7%
+5.7%
+5.8%
Credit cards turnover +2.8% 20.4%
Commercial activity

Continued reduction of the funding gap as macro deleveraging trend persists
Business volume: Loan book and customer funds In Billion Euros
(1) Deducting BdV figures as of 31/12/12 – includes changes under CABK management (2) Retail funds defined as: deposits, CP, retail debt securities (including sub. debt), mutual funds, pension plans and other retail off-balance sheet products. (3) Excluding the impact of the conversion of certain bank financing into bonds
Loan-book deleveraging continues as expected
Positive evolution of retail funds reflects commercial strength
Funding gap maintains a strong reduction: LTD ratio now at 118% (-10 pp YTD)
Pricing discipline in deposits leads to migration to long-term fee-generating products
Slight increase in retail funds and continued deleveraging lead to a significant reduction in LTD ratio to 118%
Dec-12 Sep-13
514.0 514.6
6
YTD
-2.1% -7.6%
+3.8% +0.7%
Total Organic1
Retail funds2
Loans3
Business volume
+0.1% YTD
+4.5%
-4.4%
Inorganic
Organic1
Commercial activity

(1.9%)
4.1%
(0.8%)
(1.7%)
0.7%
(8.7%)
(1) Deducting BdV data at 31/12/12- includes changes under CABK management (2) Balances are reduced as CP converts into deposits and BCIV MCB converts into shares (3) Primarily includes regional govt. securities, and Caja de Ahorros y Pensiones de Barcelona sub debt. Balance is reduced due to the maturity of Repsol preferred shares
Volumes of retail funds stable despite strict pricing policy on deposits
7
Successful management of retail fund volumes despite strict pricing: +0.7% qoq
Fall in demand deposits impacted by Q2 seasonality
Insurance, pension plans and mutual funds continue to benefit from client migration
Wholesale funding being gradually reduced
Total customer funds breakdown In Billion Euros
I. Customer funds on balance sheet
Demand deposits
Time deposits
Debt securities2
Subordinated liabilities2
Institutional issuance
Insurance
Other funds
II. Off-balance sheet funds
Mutual funds
Pension plans
Other managed resources3
Total customer funds
Retail funds
Wholesale funds
243.8
74.0
82.5
3.0
3.6
47.6
30.0
3.1
55.6
26.5
16.3
12.8
299.3
251.7
47.6
2.4%
6.9%
7.8%
(66.3%)
(17.0%)
(1.6%)
7.5%
8.6%
5.1%
15.9%
3.8%
(10.7%)
2.9%
3.8%
(1.6%)
YTD 30th Sep. Organic1 YTD (%)
+3.7%
-0.8%
Inorganic
Organic1 Total customer funds
+€8.4bn (+2.9%)
Commercial activity

Significant deleveraging continues as clients reduce debt levels
(1) Deducting BdV data at 31/12/12- includes changes under CABK management (2) Excluding the impact of the conversion of bank financing into bonds
Reduction of the loan book continues as country deleverages:
Real Estate developer loan book continues its strong decline
Business loans impacted by low credit demand for capex:
o Large corporates continue to benefit from wholesale funding markets
o Improved macro environment should lead to credit demand normalization
8
Loan-book breakdown In Billion Euros, gross
I. Loan to individuals
Residential mortgages – home purchases
Other
II. Loan to businesses
Non -RE businesses
Real Estate developers
RE subsidiaries
Loans to individuals & businesses
III. Public sector
Total loans
119.9
88.8
31.1
84.9
59.6
23.7
1.6
204.9
10.4
215.3
0.6%
1.3%
(1.3%)
(6.3%)
(3.8%)
(12.3%)
(2.0%)
(2.4%)
(20.6%)
(3.5%)
YTD 30th Sep.
(4.6%)
(13.1%)
(9.2%)
(23.2%)
Organic1 YTD (%)
+5.5%
-7.6%
Inorganic
Organic1 Loan book2
(-2.1%)
NOTE: Excluding the impact of the conversion of certain bank financing into bonds
(2.1%) (7.6%)
Commercial activity
9M 2013 Financial Results
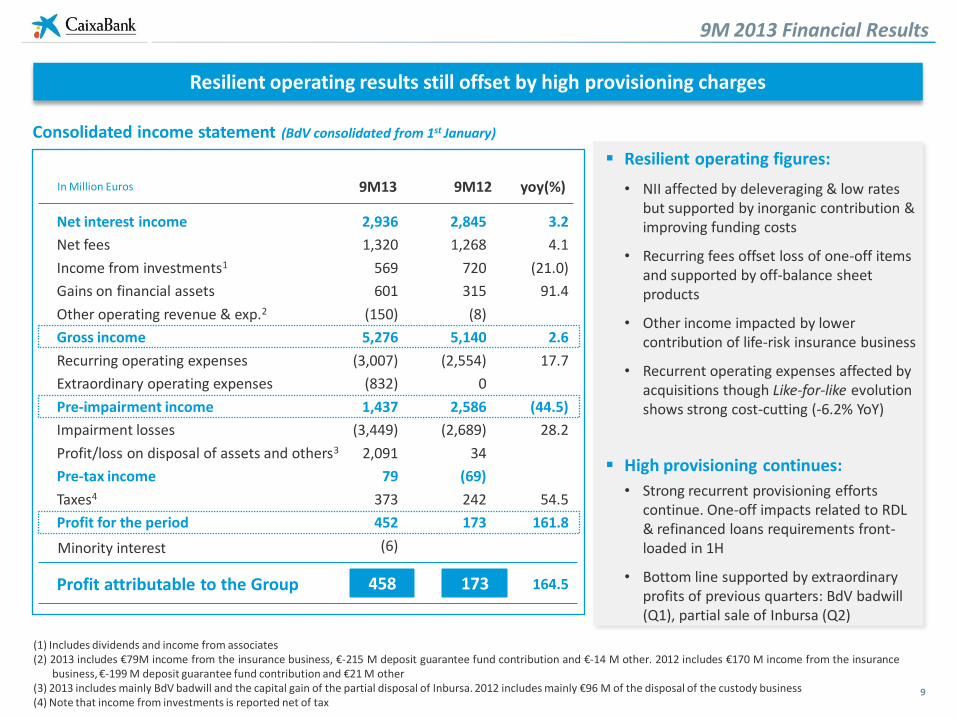
Consolidated income statement (BdV consolidated from 1st January)
9
Resilient operating results still offset by high provisioning charges
(1) Includes dividends and income from associates (2) 2013 includes €79M income from the insurance business, €-215 M deposit guarantee fund contribution and €-14 M other. 2012 includes €170 M income from the insurance
business, €-199 M deposit guarantee fund contribution and €21 M other (3) 2013 includes mainly BdV badwill and the capital gain of the partial disposal of Inbursa. 2012 includes mainly €96 M of the disposal of the custody business (4) Note that income from investments is reported net of tax
9M12
Net interest income
Net fees
Income from investments1
Gains on financial assets
Other operating revenue & exp.2
Gross income
Recurring operating expenses
Extraordinary operating expenses
Pre-impairment income
Impairment losses
Profit/loss on disposal of assets and others3
Pre-tax income
Taxes4
Profit for the period
Profit attributable to the Group
2,845
1,268
720
315
(8)
5,140
(2,554)
0
2,586
(2,689)
34
(69)
242
173
yoy(%)
3.2
4.1
(21.0)
91.4
2.6
17.7
(44.5)
28.2
54.5
161.8
164.5
9M13
2,936
1,320
569
601
(150)
5,276
(3,007)
(832)
1,437
(3,449)
2,091
79
373
452
(6)
458 173
In Million Euros
Minority interest
Resilient operating figures:
• NII affected by deleveraging & low rates but supported by inorganic contribution & improving funding costs
• Recurring fees offset loss of one-off items and supported by off-balance sheet products
• Other income impacted by lower contribution of life-risk insurance business
• Recurrent operating expenses affected by acquisitions though Like-for-like evolution shows strong cost-cutting (-6.2% YoY)
High provisioning continues:
• Strong recurrent provisioning efforts continue. One-off impacts related to RDL & refinanced loans requirements front-loaded in 1H
• Bottom line supported by extraordinary profits of previous quarters: BdV badwill (Q1), partial sale of Inbursa (Q2)
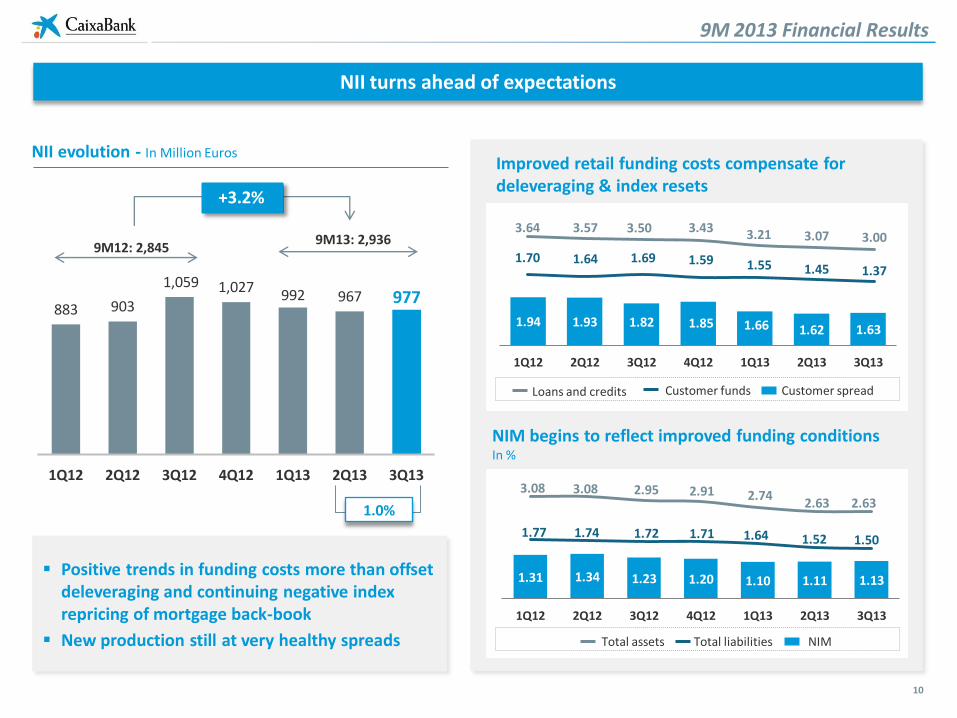
NII turns ahead of expectations
10
NII evolution - In Million Euros
883 903
1,059 1,027 992 967 977
1Q12 2Q12 3Q12 4Q12 1Q13 2Q13 3Q13
+3.2%
9M12: 2,845 9M13: 2,936
1.0%
Positive trends in funding costs more than offset deleveraging and continuing negative index repricing of mortgage back-book
New production still at very healthy spreads
NIM begins to reflect improved funding conditions In %
Improved retail funding costs compensate for deleveraging & index resets
3.64 3.57 3.50 3.43 3.21 3.07 3.00
1.70 1.64 1.69 1.59 1.55 1.45 1.37
Customer funds Loans and credits Customer spread
1.94 1.93 1.82 1.85 1.66 1.62 1.63
1Q12 2Q12 3Q12 4Q12 1Q13 2Q13 3Q13
1.31 1.34 1.23 1.20 1.10 1.11 1.13
3.08 3.08 2.95 2.91 2.74 2.63 2.63
1.77 1.74 1.72 1.71 1.64 1.52 1.50
1Q12 2Q12 3Q12 4Q12 1Q13 2Q13 3Q13
Total liabilities NIM Total assets
9M 2013 Financial Results

Successful management of time deposits spreads has been critical to offset low rate impacts
11
Strict pricing discipline leads to a significant reduction in new time deposit costs
New asset production continues at high spreads, with limited impact due to the lack of credit demand
Time deposits and retail CP - Back vs. front book (bps)
Loan book yields - Back vs. front book (bps)
254 258 244 235
224
180 173
137
4Q12 1Q13 2Q13 3Q13
343 321 307 300
430 424 465 472
4Q12 1Q13 2Q13 3Q13
Front book Back book Front book Back book
-30 bps
-71 bps
+158 bps +172 bps
-98 bps
Favourable trends on deposit costs though maturity profiles delay impact
Back book still affected by negative Euribor 12M index resets
-78 bps +103 bps +87 bps
9M 2013 Financial Results

12
High provisioning charges continue while weak economic conditions persist
(1) Includes provisions for contingencies and losses on financial investments (2) €1bn related to BCIV and €1.5 bn to BdV loan book (gross) after accounting for APS
Recurrent charges consistent with previous quarters Recurrent credit impairments, In Million Euros
952 1,018
1,387
633
1H12 2H12 1H13 3Q13
High provisioning efforts to continue in upcoming quarters:
o Economy stabilising but still with significant headwinds
o Generic provisions cannot be reallocated to other loan books
9M13 Total Impairments In Million Euros
Pending RDL 18/2012
Provisions for refinanced loans
Less: transfer from RE generic
Other credit provisions
Other provisions1
Impairment losses
Fair Value Adjustments2
902
540
(165)
2,020
152
3,449
2,507
TOTAL impairments: €5,956 M
9M 2013 Financial Results

Asset quality
Organic trends confirm gradual reduction in pace of NPL formation
13
Stabilisation trends in new NPL formation
NPL ratio increases partly due to denominator effect (deleveraging)
NPLs (in Billion Euros)
11.8 20.5 22.6
8.5 2.0
3.3
3Q12 4Q12 1Q13 2Q13 3Q13
BCIV BdV
25.7 25.9 22.5 20.2 20.3
Refinanced loans
NPL coverage remains high at 65% after front-loading required provisions on refinanced loans in 1H13
63% 63%
77%
66% 65%
3Q12 4Q12 1Q13 2Q13 3Q13
65%
€25.7 bn Total NPLs
~80% Backed by real collateral
€6.6 bn Are not past due (25% of total)
11.40% NPL ratio
6.69% Ex RE developers
€16.6 bn Total Credit provisions
Including: €4.4 bn Generic Provisions

NPL ratios affected by reclassification of refinanced loans and denominator effect
14 (1) Includes contingent liabilities
5.72%
4.54%
9.11%
21.59%
10.29%
51.53%
1.39%
11.40%
NPL1 ratio by segments
Loans to individuals
Residential mortgages - home purchase
Other
Loans to businesses
Corporate and SMEs
Real Estate developers
Public sector
Total loans
Ex- Real Estate developers
NPL 30th Jun
5.67%
4.70%
8.37%
20.98%
9.41%
50.59%
1.54%
11.17%
6.41%
NPL 30th Sep
6.69%
NPL 31st Dec
3.57%
2.80%
5.72%
17.24%
5.96%
44.22%
0.74%
8.63%
3.98%
Ratio affected by extraordinary items
Residential mortgages continue to show resilience while pressure remains on SMEs as economic weakness persists
RE Developer ratio deteriorates at lower pace and transfer to foreclosed assets continues
Key drivers of YTD NPL ratio evolution:
YTD change: +277bps
• Banco de Valencia
• Refinanced loans
• Deleveraging (lower denominator)
• NPL formation
+23bps
+134bps
+101bps
+19bps
Asset quality
119.9
88.8
31.1
84.9
59.6
25.3
10.4
Loan Book € Bn
215.3

584 763 897
-198
380 64
-173
528
566 462
1,190
831
566
329
Mar-12 Jun-12 Sep-12 Dec-12 Mar-13 Jun-13 Sep-13
Total NPLs Foreclosed RE
15
Falling net inflows of problematic assets consistent with improving macro
Organic evolution confirms progressive reduction of new net NPL formation
High foreclosure levels gradually offset by commercial activity
(1) Evolution of total gross NPLs (excluding provisions) and total gross foreclosed assets (quarterly variation of the loan-equivalent amounts), excluding the impact of BCIV and BdV acquisitions and the impact of the reclassification of €3.3bn of refinanced loans to NPLs materialized in 2Q13
Expect this gradual trend to continue:
Stabilisation of the economy
Increased activity in Real Estate market
Continued positive evolution of 0-90 days past due bucket
NPLs & Foreclosed assets1 – Organic QoQ variation €M
1,112 1,329 1,359
992 1,211
156
Positive Evolution of 0-90 Days Past Due Bucket Rebased to 100
630
100 92
67 70 66 57 50 39
Jul-12 Sep-12 Nov-12 Jan-13 Mar-13 May-13 Jul-13 Sep-13
BdV
Asset quality

Clean-up of real estate loan exposure an ongoing process
16
RE developer loans breakdown evolution In Billion Euros
Provisions (in Billion Euros)
Coverage
NPL 6.1 49.6%
Substandard 0.7 29.8%
Performing 1.9 21.4%
Provisions for RE developer loans
8.7 36.9%
Better mix than peers:
o Exposure to land of 19.5%, o/w €4 bn out of €4.6 bn already classified as problematic with 55% specific provisions
o 58.7% is finished housing
Coverage of problematic loans at 59%1
Coverage of total developer loans at 36.9% - close to OW adverse scenario of 37.6% EL
(1) Includes €1.9 bn of generic RE provision but excludes collateral value
14.0 12.0 11.2 9.8 8.9
3.7 3.1 2.8
2.6 2.6
12.2 11.9 12.5
12.6 12.2
9M12 4Q12 1Q13 1H13 9M13
29.9
Performing
Substandard
NPL
23.7 27.0 26.5 25.0
+€0.9 bn
-€4.2 bn
Non-organic
Organic RE developer loans
YTD -€3.3 bn
Asset quality
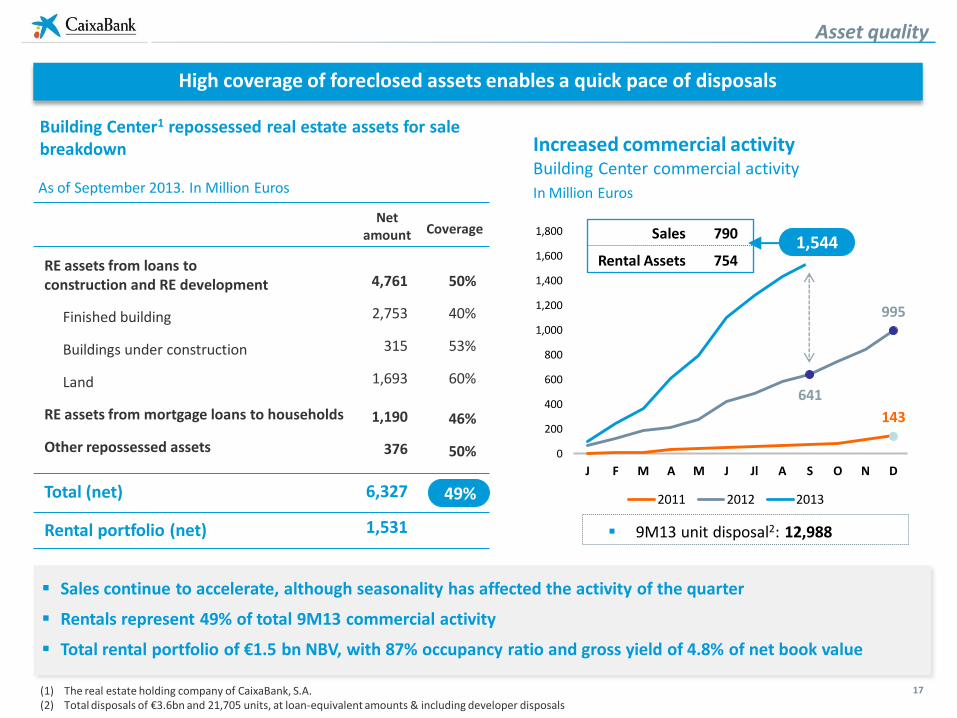
High coverage of foreclosed assets enables a quick pace of disposals
17
Building Center1 repossessed real estate assets for sale breakdown
Sales continue to accelerate, although seasonality has affected the activity of the quarter
Rentals represent 49% of total 9M13 commercial activity
Total rental portfolio of €1.5 bn NBV, with 87% occupancy ratio and gross yield of 4.8% of net book value
(1) The real estate holding company of CaixaBank, S.A. (2) Total disposals of €3.6bn and 21,705 units, at loan-equivalent amounts & including developer disposals
RE assets from loans to construction and RE development
Finished building
Buildings under construction
Land
RE assets from mortgage loans to households
Other repossessed assets
Total (net)
Rental portfolio (net)
4,761
2,753
315
1,693
1,190
376
6,327
1,531
50%
40%
53%
60%
46%
50%
49%
Net amount Coverage
As of September 2013. In Million Euros
Increased commercial activity Building Center commercial activity
In Million Euros
1,544 790
754
Sales
Rental Assets
9M13 unit disposal2: 12,988
143
641
995
0
200
400
600
800
1,000
1,200
1,400
1,600
1,800
J F M A M J Jl A S O N D
2011 2012 2013
Asset quality

Access to wholesale markets at attractive prices a reflection of liquidity position
(1) Includes cash, interbank deposits, accounts at central banks and unencumbered sovereign debt (2) €6.8bn from CABK + €5.8bn from BdV (3) Defined as: gross loans (€215,312M) net of loan provisions (€16,133 M) (total loan provisions excluding those corresponding to contingent guarantees) and excluding pass-
through funding from multilateral agencies (€7,364 M) / retail funds (deposits, retail issuances) (€163,040 M)
Total available liquidity
In Billion Euros
LTRO facility: €21.5 bn (€12.6 bn2 prepaid in 1H13)
Existing liquidity > pending LTRO
Wholesale maturities and LTRO repayment can be comfortably managed:
Proven access to market at attractive prices: €4.75bn issued in 2013, €1.75bn in Q3 2013:
Oct’13: issuance of €1bn of 3.5yr senior unsecured at MS+170
Oct’13: issuance of €0.75bn of 10NC5 subordinated debt at MS+395
Strong deleveraging has gradually reduced funding gap
LTD ratio evolution3
128% 125% 118%
Dec'12 Mar'13 Jun'13 Sep'13
117%
18
€3.5bn
2013
€8.6 bn
2014
€7.0 bn
2015
35.6 44.5
17.5
21.8
Dec'12 Sep'13
Unused ECB discount facility
Balance sheet liquidity1
53.1
66.3
As a % of total assets
15.2% 19.3%
Wholesale maturities as of September 30th
Liquidity and funding

Access to wholesale markets at attractive prices a reflection of liquidity position
19
Liquidity and funding
Stats:
Book/Orders 5000/320
Non Spanish Allocation 82%
Real Money Accounts 81%
Issuer RatingDeal
SizeMaturity Spread Coupon Stats
M/S&P/F Book / orders
Banco Popular Ba1/BB/BB+ €750 2.5 MS+362 4.00% 1300/176
CaixaBank Baa3/BBB-/BBB €1,000 3 MS+285 3.25% 5000/320
BBVA Baa3/BBB-/BBB+ €1,500 3 MS+273 3.25% 3600/340
BBVA Baa3/BBB-/BBB+ €1,500 5 MS+295 3.75% 5400/381
Santander Baa2/BBB/BBB+ €1,000 7 MS+275 4.00% 1200/200
Issuer RatingDeal
SizeMaturity Spread Coupon Stats
M/S&P/F
Book / orders
Bankinter A3/-/A- €500 3.5 MS+220 2.75% 3000
Kutxa Aa3/-/AA- €750 4 MS+220 3.00% 3750/200
Santander Aa3/-/- €2,000 5 MS+195 2.875% 2600/186
Bankinter A3/-/A- €500 5 MS+220 3.125% 700
Sabadell A3/-/- €1,000 5 MS+250 3.375% 3300
CaixaBank A3/AA-/- €1,000 5 MS+210 3.00% 2700/180
Popular Aa3/-/- €500 6 MS+270 3.75% 1100/100
BBVA Aa3/-/- €1,000 10 MS+215 3.875% 3000/160
Spanish Senior Unsecured issues in 2013
Spanish Covered Bond issues in 2013
Stats:
Issuer RatingDeal
SizeMaturity Spread Coupon Stats
M/S&P/F Book / orders
Banco Popular Ba1/BB/BB+ €750 2.5 MS+362 4.00% 1300/176
CaixaBank Baa3/BBB-/BBB €1,000 3 MS+285 3.25% 5000/320
BBVA Baa3/BBB-/BBB+ €1,500 3 MS+273 3.25% 3600/340
BBVA Baa3/BBB-/BBB+ €1,500 5 MS+295 3.75% 5400/381
Santander Baa2/BBB/BBB+ €1,000 7 MS+275 4.00% 1200/200
Issuer RatingDeal
SizeMaturity Spread Coupon Stats
M/S&P/F
Book / orders
Bankinter A3/-/A- €500 3.5 MS+220 2.75% 3000
Kutxa Aa3/-/AA- €750 4 MS+220 3.00% 3750/200
Santander Aa3/-/- €2,000 5 MS+195 2.875% 2600/186
Bankinter A3/-/A- €500 5 MS+220 3.125% 700
Sabadell A3/-/- €1,000 5 MS+250 3.375% 3300
CaixaBank A3/AA-/- €1,000 5 MS+210 3.00% 2700/180
Popular Aa3/-/- €500 6 MS+270 3.75% 1100/100
BBVA Aa3/-/- €1,000 10 MS+215 3.875% 3000/160
Spanish Senior Unsecured issues in 2013
Spanish Covered Bond issues in 2013
Book / orders 2500/161
Non Spanish Allocation 71%
Real Money Accounts 78%
Issuer RatingDeal
Size
Issuance
dateMaturity Spread Coupon Stats
M/S&P/F
Book / orders
Cajamar Baa2/-/BBB €500 07/05/2013 3 MS+290 3.375% 900 / 108
Bankinter A3/-/A- €500 10/01/2013 3.5 MS+220 3000
Bankinter (tap) A3/-/A- €500 29/04/2013 3.3 MS+172 1000 / 75
Popular A3 €400 13/05/2013 4 MS+205 4.125% 525 / 45
Kutxa Aa3/-/AA- €750 18/01/2013 4 MS+220 3.00% 3750/200
Popular Baa2 €750 02/09/2013 4 MS+240 3.50% 800 / 100
Santander Aa3/-/- €2,000 21/01/2013 5 MS+195 2.875% 2600/186
Bankinter A3/-/A- €500 24/01/2013 5 MS+220 3.125% 700
Sabadell A3/-/- €1,000 11/01/2013 5 MS+250 3.375% 3300
CaixaBank A3/AA-/- €1,000 12/03/2013 5 MS+210 3.000% 2700/180
Popular A3 €500 14/01/2013 6 MS+270 1100/100
Popular (tap) A3 €100 30/04/2013 6 MS+235
BBVA Aa3/-/- €1,000 17/01/2013 10 MS+215 3.875% 3000/160
2.75%
3.75%
Book / orders 2800 / 150
Non Spanish Allocation 65%
Real Money Accounts 83%
Book / Orders 2700/180
Non Spanish Allocation 79%
Real Money Accounts 71%
Spanish Subordinated Debt Issues in 2013 Stats:
Issuer Rating
Deal
Size
Issuance
dateMaturity Spread Coupon
M/S&P/F
CaixaBank -/BB+/BBB- €750 29/10/2013 10NC5 MS+395 5.000%
Book / orders 3300 / 300
Non Spanish Allocation 87%
Real Money Accounts 74%
Issuer RatingDeal
Size
Issuance
dateMaturity Spread Coupon
M/S&P/F
Banco Popular Ba1/BB/BB+ €750 08/01/2013 2.5 MS+362 4.00%
Banco Popular Ba3/BB-/BB+ €750 06/11/2013 2.5 MS+232 2.875%
CaixaBank Baa3/BBB-/BBB €1,000 09/01/2013 3 MS+285 3.25%
BBVA Baa3/BBB-/BBB+ €1,500 05/03/2013 3 MS+273 3.25%
CaixaBank Baa3/BBB-/BBB €1,000 07/10/2013 3.5 MS+170 2.500%
BBVA Baa3/BBB-/BBB+ €1,500 03/01/2013 5 MS+295 3.75%
CaixaBank Baa3/BBB-/BBB €1,000 30/04/2013 5 MS+245 3.125%
Santander Baa2/BBB/BBB+ €1,000 16/01/2013 7 MS+275 4.00%

2
0
Assets Encumbrance
Liquidity and funding
UNENCUMBERED
LOANS PORTFOLIO TOTAL
RMBS/ABSTOTAL
ENCUMBERED
TOTAL
UNENCUMBEREDLEGALLY
REQUIRED
COLLATERAL
REMAINING
COLLATERAL
MORTGAGES PORTFOLIO (ex - sec) 139,932 93,538 46,393 --- 139,932 ---
PUBLIC SECTOR PORTFOLIO (ex - sec) 12,049 10,000 2,049 --- 12,049 ---
OTHER LOANS PORTFOLIO (ex - sec) 28,232 --- --- --- --- 28,232
SECURITISATIONS (**) 9,632 --- --- 9,632 9,632 ---
LOANS TO CUSTOMERS 189,845 103,538 48,442 9,632 161,612 28,232
REPOS / ENCUMBERED ASSETS 10,488 --- --- --- 10,488 ---
INSURANCE COMPANIES ASSETS (ENCUMBERED) 32,897 --- --- --- 32,897 ---
REST OF ASSETS (UNENCUMBERED) 109,445 --- --- --- --- 109,445
TOTAL ASSETS 342,675 103,538 48,442 9,632 204,997 137,678
ENCUMBERED
(*) Legally required OC ratio is 125% for Mortgage CB and 142,9% for Public Sector CB. Nevertheless, CB are backed by the whole portfolio, which thus it's fully encumbered.
(**) It includes all type of securitized loans
(***) Related to collateral agreements (CSA/GMRA/other)
COVERED BONDS*
c c
PUBLIC ISSUANCE
RETAINED/ECB
COLLATERAL TOTAL ISSUED
MORTGAGE COVERED BONDS 40,541 34,289 74,831
PUBLIC SECTOR COVERED BONDS 350 6,650 7,000
RMBS/ABS (***) 2,118 7,513 9,632
SENIOR DEBT (except GGB) 7,621 154 7,775
GOVERNMENT GUARANTEED BONDS 1,485 320 1,805
TOTAL ISSUED 52,116 48,927 101,042
30/09/2013

3,615
9,010
7,262 7,175
4,022
5,648
2,484
379
2,874
1,394
250
2,364
610 450 189 90 20 44 20 163
-
2,000.00
4,000.00
6,000.00
8,000.00
10,000.00
12,000.00
2013 2014 2015 2016 2017 2018 2019 2020 2021 2022 2023 2025 2027 2031 2037 2038 2046 2047 2048 Perp.
Senior Debt (includes GGB) Covered Bonds Subordinated debt/Preferred Stock Other
21
(1) Data in Million €, excluding retained issues, and including GGBs Bancaja. Bonds issued in October 2013 are not included yet. (Issued in October -> € 1 bn senior unsecured bond (maturity 2017) , and € 0.75 bn sub debt 10NC5)
Source: CaixaBank
Institutional Caixabank&BdV’s Issues: Maturity Profile as of September 2013 1
INSTITUTIONAL DEBT OUTSTANDING1: 48.064 € Mn
Liquidity and funding

12.5% 11.6% 11.4% 11.4% 10.3% 10.3%
0%
5%
10%
15%
Peer 1 Peer 2 Peer 3 Peer 4 Peer 5
Dec'12 Sep'13
Solvency
Sound capital position
BIS-2.5 Core Capital evolution
In %
Core Capital
RWAs
17.7 bn
161.2 bn
17.7 bn
141.4 bn
22
(1) Mainly includes the impact of restructuring costs, the charges related to refinanced loan book, the booking of €700M of net FV adjustments attributable to the BCIV acquisition and other non-recurrent adjustments
(2) DTAs as of Sept 30th include €2.8 bn of temporary differences related to credit provisions and foreclosed assets (3) Peers include: Bankia, BBVA, Popular, Sabadell and Santander. Last reported figures
11.0%
+169bps 12.5%
Organic
-31bps
+64bps
Inbursa
Other non-recurrent
items1
+62bps
BdV
-66bps RDL
18/2012
-43bps
FROB Prepayment
Core Capital BIS-3 FL (Sep’13)
8.3%
BIS-2.5 Core Capital peer comparison3
In %
Reinforcement of Core Capital continues: 150 bps of core capital generated in 9 months despite €1bn of BCIV FROB prepayment
Early delivery of year-end BIS-3 FL targets. Core Capital BIS-3 FL stands at 8.3%.
Main impact under BIS-3 FL regime related to DTA deductions: significant capital uplift from the outcome of the negotiation on DTAs expected by year end2

23
26.1%
CaixaBank has grown its Core Capital base by more than 30% since Dec 2010… without resorting to public aid, rights issues or selling core assets, and while absorbing significant provisions
Core Capital evolution
Strong capital generation
13.4
16.6 17.2 17.1
18.1
17.7
8.9%
11.3%
12.5% 13.0%
11.6%
12.5%
100
110
120
130
140
150
160
170
180
190
200
d-10 m-11 j-11 s-11 d-11 m-12 j-12 s-12 d-12 m-13 j-13 s-13
Core Capital % Core Capital
-7%
-4%
-2%
3%
6%
14%
14%
20%
22%
25%
27%
30%
30%
39%
58%
-7% -2% 3% 8% 13% 18% 23% 28% 33% 38% 43% 48% 53% 58%
Peer 1
Peer 2
Peer 3
Peer 4
Peer 5
Peer 6
Peer 7
Peer 8
Peer 9
Peer 10
Peer 11
Peer 12
CaixaBank
Peer 14
Peer 15
Core Capital Base growth since Dec 2010
Peers Include ABN, Barclays, Commerzbank, CS, DB, ING, Lloyds, Nordea, Rabobank, RBS, SEB, SHB, SG and UBS. Last reported accounts
Average ex-CaixaBank: 17%
(bn€)
+3.2%
10.6%
+ €4.3 bn
Solvency

Access to wholesale markets: The First benchmark Tier 2 out of Spain since 2007
Basel 2.5 Leverage Ratio (%)
24
Solvency
Instrument: Subordinated Non-Deferrable Securities
Tier 2 issue – Terms
Issue Ratings: BB+/BBB- (S&P/Fitch) Issue Date: 29/10/2013
Maturity Date: 14/11/2013 (10NC5)
Optional Redemption: One time issuer call after 5 years (14/11/2018) Coupon: 5%
Interest: 5% payable annually till 14/11/2018. Then, MS 5y prevailing at the issuer call date + 395 bps
Tier 2 issue – Main objectives
Reinforce total capital position and loss-absorption capacity
Diversify capital and funding bases
Distribution by Geography Distribution by Investor Type
459 INVERSORES DEUDA SENIOR More than 450 investors participated in our 3 senior unsecured
issuances
c. 30% out of them also took part in our recent Tier 2 transaction
Around 300 investors in the Tier 2 deal: 172 were new
AROUND 630 INVESTORS
Investors participation in
CaixaBank Senior & Sub Debt (2013)
Size: €750 mm

RWAs / Assets (%)
Peers Include ABN, Bankia, Barclays, BBVA, Commerzbank, CS, DB, ING, Lloyds, Nordea, Popular, Rabobank, RBS, Sabadell, Santander, SEB, SHB, SG and UBS. Last reported accounts Leverage ratio is defined as CET1 B2.5 over Total Assets
CaixaBank stands out for the quality of its capital and for its low leverage
55.2% 53.6%
46.2% 42.1% 41.3%
36.3% 35.8% 33.5% 32.9% 32.3% 31.6% 30.1% 28.7%
25.6% 25.3% 25.0% 22.3% 21.5%
18.6% 16.5%
0%
5%
10%
15%
20%
25%
30%
35%
40%
45%
50%
55%
60%
Peer 1 Peer 2 Peer 3 Peer 4 Peer 6 Peer 7 Peer 8 Peer 9 Peer 10 Peer 11 Peer 12 Peer 13 Peer 14 Peer 15 Peer 16 Peer 17 Peer 18 Peer 19 Peer 20
6.1% 5.8%
5.3% 5.2% 4.9% 4.9% 4.5%
4.1% 4.0% 4.0% 3.9% 3.9% 3.8% 3.8% 3.7% 3.6% 3.5%
2.8% 2.8% 2.2%
0%
5%
Peer 1 Peer 2 Peer 3 Peer 5 Peer 6 Peer 7 Peer 8 Peer 9 Peer 10 Peer 11 Peer 12 Peer 13 Peer 14 Peer 15 Peer 16 Peer 17 Peer 18 Peer 19 Peer 20
Basel 2.5 Leverage Ratio (%)
25
Solvency

26
Covered Bond Label Compliant since 1st January 2013
Moody’s Investors Service A3
AA-
Best rated Covered Bonds in Spain
High quality collateral & strong overcollateralization
Low risk profile: mortgage portfolio prudently managed
Always aiming to the best market standards Transparency: complete quarterly information available in our
web page: http://www.caixabank.com/inversoresinstitucionales/inversoresrentafija_en.html
Solid OC levels Total OC: 187% -> and flexibility to optimize our collateral:
Legal OC: 130%
34 bn of retained /unused Covered Bonds
….Despite following eligibility criteria stricter than legal
Almost 70% of residential loans, out of which:
90% with LTV < 80%
89% First home loans
Comfortably above the legally required ratio (125%)….
Remaining Issuing Capacity: 4,4€ Bn (mortgage & public sector CB)
CaixaBank Covered Bonds Programme - Highlights
Covered Bonds

Mortgage Covered Bond Programme
CaixaBank Covered Bonds Programmes - Main figures Sept ‘13
27
Spanish Public Sector Covered Bond Programme
Issuing capacity & Collateral type
Remaining Issuing Capacity 4,436 € Bn Collateral by Type
65%27%
8%
Residential Commercial Public Sector
RATINGS 30/09/2013
Moody's A3
S&P AA-
RATINGS 30/09/2013
Moody's A3
Mortgages CB; 3,002
Public Sector CB; 1,434
MORTGAGE COVER BONDS 30/09/2013
Outstanding nominal (mill €) 74,831
OC (total) 187%
OC (legal - eligible portfolio) 130%
Issuing Capacity 3,002
Average Maturity (years) 6.11
PUBLIC SECTOR COVER POOL
Cover Pool Size (mill €) 12,049
Number of loans 6,857
Average loan Balance (€) 1,757,161
WA Seasoning (years) 3.5 yrs
WA Remaining Term (years) 6.5 yrs
30/09/2013 PUBLIC SECTOR COVER BONDS 30/09/2013
Outstanding nominal (mill €) 7,000
OC 172%
Issuing Capacity 1,434
Average Maturity (years) 2.6
MORTGAGE COVER POOL 30/09/2013
Cover Pool Size (mill €) 139,932
Residential Assets 71%
Comercial Assets 29%
Elegible Pool (mill €) 97,291
Number of loans 1,482,926
Average loan Balance (€) 94,362
WA Seasoning (years) 6.5
WA Remaining Term (years) 19.5
WA LTV 57.4%
WA LTV Elegible Pool 52.9%
Covered Bonds

2,692
7,407
5,708
6,029
4,041
3,999
2,144
379
2,874
1,354
250
0
0
0450
189 90
20
952
459
1,325
303
2,031
3,247
3,010
3,500976
2,0631,300
3,500
2,464
4,250
1,900
0
0
1,000
2,000
3,000
4,000
5,000
6,000
7,000
8,000
9,000
2013
2014
2015
2016
2017
2018
2019
2020
2021
2022
2023
2024
2025
2026
2027
2028
2031
2037
2038
2048
Public Issues Retained Issues
Total Collateral Eligible vs non-eligible Max. CB Issuance Outstanding CBs vs Remaining Issuing
Capacity
139.9
97.3
77.8 74.8
42.6
3.0
28
CaixaBank Mortgage Covered Bond Programme Sept ‘13
Remaining Issuing Capacity
x 80%
ELIGIBLE
REMAINING ISSUING CAPACITY: 3 Bn €
Maturity Profile
Total Covered Bonds -> 74,831 € Bn Public -> 40,541 € Bn Retained -> 34,289 € Bn
Issued
In Billion €
Mortgages Public Sector
Total Collateral for Covered Bonds 145,758 11,659 Elligible Portfolio 101,130 11,659
Cédulas
Hipotecarias
Cédulas
Territoriales
Used Collateral 99,199 9,571 Covered Bond Issued Amount 79,359 6,700
Over Collaterization (**) 184% 174%
Available Collateral 1,932 2,087
REMAINING ISSUING CAPACITY (*) 1,545 1,461 Mn €
(*) Issuing Capacity= 80% of Collateral Available for C. Hipotecarias and 70% for C. Territoriales
(**) Due to the early amortisation of € 3 Bn of retained cedulas on April 15th, OC ratio is currently higher
Data in Million €
3,006 Available Issuing Capacity
86,1€ bn
89,1 € bn
113 bn
157 € bn
≈ 3 € bn Remaining
Issuing Capacity
44 € bn
Outstanding CBs
Max. CB Issuance
Elegible vs non-elegible
Total Collateral (Mortgages+Public
Sector)
(**) Data in million €
Mortgages
Total Collateral for Covered Bonds 139,932 Elligible Portfolio 97,291
Cédulas
Hipotecarias
Used Collateral 93,538 Covered Bond Issued Amount 74,831
Over Collaterization 187%
Available Collateral 3,752
REMAINING ISSUING CAPACITY (*) 3,002
Covered Bonds

29
CaixaBank Mortgage Covered Bond Programme Sept ‘13
OC Evolution
OC Legal
130%
Decision of generating additional collateral for the ECB credit facility to anticipate any potential deterioration in markets
Banca Cívica integration
Solid levels of total and legal OC OC could reach 345% in case Retained Covered Bonds were amortized
Covered Bonds

20%
14%
18%
22%
16%
4% 3%2%
1% 0% 1%0%
5%
10%
15%
20%
25%
90% of the loans with LTV < 80%
30
CaixaBank Mortgage Covered Bond Programme Sept ‘13
RESIDENTIAL ASSETS
Portfolio Breakdown
Seasoning
Cover Pool Description – Main figures
90% of the pool with LTV <80%
Total Mortgage Loans (ex securitization) (€ k) 99,646,116
Number of loans 1,272,938
Average Loan balance (€) 78,280
Number of Borrowers 1,085,514
Number of properties 1,348,548
WA Seasoning in months 81.3 6.8 yrs
WA Remaining term in months 261.0 21.8 yrs
Expected WA life of the portfolio in years 12.0 yrs
WA LTV (%) 57.2%
First Rank 94%
Floating Rate loan Interest Rate type: 99.4%
WA Interest Rate (Floating Rate loans) 2.22%
WA Interest Rate (Fixed Rate loans) 5.00%
Unindexed LTV
Ranges Distributions
Total Loan Balance
(ex sec) €k%
0-≤40% 19,784,799 20%
>40%-≤50% 13,517,855 14%
>50%-≤60% 17,882,966 18%
>60%-≤70% 22,176,919 22%
>70%-≤80% 16,327,370 16%
>80%-≤85% 3,547,371 4%
>85%-≤90% 2,950,224 3%
>90%-≤95% 1,833,125 2%
>95%-≤100% 731,828 1%
>100%-≤105% 273,131 0%
>105% 620,528 1%
99,646,116
Seasoning (months) € k %
< 12 2,907,330 3%
≥12-<24 4,046,305 4%
≥24-<36 6,975,247 7%
≥36-<60 13,180,140 13%
≥60 72,537,094 73%
Total: 99,646,116 3%
4%
7%
13%
73%
< 12
≥12-<24
≥24-<36
≥36-<60
≥60
Covered Bonds
* The minor difference between cover pool size reported in previous slides (139.932 MM €) and the sum of residential and commercial portfolio showed in the cover pool description and breakdown detail (99.646 MM€ + 40.751 MM€ = 140.397 MM €), is due to the use of different criteria. Both figures will converge in coming reports.

89%
8%1% 1%
0%
10%
20%
30%
40%
50%
60%
70%
80%
90%
100%
First Home Second Home Not Owner occupied Other
31
CaixaBank Mortgage Covered Bond Programme Sept ‘13
RESIDENTIAL ASSETS
First home loans represent 89% of the residential pool
Property type € k %
First Home 89,153,176 89%
Second Home 8,235,246 8%
Not Owner occupied 1,222,357 1%
Other 1,035,337 1%
Total: 99,646,116
Loan Purpose € k %
Adquisition 63,102,584 63%
Re-mortgage 18,691,668 19%
Equity release 4,528,272 5%
Rehabilitation 6,179,178 6%
New construction 4,485,070 5%
Other 2,659,344 3%
Total: 99,646,116
63%
19%
5% 6% 5% 3%
0%
10%
20%
30%
40%
50%
60%
70%
Adquisition Re-mortgage Equity release Rehabilitation New construction
Other
Regional Distribution € k %
Catalonia 28,201,166 28%
Andalusia 17,447,791 18%
Madrid 12,866,049 13%
Valencia 7,725,958 8%
Canary Islands 6,461,078 6%
Balearic Islands 3,828,151 4%
Castile León 3,759,017 4%
Navarra 3,192,647 3%
Castile La Mancha 3,187,693 3%
Basque Country 2,694,843 3%
Murcia 2,602,180 3%
Galicia 2,060,959 2%
Aragon 1,667,514 2%
Cantabria 889,964 1%
Extremadura 859,784 1%
Others/ No info 807,935 1%
Asturias 789,226 1%
La Rioja 511,834 1%
Ceuta 74,347 0%
Melilla 17,979 0%
Total: 99,646,116
Acquisitions have led to a more diversified regional distribution of the assets
Covered Bonds

32
CaixaBank Mortgage Covered Bond Programme Sept ‘13
COMMERCIAL ASSETS
Portfolio Breakdown
Cover Pool Description – Main figures
Total Mortgage Loans (ex securitization) (€ k) 40,751,158 WA LTV (%) 57.9%
Number of loans 209,988 Floating Rate loan Interest Rate type: 96.5%
Average Loan balance (€) 194,064 WA Interest Rate (Floating Rate loans) 2.9%
Number of Borrowers 95,916 WA Interest Rate (Fixed Rate loans) 5.1%
Number of properties 259,326
WA Seasoning in months 69.2 5.8 yrs
WA Remaining term in months 166.0 13.8 yrs
Unindexed LTV
Ranges
Distributions
Total Loan
Balance
(ex sec) €k
%
0-≤40% 9,870,586 24%
>40%-≤50% 5,822,730 14%
>50%-≤60% 6,973,482 17%
>60%-≤70% 7,295,198 18%
>70%-≤80% 4,348,329 11%
>80%-≤85% 1,238,881 3%
>85%-≤90% 1,129,575 3%
>90%-≤95% 856,852 2%
>95%-≤100% 1,289,563 3%
>100%-≤105% 643,796 2%
>105% 1,282,165 3%
Total: 40,751,158
24%
14%
17% 18%
11%
3% 3% 2%3%
2%3%
0%
5%
10%
15%
20%
25%
30%
Property Type € k %
Offices 1,437,907 4%
Commercial stores 5,630,116 14%
Industrial 3,583,489 9%
Hotel 1,774,734 4%
RED: Flats & Houses 11,920,525 29%
Land 6,394,870 16%
Others 10,009,516 25%
Total: 40,751,158
4%
14%
9%
4%
29%
16%
25%
0%
5%
10%
15%
20%
25%
30%
35%
Offices Commercial stores Industrial Hotel RED: Flats & Houses Land Others
Covered Bonds

33
CaixaBank Mortgage Covered Bond Programme Sept ‘13
COMMERCIAL ASSETS
Portfolio Breakdown
Loan Maturity (yrs) € k %
≤ 5 8,052,745 20%
>5 - ≤10 8,251,565 20%
>10 - ≤15 7,742,942 19%
>15 - ≤25 8,966,965 22%
>25 - ≤50 7,736,790 19%
>50 151 0%
Total: 40,751,158
Regional Distribution € k %
Andalusia 8,295,096 20%
Catalonia 8,268,150 20%
Madrid 6,587,932 16%
Canary Islands 4,000,692 10%
Valencia 2,721,578 7%
Castile León 1,540,065 4%
Castile La Mancha 1,473,479 4%
Balearic Islands 1,369,037 3%
Basque Country 1,225,358 3%
Navarra 1,126,996 3%
Others/ No info 976,467 2%
Murcia 817,853 2%
Galicia 678,470 2%
Aragon 614,693 2%
Extremadura 334,383 1%
Cantabria 274,288 1%
La Rioja 228,925 1%
Asturias 192,738 0%
Ceuta 17,621 0%
Melilla 7,337 0%
Total: 40,751,158 100%
20%
20%
19%
22%
19%
0%
≤ 5
>5 - ≤10
>10 - ≤15
>15 - ≤25
>25 - ≤50
>50
Covered Bonds

-
-
-
-
350 -
1,500
2,700
250
250
1,450
500
-
500
1,000
1,500
2,000
2,500
3,000
20
14
20
15
20
16
20
17
20
18
20
19
Public Issues Retained Issues
Total Collateral Max. CB Issuance Outstanding CBs vs Remaining Issuing Capacity
12.0
8.4
7.0
0.0
1.4
34
CaixaBank Public Sector Covered Bond Programme Sept ‘13
Remaining Issuing Capacity
x 70%
REMAINING ISSUING CAPACITY: 1,4 Bn €
Maturity Profile
Total Covered Bonds -> 7,000 € Bn Public -> 350 € Bn Retained -> 6,650 € Bn
Issued
In Billion €
Mortgages Public Sector
Total Collateral for Covered Bonds 145,758 11,659 Elligible Portfolio 101,130 11,659
Cédulas
Hipotecarias
Cédulas
Territoriales
Used Collateral 99,199 9,571 Covered Bond Issued Amount 79,359 6,700
Over Collaterization (**) 184% 174%
Available Collateral 1,932 2,087
REMAINING ISSUING CAPACITY (*) 1,545 1,461 Mn €
(*) Issuing Capacity= 80% of Collateral Available for C. Hipotecarias and 70% for C. Territoriales
(**) Due to the early amortisation of € 3 Bn of retained cedulas on April 15th, OC ratio is currently higher
Data in Million €
3,006 Available Issuing Capacity
86,1€ bn
89,1 € bn
113 bn
157 € bn
≈ 3 € bn Remaining
Issuing Capacity
44 € bn
Outstanding CBs
Max. CB Issuance
Elegible vs non-elegible
Total Collateral (Mortgages+Public
Sector)
(**) Data in million €
Public Sector
Total Collateral for Covered Bonds 12,049 Elligible Portfolio 12,049
Cédulas
Territoriales
Used Collateral 10,000 Covered Bond Issued Amount 7,000
Over Collaterization 172%
Available Collateral 2,049
REMAINING ISSUING CAPACITY (*) 1,434
Covered Bonds

35
CaixaBank Public Sector Covered Bond Programme Sept ‘13
Portfolio Breakdown
Loan Maturity
Cover Pool Description – Main figures
Total Mortgage Loans (ex securitization) (€ k) 12,048,852 Floating Rate loan Interest Rate type: 92.1%
Number of loans 6,857 WA Interest Rate (Floating Rate loans) 3.01%
Average Loan balance (€) 1,757,161 WA Interest Rate (Fixed Rate loans) 4.44%
Number of Borrowers 1,866
Average exposure to borrowers (€ ) 6,457,048
WA Remaining term in months 116 9.7 yrs
WA Seasoning in months (1)
42 3.5 yrs
< 12 2,999,031 25%
≥12-<24 583,507 5%
≥24-<36 960,442 8%
≥36-<60 1,969,560 16%
≥60 5,536,312 46%
Total: 12,048,852
Loan Maturity € k %
<2m 0.02%
≥ 2m - <6m 0.88%
≥ 6m - <12m 0.28%
≥12m 1.02%
Loans in Arrears %
25%
5%
8%
16%
46%
< 12
≥12-<24
≥24-<36
≥36-<60
≥60
Covered Bonds

36
Listed Portfolio 30th September 2013
-
Appendices

37
Moody’s Investors Service Baa3
BBB-
BBB
P-3
A-3
F2
negative
negative
Long term
Short term
Outlook
A3
AA -
-
Credit Ratings
Mortgage Covered Bonds
Ratings
negative
(1) Negative Outlook (2) Short term with stable outlook
(1)
A (low) - R-1 (low) (2)
negative
Appendices

+34 93 411 75 03
Institutional Investors & Analysts Contact
We are at your entire disposal for any questions or suggestions you may wish to make. To contact us, please call or write to us at the following email address and telephone number:


