44
Disclaimer Cholamandalam Investment and Finance Company Limited ―Financing your Assets…since 1978― Corporate Presentation – March 2013

Disclaimer
Cholamandalam Investment and Finance Company Limited
―Financing your Assets…since 1978―
Corporate Presentation – March 2013

Table of Contents
Corporate Overview
Business Overview
Financial Performance
Subsidiaries – Wealth Management
Funding Profile
Business Enablers
1

Disclaimer
2
Certain statements included in this presentation may be forward looking statements made based on management’s
current expectations and beliefs concerning future developments and their potential effects upon Cholamandalam
Investment and Finance Company Ltd and its subsidiaries. There can be no assurance that future developments
affecting Cholamandalam Investment and Finance Company Ltd and its subsidiaries will be those anticipated by
management. These forward-looking statements are not a guarantee of future performance and involve risks and
uncertainties, and there are important factors that could cause actual results to differ, possibly materially, from
expectations reflected in such forward-looking statements. Cholamandalam Investment and Finance Company Ltd
does not intend and is under no obligation, to update any particular forward-looking statement included in this
presentation.
The facts and figures mentioned in this presentation is for informational purposes only and does not constitute or
form part of, and should not be construed as, an offer or invitation to sell securities of the Company, or the
solicitation of any bid from you or any investor or an offer to subscribe for or purchase securities of the Company,
and nothing contained herein shall form the basis of or be relied on in connection with any contract or commitment
whatsoever. Nothing in the foregoing shall constitute and/or deem to constitute an offer or an invitation to an offer,
to be made to the Indian public or any section thereof or any other jurisdiction through this presentation, and this
presentation and its contents should not be construed to be a prospectus in India or elsewhere. This document has
not been and will not be reviewed or approved by any statutory or regulatory authority in India or any other
jurisdiction or by any stock exchanges in India or elsewhere. This document and the contents hereof are restricted
for only the intended recipient(s). This document and the contents hereof should not be (i) forwarded or delivered or
transmitted in any manner whatsoever, to any other person other than the intended recipient(s); or (ii) reproduced in
any manner whatsoever. Any forwarding, distribution or reproduction of this document in whole or in part is
unauthorized.
The information in this document is being provided by the Company and is subject to change without notice. The
information in this presentation has not been independently verified. No representation or warranty, express or
implied, is made to the accuracy, completeness or fairness of the presentation and the information contained herein
and no reliance should be placed on such information. The Company or any other parties whose names appear
herein shall not be liable for any statements made herein or any event or circumstance arising therefrom.

Disclaimer
3
Corporate Overview

Company’s Highlights
4
Theme 5
21
3
45
6
Positioning
Established in 1978, one of India’s
leading NBFC’s, focused in the rural
and semi-urban sector with a market
capitalisation of INR 39 bn1
Exceptional Lineage
A part of the US$4.4 bn Murugappa
Group – founded in 1900, one of
India's leading business
conglomerates with 28 businesses
including 9 listed companies and
workforce of 32000 employees
Robust Sector Growth
Presence across vehicle finance,
business finance, home equity
loans, stock broking and distribution
of financial products
Diversified Footprint
Operates from 518 branches across
22 states and 90% presence across
Tier II and III cities
One of the leading NBFCs in rural /
semi urban areas
Robust Operating Profile
AUM of INR 181 bn as of March
2013 with Net NPA of 0.2% and a
healthy RoA of 2.0%
Operating income CAGR of 40%
over FY10-13
Management
Highly experienced management
team with unrivaled industry
expertise
Significant synergies with the
Murugappa group, deriving
operational and financial benefits
1.Market data as on March 31, 2013. Source: BSE Sensex and Conversion Rate of 1USD = Rs.54.39 as on March 31, 2013 Source; RBI
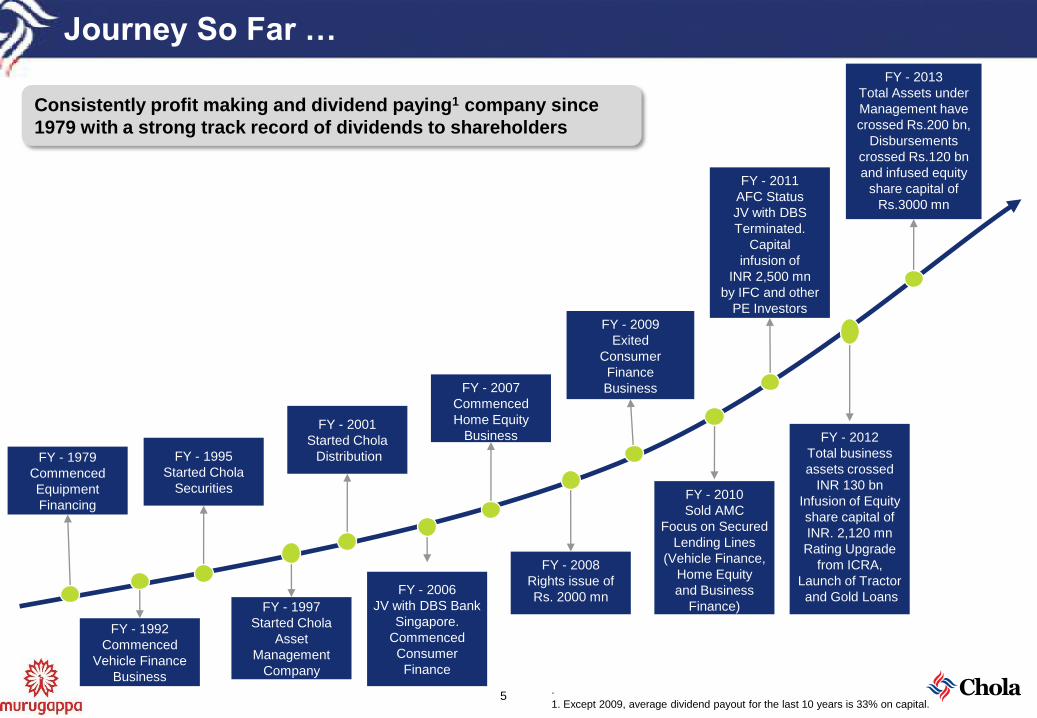
Journey So Far …
5.
1. Except 2009, average dividend payout for the last 10 years is 33% on capital.
FY - 1979
Commenced
Equipment
Financing
FY - 1992
Commenced
Vehicle Finance
Business
FY - 1995
Started Chola
Securities
FY - 2001
Started Chola
Distribution
FY - 2006
JV with DBS Bank
Singapore.
Commenced
Consumer
Finance
FY - 1997
Started Chola
Asset
Management
Company
FY - 2007
Commenced
Home Equity
Business
FY - 2008
Rights issue of
Rs. 2000 mn
FY - 2009
Exited
Consumer
Finance
Business
FY - 2010
Sold AMC
Focus on Secured
Lending Lines
(Vehicle Finance,
Home Equity
and Business
Finance)
FY - 2012
Total business
assets crossed
INR 130 bn
Infusion of Equity
share capital of
INR. 2,120 mn
Rating Upgrade
from ICRA,
Launch of Tractor
and Gold Loans
Consistently profit making and dividend paying1 company since
1979 with a strong track record of dividends to shareholders
FY - 2011
AFC Status
JV with DBS
Terminated.
Capital
infusion of
INR 2,500 mn
by IFC and other
PE Investors
FY - 2013
Total Assets under
Management have
crossed Rs.200 bn,
Disbursements
crossed Rs.120 bn
and infused equity
share capital of
Rs.3000 mn

6
Major Companies – Murugappa Group
Company Name Market Capitalization Description
INR 52,366 mn
(US$963 mn) Coromandel International Limited is the leading phosphatic fertilizer company
in India, with a production capacity 2.9 mn tonnes of phosphatic fertilizers
INR 38,832 mn
(US$714 mn)
Cholamandalam Investment and Finance Company Limited is a Non Banking
Finance Company and one of the leading financial provider for vehicle finance,
business finance, home equity loans, stock broking & distribution of financial
products
INR 30,606mn
(US$563 mn)
Tube Investments of India Limited offers wide range of engineering products
such as, Steel tubes, chains, car door frames, etc. apart from e-scooters,
fitness equipment and cycles
INR 26,189 mn
(US$482 mn)
EID Parry (India) Limited offers wide range of agro products such as sugar,
microalgal health supplements and bio products, with a capacity to crush 32,500
tones of cane per day (TCD)
INR 22,271mn
(US$409 mn)
Carborundum Universal Limited is a pioneer in coated and bonded abrasives,
super refractories, electro minerals and industrial ceramics. The Company
currently has presence in Australia, South Africa, Russia, Canada and Middle
East.
Unlisted Cholamandalam MS General Insurance Company Limited is a JV of
Murugappa Group with Mitsui Sumitomo Insurance Group of Japan, (5th
largest
insurer across the globe)
Note: Market data as on March 31, 2013. Source: BSE Sensex and Conversion Rate of 1USD = Rs.54.39 as on March 31, 2013 Source; RBI

7
Strong Corporate Governance
“The fundamental principle of economic activity is that no man you transact with will lose, then you shall not."

Management – Board Level
8
Mr. MBN Rao – Chairman
Over 39 years of varied experience in the entire gamut of banking and finance, economics, foreign exchange, money and capital
markets, and administration
Former Chairman and Managing Director of Canara Bank and Indian Bank
He was also the Chairman Indian Banks’ Association, Indo Hong Kong Finance Limited, Vice-Chairman of Commercial Bank of
India, Russia and is a director on the boards of various reputed companies
He also served as a member of various committees constituted by the RBI, Ministry of Finance - Government of India, SEBI and
National Institute of Bank Management
Mr. N Srinivasan, Vice Chairman and Mentor Director
He has over 27 years of experience in the areas of corporate finance, legal, projects and general management
He is a director on the boards of Tube Investments of India Ltd., Cholamandalam MS General Insurance Company Ltd. and
certain other Murugappa Group companies
He is a member of the Institute of Chartered Accountants of India and the Institute of Company Secretaries of India
Mr. Vellayan Subbiah, Managing Director
He was the Managing Director of Laserwords, a leading provider of pre-press services to global publishers since 2005
His professional experience includes 6 years at McKinsey and Company, Chicago and associations with 24/7 Customer Inc.
Las Gatos and The Carlyle Group, San Francisco
He holds a degree of Bachelor of Technology in Civil Engineering from the IIT Madras. He also holds a Masters in Business
Administration from the University of Michigan, Ann Arbor

Management – Board Level (Non – Executive Director)
9
Mr. Indresh Narain – Non – Executive Director
He is a banker with wide experience at regional and head office level in personal and corporate banking, wealth management, currency
markets, asset recovery, corporate finance and human resources.
He retired as Head of Compliance & Legal, HSBC India
He was a member of the Assets & Liabilities Committee (ALCO), the Apex Management Committee, Corporate Governance and Audit
committee of HSBC, India and a Trustee of the Sasakawa India Leprosy Foundation.
Mr. R. V. Kanoria - Non – Executive Director
He is a MBA (HONS) from IMD, Switzerland.
He is the Chairman and Managing Director of Kanoria Chemicals & Industries Ltd. and is on the Board of several other companies.
He is the President of Federation of Indian Chamber of Commerce (FICCI) and has headed several joint-business councils and he also the
Chair of the Commission on International Trade and Investment Policy of the ICC, Paris. He is a Managing Committee member of PHD
Chamber of Commerce & Industry.
Mr. V. Srinivasa Rangan - Non – Executive Director
He is a graduate in Commerce, Grad. Cost and Works Accountants of India and an Associate member of the Institute of Chartered
Accountants of India
He is an Executive Director at HDFC Ltd and has been associated with the company since 1986. He is Director on the Boards of Hindustan Oil
Exploration Company Ltd and several other companies in HDFC Group.
He was conferred the ―Best CFO in the Financial Sector for 2010‖ by ―The Institute of Chartered Accountants of India‖ (ICAI).
Mr. L. Ram Kumar - Non – Executive Director
He is a Cost Accountant and a MBA from IIM, Ahmedabad.
He is the Managing Director of Tube Investments of India Ltd.
He has varied experience in developing ling term strategies, restructuring, setting up green field projects and building a customer oriented
organization.

Management – Operating Team
10
Mr. Kaushik Banerjee – President Asset Finance
Kaushik heads the Asset Finance divisions of Vehicle Finance and Corporate & Mortgage Finance, and has been in Asset Finance business
for close to 23 years. He began his career in financial services with ITC Classic Finance Ltd (a subsidiary of ITC Limited)
He headed the West & East operations of Esanda Finanz Ltd (a subsidiary of ANZ Grindlays Bank) with whom he spent 7 years
He joined CIFCL in 2001 and took over as Senior Vice President of the Vehicle Finance vertical in 2006
The division enjoys a strong reputation as one of the largest financiers of commercial vehicles in the country with a robust portfolio quality
Mr. Rohit Phadke, Sr. Vice President & Business Head-Home Equity and Home Loan
Rohit has 21 years of rich experience in Asset Financing. His last assignment was with Apple Finance Ltd as Regional Manager
Rohit has been with the company for over eight years and had led the West Zone of the Vehicle Finance Business with distinction
Rohit established the Home Equity business in 2006, and has successfully built up a significant franchisee in the mortgage space recording
both profits and growth from commencement of business
Mr. Pravin Salian, Vice President & Business Head – Gold Loans
Pravin has 16 years of diverse experience in all levels of management
He started his career with DSA Citibank and has worked in various capacities in companies including Karvy Investor Services and Birla Sun life
Insurance
His last assignment was with Muthoot Fincorp Ltd as Business Head & Executive Vice President
Pravin joined CIFCL in April 2011 & has successfully established the Gold Loan business inaugurating 45 branches in South India in a very
short span
Mr. Arul Selvan, Sr. Vice President & Chief Financial Officer
Chartered Accountant from the Institute of Chartered Accountants of India & MBA from Open University (UK)
With over 20 years of experience in Finance and Accounts, Arul heads the Finance function of CIFCL as the CFO
Arul has spent 19 years with the Murugappa Group, with stints in Tube Investments of India, Corporate Strategic Planning Division of
Murugappa Group, Cholamandalam Mitsui Sumitomo General Insurance , and Group Corporate Finance of Murugappa Group

1. Assets are net of provisions.
2. Managed assets refers to Own assets + off balance sheet items which have been securitized/sold on a bilateral assignment basis.
Corporate Overview
Asset Class DescriptionAssets1
as at March 31st, 2013
Managed2 Own
Vehicle Finance
(Financing since 1990)
Vehicle financing for
NEW and USED HCVs,
LCVs, SCVs, MLCVs,
MUVs, Tractors and Cars
(INR in mn)
143,685
(75.6%)
119,907
(72.8%)
Home Equity
(Financing since 2005)
Loans against residential
property to self employed
individuals
43,369
(22.8%)
41,861
(25.4%)
Others Business Finance
Funding, Gold Loans
and Home Loans
2,927
(1.6%)
2,927
(1.8%)
Total 189,981 164,695
Business Segments Overview Shareholding Pattern
Promoters share holding of 57.7% includes Tube
Investments – 50.1%, Ambadi Enterprises – 5.0%
and Others -2.6%
(as of March 2013)
11
Promoters57.7%
FII31.2%
Public5.4%
Institutions5.7%

AUM refers to Own assets + off balance sheet items which have been securitized/sold on a bilateral assignment basis less provisions.
In FY-10 the company had Rs.3000 million of convertible preference share capital forming part of share capital which was converted into equity in the FY11, further the company had infused
Rs.2500 million in FY – 11 and Rs. 2120 million in FY-12. Market price and Market Capitalisation based on share price as on 31st March 2013
Corporate Overview
Summary Financials
12
FY10 FY11 FY12 FY13 YoY
Disbursements (INR mm) Growth
Vehicle Finance 28,613 44,961 73,064 98,820 35%
House Equity 10,044 12,346 15,281 21,612 41%
Gold – – 541 591 9%
MSME – – – 132
Home Loans – – – 28
Total 38,657 57,307 88,886 121,183 36%
AUM (INR mm)
On Book 51,597 83,612 122,492 164,695 34%
Assigned 16,908 7,630 12,208 25,287 107%
Total 68,505 91,242 134,700 189,981 41%
Networth (INR mm)
Reserves and Surplus 4,185 9,526 12,847 18,216 42%
Share Capital 3,665 1,194 1,326 1,432 8%
Total 7,850 10,720 14,173 19,648 39%
Net Income (INR mm)
PAT 154 622 1,725 3,065 78%
Net Income Margin 7.0% 8.8% 7.4% 7.6%
Ratios
Expense Ratio 4.4% 4.6% 4.1% 3.8%
Losses and Provisions 2.1% 2.8% 0.4% 0.8%
ROTA (PBT) 0.5% 1.4% 2.7% 3.0%
Investor Ratios
Earnings Per share (Rs) 1.8 5.7 14.4 22.9 59%
Book value per share (Rs) 73.0 89.9 106.9 137.3 28%
Market price per share (Rs) 93.8 172.6 185.1 271.4 47%
Market capitalisation (In Mn) 6,226 20,588 24,529 38,832 58%

171
236
375
518
2009–2010 2010–2011 2011–2012 2012-2013
13
Bihar (12)
Chattisgarh (24)
Jharkand (15)
Orissa (16)
West Bengal
(17)
Delhi (8)
Punjab
(25)
Rajasthan (45) UP (26)
Uttaranchal (6)
Karnataka (40)
Kerala (24)Tamil
Nadu (56)
Maharashtra (45)
Pondicherry (1)
Gujarat
(37)
Goa (1)
Madhya Pradesh (39)
Andhra Pradesh (61)
Assam (4)
Haryana
(12)
Note: Figures in brackets represents no. of branches as on March 31, 2013.
Strong Geographical Presence
518 branches across 22 states/Union territories
~90% locations are in Tier-II and Tier-III cities
Strong in South, North and West regions and growing presence in East
Rapid Growth in Branch Network
Himachal
Pradesh (4)
All Home Equity branches are co-located with Vehicle Finance branches
68% 71% 71% 71%
10%19% 19% 19%
22%10% 10% 10%
2009–2010 2010–2011 2011–2012 2012–2013
Rural Semi-Urban Urban
36% 36% 40% 35%
23% 22%23%
24%
27% 26% 21% 24%
13% 16% 15% 17%
2009–2010 2010–2011 2011–2012 2012–2013
South North West East

Q4 & FY 13 - Update
59%
Performance Highlights of Q – 4 FY – 12 Vs Q - 4 FY - 13
Rs.539 Mn.
Profit After Tax
Rs.858 Mn.
1.8%
ROTA*
Rs.106.9
Book Value
17.2%
ROE*
2.0% Rs.138.4 18.8%
*ROTA and ROE calculated in Profit after Tax ^ EPS is annualized
14
16% 30% 9%
Rs.17.8
EPS ^
Rs.25.1
41%33%
Rs.28716 Mn.
Disbursements
Rs.38078 Mn.
78%
Performance Highlights of FY – 12 Vs FY - 13
Rs.1725 Mn.
Profit After Tax
Rs.3065 Mn.
1.6%
ROTA*
Rs.106.9
Book Value
14.8%
ROE*
2.0% Rs.138.4 19.2%
27% 30% 29%
Rs.14.4
EPS
Rs.22.9
59%36%
Rs.88886 Mn.
Disbursements
Rs.121183 Mn.

15
Portfolio Performance
Company applies provisioning rates which are higher than RBI stipulated rates. As on 31st March 2013 .if RBI rates are applied the provision % would reduce from 0.8% to 0.5%
5.5%
2.6%
0.9% 1.0%
3.8%
2.3%
0.6%0.8%
1.7%
0.3% 0.3% 0.2%
2009–2010 2010–2011 2011–2012 2012–2013
GNPA PROV NNPA

16
Update: FY 2013
AFC Status Asset Finance Company status retained
Rating ICRA, CRISIL, India Ratings and CARE has retained their existing ratings
PAT PAT has increased by 78% compared to FY-2012
Size Total assets under management has crossed INR 200 bn
Disbursements Disbursements for the year crossed Rs.120 bn – Growth of 35% for VF and 41% for HE
Branch Expansion Expanded the presence to 518 branches from 375 in Mar 12
RoE Return on equity increased from 14.8% (in FY12) to 19.2% (in FY’13)

Disclaimer
17
Business Overview
Vehicle Finance
18

212,943
271,937
361,147
437,873
Mar-10 Mar-11 Mar-12 Mar-13
287,777
353,620
460,283
524,887
Mar-10 Mar-11 Mar-12 Mar-13
244,944
322,788
349,216
268,263
Mar-10 Mar-11 Mar-12 Mar-13
19
Vehicle Finance | Industry
SCV’s + 3W Pick ups Continue to Drive Growth Trend in
Domestic M&HCV Sales
Trend in Domestic M & HCV Sales
Trend in Domestic LCV Sales Share of SCV’s (<3.5t) Vehicles has
been Steadily Expanding
23%
21%
14%
Chola’s target segment being LCV and SCV – where growth rates are higher
Strong growth in vehicle sales expected with improvement in the economic environment and reducing interest rates.
19Source : SIAM
(in Units)(in Units)
(in Units)(in Units)
33% 34% 30%22%
39% 37%39%
43%
29% 29% 31% 36%
Mar-10 Mar-11 Mar-12 Mar-13
HCV SCV/3W Pick ups LCV

Principal Operator > 50 Vehicles
Large Operators 26- 50 vehicles
Medium Operators 10 -25 – HCV & LCV vehicles
SRTOs – HCV & LCV
First Time Users & Small Ticket Operators, older vehicles
HighHigh
LowLow
RATES
HCV, LCV, MUV, Cars & SCV
HCV RISK
Losses 0.75 %
Rates New – 11 % to 12.5 %Used – 14.50% - 16 %
Rates – 20 - 26 %Losses 2.5 % HCV : Heavy commercial vehicle, LCV : Light commercial vehicle, SCV : Small commercial vehicle , MUV : Multi utility vehicle , SRTO : Small Road Transport Operators
Chola positioning-•Middle of the pyramid
through New CVs, Used CVs & MUVs
•Top of the Bottom of thepyramid through SCV & older CVs Shubh”
~65% of disbursements are to micro & small enterprises and agri
based customer segment
CV Industry
Chola Position
Vehicle Finance – Business Model & Positioning
20
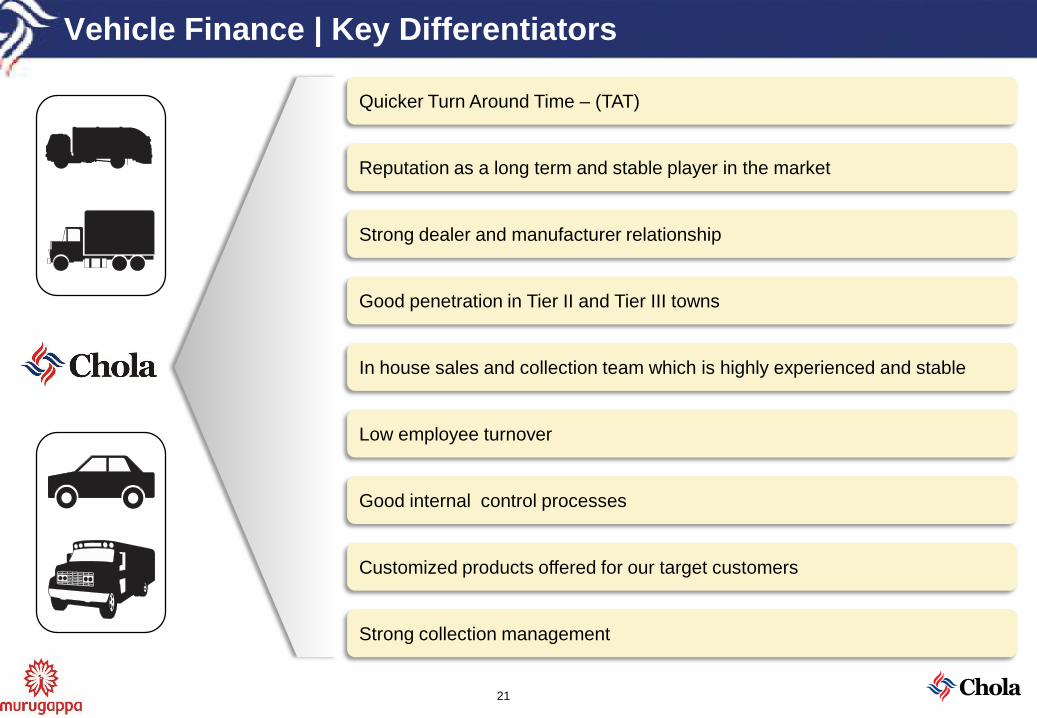
Vehicle Finance | Key Differentiators
21
Quicker Turn Around Time – (TAT)
Reputation as a long term and stable player in the market
Strong dealer and manufacturer relationship
Good penetration in Tier II and Tier III towns
In house sales and collection team which is highly experienced and stable
Low employee turnover
Good internal control processes
Customized products offered for our target customers
Strong collection management

Vehicle Finance | Disbursement / Portfolio Mix – FY 2013
Disbursements - Statewise Portfolio – Statewise
Well diversified across geography & product segments
During FY 2013, ~29% of Disbursements were from South India and balance were from other zones
Portfolio – Product wiseDisbursements - Productwise
22
HCV11%
LCV31%
MUV6%Car & 3
Wheelers3%
Used CV's19%
Shubh13%
Mini LCV10%
Tractor7%
Tamil Nadu12%
Andhra Pradesh8%
Maharasthra11%
Chattisgarh8%
Rajasthan10%
Gujarat7%
Punjab5%
Kerala5%
Madhya Pradesh6%
West Bengal
4%
Delhi4%
Uttar Pradesh5% Orissa
3%
Karnataka4%
Haryana2%
Other States
5%
Tamil Nadu12%
Andhra Pradesh8%
Maharasthra12%
Chattisgarh7%
Rajasthan9%
Gujarat7%
Punjab6%
Kerala6%
Madhya Pradesh6%
West Bengal
5%
Delhi4%
Uttar Pradesh
4%
Orissa3%
Karnataka4%
Haryana2%
Other States
5%
HCV14%
LCV34%
MUV6%
Car & 3 Wheelers
2%
Used CV's16%
Mini LCV11%
Shubh11%
Tractor6%

23
Vehicle Finance | Financial Summary
Disbursements Assets Under Management1
Income Profit Before Tax
1. AUM is Net of provisions.
(in INR mn)(in INR mn)
(in INR mn)(in INR mn)
Significant presence in vehicle finance segment and witnessing a strong growth in recent years.
28,610
44,961
73,064
98,820
FY10 FY11 FY12 FY13
35%
31,377
57,432
88,621
119,907
7,753
2,683
9,854
23,778
39,130
60,115
98,475
143,685
FY10 FY11 FY12 FY13
On Book Assigned
46%
5,800
8,815
13,340
20,186
FY10 FY11 FY12 FY13
51%
740
1,873
2,390
3,507
FY10 FY11 FY12 FY13
47%

24
Vehicle Finance | Financial Summary (Cont’d)
Net Income Margin (A) Expense Ratio (B)
Losses and Provisions (C) ROTA (PBT) (D) = (A-B-C)
Ratios are calculated as a % of Average Assets
(Operating Income – Finance charges)4.4%
4.3%
4.1%
3.8%
FY10 FY11 FY12 FY13
1.3%
0.8%
0.5% 0.5%
FY10 FY11 FY12 FY13
2.2%
3.9%
3.1%3.0%
FY10 FY11 FY12 FY13
7.9%
8.9%
7.7%
7.3%
FY10 FY11 FY12 FY13

Home Equity
25

Home Equity | Overview
26
Asset Class
Self Occupied Residential Property
Long tenor loans serviced across 58 locations PAN India
Major Players
ICICI Bank
HDFC Bank
Bajaj Finance
PSU Banks
Customer Segment
Clear focus on the middle socio economic class of B & C
Self Employed individual constitutes the customer base
Focus further refined to Self Employed non professional in such
segments

Home Equity | Key Differentiators
27
Process Differentiator
Turn around time one of the best in the industry
Provide personalized service to customers through direct interaction
with each customer
Pricing
Pricing to maintain net interest margin
Recover business origination and credit cost from upfront Fee Income
Generate surplus fee income
Effective cost management
Underwriting Strategy
Personal visit by credit manager on every case
Assess both collateral and repayment capacity to ensure credit quality
Structure
Separate verticals for sales, credit & collections
Convergence of verticals at very senior levels
Each vertical has independent targets vis-à-vis their functions

28
Home Equity | Financial Summary
Disbursements AUM1
Income Profit Before Tax
1. AUM is Net of provisions.
(in INR mn)(in INR mn)
(in INR mn)(in INR mn)
10,040
12,346
15,281
21,612
FY10 FY11 FY12 FY13
41%
12,54117,897
28,479
41,861
2,019
3,842
2,353
1,508
14,560
21,739
30,832
43,369
FY10 FY11 FY12 FY13
On Book Assigned
41%
1,690
2,587
3,778
5,509
FY10 FY11 FY12 FY13
46%
350
524
808
1,210
FY10 FY11 FY12 FY13
50%

29
Home Equity | Financial Summary (Cont’d)
Net Income Margin (A) Expense Ratio (B)
Losses and Provisions (C) ROTA (PBT) (D) = (A-B-C)
Ratios are calculated as a % of Average Assets
(Operating Income – Finance charges)
6.6%
5.8%
5.4%5.6%
FY10 FY11 FY12 FY13
2.9%
2.4%
2.0% 2.0%
FY10 FY11 FY12 FY13
3.3%
2.9%3.1%
3.3%
FY10 FY11 FY12 FY13
0.4%
0.5%
0.3% 0.3%
FY10 FY11 FY12 FY13

Funding Profile
30

31
CAR, Credit Rating and ALM Statement
Credit Ratings
– The Company carries a credit rating of [ICRA ] A1 + and CRISIL A1 + for Short Term Instruments
– For long term instruments – (NCD’s) rated with [ICRA] AA / Stable and CARE AA
– For Subordinated debt, the Company is rated with [ICRA] AA / Stable and India Ratings AA – (ind)/ Stable
– For Perpetual Debt, the Company is rated with [ICRA] AA - / Stable and CARE A+
Capital Adequacy Ratio
Credit Ratings
ALM Statement as of March 2013
INR in Mn.
Cumulative deficit is significantly lower than the RBI stipulated levels of 15% and positive in all buckets up to 1 year
Time Buckets Outflows Inflows Surplus / (Deficit)Cum. Surplus / (Cum
Deficit)1–14 Days 4,787 5,267 480 480 15–30/31 Days 4,307 4,361 54 534 Over 1–2 Months 7,440 7,672 232 766
Over 2–3 Months 7,182 7,461 279 1,045
Over 3–6 Months 20,281 20,426 145 1,190
Over 6 Months to 1 Year 32,681 31,778 (903) 287
Over 1–3 Years 64,658 58,416 (6,242) (5,955)
Over 3–5 Years 3,750 13,475 9,725 3,770 Over 5 Years 35,900 32,130 (3,770) -Total 180,987 180,987 - -
Minimum CAR Stipulated by RBI is 15%
9.54 10.78 11.00 11.07
5.26
5.887.08 7.97
14.8016.67
18.08 19.04
2009–2010 2010–2011 2011–2012 2012–2013Tier I Tier II

32
Diversified Borrowings ProfileINR in mn.
Particulars Mar-10 Mar-11 Mar-12 Mar-13
Bank Term Loans 63% 69% 63% 60%
Commercial papers 18% 7% 2% 6%
Debentures 9% 13% 22% 21%
Tier II Capital 10% 11% 13% 13%
Consistent investment grade rating of debt instruments since inception
Long term relationships with banks ensured continued lending
A consortium of 20 banks with approved limits of ~ INR 24,800 mn
5,415 8,53014,357 19,8374,800
10,000
25,429
32,276
9,9005,800
2,350
8,705
34,034
55,159
72,305
92,073
54,149
79,489
114,441
152,890
Mar-10 Mar-11 Mar-12 Mar-13
Tier II Capital Debentures Commercial Papers Bank Term loans

Business Enablers
33

Human Resources
34
Access to 10572 + trained manpower directly and indirectly
Employee Strength of Chola as on 31st March 2013 - (10572) *
On roll employees includes 170 professionals (CA,CS, ICWA, Lawyers and engineers) and 415 MBAs
19.3%
80.7%
On Roll
Off Roll

Technology
35
Overview:
The company deploys a hybrid resource
model that optimizes use of vendor
platforms and resources and at the same
time allows us to retain control over
technology function
Robust disaster recovery setup
implemented for all our business critical
applications.
Applications (Cont’d)
Solution for cross sell business/lead management initiatives
through TeleSmart
Technology Optimization Initiatives
Implementation of mobile application
based solutions for improving
productivity of sales and collections team
Solution for gold loans implemented through Myfin
CRM solution towards better customer
service and lead management capability
Applications:
Enterprise-wide business applications used
across the company (Finnone, NLADS, My
Fin, Oracle Financials – Central GL system
interfaced to all the subsystems). Business
applications are supported by Ideal
Finance and other sub-systems

Risk Management
36
Risk Management Committee (RMC):
The Company has set up a Risk management Committee
comprising Chairman, Vice-Chairman, an Independent Director
and the Managing Director besides the senior management as
members.
Internal Control Systems
DOAs and SOPs for all business and functions are in place
Internal Control Systems (Cont’d)
RMC meets at least 4 times in a year and
oversees the overall risk management frame
work, the annual charter and implementation
of various risk management initiatives. It also
reviews the top risks of the organization and
the changes in risk perceptions periodically.
RMC (Cont’d):
RMC minutes and risk management
processes are shared with the Board on
periodic basis
ALCO meets every month to discuss
treasury operations related risk exposures
within the financial risk management
framework of the Company
In-house and independent internal audit
teams carry out comprehensive audits with
a preapproved plan and audit schedule of
the head office and branches
An independent fraud control unit ensures
robust mechanism of fraud control and
detection supported by a disciplinary
committee reporting to Audit Committee and
Board
Key operational processes (finance & operations) are
centralized at HO for better control
Strong IT security system and audit to ensure information
security.
Comprehensive risk registers have been prepared for
businesses / functions identifying the risks with
mitigants, controls and KRI triggers

Financial Performance
37
38
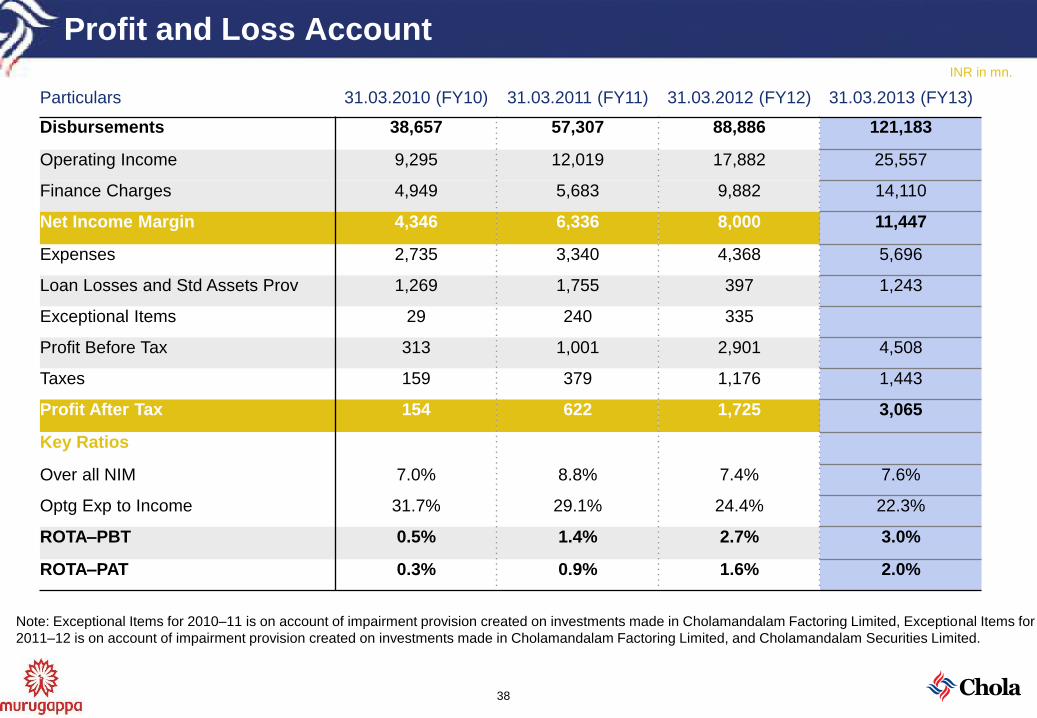
Profit and Loss AccountINR in mn.
Note: Exceptional Items for 2010–11 is on account of impairment provision created on investments made in Cholamandalam Factoring Limited, Exceptional Items for
2011–12 is on account of impairment provision created on investments made in Cholamandalam Factoring Limited, and Cholamandalam Securities Limited.
Particulars 31.03.2010 (FY10) 31.03.2011 (FY11) 31.03.2012 (FY12) 31.03.2013 (FY13)
Disbursements 38,657 57,307 88,886 121,183
Operating Income 9,295 12,019 17,882 25,557
Finance Charges 4,949 5,683 9,882 14,110
Net Income Margin 4,346 6,336 8,000 11,447
Expenses 2,735 3,340 4,368 5,696
Loan Losses and Std Assets Prov 1,269 1,755 397 1,243
Exceptional Items 29 240 335
Profit Before Tax 313 1,001 2,901 4,508
Taxes 159 379 1,176 1,443
Profit After Tax 154 622 1,725 3,065
Key Ratios
Over all NIM 7.0% 8.8% 7.4% 7.6%
Optg Exp to Income 31.7% 29.1% 24.4% 22.3%
ROTA–PBT 0.5% 1.4% 2.7% 3.0%
ROTA–PAT 0.3% 0.9% 1.6% 2.0%

39
Balance SheetINR in mn.
Particulars Mar-10 Mar-11 Mar-12 Mar-13
Equity and Liabilities
Shareholders’ Funds 7,850 10,720 14,173 19,648
Non-current Liabilities 25,242 56,953 72,269 84,354
Current Liabilities 36,247 29,110 47,861 77,847
Total 69,339 96,783 134,303 181,848
Assets
Non-current Assets
Fixed Assets 138 332 532 707
Non-current Investments 693 683 577 828
Deferred Tax Asset (Net) 1,549 1,306 511 689
Receivable under Financing Activity 34,410 54,193 83,429 114,736
Other Non-current Assets & Loans and Advances 707 4,405 4,096 5,116
37,496 60,918 89,145 122,075
Current Assets
Current Investments 1,500 - 40 1,417
Cash and Bank Balances 7,451 1,688 2,584 3,890
Receivable under Financing Activity 20,200 31,810 39,870 51,523
Other Current Assets & Loans and Advances 2,691 2,367 2,664 2,943
31,842 35,865 45,158 59,773
Total 69,339 96,783 134,303 181,848
De-recognised Assets 16,908 9,020 12,208 25,287
Total Assets Under Management 86,247 105,802 146,510 207,135
Wealth Management
40

41
Wealth Management
Cholamandalam Distribution Services
Cholamandalam Securities
Income and PAT—INR in mn.
Income and PAT—INR in mn.
Wealth management services for mass affluent
and affluent customer segments.
Retail Distribution of a wide range of products –
Investments, Life Insurance, General Insurance ,
Home loan & mortgage products.
Has national presence, with 9 offices across the
country
Broking services to HNIs and Institutional
Investors
Presence across 11 metro’s and mini metro’s
113 115 118 116
69 69
(4)
20
FY10 FY11 FY12 FY13
Income PAT
132
101
6372
23
3
(54)
(10)
FY10 FY11 FY12 FY13
Income PAT
42
Our Registered Office:
Cholamandalam Investment & Finance Company Limited (CIFCL),
Dare House Ist Floor, 2, NSC Bose Road,
Chennai 600001.
Toll free number : 1800-200-4565 (9 AM to 7 PM)
Land Line: 044 – 3000 7072
http://www.cholamandalam.com
Email-Id :
Sujatha P- Vice President & Company Secretary-Chola – [email protected]
Arulselvan D- Sr. Vice President & CFO-Chola – [email protected]
Contact Us

43
Thank You


![A Study on Job Satisfaction of Employees in Ms Cholamandalam General Insurance Ltd.[1]](https://static.documents.pub/doc/80x56/546ce992b4af9f453b8b4b57/a-study-on-job-satisfaction-of-employees-in-ms-cholamandalam-general-insurance-ltd1.jpg)


