135
CORPORATE PROFILE
Orient Overseas (International) Limited (“OOIL”), a company with total revenues
in excess of US$3.2 bi l l ion, has three principal business activit ies: container
t ransporta t ion and log i s t i c s se rv i ces , por t s and te rmina l s and proper ty
development and investment. Listed on The Stock Exchange of Hong Kong,
the OOIL Group has more than 160 offices in 50 countries.
Orient Overseas Container Line Limited, operating under the trade name OOCL,
its wholly owned subsidiary, is one of the world’s largest integrated international
transportation, logist ics and terminal companies, and is one of Hong Kong’s
most recognised global brands. OOCL is one of the leading international carriers
serving China, providing the full range of logistics and transportation services
throughout the country. It is also an industry leader in the use of information
technology and e-commerce to manage the entire cargo process.
OOIL Group’s property development and investment division focuses on sizable
and qual ity investments, primari ly in China, with the potential for sol id and
consistent returns. It has an eight percent interest in Bei j ing Oriental Plaza,
one of Beijing’s most prestigious commercial and office developments and owns
Wall Street Plaza in New York City. Its key focus is on residential property
development in c it ies in China that have a higher per capita GDP, superior
urban infrastructure and high overseas Chinese investment. It has a number of
residential developments in Shanghai.

Contents
Corporate Profile
Contents
Financial Highlights
Significant Events
Chairman’s Letter
Operations Review
Financial Review
Board of Directors
Shareholder Section
Financial Calendar
Shareholder Information
Corporate Governance
Notice of Annual General Meeting
Report of the Directors
Report of the Auditors
Financial Statements
Consolidated Profit and Loss Account
Consolidated Balance Sheet
Balance Sheet
Consolidated Cash Flow Statement
Consolidated Statement of Changes in Equity
Notes to the Accounts
Segment Information
Principal Subsidiaries and Jointly Controlled Entities
Major Customers and Suppliers
10 Years Financial Summary
Other Information
Fleet and Container Information
Terminal Information
Property Information
Corporate Information
1
2
3
6
12
22
40
46
47
49
50
57
64
65
66
67
68
69
70
110
114
124
125
•
127
128
131
132
1
OO
IL A
NN
UA
L R
EPO
R T 2
003
2
OO
IL A
NN
UA
L R
EPO
RT 2
003
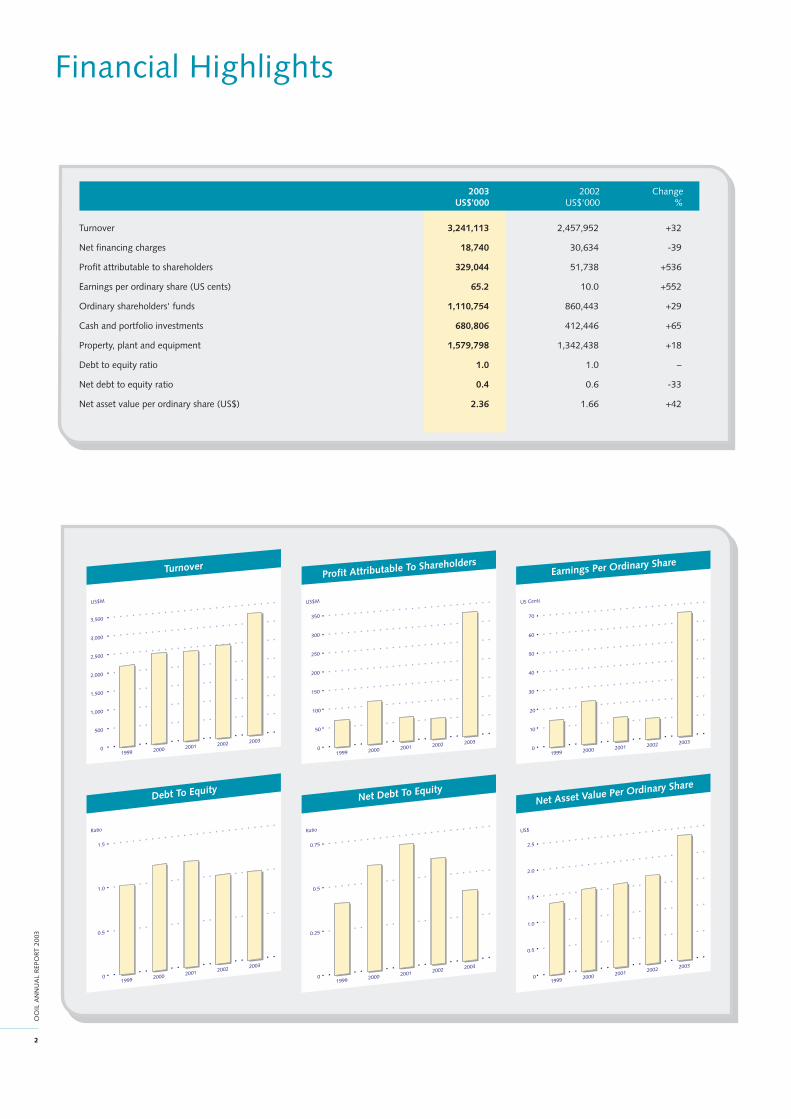
Financial Highlights
. . . . . . . . . . . . . . . . . . . . . . . . . . .
. . . . . . . . . . . . . . . . . . . . . . . . . . .
. . . . . . . . . . . . . . . . . . . . . . . . . . .
. . . . . . . . . . . . . . . . . . . . . . . . . . .
. . . . . . . . . . . . . . . . . . . . . . . . . . .
3,500
3,000
2,500
2,000
1,500
1,000
500
0
. . . . . . . . . . . . . . . . . . . . . . . . . . .
. . . . . . . . . . . . . . . . . . . . . . . . . . .
1999 2000 2001 2002 2003. . . . . . . . . . . . . . . . . . . . . . . . . . .
. . . . . . . . . . . . . . . . . . . . . . . . . . .
. . . . . . . . . . . . . . . . . . . . . . . . . . .
. . . . . . . . . . . . . . . . . . . . . . . . . . .
. . . . . . . . . . . . . . . . . . . . . . . . . . .
350
250
200
150
100
50
0
. . . . . . . . . . . . . . . . . . . . . . . . . . .
. . . . . . . . . . . . . . . . . . . . . . . . . . .
1999 2000 2001 2002 2003. . . . . . . . . . . . . . . . . . . . . . . . . . .
. . . . . . . . . . . . . . . . . . . . . . . . . . .300
. . . . . . . . . . . . . . . . . . . . . . . . . . .
. . . . . . . . . . . . . . . . . . . . . . . . . . .
. . . . . . . . . . . . . . . . . . . . . . . . . . .
. . . . . . . . . . . . . . . . . . . . . . . . . . .
70
50
40
30
20
10
0
. . . . . . . . . . . . . . . . . . . . . . . . . . .
. . . . . . . . . . . . . . . . . . . . . . . . . . .
1999 2000 2001 2002 2003. . . . . . . . . . . . . . . . . . . . . . . . . . .
. . . . . . . . . . . . . . . . . . . . . . . . . . .60
2.5
1.5
1.0
0
. . . . . . . . . . . . . . . . . . . . . . . . . . .
. . . . . . . . . . . . . . . . . . . . . . . . . . .
1999 2000 2001 2002 2003
. . . . . . . . . . . . . . . . . . . . . . . . . . .
. . . . . . . . . . . . . . . . . . . . . . . . . . .
1.5
1.0
0.5
0
. . . . . . . . . . . . . . . . . . . . . . . . . . .
. . . . . . . . . . . . . . . . . . . . . . . . . . .
1999 2000 2001 2002 2003
. . . . . . . . . . . . . . . . . . . . . . . . . . .
. . . . . . . . . . . . . . . . . . . . . . . . . . .. . . . . . . . . . . . . . . . . . . . . . . . . .
. . . . . . . . . . . . . . . . . . . . . . . . . .
.
.
0.5
2.0
0.75
0
. . . . . . . . . . . . . . . . . . . . . . . . . . .
. . . . . . . . . . . . . . . . . . . . . . . . . . .
1999 2000 2001 2002 2003
. . . . . . . . . . . . . . . . . . . . . . . . . . .
. . . . . . . . . . . . . . . . . . . . . . . . . ..
0.25
0.5
TurnoverProfit Attributable To Shareholders
Earnings Per Ordinary Share
Net Asset Value Per Ordinary ShareDebt To Equity
Net Debt To Equity
US$M US$M US Cents
US$Ratio Ratio
3
OO
IL A
NN
UA
L R
EPO
R T 2
003
Significant Events
February
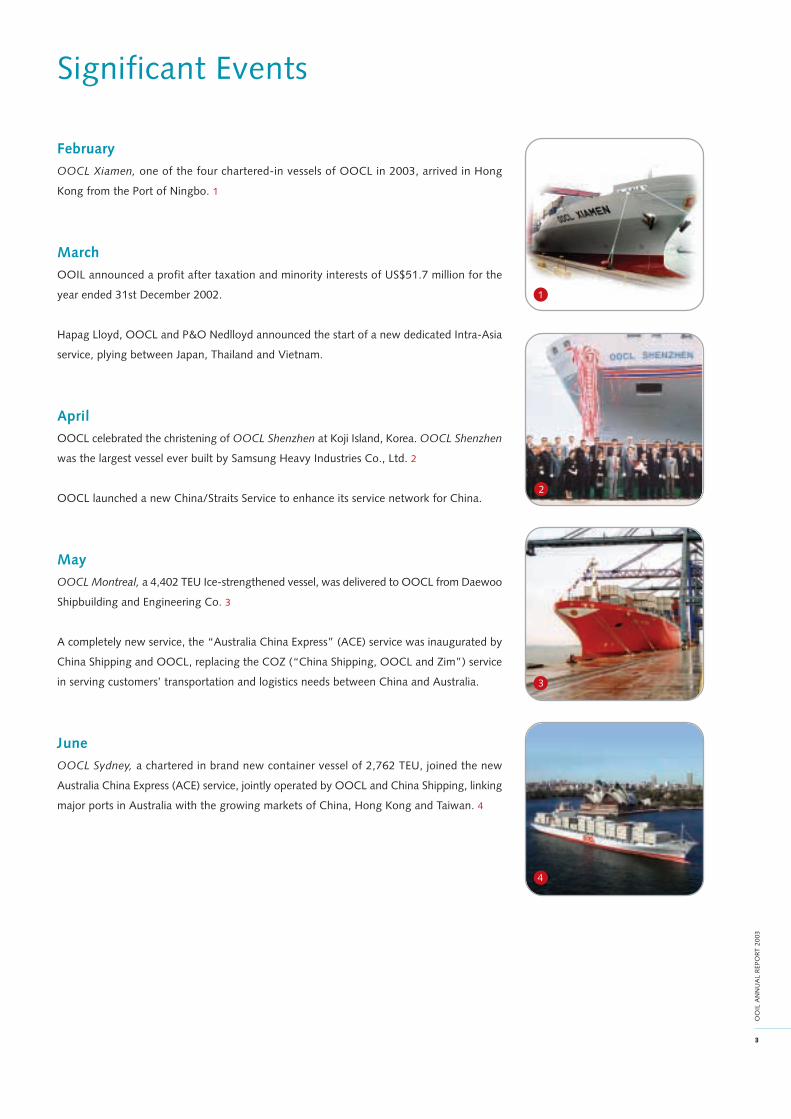
OOCL Xiamen, one of the four chartered-in vessels of OOCL in 2003, arrived in Hong
Kong from the Port of Ningbo. 1
March
OOIL announced a profit after taxation and minority interests of US$51.7 million for the
year ended 31st December 2002.
Hapag Lloyd, OOCL and P&O Nedlloyd announced the start of a new dedicated Intra-Asia
service, plying between Japan, Thailand and Vietnam.
April
OOCL celebrated the christening of OOCL Shenzhen at Koji Island, Korea. OOCL Shenzhen
was the largest vessel ever built by Samsung Heavy Industries Co., Ltd. 2
OOCL launched a new China/Straits Service to enhance its service network for China.
May
OOCL Montreal, a 4,402 TEU Ice-strengthened vessel, was delivered to OOCL from Daewoo
Shipbuilding and Engineering Co. 3
A completely new service, the “Australia China Express” (ACE) service was inaugurated by
China Shipping and OOCL, replacing the COZ (“China Shipping, OOCL and Zim”) service
in serving customers’ transportation and logistics needs between China and Australia.
June
OOCL Sydney, a chartered in brand new container vessel of 2,762 TEU, joined the new
Australia China Express (ACE) service, jointly operated by OOCL and China Shipping, linking
major ports in Australia with the growing markets of China, Hong Kong and Taiwan. 4
3
1
2
4
4
OO
IL A
NN
UA
L R
EPO
RT 2
003
Significant Events
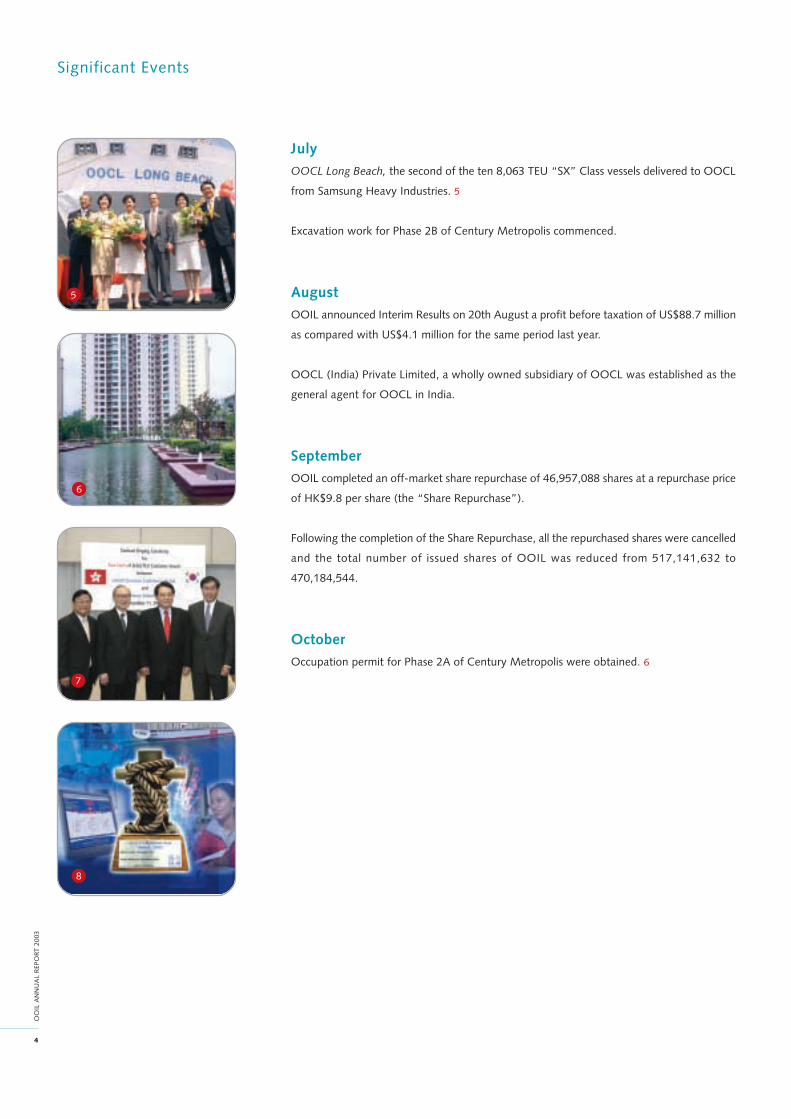
July
OOCL Long Beach, the second of the ten 8,063 TEU “SX” Class vessels delivered to OOCL
from Samsung Heavy Industries. 5
Excavation work for Phase 2B of Century Metropolis commenced.
August
OOIL announced Interim Results on 20th August a profit before taxation of US$88.7 million
as compared with US$4.1 million for the same period last year.
OOCL (India) Private Limited, a wholly owned subsidiary of OOCL was established as the
general agent for OOCL in India.
September
OOIL completed an off-market share repurchase of 46,957,088 shares at a repurchase price
of HK$9.8 per share (the “Share Repurchase”).
Following the completion of the Share Repurchase, all the repurchased shares were cancelled
and the total number of issued shares of OOIL was reduced from 517,141,632 to
470,184,544.
October
Occupation permit for Phase 2A of Century Metropolis were obtained. 6
6
7
8
5

5
OO
IL A
NN
UA
L R
EPO
R T 2
003
9
December
OOCL signed an agreement with Samsung Heavy Industries for the construction of two
8,063 TEU (twenty-foot equivalent unit) “SX” Class post-Panamax container vessels for
delivery in 2007. 7
OOCL won Best Main Line Operator at the fifth Lloyd’s List Maritime Asia Awards ceremony,
held in Shanghai on 4th December. 8
OOIL announced the following appointments with effect from 1st December 2003: 9
1. Professor Richard Yue Chim Wong was appointed an Independent Non-executive
Director of the Company;
2. Mr Philip Yiu Wah Chow was appointed a Director of the Company; and
3. Mr Tsann Rong Chang, a Director of the Company, was appointed Vice Chairman.
6
OO
IL A
NN
UA
L R
EPO
RT 2
003
Chairman’s Letter
6
OO
IL A
NN
UA
L R
EPO
RT 2
003
Chairman’s Letter
RESULTS FOR 2003
2003 has turned out to have been one of if
not the best year to date for the container
liner industry. To the surprise of most, and
from very uncertain beginnings, the market
gathered strength at an unprecedented pace
during the course of the year. At the interim
stage of 2003, I voiced concerns that the
nascent recovery of the world’s major
economies remained frail and that the
significant increases in both container liftings
and average freight revenues during the first
half of 2003 were greatly assisted by the
weakness of the comparable period of 2002
and might not be sustained into the second
half of the year. These concerns turned out
to have been unfounded with the growth
in volumes and the increase in rates having,
in the event, accelerated during the second
half of 2003. Equally, the perennial fears that
the growth in the volume of containers
moved would be insufficient to absorb the
effects of the introduction of a significant
level of newbuilding tonnage were also
groundless. It should be noted, however,
that the capacity increases were sufficient
to alleviate the upward pressure on freight
rates to the extent that in the case of the
Trans-Pacific for example, they remain
below the levels achieved in 1999 and 2000.
Against this background of beneficial market
conditions, and aided by both a continued
focus on cost control and the benefits
deriving from the economies of scale which
accrue from our fleet expansion, I am
pleased to be able to report a record level
of performance by Orient Overseas
(International) Limited and its subsidiaries
(the “Group”) for the year of 2003 as a
whole. The Group recorded a profit before
tax and minorities of US$353.3 million for
the financial year 2003. A profit attributable
to shareholders of US$329.0 million was

7
OO
IL A
NN
UA
L R
EPO
R T 2
003
recorded which represents an increase of
536% over the attributable profit of
US$51.7 million which we recorded in 2002.
This is a remarkable achievement but must
be viewed in the light of the prevailing
economic and market conditions which have
produced a set of circumstances almost
unprecedented in the history of the industry.
The Board of Directors recommends the
payment of a final dividend of US12.8 cents
(HK$1) per share to ordinary shareholders.
Together with the interim dividend, this
represents a 566% over the total dividend
paid for the financial year ended December
2002.
The Directors are also recommending a
bonus issue of shares on the basis of one
bonus share of for every 10 existing issued
ordinary shares and have resolved to change
the board lot size for trading in OOIL shares
from 2,000 to 1,000.
The result for the year as a whole is much
superior to that predicted in the middle of
2003 and the forecasts for the trading
environment during 2004 remain optimistic.
As hitherto, the Group’s operations remain
organised into two distinct operating entities
to allow each the required independence
and ability to concentrate upon their
respective businesses.
Our International Transportation, Logistics
and Termina ls d iv i s ion en joyed an
unprecedented trading environment during
2003 as we experienced a much better
supply and demand balance despite the
substantial growth in capacity. During the
second half of 2002 business confidence
generally had started to recover from the
depths of earlier in the year and container
volumes had begun to show much higher
growth rates. This continued through into
2003 and, if anything, accelerated as the
year progressed. Coupled with a lower rate
of tonnage increase than had been forecast,
the supply and demand balance changed its
bias to the extent that space became more
scarce and freight rates consequently firmer.
I am pleased also to report that our container
terminal businesses in North America were
all profitable for 2003. For various reasons
this represents the first time that they have
all been profitable in the same year. Overall,
the four terminals, two in the Port of New
York and New Jersey and two in the Port of
Vancouver, achieved an increase of just over
7% in throughput, in terms of actual lifts,
and an 11% rise in revenues per container
handled. This translates into a 133%
increase in net recurrent pre-tax income
although this figure is distorted by the swing
from loss to profit at Global Terminal in New
York. However, we expect these levels of
profitability to be maintained or bettered
during 2004.
As hitherto we continue to make those
investments in these terminal facilities
necessary to upgrade the equipment and to
maintain and improve the services we
provide to our customers. In addition we
remain alert to the opportunities which,
although infrequent, do arise from time to
time to invest in other terminal projects in
which we see good prospects in terms of
the location and hinterland necessary to
produce the profitability levels required.
During 2003 we have continued the
development and scope of our automated
IT platforms. Major enhancements have
been made to IRIS-2, our enterprise system,
to include interface capabilities with
CargoSmart, e-Payment and Scheduling
Smart, and to cater for Bills of Lading and
Manifests issued by N.V.O.C.C.s. It’s market
leading functionality has once again been
demonstrated by the fact that a second
licensing agreement has been signed to
allow use of the system by another major
container line. Both the first and this second
licensee conducted extensive exercises to
identify suitable and available proprietary
systems. That both concluded that IRIS-2
was their better and preferred solution
demonstrates that no other system
compares favourably.
In 2003, CargoSmart, a provider of one of
the most advanced portals for the ocean
container transportation industry, continued
to strengthen its product range by adding
and enhancing features that complete the
basic shipment cycle from booking through
to invoicing, thereby extending its service
to help a broader segment of customers and
their associates manage their shipments
across multiple carriers. The new products
and enhancements continue to assist
customers to plan, process, monitor, and
share their shipment information more
efficiently.
OOCL Logistics is the Group’s logistics
management division. Founded as a global
freight services provider, OOCL Logistics
today is a major global 3PL (Third Party
Logistics Provider) as well as an LLP (Lead
Logistics Provider). By combining leading-
edge IT solutions, with a full menu of
logistics services, it provides customers with
integrated logistics solutions and manages
multiple carriers, service providers and
transportation modes with visibility and

8
OO
IL A
NN
UA
L R
EPO
RT 2
003
Chairman’s Letter
event management capabilities. It offers a
wide range of value added services through
its worldwide network. While bearing the
well-recognised OOCL brand name, OOCL
Logistics is a neutral 3PL/LLP with the goal
to maximise value for its customers. It has a
customer focussed service philosophy,
technology driven operations and process
oriented business practices.
In line with the Group’s overall goal of
significantly expanding its logistics services
capabilities, OOCL Logistics is focused on
end-to-end logistics solutions that maintain
a high level of customer satisfaction through
consistent service quality. Information
technology is at the core of modern logistics.
OOCL Logist ics pr ides i tse l f on i ts
sophisticated, customer driven technology
solutions. It continues to deliver advanced,
integrated web solutions that support a full
range of transportation, warehousing,
information integration and management
reporting requirements. To extend its IT
leadership, OOCL Logistics embarked on a
new IT initiative in 2003, building on the
technology successes of the Group, which
aims to provide the engine to manage the
ent i re log i s t i c s supp ly cha in f rom
manufacturer to retailer. At the same time,
OOCL Logistics is continuing to build upon
its long-standing presence and expertise in
China, a market we regard as having the
greatest potential and enormous demand for
logistics services. We intend to maintain our
leadership position in China’s logistics
market in the years to come.
Our Property Development and Investment
division returned a solid year in 2003.
Despite the numerous issues arising due to
SARS, the results of our development
portfolio in Shanghai remained satisfactory.
This can be attributed to both the experience
of the local development team and the
continued brand name premium we have
established in Shanghai. In addition, we
began during the year to expand our
horizons a little to areas immediately outside
the Shanghai City limits, efforts which we
believe will make a valuable contribution to
the Group going forwards.
For our property investment business, we
continue to believe that both China’s entry
to the WTO and the gradual build up to the
2008 Olympic Games will slowly but surely
benefit all sectors of the Beijing property
market. Beijing Oriental Plaza, in which the
Group continues to hold an 8% interest, has
yielded a modest but positive result at the
project level for the financial year ended
December 2003 and we look forward to a
growing contribution at the Group level in
the future. Until such time, we continue to
view the project as a long term investment.
During 2003, the Group increased its
percentage freehold ownership of the land
underlying Wall Street Plaza from 66% to
95% at a cost of US$10 million. As at 31st
December 2003, the building was valued on
an open-market basis at US$100 million,
which allowing for the capitalisation of the
amount spent to acquire the increased
freehold interest, represents no change from
the prior year. The gradual recovery in the
New York property market has benefited
Wall Street Plaza, and we look forward to
its continued and positive contribution to
Group performance.
The outlook for our core international
transportation and logistics businesses
remains positive. During the course of 2003
the supply and demand balance moved
firmly in our favour and at the present time
it is hard to find any data to suggest that
this favourable situation will alter in the near
term. Indeed, at the time of writing the
prospects for the longer term appear
brighter than they have for some time. In
the past, our concerns have traditionally
been over the supply side of the equation
with new tonnage generally available
between 18 months and two years of having
placed an order. The present situation,
unique it seems, is that with all sectors of
the shipping industry having of late been
enjoying exceptional levels of performance,
the shipyard order books are virtually full
for probably the next 3.5 years. As such,
the supply side increases are fixed for a
period much longer than is usually the case.
With greater confidence therefore on the
supply side, concern has now switched more
to the demand side and the sustainability
of the recent levels of container volume
growth. It should be remembered that this
is very much an international business and
indeed, OOCL depends upon its base in
Hong Kong for not more than 10% of its
revenues. China’s accession to the WTO, the
continuing process of containerisation and
the return to higher levels of global
economic growth all tend to suggest that
the presently better supply and demand
balance is set to remain with us for 2004
and perhaps beyond. More profound in its
effect at present perhaps is the process of
globalisation. It would seem that the poorer
macroeconomic conditions of the past few
years in the world’s major consuming
economies have placed increased pressure
on businesses, largely unable to influence
their revenues, to concentrate efforts upon
their cost bases and to seek lower
manufacturing and or assembly costs. This
has resulted in a shift of these processes to
lower labour cost areas, namely the Far East
and specifically China. The impact of these
changes in trade patterns is a compound one
since it not only generates increased
9
OO
IL A
NN
UA
L R
EPO
R T 2
003
container movements to return the finished
product back to its consumer market but also
creates other movements, most notably in
the Asian regional trades, in the transport
of raw materials and components. This goes
a long way potentially to explaining the very
steep rise during 2003 in Intra-Asian
container volumes.
General freight levels at the time of writing
remain firm on all our trade routes. Whilst
for the Trans-Pacific, the all important
negotiations of the annual service contracts
remain in progress, we do not expect the
outcome to demonstrate any softening in
rates of which, during 2004, we shall enjoy
the benefit for a full 12 months. Similarly
we do not foresee any softening in our other
trades and for our Intra-Asia services we may
experience some unexpected strength in
rates as it now appears that there is little if
any extra tonnage available, in addition to
the increase in trunk route vessels carrying
regional cargo, to absorb the continuing
volume increases.
2003 has been an exceptional year for the
Group and I must pay tribute to the staff
who have made this possible. OOIL has a
full-time staff on land and at sea of over
5,000 people. It as a committed and stable
workforce and the Group includes “People”
as one of i ts Core Values. “People
Development”, throughout the whole
organisation, remains a cornerstone of
corporate policy. Quality in service and
products has always been the emphasis and
now with our positioning as a knowledge
based organisation as we continue our IT
investment programmes, we place an even
greater emphasis on the development of our
people. We aim to provide an environment
in which they may extend their personal
horizons and realise their full potential in
partnership with the Company as a whole.
The Group and its employees also take
seriously and take pride in responsible
corporate citizenship. Recognising that the
communities in which we live and work
contribute to our success, we focus our
community efforts on the provision of youth
education, charity relief and cultural
promotion. Every week, throughout the
world, OOCL employees give to the
community by participating in charity
events, fundraising or by dedicating their
time to ongoing acts of help or assistance.
A major initiative is the Group’s involvement
in Project HOPE (Health Opportunities for
People Everywhere) by assisting with the
transportation of the latest diagnostic
medical equipment and supplies to the
Shanghai Children’s Hospital, China, to allow
those less fortunate children to receive the
best medical care and attention possible.
Other beneficiaries include cancer, diabetes
and leukaemia funds in Hong Kong,
Australia, Europe and the USA; children’s
homes in Hong Kong and France; food
banks in the US and many others.
In line with OOIL’s long tradition of giving
back to the communities in which we live
and work, the Tung OOCL Scholarship
supports the education of youth. OOIL and
The Tung Foundation together spend over
US$1 million per year on educational
scholarships for students in China and Hong
Kong and for the children of employees
globally.
C C Tung
Chairman and Chief Executive Officer
Hong Kong, 19th March 2004


12
OO
IL A
NN
UA
L R
EPO
RT 2
003
Operations Review
12
OO
IL A
NN
UA
L R
EPO
RT
20
03
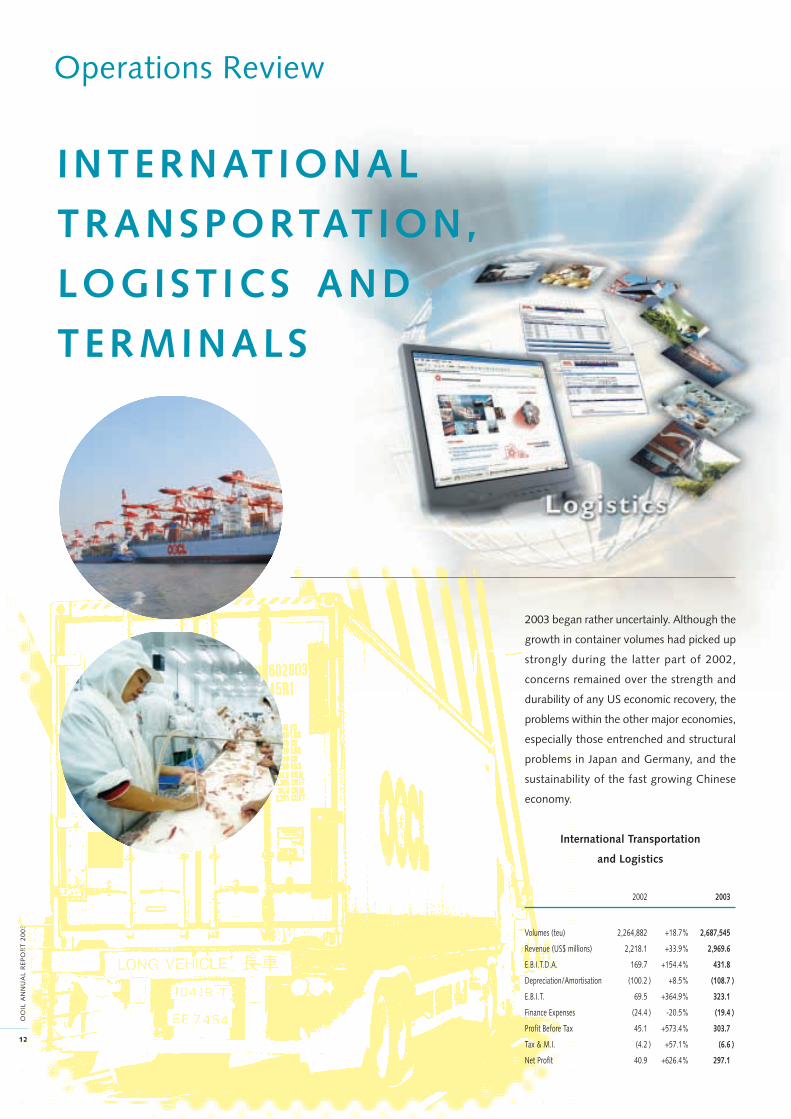
INTERNATIONAL
TRANSPORTATION,
LOGIST ICS AND
TERMINALS
2003 began rather uncertainly. Although the
growth in container volumes had picked up
strongly during the latter part of 2002,
concerns remained over the strength and
durability of any US economic recovery, the
problems within the other major economies,
especially those entrenched and structural
problems in Japan and Germany, and the
sustainability of the fast growing Chinese
economy.
International Transportation
and Logistics
2002 2003
Volumes (teu) 2,264,882 +18.7% 2,687,545
Revenue (US$ millions) 2,218.1 +33.9% 2,969.6
E.B.I.T.D.A. 169.7 +154.4% 431.8
Depreciation/Amortisation (100.2 ) +8.5% (108.7 )
E.B.I.T. 69.5 +364.9% 323.1
Finance Expenses (24.4 ) -20.5% (19.4 )
Profit Before Tax 45.1 +573.4% 303.7
Tax & M.I. (4.2 ) +57.1% (6.6 )
Net Profit 40.9 +626.4% 297.1
13
OO
IL A
NN
UA
L R
EPO
R T 2
003
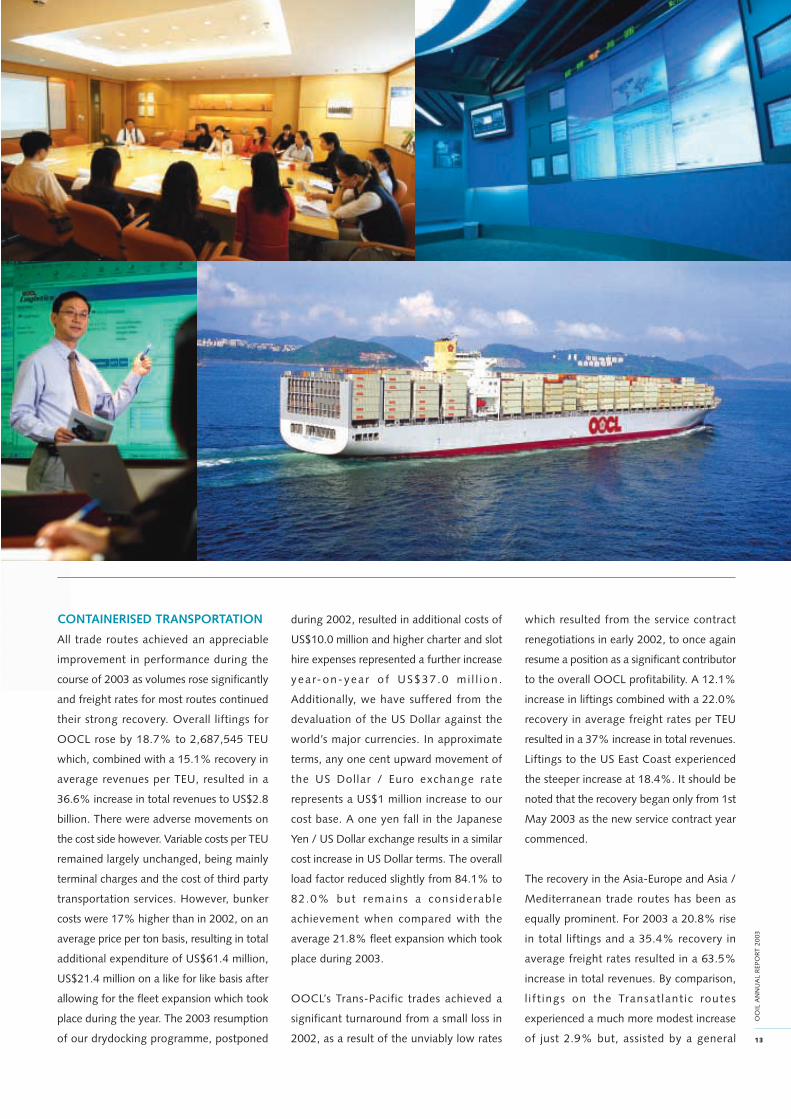
CONTAINERISED TRANSPORTATION
All trade routes achieved an appreciable
improvement in performance during the
course of 2003 as volumes rose significantly
and freight rates for most routes continued
their strong recovery. Overall liftings for
OOCL rose by 18.7% to 2,687,545 TEU
which, combined with a 15.1% recovery in
average revenues per TEU, resulted in a
36.6% increase in total revenues to US$2.8
billion. There were adverse movements on
the cost side however. Variable costs per TEU
remained largely unchanged, being mainly
terminal charges and the cost of third party
transportation services. However, bunker
costs were 17% higher than in 2002, on an
average price per ton basis, resulting in total
additional expenditure of US$61.4 million,
US$21.4 million on a like for like basis after
allowing for the fleet expansion which took
place during the year. The 2003 resumption
of our drydocking programme, postponed
during 2002, resulted in additional costs of
US$10.0 million and higher charter and slot
hire expenses represented a further increase
yea r-on-yea r o f US$37 .0 m i l l i on .
Additionally, we have suffered from the
devaluation of the US Dollar against the
world’s major currencies. In approximate
terms, any one cent upward movement of
the US Dollar / Euro exchange rate
represents a US$1 million increase to our
cost base. A one yen fall in the Japanese
Yen / US Dollar exchange results in a similar
cost increase in US Dollar terms. The overall
load factor reduced slightly from 84.1% to
82.0% but remains a cons iderable
achievement when compared with the
average 21.8% fleet expansion which took
place during 2003.
OOCL’s Trans-Pacific trades achieved a
significant turnaround from a small loss in
2002, as a result of the unviably low rates
which resulted from the service contract
renegotiations in early 2002, to once again
resume a position as a significant contributor
to the overall OOCL profitability. A 12.1%
increase in liftings combined with a 22.0%
recovery in average freight rates per TEU
resulted in a 37% increase in total revenues.
Liftings to the US East Coast experienced
the steeper increase at 18.4%. It should be
noted that the recovery began only from 1st
May 2003 as the new service contract year
commenced.
The recovery in the Asia-Europe and Asia /
Mediterranean trade routes has been as
equally prominent. For 2003 a 20.8% rise
in total liftings and a 35.4% recovery in
average freight rates resulted in a 63.5%
increase in total revenues. By comparison,
l i f t ings on the Transat lant ic routes
experienced a much more modest increase
of just 2.9% but, assisted by a general

14
OO
IL A
NN
UA
L R
EPO
RT 2
003
Operations Review
redeployment of some tonnage onto the
other two stronger main east-west trades,
average revenues per TEU rose by 13.5%
resulting in a 16.8% rise in total revenues.
OOCL’s Int ra-As ia and Aust ra las ia
businesses experienced by far the greatest
volume increase at 31.1% and, assisted by
a marginal 2.2% rise in average revenue per
TEU, total revenues rose by 33.9%. This only
modest rise in freight rates would suggest
that during 2003, there was sufficient
tonnage available on the charter market
combined with additional trunk line vessel
capacity, to match the volume increases.
However the very steep rise during the latter
part of the year in charterhire rates for the
medium to smaller size ships deployed
within these trades, would suggest that this
supply is now, at best, limited with the
potential consequence for 2004 that any
continued strong rise in volumes will have a
positive impact upon freight rates. Our Asia
to Australasia routes also experience strong
growth especially on the southbound trades.
Overall, 23.5% and 14.6% rises in liftings
and average revenue per TEU respectively,
resulted in a 41.6% increase in total
revenues.
Orient Overseas Container Line
TOTAL LIFTINGS TOTAL REVENUES
(TEU’S) (US$OOO’S)
2002 2003 2002 2003
Trans-Pacific 771,428 +12.1% 865,098 936,154 +36.9% 1,281,239
Asia-Europe/
Intra-Europe 355,067 +14.5% 406,648 335,656 +56.6% 525,786
Transatlantic 270,404 +2.9% 278,200 294,125 +16.8% 343,518
Intra-Asia/
Australasia 867,983 +31.1% 1,137,599 451,440 +33.9% 604,657
All Services 2,264,882 +18.7% 2,687,545 2,017,375 +36.6% 2,755,200
Between January and June 2003, OOCL
took delivery of the “OOCL Xiamen”,
“OOCL Osaka”, “OOCL Sydney” and
“OOCL Melbourne”. All are 2,762 TEU
vessels built by Imabari in Japan and are
under long-term charterparty arrangements.
They were deployed within our Intra-Asian
and Australasian services. In May 2003,
OOCL took del ivery of the “OOCL
Montreal”, a 4,402 TEU ice-strengthened
vessel for deployment in our North Atlantic
services between Europe and Canada.
Simultaneously, the “OOCL Canada”, our
former 2,330 TEU ice-strengthened vessel,
was delivered to her new owners under a
pre-existing contract of sale.
In April and June 2003, OOCL took delivery
from Samsung in Korea of the “OOCL
Shenzhen” and “OOCL Long Beach”. Both
were deployed in our Grand Alliance Asia-
Europe services and were the first to be
delivered of what is now our programme of
twelve 8,063 TEU “SX” Class vessels
ordered from Samsung. In January and
February 2004, OOCL took delivery of the
“ O O C L R o t t e r d a m” a n d “ O O C L
15
OO
IL A
NN
UA
L R
EPO
R T 2
003
Hamburg”, numbers 3 and 4 in the series.
Numbers 5 and 6, the “OOCL Qingdao”
and “OOCL Ningbo” will be delivered in
April and May 2004 respectively. These
vessels remain the largest containerships by
declared capacity yet delivered. Of the
remaining six vessels in the series, two will
be delivered during each of the first halves
of 2005, 2006 and 2007.
During 2003, OOCL also committed to
long-term charterparty arrangements under
which a series of eight 5,888 TEU vessels,
to be built by Imabari in Japan, will be
delivered, one in late 2005, three in early
2006, one in late 2006 and the remaining
three during the first half of 2007. These
various newbuilding programmes are in line
with our long term business plans. OOCL’s
internal organic growth plans, to be
supported by sustained profitability, remain
in place and the further long-term
charterparty arrangements, together with
the existing fleet of eight 5,560 TEU vessels
under medium-term charterparties which
begin to reach their first renewal dates from
the middle of 2005 onwards, provide us with
the flexibility we require to convert vessels
earmarked for f leet expansion into
replacement tonnage should market
conditions so dictate.
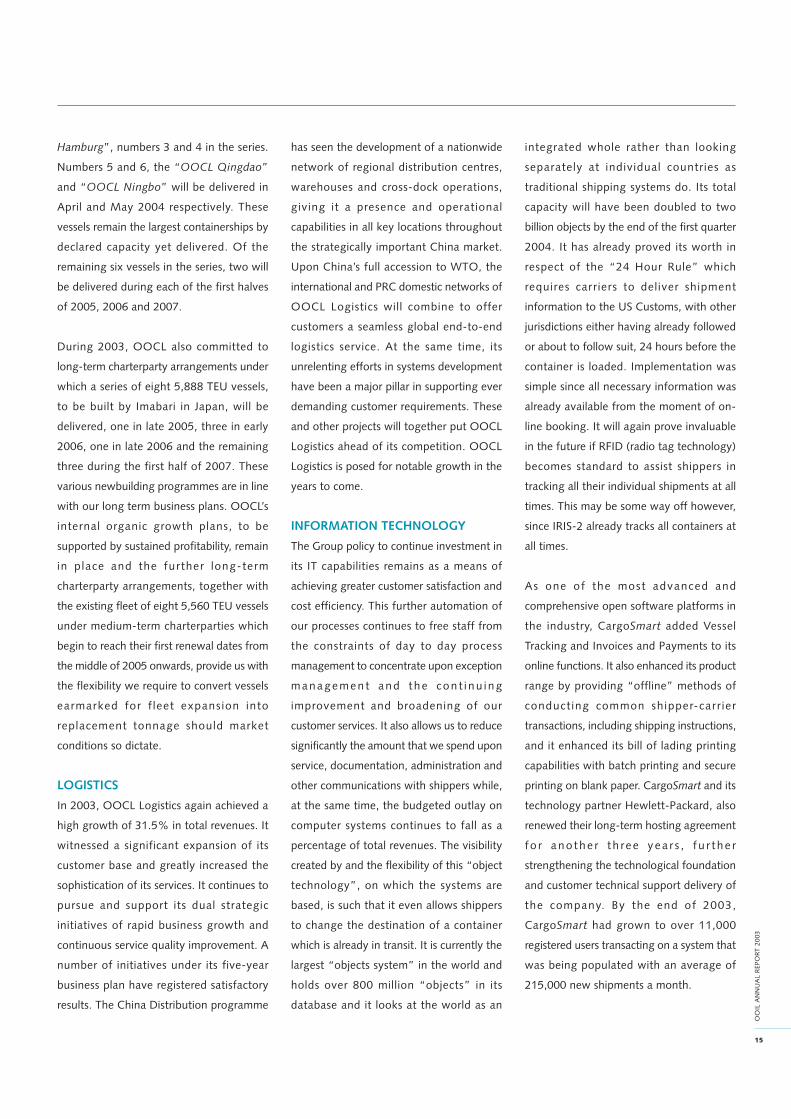
LOGISTICS
In 2003, OOCL Logistics again achieved a
high growth of 31.5% in total revenues. It
witnessed a significant expansion of its
customer base and greatly increased the
sophistication of its services. It continues to
pursue and support its dual strategic
initiatives of rapid business growth and
continuous service quality improvement. A
number of initiatives under its five-year
business plan have registered satisfactory
results. The China Distribution programme
has seen the development of a nationwide
network of regional distribution centres,
warehouses and cross-dock operations,
giving it a presence and operational
capabilities in all key locations throughout
the strategically important China market.
Upon China’s full accession to WTO, the
international and PRC domestic networks of
OOCL Logistics will combine to offer
customers a seamless global end-to-end
logistics service. At the same time, its
unrelenting efforts in systems development
have been a major pillar in supporting ever
demanding customer requirements. These
and other projects will together put OOCL
Logistics ahead of its competition. OOCL
Logistics is posed for notable growth in the
years to come.
INFORMATION TECHNOLOGY
The Group policy to continue investment in
its IT capabilities remains as a means of
achieving greater customer satisfaction and
cost efficiency. This further automation of
our processes continues to free staff from
the constraints of day to day process
management to concentrate upon exception
m a n a g e m e n t a n d t h e c o n t i n u i n g
improvement and broadening of our
customer services. It also allows us to reduce
significantly the amount that we spend upon
service, documentation, administration and
other communications with shippers while,
at the same time, the budgeted outlay on
computer systems continues to fall as a
percentage of total revenues. The visibility
created by and the flexibility of this “object
technology”, on which the systems are
based, is such that it even allows shippers
to change the destination of a container
which is already in transit. It is currently the
largest “objects system” in the world and
holds over 800 million “objects” in its
database and it looks at the world as an
integrated whole rather than looking
separately at individual countries as
traditional shipping systems do. Its total
capacity will have been doubled to two
billion objects by the end of the first quarter
2004. It has already proved its worth in
respect of the “24 Hour Rule” which
requires carriers to deliver shipment
information to the US Customs, with other
jurisdictions either having already followed
or about to follow suit, 24 hours before the
container is loaded. Implementation was
simple since all necessary information was
already available from the moment of on-
line booking. It will again prove invaluable
in the future if RFID (radio tag technology)
becomes standard to assist shippers in
tracking all their individual shipments at all
times. This may be some way off however,
since IRIS-2 already tracks all containers at
all times.
As one of the most advanced and
comprehensive open software platforms in
the industry, CargoSmart added Vessel
Tracking and Invoices and Payments to its
online functions. It also enhanced its product
range by providing “offline” methods of
conduct ing common shipper-carr ier
transactions, including shipping instructions,
and it enhanced its bill of lading printing
capabilities with batch printing and secure
printing on blank paper. CargoSmart and its
technology partner Hewlett-Packard, also
renewed their long-term hosting agreement
f o r a n o t h e r t h re e y e a r s , f u r t h e r
strengthening the technological foundation
and customer technical support delivery of
the company. By the end of 2003,
CargoSmart had grown to over 11,000
registered users transacting on a system that
was being populated with an average of
215,000 new shipments a month.
16
OO
IL A
NN
UA
L R
EPO
RT 2
003
Operations Review
CONTAINER TERMINALS
The two container terminals in Vancouver,
Deltaport and Vanterm continued to enjoy
volume growth in 2003 with a combined
increase of 7% above 2002 in the
throughput of containers. Although
remaining profitable, the operating profits
of these two terminals were not at the same
levels as in the prior year due to increasing
costs such as taxes, insurance, labour,
meeting the ISPS code (International Ship
and Port Facility Security Code) and the
challenges resulting from handling a
significant increase in rail import/export
volumes.
Although the customer mix changed
somewhat from 2002, the overall increase
was due in part to a number of factors. The
two terminals both continued to build on
their success at serving as a first port of call
for Trans-Pacific carriers, at providing an
alternative gateway to the US Midwest and
at growing further in the Canadian import/
export marketplace. Further volume
increases are attributable to certain existing
customers having introduced additional
services, the addition of new customers and
to an extent, the continued diversion of
traffic due to the labour disruption of the
US West Coast ports in late 2002. The 7%
increase in throughput over 2002 is still
significantly positive growth building on the
initial 26% growth experienced in the prior
year as the two Vancouver terminals
successfully secured a new customer base.
New challenges experienced in 2003
included the additional costs and operational
issues of handling the significant increase in
rail volumes. The required co-operation and
support of the railways is critical to ensure
that these challenges are minimised. To meet
the ongoing challenges to the overall
capacity of Deltaport and Vanterm, several
initiatives were undertaken to increase
terminal capacity and to improve terminal
efficiency and productivity in a cost-effective
manner. These initiatives included a terminal
expans ion at Vanterm at a cost of
approximately US$30 million, including the
purchase of two 65-ton super post-Panamax
cranes and an increase in terminal and inter-
modal yard capacity and the purchase of a
seventh gantry crane for the Deltaport
facility to improve the turnaround time and
free up additional berth windows. All new
cranes will be delivered in early 2005.
Discussions continue with the Vancouver
Port Authority on the subject of a third,
additional berth at Deltaport and the
expansion of its container yard.
Global Terminal in New Jersey, recovering
from a difficult 2002, acquired new business
in 2003 increasing its throughput by 132%.
With the return of throughput to pre-2002
levels, Global’s financial and operational
performance has demonstrated a marked
improvement. Having now completed its
transition to a fully grounded mode of
terminal operations using rubber-tyred
gantry cranes, Global has significantly
increased its terminal capacity. Coupled
w i t h o t h e r p l a n n e d f a c i l i t y a n d
service improvements, including the
implementat ion of a new termina l
information system, an Optical Character
Recognition gate complex and the reduction
of redundant labour and process practices,
more efficiencies in operations and cost will
be realised. Also, the planned deepening and
extension of the berth length will position
Global to acquire additional business and
bring the terminal to its full potential. In
addition, Global is actively pursuing with a
local short-line railroad the implementation
of a near-dock inter-modal service, moving
yet further to meet its customer needs.
Global’s geographic location within the Port
of New York and New Jersey is ideally suited
to meet the increasing demands of container
carriers by providing unrestricted access
from the open sea, and therefore the
shortest transit time, as compared with other
facilities in the port. These attributes will
insure the long-term ability of Global to
maintain a customer base that will utilise the
full capacity of the terminal.
Howland Hook, on the New York side of
the harbour and located on Staten Island,
achieved its second consecutive year of
profitability. While net revenues were down
year over year based on a reduced volume
of 25% versus the previous year, there were
several key strategic projects which moved
forward and the completion of a revised
17
OO
IL A
NN
UA
L R
EPO
R T 2
003
lease arrangement with the Port Authority
made 2003 a very positive year for this
facility. The lease revision removed several
million dollars of recorded debt and will
significantly enhance the terminal’s future
financial position.
The loss of a customer in the fourth quarter
of 2002 was partially offset with the terminal
regaining another vessel string from the
same customer at the start of the third
quarter in 2003. On a strategic note,
construction on several key projects
including on-dock rail, a 500 ft berth
extension and channel dredging have all
made significant progress. These three
pro jects , wi th a combined cost of
approximately US$600 million, are being
funded by the Port Authority of New York
and New Jersey together with the federal
government providing much of the funding
for the dredging, and will all be complete in
mid-2005 and thereby increasing the
facility’s capacity by approximately 38%.
Dredging of the approach channel also
commenced in July 2003 and once complete
this 18 month project will allow the facility
to handle the largest vessels which call at
the harbour.
Comp l iment ing th i s non- recou r se
investment, the terminal upgraded much of
its terminal handling equipment and
completed a contract for the acquisition of
four new post-Panamax cranes which will
be on line in the third quarter of 2004. Taken
together, these terminal improvements,
combined wi th the new operat ing
equipment, will significantly enhance the
long-term value of this operation. During
the coming year Howland Hook will also
complete a corporate restructuring and
going forward, the terminal wil l be
reorganised as New York Container Terminal
Inc., scheduled for completion during the
first quarter of 2004.

18
OO
IL A
NN
UA
L R
EPO
RT 2
003
Operations Review
PROPERTY INVESTMENT
The Group continues its policy of selected
investments of a size and quality which have
the potential for solid and consistent returns.
The Group retains its 8% interest in Beijing
Oriental Plaza which has now been
completed. The project consists of 117,000
sq m of retail space, 295,000 sq m of office
space, a 500 room 5 star hotel and over 800
service apartments, in total some 585,000
sq m in gross floor area. While the project is
now achieving modest profits at the project
level, we do not expect this to contribute in
the near term to Group profitability as a
result of the accounting treatment. The total
cash investment by the Group has been
US$93.6 million. No further injection of
equity will be required.
Wall Street Plaza, the Group’s investment
property in New York City’s financial district,
started the year with a vacancy rate of 11%
but a strong leasing programme reduced this
to below 1% as 2003 drew to a close,
significantly better than the 15% overall
vacancy rate in the Downtown Manhattan
office market. Furthermore, a majority of
those tenants with leases due to expire in
2004 and 2005 and who collectively occupy
12% of the building, elected during 2003
to extend the terms of their respective leases
Operations Review
PROPERTY
INVESTMENT
AND
DEVELOPMENT
by an average of five years. Wall Street Plaza
remains profitable and is strongly positioned
to ride out the current market downturn.
In 2003, the Group purchased the freehold
interest in a 8,053 sq ft parcel of land which
accounts for approximately 36.5% of the
s i te on which Wal l S t reet P laza i s
constructed. This purchase has brought the
Group’s f reehold ownership of the
underlying land to 95.1% and provides it
with a better position and flexibility in
forward planning for Wall Street Plaza. As
at the end of 2003, the building was valued,
on an open market basis, at US$100 million.
This compares with a valuation as at the end
of 2002 by the same valuer of US$90
million. The increase in valuation includes
the newly acquired freehold ownership of
the underlying parcel which was purchased
for approximately the difference in the two
valuation results.
PROPERTY DEVELOPMENT
The Shanghai residential real estate market
has continued to grow and the luxury sector
registered strong growth for 2003. We
continue to be cautiously optimistic given
the steep rise in the residential market over
the past three years. However, the market
continued to be supported by a number of
factors including (i) the continued growth

19
OO
IL A
NN
UA
L R
EPO
R T 2
003
in the underlying economy of Shanghai; (ii)
the continued inflow of capital and
businesses into Shanghai from both outer
provinces and overseas; (iii) the continued
discharge of pent-up demand; ( iv)
speculative buying and investment; (v) new
plot ratio restrictions within the city centre;
(vi) an active second hand market thereby
further stimulating the primary market; and
(vii) a further slow down in supply as
resettlement guidelines become more
stringent. Going forwards, the Government
seems to be encouraging further home
ownership in the mid and mid to low sectors
of the market. It has announced plans to
increase the mortgage ratio for these sectors
to 85%, plans to lift the RMB100,000 ceiling
on provident fund usage by home buyers
and has announced a preferential interest
rate subsidy policy for lower income buyers.
It has also place significant emphasis on
building subway and elevated light railway
links in and around the city.
Overall, although the market has risen less
dramatically during 2003 than previously
there continues to be concern over the
building of a real estate bubble. While
corrections in selected sectors of the market
cannot be ruled out, the affordability of
home ownership appears to remain healthy.
D u r i n g 2 0 0 3 , O r i e n t O v e r s e a s
Developments Ltd (“OODL”) delivered a
total of approximately 60,000 sq m of
completed residential units in Phases 1B and
2A of Century Metropolis in the Xu Hui
d i s t r i c t o f Shangha i . A t p re sen t ,
approximately 58,000 sq m of residential
units in Phase 2B are under construction.
The sales of residential units in Century
Metropolis during 2003 were in line with
projections and satisfactory. Sales of the
residential units in Phase 2B are scheduled
for mid-2004.
The project on the Changle Lu site in the
Luwan district of Shanghai will have a total
gross floor area of approximately 134,000
sq m and will feature a high-end residential
complex in one of Shanghai’s most
prestigious locations. The Master plan has
been approved in principle and piling is
scheduled to commence during the summer
of 2004. Sales of the residential units are
expected to begin in 2005.
The Group’s property development team
under OODL was able to work through
challenges to both construction and sales
brought about by SARS. The result of the
development projects reflects a deep,
mature and well functioning development
team adapting well to an ever changing local
environment. In addition, OODL has begun
targeting areas slightly outside the Shanghai
City boundaries. Although still in their early
stages, negotiations under way would, if
successful, result in a pipeline project of at
least 200,000 sq m Gross Floor Area situated
40 minutes to the west of Shanghai. We
would expect such a project to begin
contributing to the Group from 2006
onwards.


22
OO
IL A
NN
UA
L R
EPO
RT 2
003
Financial Review
Analysis of Consolidated Profit and Loss Account
Summary of Group Results
US$’000 2003 2002 Variance
Operating results by activity:
International transportation and logistics 323,123 69,481 253,642
Container terminals 35,034 11,856 23,178
Property investment and development 21,075 19,631 1,444
Investments and corporate services 238 (5,921) 6,159
Earnings before interest and tax 379,470 95,047 284,423
Interest income 14,020 11,079 2,941
Interest expenses (30,892) (36,932) 6,040
Financing charges (9,292) (6,292) (3,000)
Profit before taxation 353,306 62,902 290,404
Taxation (24,145) (10,954) (13,191)
Minority interests (117) (210) 93
Profit attributable to shareholders 329,044 51,738 277,306
23
OO
IL A
NN
UA
L R
EPO
R T 2
003
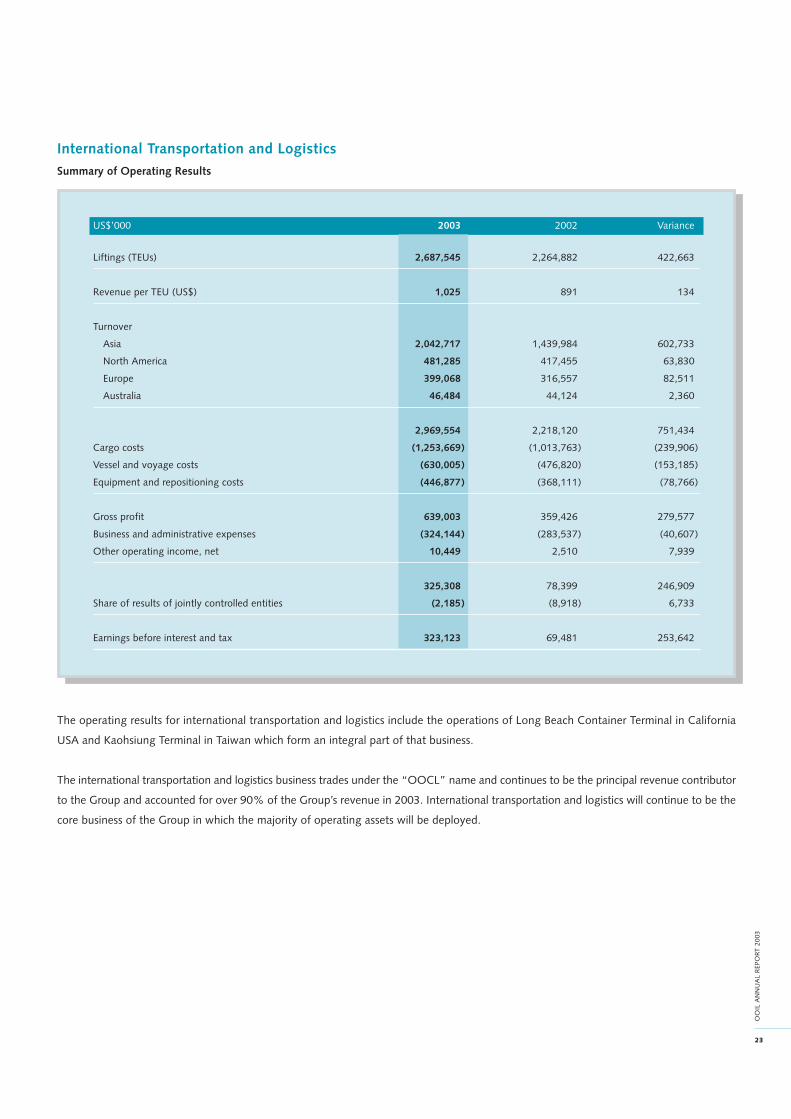
International Transportation and Logistics
Summary of Operating Results
US$’000 2003 2002 Variance
Liftings (TEUs) 2,687,545 2,264,882 422,663
Revenue per TEU (US$) 1,025 891 134
Turnover
Asia 2,042,717 1,439,984 602,733
North America 481,285 417,455 63,830
Europe 399,068 316,557 82,511
Australia 46,484 44,124 2,360
2,969,554 2,218,120 751,434
Cargo costs (1,253,669) (1,013,763) (239,906)
Vessel and voyage costs (630,005) (476,820) (153,185)
Equipment and repositioning costs (446,877) (368,111) (78,766)
Gross profit 639,003 359,426 279,577
Business and administrative expenses (324,144) (283,537) (40,607)
Other operating income, net 10,449 2,510 7,939
325,308 78,399 246,909
Share of results of jointly controlled entities (2,185) (8,918) 6,733
Earnings before interest and tax 323,123 69,481 253,642
The operating results for international transportation and logistics include the operations of Long Beach Container Terminal in California
USA and Kaohsiung Terminal in Taiwan which form an integral part of that business.
The international transportation and logistics business trades under the “OOCL” name and continues to be the principal revenue contributor
to the Group and accounted for over 90% of the Group’s revenue in 2003. International transportation and logistics will continue to be the
core business of the Group in which the majority of operating assets will be deployed.

24
OO
IL A
NN
UA
L R
EPO
RT 2
003
Financial Review
Asia
Asia is the largest revenue generating area for the international transportation and logistics business. Turnover categorised under this area
is composed of the following:
• Eastbound freight of the Asia/North America West Coast service;
• Eastbound freight of the Asia/US East Coast service;
• Westbound freight of the Asia/Northern Europe service;
• Westbound freight of the Asia/Mediterranean service;
• Southbound freight of the Asia/Australia and New Zealand service;
• various Intra-Asia services; and
• the operation of Kaohsiung Terminal in Taiwan.
Turnover from the Asia area rose from US$1,440.0 million in 2002 to US$2,042.7 million in 2003 with a notable increase in the volume of
exports to North America across the Pacific, from which a significant portion of the revenue was derived. The Westbound leg of the Asia/
Northern Europe service also recovered strongly from the poor market conditions prevailing in previous years with a 24% increase in liftings
and a corresponding recovery in revenues. Together with the continuing volume increases in Intra-Asia services, all contributed to the
revenue growth for the year.
Liftings on the Eastbound Asia/North America West Coast service increased by 14%, achieved without softening freight rates. Performance
of the Westbound leg of the Asia/Northern Europe service followed a similar pattern with substantial gains in both liftings and revenue.
Intra-Asia also recorded a 33% growth in liftings for the year, at the expense of a slight fall in average freight rates.
Overall load factors as a percentage of the capacity available during 2003 dropped slightly by 1% as compared with 2002, but compared
with a 27% increase in available capacity during the year, notably in the Intra-Asia and Europe bound routes. Results from this region will
always be dependent upon the economic environment and consumption patterns of North America and Europe.
Kaohsiung Container Terminal in Taiwan forms an integral part of the international transportation and logistics business and its terminal
facilities were mainly employed by OOCL and its alliance members.
North America
Turnover categorised under the North America area is comprised primarily of the following:
• Westbound freight of the Asia/North America West Coast service;
• Westbound freight of the Asia/US East Coast service;
• Eastbound freight of the US East Coast/Northern Europe service;
• Eastbound freight of the Canada/Northern Europe service; and
• the operation of Long Beach Container Terminal in California, USA.
Revenue increased by US$63.8 million for this area in 2003. With the exception of the Eastbound leg of the Canada/Northern Europe
service, all routes from this region recorded positive revenue growth, especially the Westbound segment of the Asia/North America West
Coast services which experienced a turnaround from the prolonged decline in freight rates since 1996.

25
OO
IL A
NN
UA
L R
EPO
R T 2
003
Westbound liftings on the Asia/North America West Coast service recorded a 6% increase over last year while the Westbound trade of the
Asia/US East Coast service via the Panama Canal also achieved a notable improvement of 18%. Performance of the Eastbound Canada/
Northern Europe and US East Coast/Northern Europe services barely attained 2002 level. The former achieved improvements in freight rates
but at the expense of liftings while the latter’s volume gain was largely offset by a corresponding rate decrease.
Average revenue per TEU on all outbound cargoes from North America rose by 9% in 2003 compared with 2002, with a notable recovery
in the Trans-Pacific routes.
With the growth in capacity outpacing the increase in liftings, overall load factors in the region recorded a 6% drop from last year.
Long Beach Container Terminal forms an integral part of the international transportation and logistics business with its terminal facilities
mainly employed by OOCL and its alliance partners. The operating results of the terminal were comparable with those of 2002.
Europe
Turnover categorised under the Europe area is composed primarily of the following:
• Westbound freight of the US East Coast/Northern Europe service;
• Westbound freight of the Canada/Northern Europe service;
• Eastbound freight of the Asia/Northern Europe service;
• Eastbound freight of the Asia/Mediterranean service; and
• various Intra-European services.
Turnover for this area in 2003 greatly surpassed that of 2002 by US$82.5 million. The Eastbound leg of the Asia/Northern Europe service,
being the largest volume source for the Europe area, performed exceptionally well during the year with a promising growth in volume and
a comparable rebound in freight rates. The Westbound rates of the Transatlantic routes also received substantial increments to complement
a notable revenue increase for the region.
Although liftings for the Westbound sectors of the Canada/Northern Europe and US East Coast/Northern Europe services were slightly
better than those of 2002, average revenue per TEU improved by nearly 20% during the year. Comparatively, the Eastbound leg of the
Asia/Northern Europe service experienced a rebound from the precarious market conditions of previous years. Liftings for this segment
recorded a 21% rise in 2003 and per TEU revenue also registered a 17% gain.
Overall load factors as a percentage of capacity available for cargo shipments from this region were 4% lower than that of 2002 but
balanced against a 12% capacity increase for the Europe area in year 2003.
Average revenues per TEU on all outbound cargoes from Europe recorded a 20% increase from the 2002 levels with both the Transatlantic
trade lanes and the export market to Asia experiencing a similar recovery in freight rates.

26
OO
IL A
NN
UA
L R
EPO
RT 2
003
Financial Review
Australia
Turnover from this area is principally the Northbound freight of our Asia/Australia and New Zealand services. The East Asia/Australia service
was operated in consortium with ANL, ZIM and China Shipping from May 2002 onwards. ZIM withdrew in May 2003 and was replaced by
a new service jointly operated with China Shipping. The South East Asia/Australia service is operated in alliance with MISC, MOL and PIL.
The New Zealand service is operated under a slot purchase agreement with PIL and RCL.
Liftings on the Northbound Asia/Australia and New Zealand service increased by 22% in 2003, at the expense of a 12% drop in average
revenue, resulting in a net gain in turnover of US$2.4 million for the year.
Operating Costs
Cargo costs mainly consist of terminal charges, inland transportation costs, commission and brokerage, cargo assessment and freight tax
which were largely paid in the local currencies of the areas in which the activities were performed. With a 19% growth in liftings for 2003,
total cargo costs also rose by US$239.9 million, a 24% increase. On a per TEU basis, savings were recorded in items such as transportation,
commission and brokerage while terminal costs only grew at a marginal rate.
Vessel costs include the operating costs and depreciation charges for the OOCL fleet as well as the net charter hire and slot hire expenses
incurred in order to maintain the desired service level. With the total number of vessels, either owned or chartered in and operated by
OOCL, increasing from 47 in 2002 to 55 in 2003, total carrying capacity increased from the 153,543 TEU of 2002 to 184,781 TEU in 2003
through the phase-in of new and larger vessels. Consequently, vessel costs increased by 22% in 2003 with a notable rise in charter-hire
expenses as charter-hire rates inflated significantly during the year.
Voyage costs comprise mainly bunker costs, port charges, canal dues, cargo claims and insurance. The number of sailings in 2003 increased
by 8% and bunker prices also rose from an average of US$143 per ton in 2002 to an average of US$167 per ton during 2003. As a result,
costs in this category were driven up by more than 40%.
Equipment costs principally represent maintenance and repair costs, rental payments, depot expenses and depreciation charges for the fleet
of containers and chassis equipment while repositioning costs mainly arise from relocating empty containers from areas of low activity to
high demand regions. Total equipment and repositioning costs increased by US$78.8 million in 2003, which was in line with the growing
size of the container fleet from the 369,699 TEU of 2002 to 420,004 TEU in 2003.
Business and administrative expenses largely comprise staff costs, office expenses, selling and marketing costs and professional and information
system expenses. With the increasing business volumes, additional offices setup around the globe and a 7% headcount increase, business
and administrative expenses also rose by US$40.6 million in 2003.
Share of Results of Jointly Controlled Entities
The share of the US$2.2 million loss from jointly controlled entities in 2003 was attributable to the provision for asset impairment for a depot
joint venture in Qingdao. The US$8.9 million share of the loss in 2002 arose mainly from a jointly controlled entity which was formed by
members of the former Global Alliance to engage in vessel chartering. Following the reorganisation of that alliance at the end of 1997,
vessel chartering activities in this joint venture company were much reduced and resulted in operating losses in subsequent years. The
chartering arrangements ceased in 2003.
Earnings Before Interest and Tax
Earnings before interest and tax of US$323.1 million for the international transportation and logistics business in 2003 were US$253.6
million higher than last year due mainly to the freight rate and volume increases. Average revenue per TEU for 2003 was US$1,025 as
compared with US$891 for 2002. Liftings also increased from 2.26 million TEU in 2002 to 2.69 million TEU in 2003.
27
OO
IL A
NN
UA
L R
EPO
R T 2
003
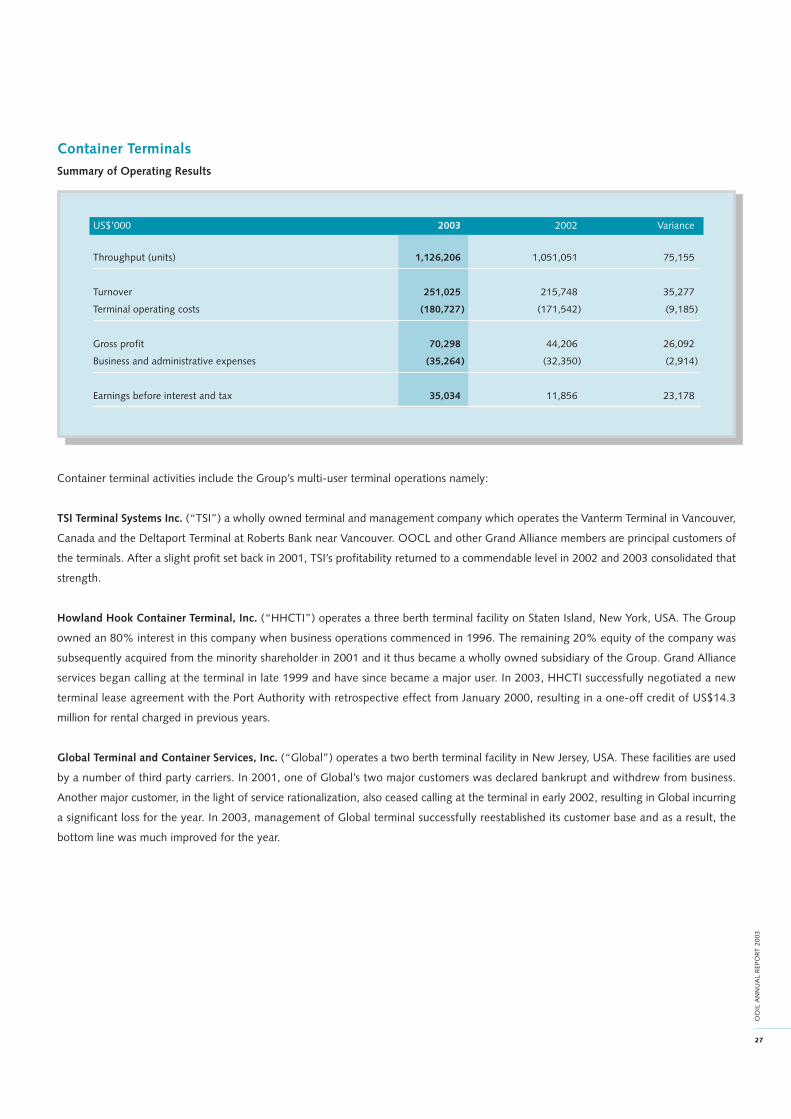
Container Terminals
Summary of Operating Results
US$’000 2003 2002 Variance
Throughput (units) 1,126,206 1,051,051 75,155
Turnover 251,025 215,748 35,277
Terminal operating costs (180,727) (171,542) (9,185)
Gross profit 70,298 44,206 26,092
Business and administrative expenses (35,264) (32,350) (2,914)
Earnings before interest and tax 35,034 11,856 23,178
Container terminal activities include the Group’s multi-user terminal operations namely:
TSI Terminal Systems Inc. (“TSI”) a wholly owned terminal and management company which operates the Vanterm Terminal in Vancouver,
Canada and the Deltaport Terminal at Roberts Bank near Vancouver. OOCL and other Grand Alliance members are principal customers of
the terminals. After a slight profit set back in 2001, TSI’s profitability returned to a commendable level in 2002 and 2003 consolidated that
strength.
Howland Hook Container Terminal, Inc. (“HHCTI”) operates a three berth terminal facility on Staten Island, New York, USA. The Group
owned an 80% interest in this company when business operations commenced in 1996. The remaining 20% equity of the company was
subsequently acquired from the minority shareholder in 2001 and it thus became a wholly owned subsidiary of the Group. Grand Alliance
services began calling at the terminal in late 1999 and have since became a major user. In 2003, HHCTI successfully negotiated a new
terminal lease agreement with the Port Authority with retrospective effect from January 2000, resulting in a one-off credit of US$14.3
million for rental charged in previous years.
Global Terminal and Container Services, Inc. (“Global”) operates a two berth terminal facility in New Jersey, USA. These facilities are used
by a number of third party carriers. In 2001, one of Global’s two major customers was declared bankrupt and withdrew from business.
Another major customer, in the light of service rationalization, also ceased calling at the terminal in early 2002, resulting in Global incurring
a significant loss for the year. In 2003, management of Global terminal successfully reestablished its customer base and as a result, the
bottom line was much improved for the year.
28
OO
IL A
NN
UA
L R
EPO
RT 2
003
Financial Review
Turnover
Turnover increased by US$35.3 million in 2003 as a result of the significant rebound in the business volumes of Global. Total throughput
levels surpassed last year and successively set another record high in 2003. Average handling rate also showed an 11% growth over that of
2002.
Terminal Operating Costs
Including the one-off credit of rental charged in previous years for HHCTI, operating costs were US$9.2 million higher than 2002 level with
an increased number of boxes handled in 2003. In addition, as TSI’s operating costs were denominated in local currency, i.e. Canadian dollar,
its strength against the weakening in US dollar during the year translated into much higher operating costs for the two terminals in
Vancouver, in terms of US dollars, when compared with 2002.
Business and Administrative Expenses
Business and administrative expenses recorded a US$2.9 million rise in 2003 as compared with those of 2002. In line with the growth in
business volumes, additional headcount and office expenses were incurred to handle the activity growth. In addition, the more than 20%
appreciation of the Canadian dollar against the US dollar in 2003 inflated costs incurred by TSI which, in real terms, had been well contained.
Earnings Before Interest and Tax
Overall operating results improved in 2003 as Global returned to profit after suffering a substantial loss in 2002. While TSI continued to
produce stable profits in 2003, performance for the year was enhanced by the one-off credit of rental accrued in previous years upon the
conclusion of the new terminal lease agreement with the Port Authority by HHCTI.
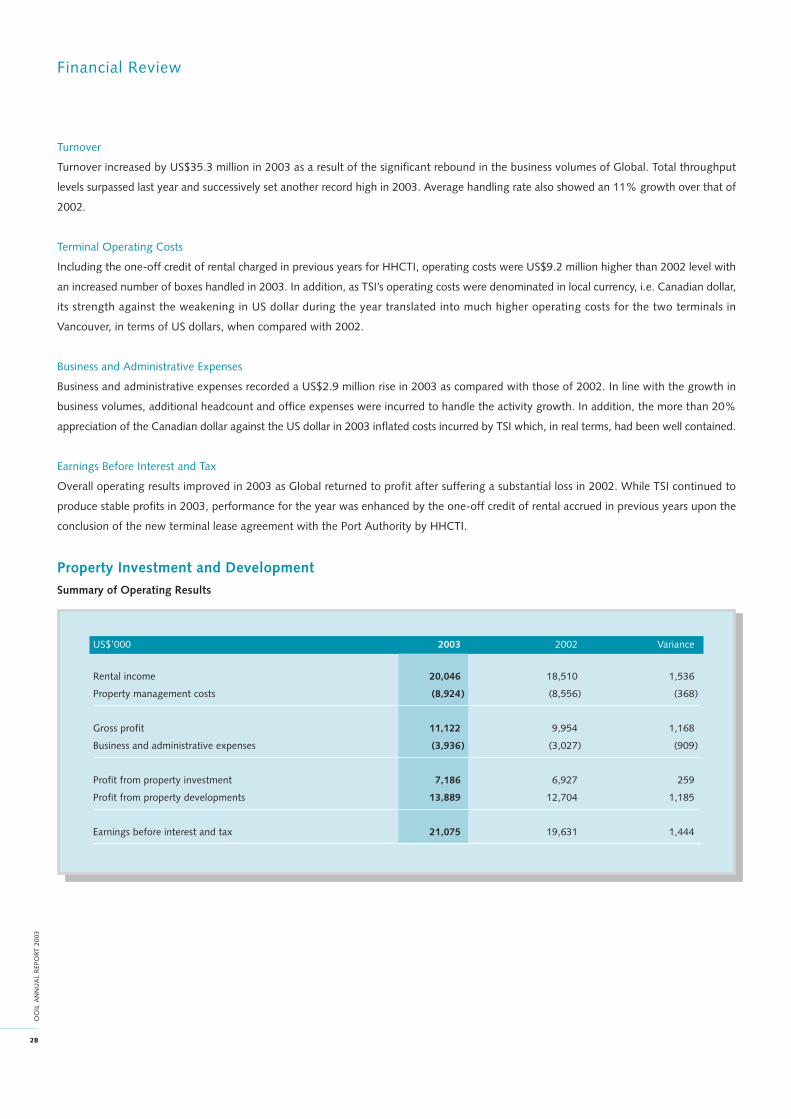
Property Investment and Development
Summary of Operating Results
US$’000 2003 2002 Variance
Rental income 20,046 18,510 1,536
Property management costs (8,924) (8,556) (368)
Gross profit 11,122 9,954 1,168
Business and administrative expenses (3,936) (3,027) (909)
Profit from property investment 7,186 6,927 259
Profit from property developments 13,889 12,704 1,185
Earnings before interest and tax 21,075 19,631 1,444
29
OO
IL A
NN
UA
L R
EPO
R T 2
003
The Group owns an approximately 600,000 sq ft office and commercial property, Wall Street Plaza, located at 88 Pine Street, New York,
USA, an area popularly referred to as the “Wall Street area”. The building was constructed in 1972 and is operated as a multi-tenanted
building. Approximately 20,000 sq ft is occupied by Group companies. The Group also owns an 8% interest in a modern comprehensive
office, commercial, hotel and residential apartment complex known as “Beijing Oriental Plaza”, with a gross floor area of approximately
570,000 sq m, on a site located at Wangfujing Dajie, Beijing.
In addition, the Group owns interests in a number of jointly controlled entities to participate in property development projects in China. The
primary location of these projects is Shanghai. The net rental from Wall Street Plaza provided a stable income source. The other principal
profit contributor for the year was the development project in Ziyang Lu (“Century Metropolis”) Phase 2A, Shanghai. In year 2002, the
major profit contributor was Phase 1B of Century Metropolis.
Rental Income
Rental income for the year, representing mainly the rental income derived from Wall Street Plaza, was higher than that of last year as most
of the leases vacated in 2002 were taken up in 2003, leaving a vacancy rate of less than 1% at the year end.
Profit From Property Developments
A profit of US$13.9 million was recorded from property developments in 2003 compared with US$12.7 million in 2002. A majority of the
current year profit arose from Phase 2A of the Century Metropolis project in Shanghai and the principal profit contributor in 2002 was from
Phase 1B of the same project.
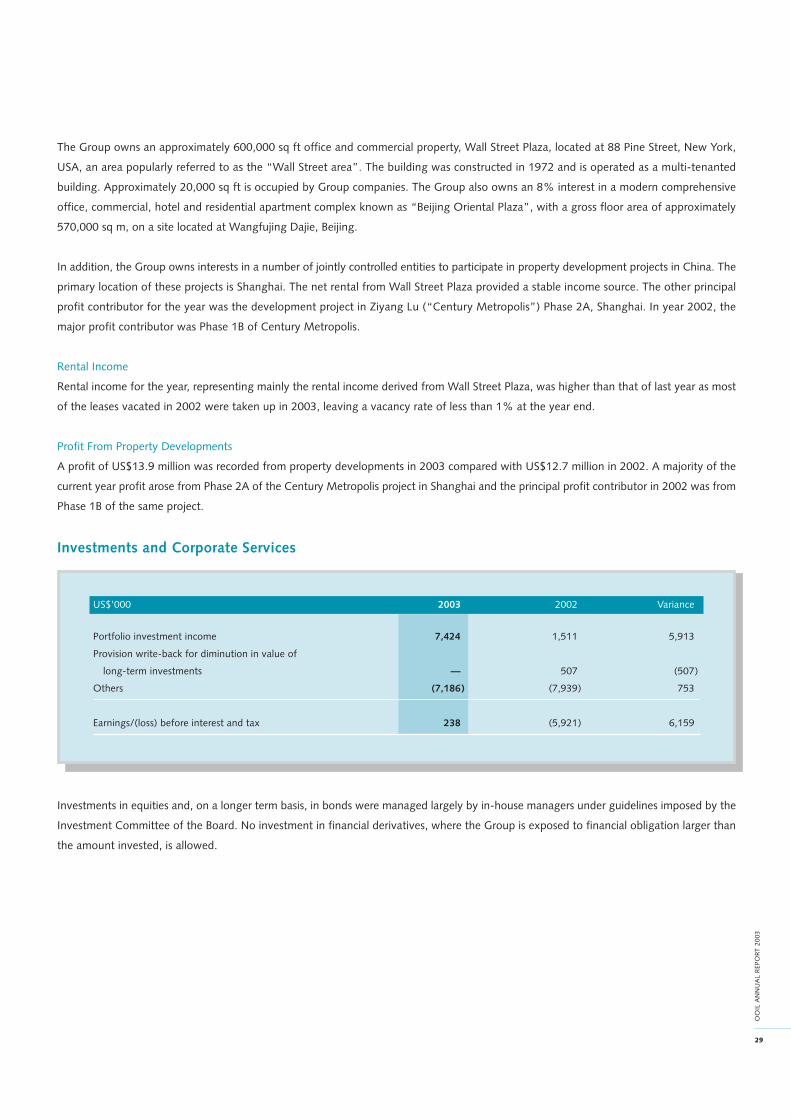
Investments and Corporate Services
US$’000 2003 2002 Variance
Portfolio investment income 7,424 1,511 5,913
Provision write-back for diminution in value of
long-term investments — 507 (507)
Others (7,186) (7,939) 753
Earnings/(loss) before interest and tax 238 (5,921) 6,159
Investments in equities and, on a longer term basis, in bonds were managed largely by in-house managers under guidelines imposed by the
Investment Committee of the Board. No investment in financial derivatives, where the Group is exposed to financial obligation larger than
the amount invested, is allowed.

30
OO
IL A
NN
UA
L R
EPO
RT 2
003
Financial Review
Portfolio investments recorded a profit of US$7.4 million for 2003, an increase of US$5.9 million as compared with 2002. The portfolio
investment result reflected the general recovery of the global financial markets during 2003.
“Others” include corporate business and administration overheads, exchange differences, the research costs of financial projects and other
miscellaneous income and expenses. With favourable exchange differences recorded for the year, the net expenses level of 2003 was
US$0.8 million lower than that of 2002.
Interest Income, Expenses and Financing Charges
The Group invests surplus liquid funds, other than funds allocated for investments in bonds and listed equity securities, in cash and bank
deposits. The Group incurs interest expenses on bank loans, finance leases and, to a very small extent, on bank overdrafts. These borrowings
are variously secured against vessels, containers, chassis, terminal equipment and the investment property owned by the Group. The Group
also incurs financing charges on its asset securitisation programme and fees as a result of finance arrangements and lease administration.
Interest Income
Interest income arises from the deposit of available Group cash balances on a short-term basis with banks and other financial institutions.
Interest income may vary year to year with the cash flows of the business, the level of capital expenditure and new investments (particularly
in relation to property development projects in China) and the amount which the Group commits to its investment portfolio. With the
growth in average cash balances during the year, total interest income for 2003 was US$2.9 million higher than 2002.
Interest Expenses
Interest expenses decreased by US$6.0 million in 2003 as compared with 2002. With a further decline in general interest rates during 2003,
interest expenses reduced correspondingly, but partly offset by the increase in indebtedness as a result of the new loans drawn upon the
delivery of newbuildings during the year. The average cost of finance dropped from 3.8% in 2002 to 3.1% in 2003 as a whole.
Financing Charges
Financing charges mainly include loan arrangement fees, commitment fees, financing costs for loan stocks and charges for the asset
securitisation programme. Total financing charges for the year increased by US$3.0 million principally due to the full year effect of the
financing costs associated with the loan stocks of a subsidiary, offset in part by savings in the asset securitisation programme pursuant to the
lower prevailing interest rates.

31
OO
IL A
NN
UA
L R
EPO
R T 2
003
Profit before Taxation
Pre-tax profit for the year reached a record high of US$353.3 million compared with US$62.9 million in 2002. The international transportation
and logistics business achieved a remarkable result for the year. The Group’s result was further boosted by the timely recovery of terminal
operations and continual contributions from the property investment and development segment.
Taxation
US$’000 2003 2002 Variance
Overseas taxation
Company and subsidiaries:
North America 15,900 6,450 (9,450)
Europe 370 107 (263)
China 1,015 381 (634)
Asia and others 813 289 (524)
Jointly controlled entities:
Europe — 13 13
China 6,047 3,714 (2,333)
Total 24,145 10,954 (13,191)
The Group’s tax liabilities largely arise from profits on its terminal operations in North America. Tax was also incurred for agency and logistics
activities carried on in other parts of the world. The higher tax liabilities in North America for the year principally reflected the much
improved profit level from terminal operations while the increase in tax in China was attributable to the increase of business operation in the
growing logistics market.
32
OO
IL A
NN
UA
L R
EPO
RT 2
003
Financial Review
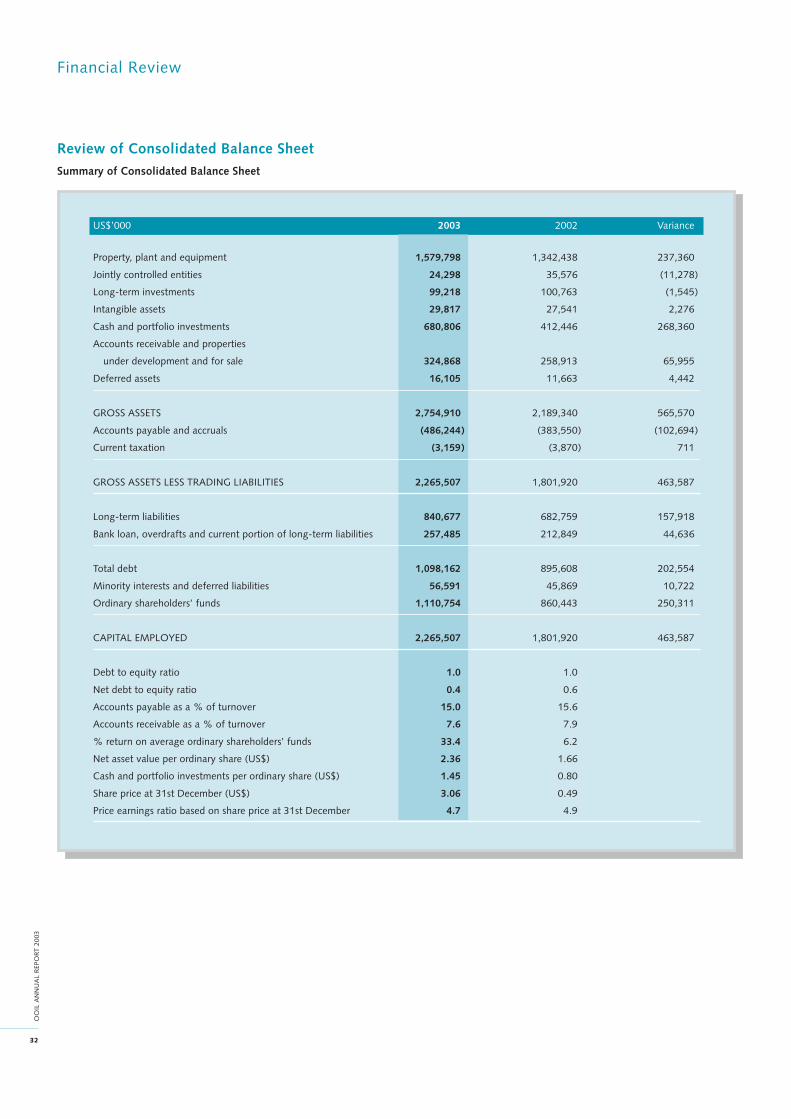
Review of Consolidated Balance Sheet
Summary of Consolidated Balance Sheet
US$’000 2003 2002 Variance
Property, plant and equipment 1,579,798 1,342,438 237,360
Jointly controlled entities 24,298 35,576 (11,278)
Long-term investments 99,218 100,763 (1,545)
Intangible assets 29,817 27,541 2,276
Cash and portfolio investments 680,806 412,446 268,360
Accounts receivable and properties
under development and for sale 324,868 258,913 65,955
Deferred assets 16,105 11,663 4,442
GROSS ASSETS 2,754,910 2,189,340 565,570
Accounts payable and accruals (486,244) (383,550) (102,694)
Current taxation (3,159) (3,870) 711
GROSS ASSETS LESS TRADING LIABILITIES 2,265,507 1,801,920 463,587
Long-term liabilities 840,677 682,759 157,918
Bank loan, overdrafts and current portion of long-term liabilities 257,485 212,849 44,636
Total debt 1,098,162 895,608 202,554
Minority interests and deferred liabilities 56,591 45,869 10,722
Ordinary shareholders’ funds 1,110,754 860,443 250,311
CAPITAL EMPLOYED 2,265,507 1,801,920 463,587
Debt to equity ratio 1.0 1.0
Net debt to equity ratio 0.4 0.6
Accounts payable as a % of turnover 15.0 15.6
Accounts receivable as a % of turnover 7.6 7.9
% return on average ordinary shareholders’ funds 33.4 6.2
Net asset value per ordinary share (US$) 2.36 1.66
Cash and portfolio investments per ordinary share (US$) 1.45 0.80
Share price at 31st December (US$) 3.06 0.49
Price earnings ratio based on share price at 31st December 4.7 4.9
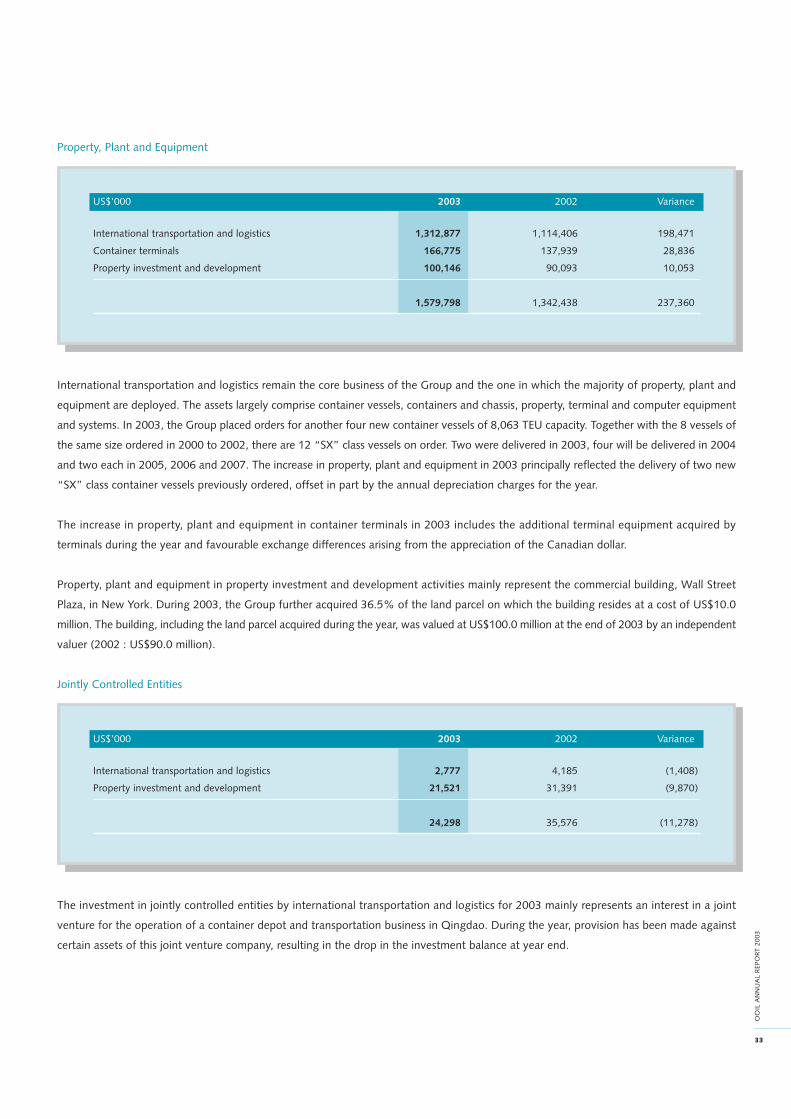
33
OO
IL A
NN
UA
L R
EPO
R T 2
003
Property, Plant and Equipment
US$’000 2003 2002 Variance
International transportation and logistics 1,312,877 1,114,406 198,471
Container terminals 166,775 137,939 28,836
Property investment and development 100,146 90,093 10,053
1,579,798 1,342,438 237,360
International transportation and logistics remain the core business of the Group and the one in which the majority of property, plant and
equipment are deployed. The assets largely comprise container vessels, containers and chassis, property, terminal and computer equipment
and systems. In 2003, the Group placed orders for another four new container vessels of 8,063 TEU capacity. Together with the 8 vessels of
the same size ordered in 2000 to 2002, there are 12 “SX” class vessels on order. Two were delivered in 2003, four will be delivered in 2004
and two each in 2005, 2006 and 2007. The increase in property, plant and equipment in 2003 principally reflected the delivery of two new
“SX” class container vessels previously ordered, offset in part by the annual depreciation charges for the year.
The increase in property, plant and equipment in container terminals in 2003 includes the additional terminal equipment acquired by
terminals during the year and favourable exchange differences arising from the appreciation of the Canadian dollar.
Property, plant and equipment in property investment and development activities mainly represent the commercial building, Wall Street
Plaza, in New York. During 2003, the Group further acquired 36.5% of the land parcel on which the building resides at a cost of US$10.0
million. The building, including the land parcel acquired during the year, was valued at US$100.0 million at the end of 2003 by an independent
valuer (2002 : US$90.0 million).
Jointly Controlled Entities
US$’000 2003 2002 Variance
International transportation and logistics 2,777 4,185 (1,408)
Property investment and development 21,521 31,391 (9,870)
24,298 35,576 (11,278)
The investment in jointly controlled entities by international transportation and logistics for 2003 mainly represents an interest in a joint
venture for the operation of a container depot and transportation business in Qingdao. During the year, provision has been made against
certain assets of this joint venture company, resulting in the drop in the investment balance at year end.
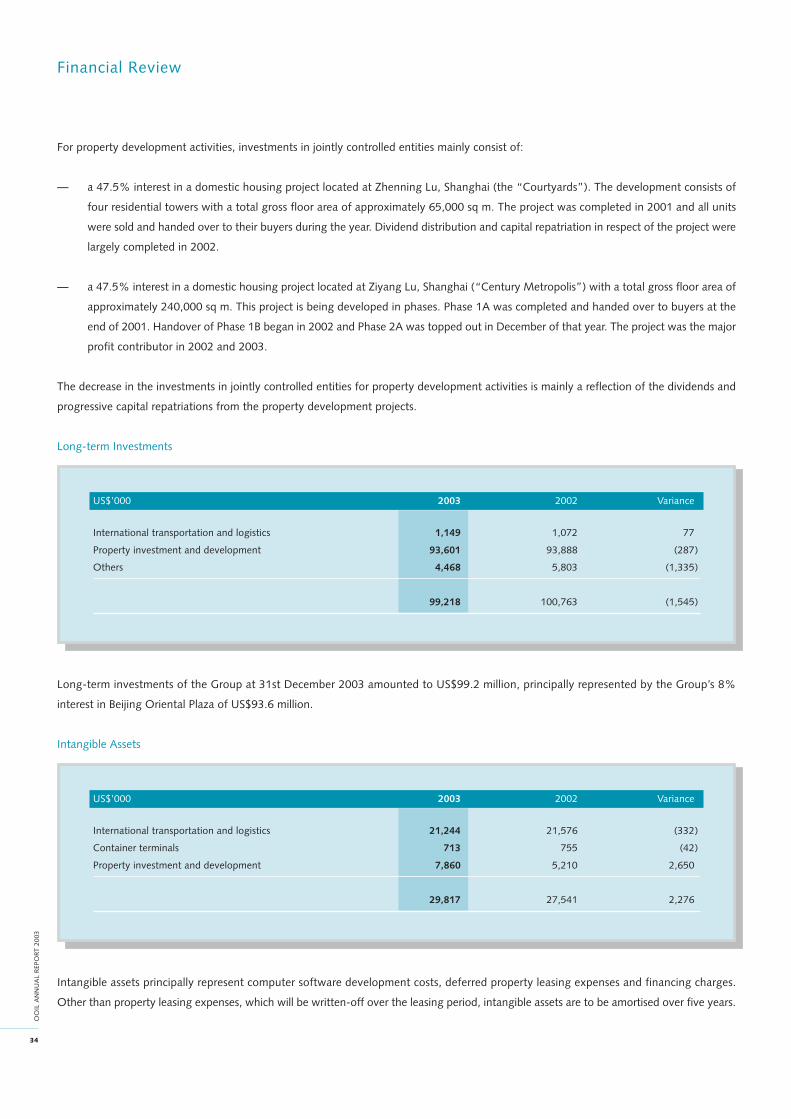
34
OO
IL A
NN
UA
L R
EPO
RT 2
003
Financial Review
For property development activities, investments in jointly controlled entities mainly consist of:
— a 47.5% interest in a domestic housing project located at Zhenning Lu, Shanghai (the “Courtyards”). The development consists of
four residential towers with a total gross floor area of approximately 65,000 sq m. The project was completed in 2001 and all units
were sold and handed over to their buyers during the year. Dividend distribution and capital repatriation in respect of the project were
largely completed in 2002.
— a 47.5% interest in a domestic housing project located at Ziyang Lu, Shanghai (“Century Metropolis”) with a total gross floor area of
approximately 240,000 sq m. This project is being developed in phases. Phase 1A was completed and handed over to buyers at the
end of 2001. Handover of Phase 1B began in 2002 and Phase 2A was topped out in December of that year. The project was the major
profit contributor in 2002 and 2003.
The decrease in the investments in jointly controlled entities for property development activities is mainly a reflection of the dividends and
progressive capital repatriations from the property development projects.
Long-term Investments
US$’000 2003 2002 Variance
International transportation and logistics 1,149 1,072 77
Property investment and development 93,601 93,888 (287)
Others 4,468 5,803 (1,335)
99,218 100,763 (1,545)
Long-term investments of the Group at 31st December 2003 amounted to US$99.2 million, principally represented by the Group’s 8%
interest in Beijing Oriental Plaza of US$93.6 million.
Intangible Assets
US$’000 2003 2002 Variance
International transportation and logistics 21,244 21,576 (332)
Container terminals 713 755 (42)
Property investment and development 7,860 5,210 2,650
29,817 27,541 2,276
Intangible assets principally represent computer software development costs, deferred property leasing expenses and financing charges.
Other than property leasing expenses, which will be written-off over the leasing period, intangible assets are to be amortised over five years.
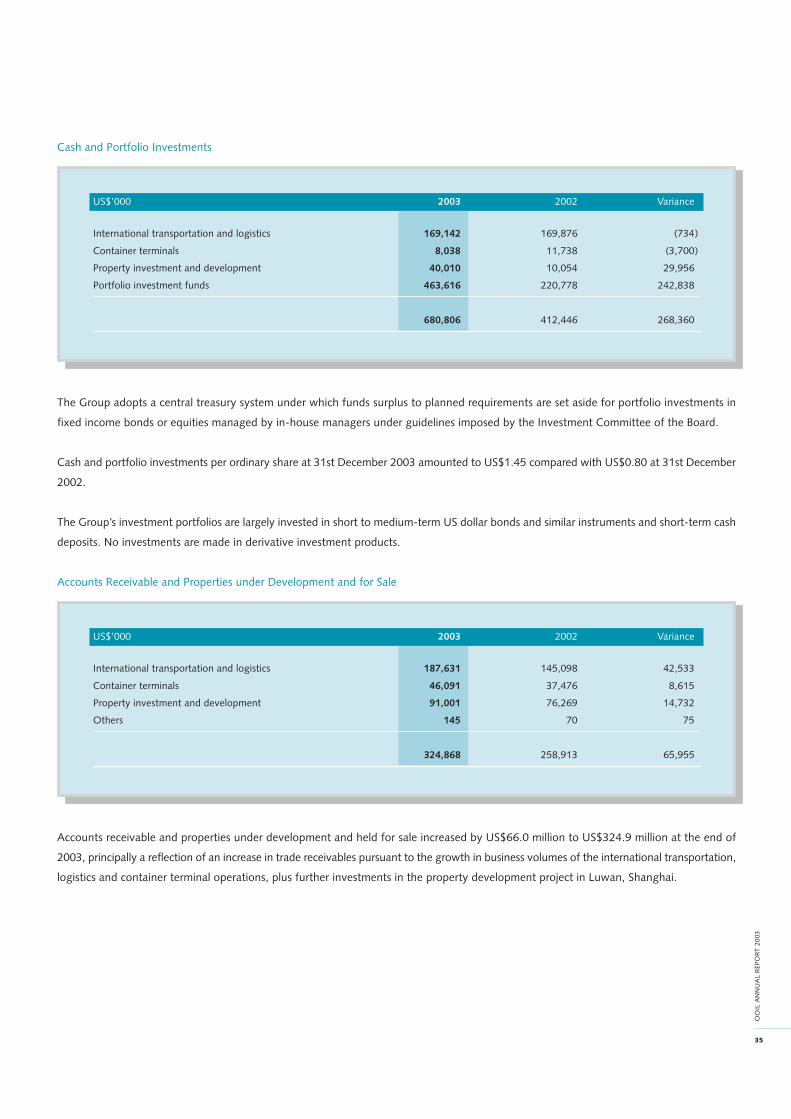
35
OO
IL A
NN
UA
L R
EPO
R T 2
003
Cash and Portfolio Investments
US$’000 2003 2002 Variance
International transportation and logistics 169,142 169,876 (734)
Container terminals 8,038 11,738 (3,700)
Property investment and development 40,010 10,054 29,956
Portfolio investment funds 463,616 220,778 242,838
680,806 412,446 268,360
The Group adopts a central treasury system under which funds surplus to planned requirements are set aside for portfolio investments in
fixed income bonds or equities managed by in-house managers under guidelines imposed by the Investment Committee of the Board.
Cash and portfolio investments per ordinary share at 31st December 2003 amounted to US$1.45 compared with US$0.80 at 31st December
2002.
The Group’s investment portfolios are largely invested in short to medium-term US dollar bonds and similar instruments and short-term cash
deposits. No investments are made in derivative investment products.
Accounts Receivable and Properties under Development and for Sale
US$’000 2003 2002 Variance
International transportation and logistics 187,631 145,098 42,533
Container terminals 46,091 37,476 8,615
Property investment and development 91,001 76,269 14,732
Others 145 70 75
324,868 258,913 65,955
Accounts receivable and properties under development and held for sale increased by US$66.0 million to US$324.9 million at the end of
2003, principally a reflection of an increase in trade receivables pursuant to the growth in business volumes of the international transportation,
logistics and container terminal operations, plus further investments in the property development project in Luwan, Shanghai.
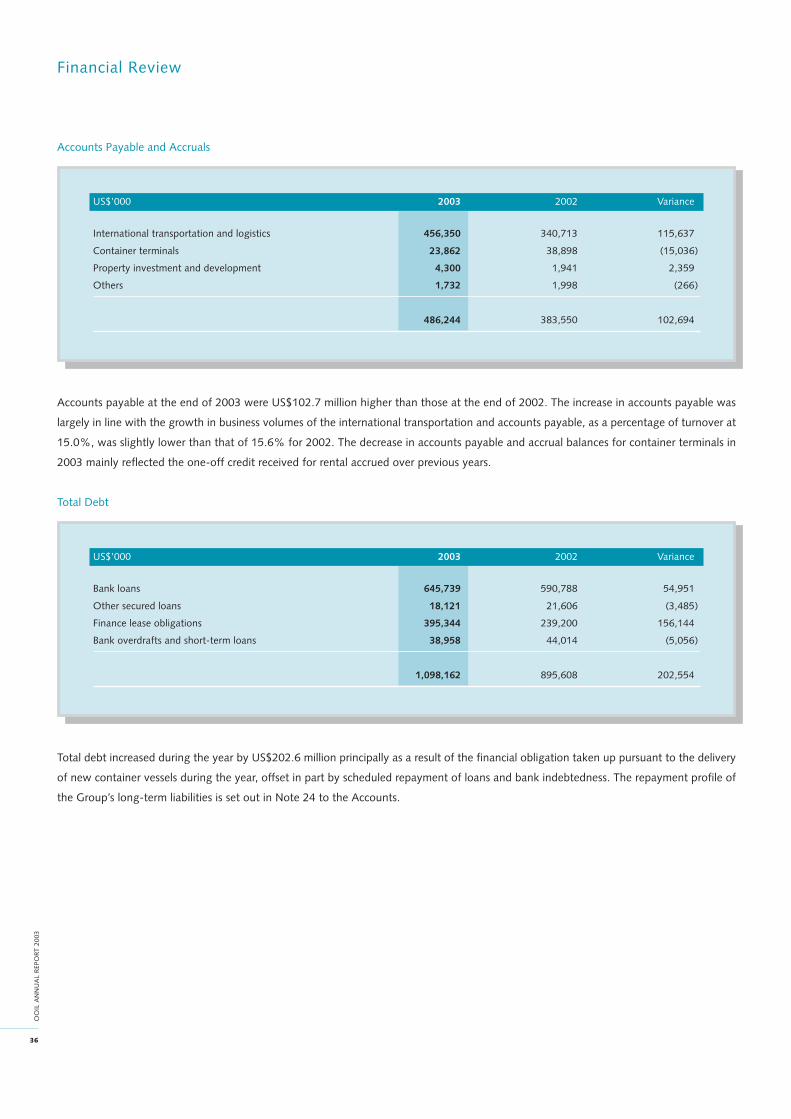
36
OO
IL A
NN
UA
L R
EPO
RT 2
003
Financial Review
Accounts Payable and Accruals
US$’000 2003 2002 Variance
International transportation and logistics 456,350 340,713 115,637
Container terminals 23,862 38,898 (15,036)
Property investment and development 4,300 1,941 2,359
Others 1,732 1,998 (266)
486,244 383,550 102,694
Accounts payable at the end of 2003 were US$102.7 million higher than those at the end of 2002. The increase in accounts payable was
largely in line with the growth in business volumes of the international transportation and accounts payable, as a percentage of turnover at
15.0%, was slightly lower than that of 15.6% for 2002. The decrease in accounts payable and accrual balances for container terminals in
2003 mainly reflected the one-off credit received for rental accrued over previous years.
Total Debt
US$’000 2003 2002 Variance
Bank loans 645,739 590,788 54,951
Other secured loans 18,121 21,606 (3,485)
Finance lease obligations 395,344 239,200 156,144
Bank overdrafts and short-term loans 38,958 44,014 (5,056)
1,098,162 895,608 202,554
Total debt increased during the year by US$202.6 million principally as a result of the financial obligation taken up pursuant to the delivery
of new container vessels during the year, offset in part by scheduled repayment of loans and bank indebtedness. The repayment profile of
the Group’s long-term liabilities is set out in Note 24 to the Accounts.
37
OO
IL A
NN
UA
L R
EPO
R T 2
003
Debt Profile
As at the end of 2003, over 96% (2002 : 92%) of the Group’s total debts were denominated in US dollars which effectively reduces the risk
of exchange fluctuations. Loans in currencies other than US dollars are hedged with a comparable amount of assets in local currencies.
Of the total US$1,098.2 million debt outstanding at the end of 2003, US$149.5 million was fixed rate debt comprised mainly of container
and terminal equipment leases. The fixed rates range from 3.5% to 10.6% dependent upon the cost of money at the time each transaction
was entered into. The remaining US$948.7 million of indebtedness was subject to floating interest rates at various competitive spreads over
three months LIBOR (or equivalent) and relates principally to indebtedness on vessels and the investment property, Wall Street Plaza. In
order to reduce the impact on the Group’s profitability of fluctuating interest rates, the Group entered into interest rate collar contracts for
US$100 million of its floating rate debt. The Group’s average cost of debt at 31st December 2003 was 3.1%, inclusive of the interest rate
hedging contracts.
Shareholders’ Funds
In September 2003, the Group completed an off-market share repurchase of 46,957,088 ordinary shares at a price of HK$9.8 per share. The
repurchased shares were subsequently cancelled resulting in the number of issued and outstanding shares of the Company being reduced
from 517,141,632 shares to 470,184,544 shares. Shareholders’ funds also dropped by US$59.7 million as a result. However, with the
favourable profit reported for the year, the Group’s shareholders’ funds increased by US$250.3 million to US$1,110.8 million at the end of
2003 with a net asset value per ordinary share of US$2.36 (2002 : US$1.66).
Net Debt to Equity Ratio
This ratio was lower at 0.4 as at the end of 2003, as against 0.6 for 2002, with the profits recorded for 2003, offset in part by the share
repurchase during the year. This ratio has been closely monitored in the light of the delivery and financing of new vessels ordered and
forecasts for the business over the next four years. It is the Group’s objective to keep this key ratio below the 1.0 threshold.
Operating Leases and Commitments
In addition to the operating assets owned by the Company and its subsidiaries, the Group also manages and utilises assets through operating
lease arrangements. The total rental payment in respect of these leases for 2004 amounted to US$260.9 million as detailed in Note 31(b) to
the Accounts of this report. Assets under operating lease arrangements consist primarily of container boxes, chassis, container vessels and
certain terminals in North America.
As at the end of 2003, the Group had outstanding capital commitments amounting to US$868.4 million, principally represented by the
orders placed for ten new container vessels to be delivered between 2004 and 2007.
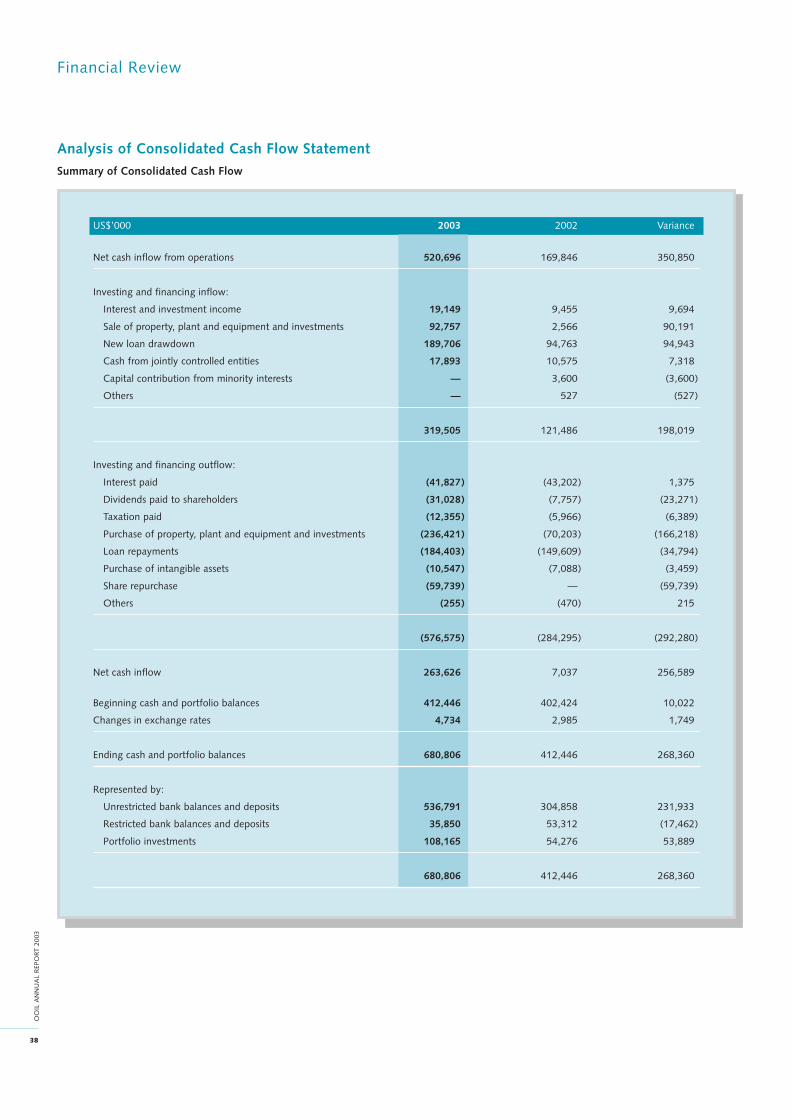
38
OO
IL A
NN
UA
L R
EPO
RT 2
003
Financial Review
Analysis of Consolidated Cash Flow Statement
Summary of Consolidated Cash Flow
US$’000 2003 2002 Variance
Net cash inflow from operations 520,696 169,846 350,850
Investing and financing inflow:
Interest and investment income 19,149 9,455 9,694
Sale of property, plant and equipment and investments 92,757 2,566 90,191
New loan drawdown 189,706 94,763 94,943
Cash from jointly controlled entities 17,893 10,575 7,318
Capital contribution from minority interests — 3,600 (3,600)
Others — 527 (527)
319,505 121,486 198,019
Investing and financing outflow:
Interest paid (41,827) (43,202) 1,375
Dividends paid to shareholders (31,028) (7,757) (23,271)
Taxation paid (12,355) (5,966) (6,389)
Purchase of property, plant and equipment and investments (236,421) (70,203) (166,218)
Loan repayments (184,403) (149,609) (34,794)
Purchase of intangible assets (10,547) (7,088) (3,459)
Share repurchase (59,739) — (59,739)
Others (255) (470) 215
(576,575) (284,295) (292,280)
Net cash inflow 263,626 7,037 256,589
Beginning cash and portfolio balances 412,446 402,424 10,022
Changes in exchange rates 4,734 2,985 1,749
Ending cash and portfolio balances 680,806 412,446 268,360
Represented by:
Unrestricted bank balances and deposits 536,791 304,858 231,933
Restricted bank balances and deposits 35,850 53,312 (17,462)
Portfolio investments 108,165 54,276 53,889
680,806 412,446 268,360

39
OO
IL A
NN
UA
L R
EPO
R T 2
003
A net cash inflow of US$263.6 million was recorded for 2003 as compared with an inflow of US$7.0 million for 2002. Operating cash inflow
for the year was substantially higher than that of 2002 pursuant to the level of operating profits recorded for the year. In 2003, the new
vessels previously ordered were delivered, which accounted for the rise in capital payments and corresponding loan drawdown amounts
while the sale of property, plant and equipment for the year largely represented the disposal of a container vessel pursuant to deployment
plans and the sale-and-lease-back arrangement for one of the delivered vessels. The US$59.7 million share repurchase payment in 2003
reflected the off-market buy back of 46,957,088 ordinary shares of the Company in September 2003. Total cash and portfolio balances rose
to US$680.8 million as at the end of 2003 compared with US$412.4 million in 2002.
Liquidity
As at 31st December 2003, the Group had total cash and portfolio investment balances of US$680.8 million compared with debt obligations
of US$218.5 million repayable in 2004. Total current assets at the end of 2003 amounted to US$984.9 million against total current liabilities
of US$746.9 million. The Group’s shareholders’ funds are entirely ordinary shareholders’ equity and no loan capital is in issue. The Group
prepares and updates cashflow forecasts for asset acquisitions, project development requirements, as well as working capital needs, from
time to time with the objective of maintaining a proper balance between a conservative liquidity level and the efficient investment of surplus
funds.
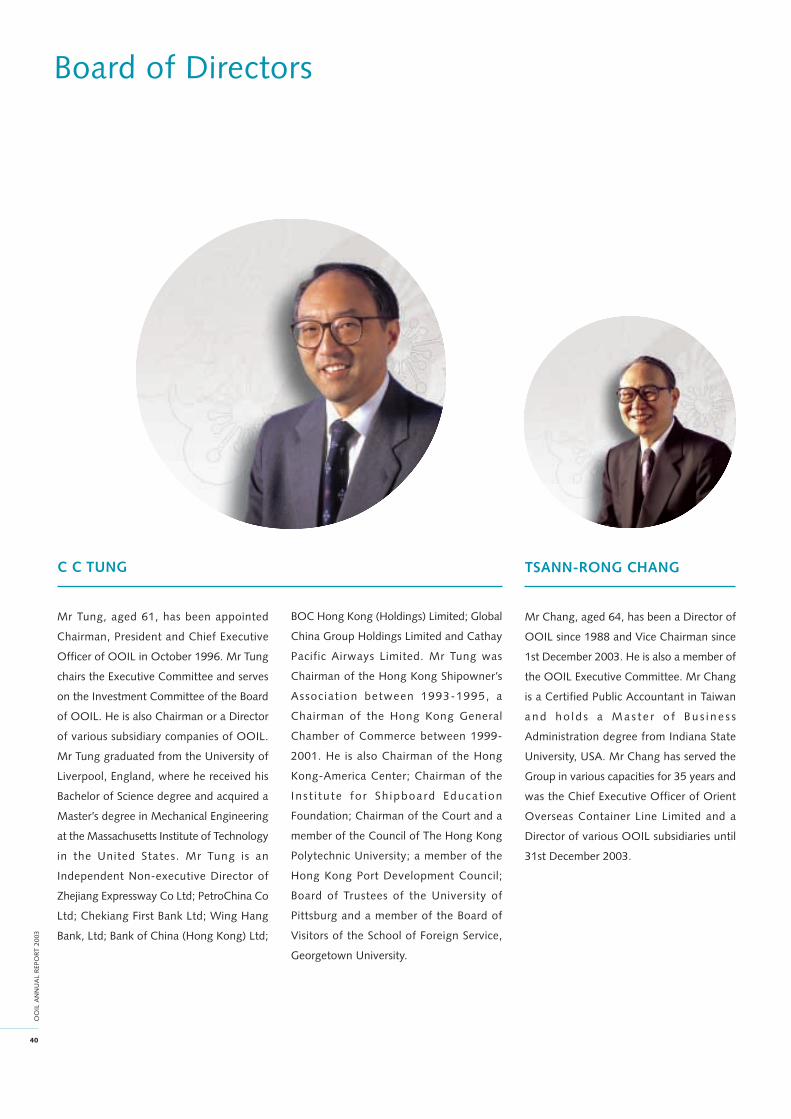
40
OO
IL A
NN
UA
L R
EPO
RT 2
003
Board of Directors
C C TUNG
Mr Tung, aged 61, has been appointed
Chairman, President and Chief Executive
Officer of OOIL in October 1996. Mr Tung
chairs the Executive Committee and serves
on the Investment Committee of the Board
of OOIL. He is also Chairman or a Director
of various subsidiary companies of OOIL.
Mr Tung graduated from the University of
Liverpool, England, where he received his
Bachelor of Science degree and acquired a
Master’s degree in Mechanical Engineering
at the Massachusetts Institute of Technology
in the United States. Mr Tung is an
Independent Non-executive Director of
Zhejiang Expressway Co Ltd; PetroChina Co
Ltd; Chekiang First Bank Ltd; Wing Hang
Bank, Ltd; Bank of China (Hong Kong) Ltd;
TSANN-RONG CHANG
Mr Chang, aged 64, has been a Director of
OOIL since 1988 and Vice Chairman since
1st December 2003. He is also a member of
the OOIL Executive Committee. Mr Chang
is a Certified Public Accountant in Taiwan
a n d h o l d s a M a s t e r o f B u s i n e s s
Administration degree from Indiana State
University, USA. Mr Chang has served the
Group in various capacities for 35 years and
was the Chief Executive Officer of Orient
Overseas Container Line Limited and a
Director of various OOIL subsidiaries until
31st December 2003.
BOC Hong Kong (Holdings) Limited; Global
China Group Holdings Limited and Cathay
Pacific Airways Limited. Mr Tung was
Chairman of the Hong Kong Shipowner’s
Associat ion between 1993-1995, a
Chairman of the Hong Kong General
Chamber of Commerce between 1999-
2001. He is also Chairman of the Hong
Kong-America Center; Chairman of the
Ins t i tu te fo r Sh ipboard Educat ion
Foundation; Chairman of the Court and a
member of the Council of The Hong Kong
Polytechnic University; a member of the
Hong Kong Port Development Council;
Board of Trustees of the University of
Pittsburg and a member of the Board of
Visitors of the School of Foreign Service,
Georgetown University.
41
OO
IL A
NN
UA
L R
EPO
R T 2
003
ROGER KING
NICHOLAS D SIMS
Mr Sims, aged 50, has been a Director and
the Chief Financial Officer of OOIL since
October 2000. He serves on the OOIL
Execut ive Commit tee , the F inance
Committee, the Investment Committee, the
Audit Committee, the Share Committee and
the Bridge Financing Committee of the
Board of OOIL and is a Director of various
subsidiary companies of OOIL. Mr Sims was
previously Managing Director of Wayfoong
Shipping Services, a member of HSBC Group
responsible for ship finance business
throughout the Asia Pacific region. Mr Sims
joined HSBC in 1973 and served the
international banking group in Hong Kong
and London.
ROBERT H SUAN
Mr Suan, aged 64, has been a Director of
OOIL since May 1997. He is a member of
OOIL Finance Committee, Share Committee
and Bridge Financing Committee. Mr Suan
is the Managing Director of Orient Overseas
Developments Ltd, a whol ly-owned
subsidiary of OOIL, which is the holding
company for the Group’s China investments
and the investment property Wall Street
Plaza in New York City. Mr Suan has been
with the Group for 34 years, has held various
positions involving US investments and real
estate. He holds a Ph.D. in civil engineering
from the University of London. Mr Suan is
married to a cousin of Mr C C Tung.
Mr King, aged 63, was Managing Director
and Chief Operating Officer of Orient
Overseas (Holdings) Limited (“OOHL”) for
the period September 1985 to January 1987
and a Director from 1983 until 1992. He
has been a Director of OOIL since 1992 and
is also a Director of an associated company.
He became a Non-executive Director of
OOIL in August 1999. Mr King is a graduate
of the University of Michigan, New York
University and Harvard Business School.
Prior to joining OOHL in 1974 he served in
the United States Navy and worked in
computer research and management
consultancy at Bell Telephone Laboratorie.
Mr King is a Director of a number of other
companies, including Arrow Electronics
Corporation, a company listed on the New
York Stock Exchange and a Non-executive
Director of World Metal Holdings Limited,
a listed company in Hong Kong. He is also
the former Executive Chairman of System-
pro Computers Limited, one of the largest
personal computer retailers in Hong Kong
and the former President and CEO of Sa Sa
International Holdings Limited, a company
listed on The Stock Exchange of Hong Kong
Ltd. Mr King also serves on a number of
advisory committees, including the Hong
Kong Management Association, the Hong
Kong University of Science and Technology
and the Zhejiang Province People’s Political
Consultative Conference. Mr King is the
brother-in-law of Mr C C Tung.

42
OO
IL A
NN
UA
L R
EPO
RT 2
003
Board of Directors
SIMON MURRAY
Mr Murray, CBE, aged 63, has been a Non-
executive Director of OOIL since 1992 and
was from 1989 until 1992 a Non-executive
Director of OOHL. He serves on the
Investment Committee and the Audit
Committee of OOIL. He is currently the
C h a i r m a n o f G e n e r a l E n t e r p r i s e
Management Services Limited, a private
equity fund management company
sponsored by Simon Murray And Associates.
He is also a Director of a number of public
companies, including Hutchison Whampoa
Limited and Cheung Kong Holdings Limited.
Mr Murray is a member of the Former
Directors Committee of the Community
Chest of Hong Kong and has been involved
i n a n u m b e r o f o t h e r c h a r i t a b l e
organisations, including Save The Children
Fund and The China Coast Community
Association.
PHILIP CHOW
Mr Chow, aged 56, has been a Director of
OOIL since December 2003. He is a member
of the Executive Committee, the Finance
Committee, the Share Committee and the
Bridge Financing Committee and a Director
of various subsidiary companies of OOIL.
Mr Chow holds a Bachelor of Science degree
in chemistry and physics from the University
of Hong Kong and a Master of Business
Administration degree from the Chinese
University of Hong Kong. He has served the
Group in various capacities for 27 years and
is the Chief Executive Officer of OOCLL.
DR VICTOR K FUNG
Dr Fung, aged 58, has been a Non-executive
Director of OOIL since July 1996. He is
Chairman of the Audit Committee of OOIL.
Dr Fung is Chairman of the Li & Fung Group,
the Hong Kong Airport Authority, the Hong
Kong University Council and the Greater
Pearl River Delta Business Council. He was
appointed by Government to serve as the
Hong Kong Representative on the APEC
Business Advisory Council from 1996 to
2003. From 1991 to 2000, he was Chairman
of the Hong Kong Trade Development
Council. Dr Fung is also active on a number
of Government advisory boards including the
Jud ic ia l Off i ce r s Recommendat ion
Commission. Dr Fung holds a Bachelor of
Science and a Master of Science degree in
electrical engineering from the Massachusetts
Institute of Technology and a Doctorate in
Business Economics from Harvard University.
In 2003, the Government of the Hong Kong
Special Administrative Region awarded Dr
Fung the Gold Bauhinia Star for distinguished
service to the community.

43
OO
IL A
NN
UA
L R
EPO
R T 2
003
PROF RICHARD WONG
Professor Wong, aged 51, has been a Non-
executive Director of OOIL since December
2003. He serves on the Investment
Committee and the Audit Committee of
OOIL. He graduated from University of
Chicago with Bachelor’s, Master’s and Ph.D.
degrees in Economics and is Dean of the
Faculty of Business and Economics and Chair
of Economics at The University of Hong
Kong. He has been active in advancing
economic research on policy issues in Hong
Kong and China. He was awarded the Silver
Bauhinia Star in 1999 by the Government
of the Hong Kong Special Administrative
Region for his contributions to education,
hous ing , indus t ry and techno logy
development. He was appointed a Justice
of the Peace in July 2000.


46
OO
IL A
NN
UA
L R
EPO
RT 2
003
Financial Calendar
Announcement of results for the half year
ended 30th June 2003 20th August 2003
Despatch of 2003 Interim Report to shareholders 8th September 2003
Announcement of results for the year ended
31st December 2003 19th March 2004
Despatch of 2003 Annual Report to shareholders 2nd April 2004
Closure of the Register of Members to determine 20th April 2004
entitlements to a final dividend and Bonus Shares for ordinary shareholders to 27th April 2004
in respect of the year ended 31st December 2003 both days inclusive
2003 Annual General Meeting 27th April 2004
Payment of 2003 final ordinary dividend together with the Bonus Shares 11th May 2004
47
OO
IL A
NN
UA
L R
EPO
R T 2
003
Shareholder Information
Ordinary Shares:
Issued shares 470,184,544 shares (as at 31st December 2003)
517,184,544 shares (as at 19th March 2004)
Nominal value US$0.10
Annual Report
This annual report is available in both English and Chinese.
Shareholders can obtain copies by writing to:
Computershare Hong Kong Investor Services Limited
Rooms 1901-1905, 19th Floor, Hopewell Centre,
183 Queen’s Road East, Wanchai, Hong Kong
If you are not a shareholder, please write to:
OOCL (Corporate Services) Limited,
33rd Floor, Harbour Centre,
25 Harbour Road,
Wanchai, Hong Kong
Attn: Company Secretary
Our annual report and accounts are also available online at our corporate website at http://www.ooilgroup.com.
Shareholder Services
Any matters relating to your shareholding, such as transfer of shares, change of name or address, and loss of share certificates should be
addressed in writing to the Company’s Branch Registrar:
Computershare Hong Kong Investor Services Limited
Rooms 1901-1905, 19th Floor, Hopewell Centre,
183 Queen’s Road East, Wanchai, Hong Kong
Telephone (852) 2862 8628 Facsimile: (852) 2529 6087
Shareholder Enquiries
Our enquiry hotline is operational during normal office hours:
Telephone: (852) 2833 3888 Facsimile: (852) 2531 8147
48
OO
IL A
NN
UA
L R
EPO
RT 2
003
Shareholder Information
Ordinary Shareholder Information at 31st December 2003:
Shareholders Shares of US$0.10 each
Category Number Percentage Number Percentage
Corporate 39 3.68% 454,830,213 96.74%
Untraceable shareholders registered in name of
Computershare Hong Kong Investor Services Limited 1 0.09% 345,093 0.07%
Individual 1,019 96.23% 15,009,238 3.19%
1,059 100.00% 470,184,544 100.00%
Shareholders Shares of US$0.10 each
Number of Shares Held Number Percentage Number Percentage
1 - 2,000 883 83.38% 354,344 0.07%
2,001 - 5,000 73 6.89% 224,552 0.05%
5,001 - 10,000 36 3.40% 261,425 0.06%
10,001 - 20,000 23 2.17% 369,404 0.08%
20,001 - 100,000 24 2.27% 1,053,768 0.22%
100,001 - 200,000 4 0.38% 604,114 0.13%
200,001 - 500,000 1 0.09% 345,093 0.07%
500,001 - 1,000,000 5 0.47% 2,699,821 0.57%
1,000,001 - 2,000,000 2 0.19% 2,202,407 0.47%
5,000,001 - 10,000,000 2 0.19% 16,832,427 3.58%
10,000,001 or above 6 0.57% 445,237,189 94.70%
1,059 100.00% 470,184,544 100.00%
Ten Largest Ordinary Shareholders
At 31st December 2003 the interests of the 10 largest ordinary shareholders of the Company, as recorded in the Company’s principal
register and Hong Kong branch register of members, were as follows:
Number of ordinary
Name of ordinary shareholder shares held Percentage
Wharncliff Limited 138,215,662 29.40%
Bank of China (Hong Kong) Nominees Limited 130,943,246 27.85%
HKSCC Nominees Limited 95,242,733 20.26%
Springfield Corporation 55,409,576 11.78%
Monterrey Limited 25,425,972 5.41%
Leung Hok Pang 8,803,291 1.87%
HSBC Nominees (Hong Kong) Limited 8,029,136 1.71%
Chin Yiu Tong 1,180,000 0.25%
Mok Kwun Cheung 1,022,407 0.22%
The First National Bank of Boston 612,505 0.13%
49
OO
IL A
NN
UA
L R
EPO
R T 2
003
Corporate Governance
Code of Best Practice
The Board is supportive of high standards of corporate governance. The Group has complied throughout the financial year with the Code of
Best Practice issued by The Stock Exchange of Hong Kong Limited, with the exception that the Independent Non-executive Directors have
not been appointed for a specific term and are subject to retirement by rotation and re-election at the Annual General Meeting of the
Company in accordance with the provisions of the Company’s Bye-laws. The Board, in addition, acknowledges its responsibility for the
Group’s systems of internal control and has pursued this responsibility through formalised Group financial and legal procedures, the Group’s
Internal Audit Department and the Audit Committee.
The Board
The Board currently comprises nine Directors of which three are Independent Non-executive Directors and one is a Non-executive Director.
The Board meets at least four times each year and has a formal schedule of matters referred to it for consideration and decision. This includes
the approval of strategy recommendations and budgets as well as significant operational and financial management matters. Full minutes of
Board meetings are kept by the Company Secretary and are available for inspection, at any time during office hours, on reasonable notice,
by any Director. Any Director may, in furtherance of his duties, take independent professional advice where necessary and at the expense of
the Company. All Directors have access to the Chief Financial Officer and the Company Secretary, whose appointments and removal are
matters for the Board as a whole. The Chief Financial Officer and the Company Secretary are responsible to the Board for ensuring that
agreed procedures, rules and regulations, as applicable, are observed.
The Audit Committee
The Audit Committee is comprised of Dr Victor Fung (Chairman), Mr Simon Murray and Prof Richard Wong, Independent Non-executive
Directors, and the Chief Financial Officer with the head of the Internal Audit Department as the secretary and the Company Secretary as the
assistant secretary of the Committee. The Committee meets not less than twice a year to review the completeness, accuracy and fairness of
the half-year and the annual financial statements before submission to the Board, to consider the nature and scope of internal audit
programmes and audit reviews and to review the effectiveness of the financial reporting process and internal control system of the Company.
The external auditors, the Group Financial Controller and the General Manager - Finance of OOCLL attend the Committee meetings at the
invitation of the Committee.
Internal Control
The Group has an established internal financial control framework which is documented in the form of Group financial and legal procedures,
compliance with which is mandatory. Actual operational results are reported against budget each month. Detailed forecasts for the year and
long-term forecasts of profit and loss, cash flow and balance sheet are regularly reviewed and updated. There are also clearly defined
procedures for the control of capital and major expenditure commitments and off balance sheet financial instruments, and the supervision,
control and review of the investment portfolio. The Group has appointed a Compliance Officer to monitor connected transactions.
Going Concern
After making due enquiries the Directors have a reasonable expectation that the Group has adequate resources to continue its operational
existence for the foreseeable future. For this reason, they continue to adopt the going concern basis in preparing the accounts.

50
OO
IL A
NN
UA
L R
EPO
RT 2
003
Notice of Annual General Meeting
NOTICE is hereby given that the Eighteenth Annual General Meeting of ORIENT OVERSEAS (INTERNATIONAL) LIMITED (the “Company”)
will be held at the Concord Room, 8th Floor, Renaissance Harbour View Hotel, 1 Harbour Road, Wanchai, Hong Kong on 27th April 2004
at 10:00 a.m. for the following purposes:
1. To consider and adopt the audited Statement of Accounts and the Reports of the Directors and the Auditors for the year ended 31st
December 2003;
2. To declare the payment of a final dividend for the year ended 31st December 2003;
3. To consider and, if thought fit, pass, with or without modification, the following resolutions as an Ordinary Resolution:
ORDINARY RESOLUTION
“THAT conditional upon the Listing Committee of The Stock Exchange of Hong Kong Limited granting listing of and permission to
deal in the new shares of US$0.10 each (individually a “Bonus Share” and collectively the “Bonus Shares”) in the capital of the
Company to be issued:
(a) to capitalise such amount necessary to give effect to the issue of the Bonus Shares that is for the time being standing to the credit
of the share premium account of the Company and the Directors be and are hereby authorised to apply such sum in paying up
in full at par (US$0.10) such number of Bonus Shares to be allotted and issued as fully paid to the shareholders of the Company
on the basis of one (1) Bonus Share for every ten (10) issued ordinary shares of US$0.10 each held by such shareholders whose
names appear on the Register of Members of the Company at the close of business on 27th April 2004 and to allot and issue such
Bonus Shares;
(b) the Bonus Shares to be issued shall rank pari passu in all respects with the existing issued shares of the Company as at the date of
issue of such Bonus Shares;
(c) no fractional Bonus Shares (if any) shall be allotted to the shareholders of the Company and fractional entitlements will be
rounded down to the nearest whole number and sold for the benefit of the Company; and
(d) the Directors be and are hereby authorised to do all acts and things as may be necessary and expedient in connection with the
issue of Bonus Shares.”;
4. To re-elect Directors and authorise the Board of Directors to fix their remuneration;
5. To re-appoint PricewaterhouseCoopers as Auditors and to authorise the Board of Directors to fix their remuneration; and
51
OO
IL A
NN
UA
L R
EPO
R T 2
003
6. To consider and, if thought fit, pass, with or without modification, the following resolutions as Ordinary Resolutions:-
ORDINARY RESOLUTIONS
(a) “THAT a general mandate be and is hereby generally and unconditionally given to the Directors to exercise during the Relevant
Period (as hereinafter defined) all the powers of the Company to allot, issue and otherwise deal with Shares (as hereinafter
defined) or additional Shares of the Company and to make, issue or grant offers, agreements, options or warrants which will or
might require the exercise of such mandate either during or after the Relevant Period, otherwise than pursuant to a rights issue,
bonus issue, issue of scrip dividends or the exercise of rights of subscription or conversion under the terms of any shares, bonds,
warrants or other securities carrying a right to subscribe for or purchase shares of the Company issued by the Company or a
subsidiary or whose issue is authorised on or prior to the date this resolution is passed, not exceeding twenty per cent. of the
aggregate nominal amount of the share capital of the Company in issue as at the date of passing of this resolution.”
(b) “THAT a general mandate be and is hereby generally and unconditionally given to the Directors to exercise during the Relevant
Period (as hereinafter defined) all the powers of the Company to purchase shares of all classes in the capital of the Company,
securities convertible into shares and options, warrants or similar rights to subscribe for or purchase any shares or such convertible
securities, provided however that the aggregate nominal amount of such shares, or (as the case may be) conversion, subscription
or purchase rights attaching to the respective security, to be purchased shall not exceed ten per cent. of the aggregate nominal
amount of such shares, or (as the case may be) conversion, subscription or purchase rights attaching to that security, in issue as
at the date of passing of this resolution.”
For the purposes of resolutions 6(a) and 6(b):
“Relevant Period” means the period from the passing of this resolution until whichever is the earlier of:
(i) the conclusion of the next Annual General Meeting of the Company;
(ii) the expiration of the period within which the next Annual General Meeting of the Company is required by Bermudan law or the
Bye-laws of the Company to be held; or
(iii) the date on which the authority set out in this resolution is revoked or varied by an ordinary resolution of the shareholders in
general meeting.
“Shares” means shares of all classes in the capital of the Company and securities convertible into shares and options, warrants or
similar rights to subscribe for or purchase any shares or such convertible securities.
(c) “THAT the general mandate granted to the Directors to allot Shares pursuant to the resolution set out in item 6(a) of the Notice
of this meeting be and is hereby extended by the addition thereto of an amount representing the aggregate nominal amount of
the share capital of the Company purchased, or that share capital which would fall to be subscribed or purchased pursuant to the
conversion, subscription or purchase rights attaching to any other securities purchased, by the Company pursuant to the authority
granted by the resolution set out in item 6(b) of the Notice of this meeting, provided that such amount shall not exceed ten per
cent. of the aggregate nominal amount of the shares, or (as the case may be) conversion, subscription or purchase rights attaching
to that security, in issue as at the date of passing of this resolution.”
52
OO
IL A
NN
UA
L R
EPO
RT 2
003
Notice of Annual General Meeting
7. To consider and, if thought fit, pass, with or without modification, the following resolution as a Special Resolution:-
SPECIAL RESOLUTION
“THAT the existing bye-laws of the Company be and are hereby amended in the following manner:
(a) by adding the following definition in Bye-law 1 immediately after the definition of “Act”
““associate” the meaning attributed to it in the rules of the Designated Stock Exchange.”;
(b) by deleting the existing Bye-law 2(e) in its entirety and substituting therefor the following:
“2(e) expressions referring to writing shall, unless the contrary intention appears, be construed as including printing, lithography,
photography and other modes of representing words or figures in a visible form, and including where the representation
takes the form of electronic display, provided that both the mode of service of the relevant document or notice and the
shareholder’s election comply with all applicable Statutes, rules and regulations;”;
(c) by adding the following new Bye-law 2(k):
“2(k) references to a document being executed include references to it being executed under hand or under seal or by
electronic signature or by any other method and references to a notice or document include a Notice or document
recorded or stored in any digital, electronic, electrical, magnetic or other retrievable form or medium and information in
visible form whether having physical substance or not.”;
(d) by deleting the existing Bye-law 51 in its entirety and substituting therefor the following:
“51. The registration of transfers of shares or of any class of shares may, after notice has been given by advertisement in an
appointed newspaper and, where applicable, any other newspapers in accordance with the requirements of any Designated
Stock Exchange or by any means in such manner as may be accepted by the Designated Stock Exchange to that effect
be suspended at such times and for such periods (not exceeding in the whole thirty (30) days in any year) as the Board
may determine.”;
(e) by deleting the existing Bye-law 66 in its entirety and substituting therefor the following:
“66. Subject to any special rights or restrictions as to voting for the time being attached to any shares by or in accordance
with these Bye-laws, at any general meeting on a show of hands every Member present in person or by proxy or by
attorney or (being a corporation) is present by a representative duly authorised under Section 78 of the Act shall have
one vote and on a poll every Member present in person or by proxy shall have one vote for every fully paid share of
which he is the holder. A resolution put to the vote of a meeting shall be decided on a show of hands unless it is required
by the rules of the Designated Stock Exchange that such resolution shall be voted by way of poll or a poll is demanded
before or on the declaration of the result of the show of hands or on the withdrawal of any other demand for a poll:
(a) by the Chairman; or
53
OO
IL A
NN
UA
L R
EPO
R T 2
003
(b) by at least three Members present in person or by proxy for the time being entitled to vote at the meeting; or
(c) by a Member or Members present in person or by proxy and representing not less than one-tenth of the total
voting rights of all Members having the right to vote at the meeting; or
(d) by a Member or members present in person or by proxy and holding shares in the Company conferring a right to
vote at the meeting being shares on which an aggregate sum has been paid up equal to not less than one-tenth of
the total sum paid up on all shares conferring that right.
A demand by a person as proxy for a Member shall be deemed to be the same as a demand by the Member.
(f) by re-numbering existing Bye-law 76 as Bye-law 76(1) and adding the following new Bye-law 76(2) immediately thereafter:
“(2) Where any Member is, under the rules of the Designated Stock Exchange, required to abstain from voting on any
particular resolution or restricted to voting only for or only against any particular resolution, any votes cast by or on
behalf of such Member in contravention of such requirement or restriction shall not be counted.”;
(g) by deleting the word “special” in the second line in Bye-law 86(4) and substituting therefore the word “ordinary”;
(h) by deleting the existing Bye-law 89 in its entirety and substituting therefor the following:
“89. No person other than a Director retiring at the meeting shall, unless recommended by the Directors for election, be
eligible for election as a Director at any general meeting unless a notice in writing signed by a Member (other than the
person to be proposed) duly qualified to attend and vote at the meeting for which such notice is given of his intention
to propose such person for election and also a notice in writing signed by the person to be proposed of his willingness
to be elected shall have been lodged at the Office or the head office provided that the minimum length of the period,
during which such notice(s) are given, shall be at least seven (7) days and that the period for lodgment of such notice(s)
shall commence no earlier than the day after the dispatch of the notice of the general meeting appointed for such
election and end no later than seven (7) days prior to the date of such general meeting.”;
(i) by deleting the existing Bye-law 104 in its entirety and substituting therefor the following:
“104.(1) A Director shall not vote (nor be counted in the quorum) on any resolution of the Board approving of any contract or
arrangement or any other proposal in which he or any of his associates is materially interested, but this prohibition shall
not apply to any of the following matters namely:
(a) any contract or arrangement for the giving to such Director or his associate(s) any security or indemnity in respect
of money lent by him or any of his associates or obligations incurred or undertaken by him or any of his associates
at the request of or for the benefit of the Company or any of its subsidiaries;
(b) any contract or arrangement for the giving of any security or indemnity to a third party in respect of a debt or
obligation of the Company or any of its subsidiaries for which the Director or his associate(s) has himself/themselves
assumed responsibility in whole or in part whether alone or jointly under a guarantee or indemnity or by the giving
of security;
54
OO
IL A
NN
UA
L R
EPO
RT 2
003
Notice of Annual General Meeting
(c) any contract or arrangement concerning an offer of shares or debentures or other securities of or by the Company
or any other company which the Company may promote or be interested in for subscription or purchase, where
the Director or his associate(s) is/are or is/are to be interested as a participant in the underwriting or sub-underwriting
of the offer;
(d) any contract or arrangement in which the Director or his associate(s) is/are interested in the same manner as other
holders of shares or debentures or other securities of the Company by virtue only of his/their interest in shares or
debentures or other securities of the Company;
(e) any contract or arrangement concerning any other company in which the Director or his associate(s) is/are interested
only, whether directly or indirectly, as an officer or executive or a shareholder other than a company in which the
Director and his associate(s) are beneficially interested in five (5) per cent. or more of the issued shares or of the
voting rights of any class of shares of such company (or any third company through which his interest or that of
any of his associates is derived); or
(f) any proposal concerning the benefit of employees of the Company or its subsidiaries, including the adoption,
modification or operation of (i) any employee’s share scheme or any share incentive or share option scheme under
which the Director or his associate(s) may benefit; or (ii) a pension fund or retirement, death or disability benefits
scheme or other arrangement which relates both to Directors, his associates and employees of the Company or of
any of its subsidiaries and does not provide in respect of any Director, or his associate(s), as such any privilege or
advantage not accorded to the employees to which such scheme or fund relates.
(2) A company shall be deemed to be a company in which a Director and/or his associate(s) owns five (5) per cent. or more if
and so long as (but only if and so long as) he and/or his associates, (either directly or indirectly) are the holders of or
beneficially interested in five (5) per cent. or more of any class of the equity share capital of such company or of the voting
rights available to members of such company (or of any third company through which his/their interest or that of any of his
associates is derived). For the purpose of this paragraph there shall be disregarded any shares held by a Director or his
associate(s) as bare or custodian trustee and in which he or any of them has no beneficial interest, any shares comprised in
a trust in which the interest of the Director or his associate(s) is/are in reversion or remainder if and so long as some other
person is entitled to receive the income thereof, and any shares comprised in an authorised unit trust scheme in which the
Director or his associate(s) is/are interested only as a unit holder.
(3) Where a company in which a Director and/or his associate(s) holds five (5) per cent. or more is/are materially interested in
a transaction, then that Director and/or his associate(s) shall also be deemed materially interested in such transaction.
(4) If any question shall arise at any meeting of the Board as to the materiality of the interest of a Director (other than the
chairman of the meeting) or his associate(s) or as to the entitlement of any Director (other than such chairman) to vote and
such question is not resolved by his voluntarily agreeing to abstain from voting, such question shall be referred to the
chairman of the meeting and his ruling in relation to such other Director shall be final and conclusive except in a case where
the nature or extent of the interest of the Director and/or his associate(s) concerned as known to such Director has not been
fairly disclosed to the Board. If any question as aforesaid shall arise in respect of the chairman of the meeting such question
shall be decided by a resolution of the Board (for which purpose such chairman shall not vote thereon) and such resolution
shall be final and conclusive except in a case where the nature or extent of the interest of such chairman as known to such
chairman has not been fairly disclosed to the Board.”;

55
OO
IL A
NN
UA
L R
EPO
R T 2
003
(j) By deleting the existing Bye-law 160 in its entirety and substituting therefor the following:
“160. Any notice or document (including any “corporate communication” within the meaning ascribed thereto under the
rules of the Designated Stock Exchange), whether or not to be given or issued under these Bye-laws, from the Company
to a Member shall be in writing or by cable, telex or facsimile transmission message or other form of electronic transmission
or communication and any such notice and document may be served or delivered by the Company on or to any
Member either personally or by sending it through the post in a prepaid envelope addressed to such Member at his
registered address as appearing in the Register or at any other address supplied by him to the Company for the purpose
or, as the case may be, by transmitting it to any such address or transmitting it to any telex or facsimile transmission
number or electronic number or address supplied by him to the Company for the giving of notice or document to him
or which the person transmitting the notice or document reasonably and bona fide believes at the relevant time will
result in the notice or document being duly received by the Member or may also be served by advertisement in appointed
newspapers (as defined in the Act) or in newspapers published daily and circulating generally in the territory of and in
accordance with the requirements of the Designated Stock Exchange or, to the extent permitted by the applicable laws,
by placing it on the Company’s website and giving to the member a notice stating that the notice or document is
available there (a “notice of availability”). The notice of availability may be given to the Member by any of the means
set out above. In the case of joint holders of a share all notices or documents shall be given to that one of the joint
holders whose name stands first in the Register and notice or document so given shall be deemed a sufficient service on
or delivery to all the joint holders.”;
(k) By renumbering the existing Bye-law 161(b) as a new Bye-law 161(c) and by inserting the following new Bye-law 161(b):
“161(b) if sent by electronic communication, shall be deemed to be given on the day on which it is transmitted from the server
of the Company or its agent. A notice or document placed on the Company’s website is deemed given by the Company
to a Member on the day following that on which a notice of availability is deemed served on the Member;”;
(l) By substituting for the full stop “.” appearing at the end of the new Bye-law 161(c) with a semi-colon “;” and inserting the word
“and” after the semi-colon “;”;
(m) By adding the following new Bye-law 161(d):
“161(d) may be given to a Member either in the English language or the Chinese language, subject to due compliance with all
applicable Statutes, rules and regulations.”; and
(n) By inserting, in Bye-law 163, after the words “a cable or telex or facsimile”, the following words:
“or electronic”.
By Order of the Board
Lammy Lee
Secretary
Hong Kong, 19th March 2004

56
OO
IL A
NN
UA
L R
EPO
RT 2
003
Notice of Annual General Meeting
Notes:
(i) Any member of the Company entitled to attend and vote at the meeting is entitled to appoint a proxy or proxies to attend and vote on his behalf in accordance
with the Bye-laws of the Company. A proxy need not be a member of the Company.
(ii) A proxy form is enclosed and to be valid, the proxy form must be deposited at the principal place of business of the Company in Hong Kong, 33rd Floor, Harbour
Centre, 25 Harbour Road, Wanchai, Hong Kong together with the power of attorney or other authority (if any) under which it is signed (or a certified copy
thereof) as soon as possible but in any event not less than 48 hours before the time appointed for holding the above meeting or any adjournment thereof.
(iii) The Register of Members of the Company will be closed from 20th April 2004 to 27th April 2004, both days inclusive, during which period no transfer of shares
can be registered.
(iv) An explanatory statement containing further details regarding Ordinary Resolutions no. 3, 6(a), 6(b) and 6(c) will be dispatched to the members of the Company
together with the Annual Report of the Company for the year ended 31 December 2003.
(v) Special Resolution no.7 to amend the Bye-laws of the Company for the purposes of, amongst other things, complying with the recent amendments to Appendix
3 to the Rules Governing the Listing of Securities on The Stock Exchange of Hong Kong Limited and generally extending the mode of communication with the
members of the Company.
(vi) The translation into Chinese language of this notice (including the Special Resolution which contains the proposed new Bye-laws) is for reference only. In case of
any inconsistency, the English version shall prevail.

57
OO
IL A
NN
UA
L R
EPO
R T 2
003
Report of the Directors
The Directors present their report together with the audited Accounts of the Company for the year ended 31st December 2003.
Principal Activities
The principal activity of the Company is investment holding and the activities of its principal subsidiaries and jointly controlled entities are
shown on pages 114 to 123.
Group Results
The consolidated results of the Company and its subsidiaries (collectively referred to as the “Group”) are shown on page 65.
Dividends
The Directors have recommended a dividend for the year ended 31st December 2003 of US12.8 cents (HK$1) per ordinary share to be paid
on 11th May 2004 to the shareholders of the Company whose names appear on the Register of Members of the Company on 27th April
2004. Shareholders who wish to receive dividend in US Dollars should complete the US Dollars Election Form and return it to the Branch
Registrar on or before 4th May 2004.
Proposed Bonus Issue
The Directors have recommended a bonus share issue (the “Proposed Bonus Issue”) of new shares (individually a “Bonus Share” and
collectively the “Bonus Shares”) to the shareholders of the Company on the basis of one (1) Bonus Share of US$0.10 for every ten (10)
issued ordinary shares held by such shareholders whose names appear on the Register of Members of the Company on 27th April 2004. The
Bonus Shares will be fully paid at par and will rank pari passu with the existing issued ordinary shares of the Company in all respects from the
date of issue, except that they will not rank for the recommended final dividend or the Proposed Bonus Issue. The Proposed Bonus Issue is
conditional upon
(i) an ordinary resolution being passed to approve the Proposed Bonus Issue at the 2004 Annual General Meeting being duly passed; and
(ii) the listing of and permission to deal in the Bonus Shares being granted by the Listing Committee of The Stock Exchange of Hong Kong
Limited.
Application will be made to the Listing Committee of The Stock Exchange of Hong Kong Limited for listing of, and permission to deal in, the
Bonus Shares to be issued pursuant to the Proposed Bonus Issue after the ordinary resolution referred in (i) above has been duly passed at
the 2004 Annual General Meeting.
A circular setting out further details of the Proposed Bonus Issue will be despatched to shareholders as soon as practicable.
Change of Board Lot Size
The Directors have resolved to change the board lot size for trading the shares of the Company from 2,000 to 1,000. Further announcement
will be made by the Company setting out the time table, trading arrangement and other details of the change in the board lot size.
Directors
The Directors of the Company are shown on pages 40 to 43.
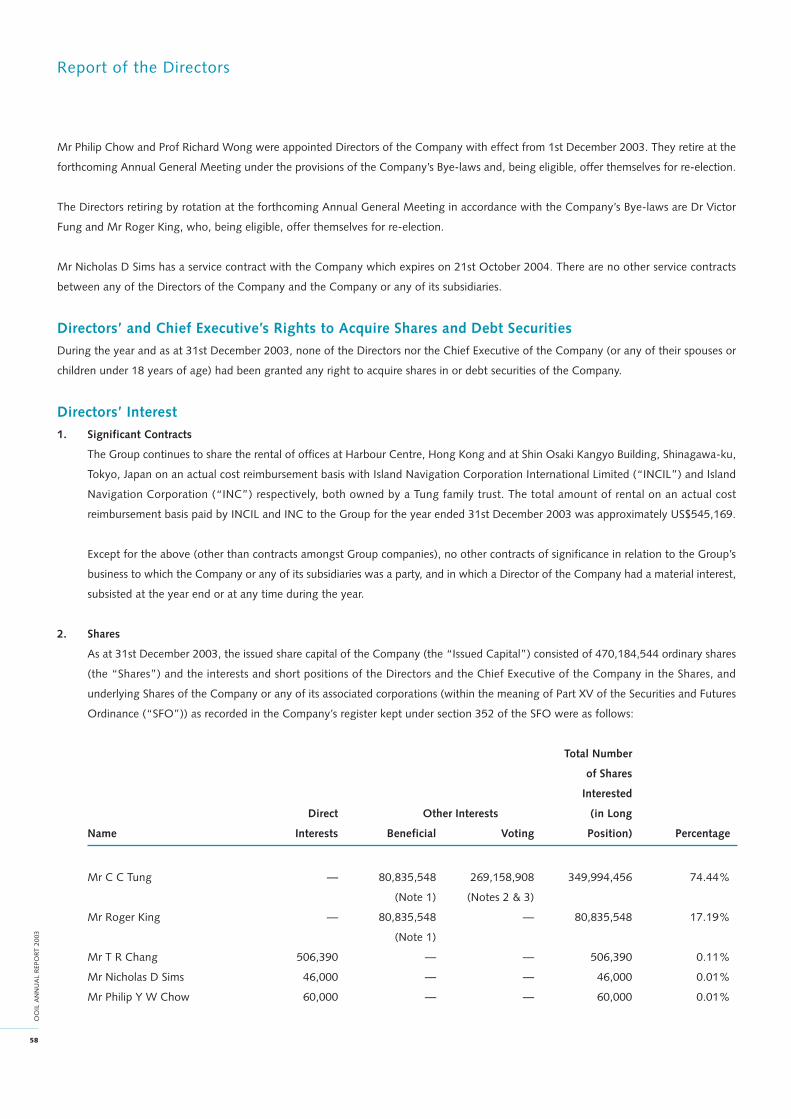
58
OO
IL A
NN
UA
L R
EPO
RT 2
003
Report of the Directors
Mr Philip Chow and Prof Richard Wong were appointed Directors of the Company with effect from 1st December 2003. They retire at the
forthcoming Annual General Meeting under the provisions of the Company’s Bye-laws and, being eligible, offer themselves for re-election.
The Directors retiring by rotation at the forthcoming Annual General Meeting in accordance with the Company’s Bye-laws are Dr Victor
Fung and Mr Roger King, who, being eligible, offer themselves for re-election.
Mr Nicholas D Sims has a service contract with the Company which expires on 21st October 2004. There are no other service contracts
between any of the Directors of the Company and the Company or any of its subsidiaries.
Directors’ and Chief Executive’s Rights to Acquire Shares and Debt Securities
During the year and as at 31st December 2003, none of the Directors nor the Chief Executive of the Company (or any of their spouses or
children under 18 years of age) had been granted any right to acquire shares in or debt securities of the Company.
Directors’ Interest
1. Significant Contracts
The Group continues to share the rental of offices at Harbour Centre, Hong Kong and at Shin Osaki Kangyo Building, Shinagawa-ku,
Tokyo, Japan on an actual cost reimbursement basis with Island Navigation Corporation International Limited (“INCIL”) and Island
Navigation Corporation (“INC”) respectively, both owned by a Tung family trust. The total amount of rental on an actual cost
reimbursement basis paid by INCIL and INC to the Group for the year ended 31st December 2003 was approximately US$545,169.
Except for the above (other than contracts amongst Group companies), no other contracts of significance in relation to the Group’s
business to which the Company or any of its subsidiaries was a party, and in which a Director of the Company had a material interest,
subsisted at the year end or at any time during the year.
2. Shares
As at 31st December 2003, the issued share capital of the Company (the “Issued Capital”) consisted of 470,184,544 ordinary shares
(the “Shares”) and the interests and short positions of the Directors and the Chief Executive of the Company in the Shares, and
underlying Shares of the Company or any of its associated corporations (within the meaning of Part XV of the Securities and Futures
Ordinance (“SFO”)) as recorded in the Company’s register kept under section 352 of the SFO were as follows:
Total Number
of Shares
Interested
Direct Other Interests (in Long
Name Interests Beneficial Voting Position) Percentage
Mr C C Tung — 80,835,548 269,158,908 349,994,456 74.44%
(Note 1) (Notes 2 & 3)
Mr Roger King — 80,835,548 — 80,835,548 17.19%
(Note 1)
Mr T R Chang 506,390 — — 506,390 0.11%
Mr Nicholas D Sims 46,000 — — 46,000 0.01%
Mr Philip Y W Chow 60,000 — — 60,000 0.01%
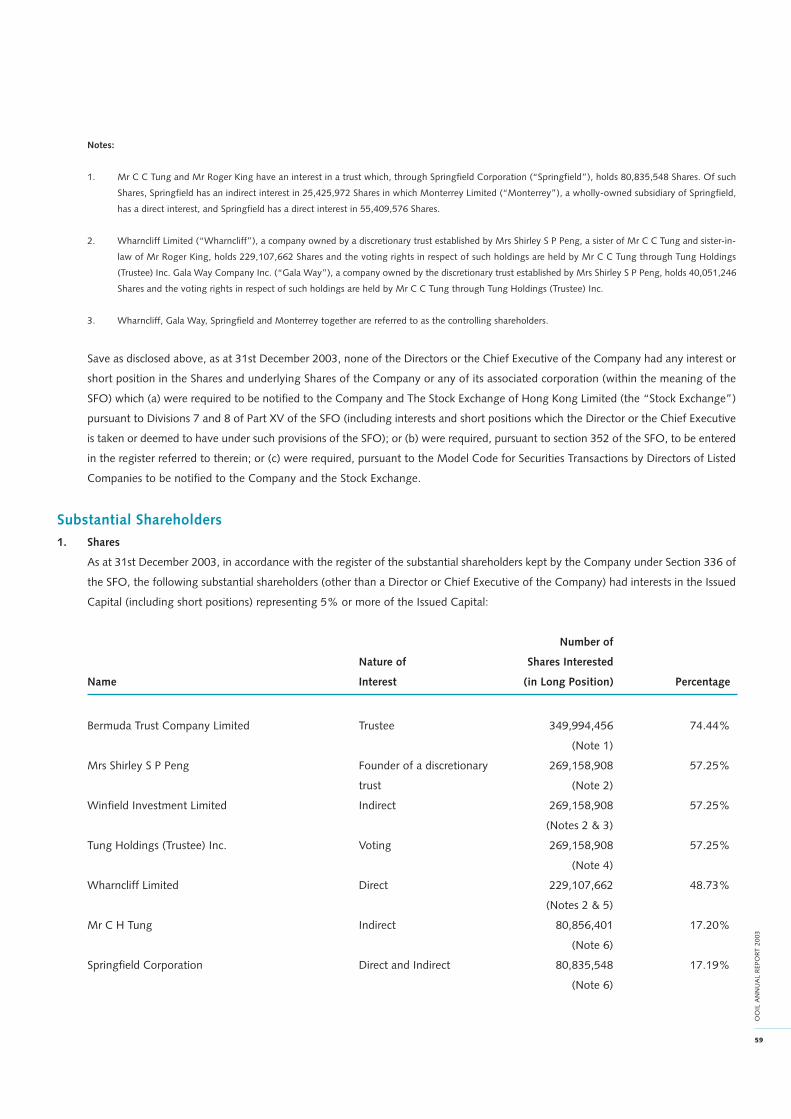
59
OO
IL A
NN
UA
L R
EPO
R T 2
003
Notes:
1. Mr C C Tung and Mr Roger King have an interest in a trust which, through Springfield Corporation (“Springfield”), holds 80,835,548 Shares. Of such
Shares, Springfield has an indirect interest in 25,425,972 Shares in which Monterrey Limited (“Monterrey”), a wholly-owned subsidiary of Springfield,
has a direct interest, and Springfield has a direct interest in 55,409,576 Shares.
2. Wharncliff Limited (“Wharncliff”), a company owned by a discretionary trust established by Mrs Shirley S P Peng, a sister of Mr C C Tung and sister-in-
law of Mr Roger King, holds 229,107,662 Shares and the voting rights in respect of such holdings are held by Mr C C Tung through Tung Holdings
(Trustee) Inc. Gala Way Company Inc. (“Gala Way”), a company owned by the discretionary trust established by Mrs Shirley S P Peng, holds 40,051,246
Shares and the voting rights in respect of such holdings are held by Mr C C Tung through Tung Holdings (Trustee) Inc.
3. Wharncliff, Gala Way, Springfield and Monterrey together are referred to as the controlling shareholders.
Save as disclosed above, as at 31st December 2003, none of the Directors or the Chief Executive of the Company had any interest or
short position in the Shares and underlying Shares of the Company or any of its associated corporation (within the meaning of the
SFO) which (a) were required to be notified to the Company and The Stock Exchange of Hong Kong Limited (the “Stock Exchange”)
pursuant to Divisions 7 and 8 of Part XV of the SFO (including interests and short positions which the Director or the Chief Executive
is taken or deemed to have under such provisions of the SFO); or (b) were required, pursuant to section 352 of the SFO, to be entered
in the register referred to therein; or (c) were required, pursuant to the Model Code for Securities Transactions by Directors of Listed
Companies to be notified to the Company and the Stock Exchange.
Substantial Shareholders
1. Shares
As at 31st December 2003, in accordance with the register of the substantial shareholders kept by the Company under Section 336 of
the SFO, the following substantial shareholders (other than a Director or Chief Executive of the Company) had interests in the Issued
Capital (including short positions) representing 5% or more of the Issued Capital:
Number of
Nature of Shares Interested
Name Interest (in Long Position) Percentage
Bermuda Trust Company Limited Trustee 349,994,456 74.44%
(Note 1)
Mrs Shirley S P Peng Founder of a discretionary 269,158,908 57.25%
trust (Note 2)
Winfield Investment Limited Indirect 269,158,908 57.25%
(Notes 2 & 3)
Tung Holdings (Trustee) Inc. Voting 269,158,908 57.25%
(Note 4)
Wharncliff Limited Direct 229,107,662 48.73%
(Notes 2 & 5)
Mr C H Tung Indirect 80,856,401 17.20%
(Note 6)
Springfield Corporation Direct and Indirect 80,835,548 17.19%
(Note 6)
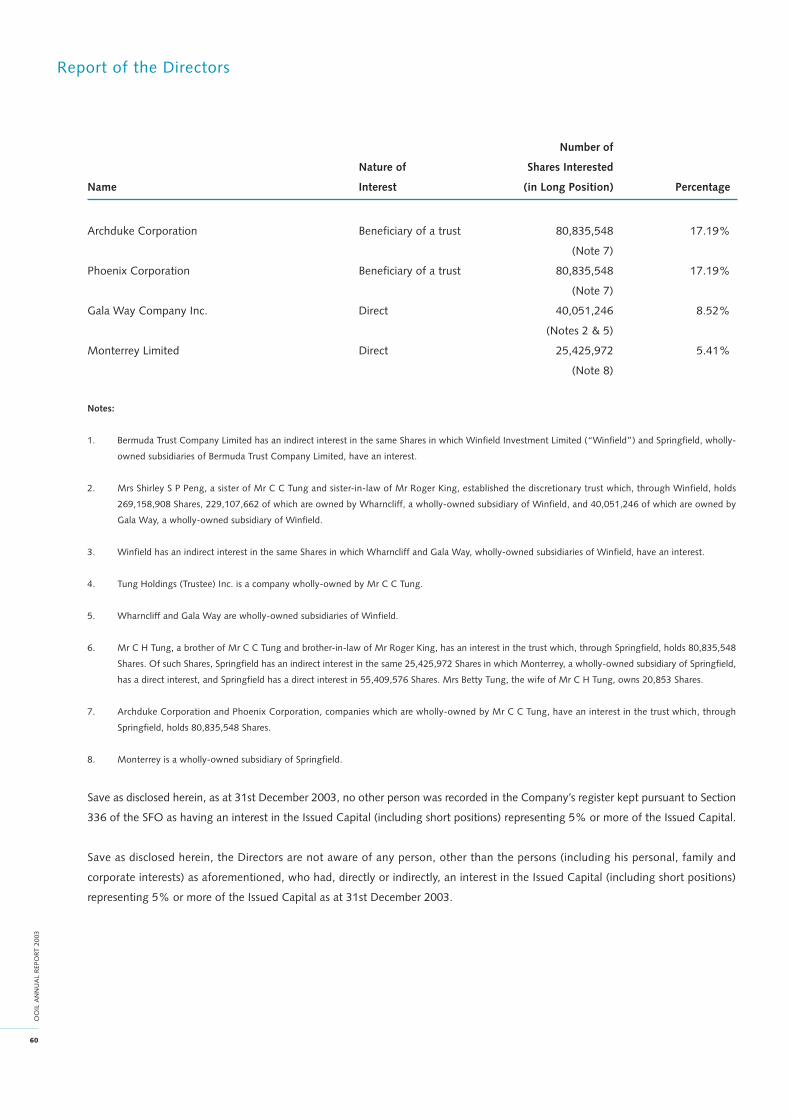
60
OO
IL A
NN
UA
L R
EPO
RT 2
003
Report of the Directors
Number of
Nature of Shares Interested
Name Interest (in Long Position) Percentage
Archduke Corporation Beneficiary of a trust 80,835,548 17.19%
(Note 7)
Phoenix Corporation Beneficiary of a trust 80,835,548 17.19%
(Note 7)
Gala Way Company Inc. Direct 40,051,246 8.52%
(Notes 2 & 5)
Monterrey Limited Direct 25,425,972 5.41%
(Note 8)
Notes:
1. Bermuda Trust Company Limited has an indirect interest in the same Shares in which Winfield Investment Limited (“Winfield”) and Springfield, wholly-
owned subsidiaries of Bermuda Trust Company Limited, have an interest.
2. Mrs Shirley S P Peng, a sister of Mr C C Tung and sister-in-law of Mr Roger King, established the discretionary trust which, through Winfield, holds
269,158,908 Shares, 229,107,662 of which are owned by Wharncliff, a wholly-owned subsidiary of Winfield, and 40,051,246 of which are owned by
Gala Way, a wholly-owned subsidiary of Winfield.
3. Winfield has an indirect interest in the same Shares in which Wharncliff and Gala Way, wholly-owned subsidiaries of Winfield, have an interest.
4. Tung Holdings (Trustee) Inc. is a company wholly-owned by Mr C C Tung.
5. Wharncliff and Gala Way are wholly-owned subsidiaries of Winfield.
6. Mr C H Tung, a brother of Mr C C Tung and brother-in-law of Mr Roger King, has an interest in the trust which, through Springfield, holds 80,835,548
Shares. Of such Shares, Springfield has an indirect interest in the same 25,425,972 Shares in which Monterrey, a wholly-owned subsidiary of Springfield,
has a direct interest, and Springfield has a direct interest in 55,409,576 Shares. Mrs Betty Tung, the wife of Mr C H Tung, owns 20,853 Shares.
7. Archduke Corporation and Phoenix Corporation, companies which are wholly-owned by Mr C C Tung, have an interest in the trust which, through
Springfield, holds 80,835,548 Shares.
8. Monterrey is a wholly-owned subsidiary of Springfield.
Save as disclosed herein, as at 31st December 2003, no other person was recorded in the Company’s register kept pursuant to Section
336 of the SFO as having an interest in the Issued Capital (including short positions) representing 5% or more of the Issued Capital.
Save as disclosed herein, the Directors are not aware of any person, other than the persons (including his personal, family and
corporate interests) as aforementioned, who had, directly or indirectly, an interest in the Issued Capital (including short positions)
representing 5% or more of the Issued Capital as at 31st December 2003.
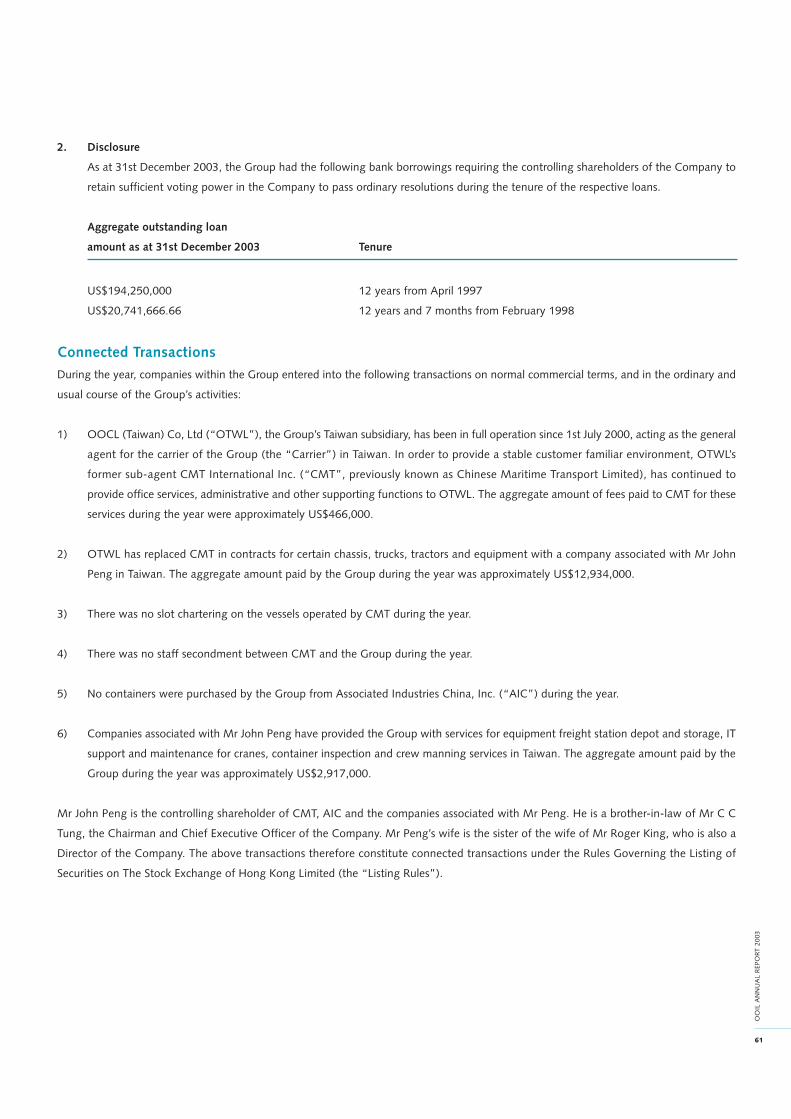
61
OO
IL A
NN
UA
L R
EPO
R T 2
003
2. Disclosure
As at 31st December 2003, the Group had the following bank borrowings requiring the controlling shareholders of the Company to
retain sufficient voting power in the Company to pass ordinary resolutions during the tenure of the respective loans.
Aggregate outstanding loan
amount as at 31st December 2003 Tenure
US$194,250,000 12 years from April 1997
US$20,741,666.66 12 years and 7 months from February 1998
Connected Transactions
During the year, companies within the Group entered into the following transactions on normal commercial terms, and in the ordinary and
usual course of the Group’s activities:
1) OOCL (Taiwan) Co, Ltd (“OTWL”), the Group’s Taiwan subsidiary, has been in full operation since 1st July 2000, acting as the general
agent for the carrier of the Group (the “Carrier”) in Taiwan. In order to provide a stable customer familiar environment, OTWL’s
former sub-agent CMT International Inc. (“CMT”, previously known as Chinese Maritime Transport Limited), has continued to
provide office services, administrative and other supporting functions to OTWL. The aggregate amount of fees paid to CMT for these
services during the year were approximately US$466,000.
2) OTWL has replaced CMT in contracts for certain chassis, trucks, tractors and equipment with a company associated with Mr John
Peng in Taiwan. The aggregate amount paid by the Group during the year was approximately US$12,934,000.
3) There was no slot chartering on the vessels operated by CMT during the year.
4) There was no staff secondment between CMT and the Group during the year.
5) No containers were purchased by the Group from Associated Industries China, Inc. (“AIC”) during the year.
6) Companies associated with Mr John Peng have provided the Group with services for equipment freight station depot and storage, IT
support and maintenance for cranes, container inspection and crew manning services in Taiwan. The aggregate amount paid by the
Group during the year was approximately US$2,917,000.
Mr John Peng is the controlling shareholder of CMT, AIC and the companies associated with Mr Peng. He is a brother-in-law of Mr C C
Tung, the Chairman and Chief Executive Officer of the Company. Mr Peng’s wife is the sister of the wife of Mr Roger King, who is also a
Director of the Company. The above transactions therefore constitute connected transactions under the Rules Governing the Listing of
Securities on The Stock Exchange of Hong Kong Limited (the “Listing Rules”).
62
OO
IL A
NN
UA
L R
EPO
RT 2
003
Report of the Directors
The Independent Non-executive Directors of the Company, Mr Simon Murray, Dr Victor K Fung and Prof Richard Wong, have reviewed the
above transactions and confirm that such transactions have complied with the conditions set by the Stock Exchange in 1997 in granting the
waiver to the Company from the requirement of disclosure by press notice and circular to shareholders on each occasion they arise and that
they were conducted on normal commercial terms, in the ordinary and usual course of business of the Group, and also within the annual
limit of 6% of the consolidated net tangible assets of the Company for the year ended 31st December 2003 and the transactions were fair
and reasonable so far as the shareholders of the Company were concerned. PricewaterhouseCoopers, the Auditors, have also reviewed the
transactions as disclosed above.
Purchase, Sale or Redemption of Shares
On 7th August 2003, the Company entered into agreements with Fortwin Investment Limited and Sixpence Holdings Limited, under which
the Company agreed to repurchase 15,922,000 shares and 31,035,088 shares respectively, at the price of HK$9.80 per share. The share
repurchase was completed on 25th September 2003 and all the shares repurchased were then cancelled. The total number of issued
ordinary shares of the Company was reduced from 517,141,632 to 470,184,544.
Share Capital
Pursuant to a Placing Agreement dated 13th February 2004, the Company issued 47,000,000 new shares at a price of HK$25.75 per share.
Following the placing, the total number of issued ordinary shares of the Company is 517,184,544.
Pre-emptive Rights
No pre-emptive rights exist under Bermudan law in relation to issue of new shares by the Company.
Company’s Compliance with Code of Best Practice
In the opinion of the Directors, the Company has complied with the Code of Best Practice as set out in Appendix 14 of the Listing Rules
throughout the accounting period covered by this Annual Report except that the Non-executive Directors of the Company are not appointed
for a specific term as they are subject to retirement by rotation in accordance with the Company’s Bye-laws.
Amendments to Bye-laws
Due to the recent changes to the requirements of the Listing Rules, the Board of Directors of the Company proposes to put forward to the
shareholders for approval at the Annual General Meeting of a Special Resolution to amend the Bye-laws of the Company, among other
things, in the following manner:
(a) to require that the minimum seven-day period for lodgment by shareholders of the notice to nominate a Director to commence no
earlier than the day after the dispatch of the notice of the meeting appointed for such election and end no later than seven days
before the date of such meeting;
(b) to prohibit Directors from voting at and being counted towards the quorum of the Board meeting on any matter in which any of his
associates has a material interest; and
(c) to exclude the votes cast by a shareholder in contravention of a requirement or restriction under the Listing Rules.
The amendments to the Bye-laws of the Company that are being proposed are set out in the notice of the Annual General Meeting in the
Special Resolution set out on pages 52 to 55 of this Annual Report.
63
OO
IL A
NN
UA
L R
EPO
R T 2
003
Property, Plant and Equipment
Particulars of the movements in Property, plant and equipment are set out in note 12 to the accounts.
Donations
Donations made by the Group during the year amount to US$74,000.
Annual General Meeting
The notice of Annual General Meeting is set out on pages 50 to 56. A circular, which accompanies this Annual Report, gives details of the
general mandate to authorise the allotment of and otherwise dealing with shares of all classes in the capital of the Company and securities
convertible into shares and options, warrants or similar rights to subscribe for shares or such convertible securities (the “Securities”) and the
general mandate to authorise the repurchase of Securities (all as set out in the Notice of Annual General Meeting).
Auditors
The accounts have been audited by PricewaterhouseCoopers who retire and, being eligible, offer themselves for re-appointment.
On behalf of the Board
C C Tung
Chairman
Hong Kong, 19th March 2004

64
OO
IL A
NN
UA
L R
EPO
RT 2
003
Report of the Auditors
To the Shareholders of
Orient Overseas (International) Limited
(Incorporated in Bermuda with limited liability)
We have audited the accounts on pages 65 to 123 which have been prepared in accordance with Hong Kong Financial Reporting Standards.
Respective responsibilities of Directors and Auditors
The Directors of the Company are responsible for the preparation of accounts which give a true and fair view. In preparing accounts which
give a true and fair view it is fundamental that appropriate accounting policies are selected and applied consistently.
It is our responsibility to form an independent opinion, based on our audit, on those accounts and to report our opinion, solely to you, as a
body, in accordance with Section 90 of the Companies Act 1981 of Bermuda and for no other purpose. We do not assume responsibility
towards or accept liability to any other person for the contents of this report.
Basis of opinion
We conducted our audit in accordance with Statements of Auditing Standards issued by the Hong Kong Society of Accountants. An audit
includes examination, on a test basis, of evidence relevant to the amounts and disclosures in the accounts. It also includes an assessment of
the significant estimates and judgements made by the Directors in the preparation of the accounts, and of whether the accounting policies
are appropriate to the Company’s and the Group’s circumstances, consistently applied and adequately disclosed.
We planned and performed our audit so as to obtain all the information and explanations which we considered necessary in order to provide
us with sufficient evidence to give reasonable assurance as to whether the accounts are free from material misstatement. In forming our
opinion we also evaluated the overall adequacy of the presentation of information in the accounts. We believe that our audit provides a
reasonable basis for our opinion.
Opinion
In our opinion the accounts give a true and fair view of the state of affairs of the Company and of the Group as at 31st December 2003 and
of the profit and cash flows of the Group for the year then ended and have been properly prepared in accordance with the disclosure
requirements of the Hong Kong Companies Ordinance.
PricewaterhouseCoopers
Certified Public Accountants
Hong Kong, 19th March 2004

Consolidated Profit and Loss Account
65
OO
IL A
NN
UA
L R
EPO
R T 2
003
For the year ended 31st December 2003
US$’000 Note 2003 2002
Turnover 2 3,241,113 2,457,952
Operating costs 3 (2,520,202) (2,038,912)
Gross profit 720,911 419,040
Other operating income 4 14,875 2,822
Other operating expenses 5 (376,402) (331,016)
Operating profit before financing 6 359,384 90,846
Net financing charges 8 (18,740) (30,634)
Share of profits less losses of jointly controlled entities 12,662 2,690
Profit before taxation 353,306 62,902
Taxation 9 (24,145) (10,954)
Profit after taxation 329,161 51,948
Minority interests (117) (210)
Profit attributable to shareholders 329,044 51,738
Dividends 11 78,283 12,929
US cents US cents
Earnings per ordinary share 10 65.2 10.0

Consolidated Balance Sheet
66
OO
IL A
NN
UA
L R
EPO
RT 2
003
As at 31st December 2003
US$’000 Note 2003 2002
Property, plant and equipment 12 1,579,798 1,342,438
Jointly controlled entities 14 24,298 35,576
Long-term investments 15 99,218 100,763
Intangible assets 16 29,817 27,541
Other non-current assets 17 36,907 33,243
Non-current assets 1,770,038 1,539,561
Properties under development and for sale 18 78,224 64,552
Debtors and prepayments 19 246,644 194,361
Portfolio investments 108,165 54,276
Bank balances and deposits 21 551,839 336,590
Current assets 984,872 649,779
Creditors and accruals 22 486,244 383,550
Current portion of long-term liabilities 24 218,527 168,835
Bank overdrafts and short-term loans 23 38,958 44,014
Current taxation 3,159 3,870
Current liabilities 746,888 600,269
Net current assets 237,984 49,510
Long-term liabilities 24 (840,677) (682,759)
Other non-current liabilities 25 (48,741) (37,881)
1,118,604 868,431
Capital employed
Share capital 29 47,018 51,714
Reserves 30 1,063,736 808,729
Shareholders’ funds 1,110,754 860,443
Minority interests 7,850 7,988
1,118,604 868,431
C C Tung
Nicholas D Sims
Directors

Balance Sheet
67
OO
IL A
NN
UA
L R
EPO
R T 2
003
As at 31st December 2003
US$’000 Note 2003 2002
Subsidiaries 13 329,837 418,378
Other non-current assets 17 57 55
Non-current assets 329,894 418,433
Debtors and prepayments 19 53 57
Bank balances and deposits 21 15,728 18,398
Current assets 15,781 18,455
Creditors and accruals 22 1,219 1,163
Current liabilities 1,219 1,163
Net current assets 14,562 17,292
344,456 435,725
Capital employed
Share capital 29 47,018 51,714
Reserves 30 297,438 384,011
Shareholders’ funds 344,456 435,725
C C Tung
Nicholas D Sims
Directors

Consolidated Cash Flow Statement
68
OO
IL A
NN
UA
L R
EPO
RT 2
003
For the year ended 31st December 2003
US$’000 Note 2003 2002
Cash flows from operating activities
Cash generated from operations 34(a) 520,696 169,846
Interest paid (17,729) (23,061)
Interest element of finance lease rental payments (15,296) (16,642)
Dividend on preference shares (6,304) —
Financing charges paid (2,498) (3,499)
Overseas tax paid (12,355) (5,966)
Net cash from operating activities 466,514 120,678
Cash flows from investing activities
Sale of property, plant and equipment 90,945 2,205
Sale of long-term investments 1,812 3,496
Sale of a jointly controlled entity — 59
Purchase of property, plant and equipment (236,163) (64,675)
Purchase of long-term investments (258) (233)
Repayment of investment in a jointly controlled entity 9,500 —
Capital element from investments in finance leases — 268
(Increase)/decrease in amounts due by jointly controlled entities (795) 1,267
Decrease/(increase) in bank deposits maturing more
than three months from the date of placement 5,592 (6,735)
Purchase of intangible assets (10,547) (7,088)
Interest received 11,723 7,914
Long-term investment income 2 30
Portfolio investment income 7,424 1,511
Gross earnings from investments in finance leases — 259
Dividends received from jointly controlled entities 9,188 9,308
Net cash used in investing activities (111,577) (52,414)
Cash flows from financing activities
New long-term loans 189,706 94,763
Repayment of long-term loans (139,816) (97,478)
Capital element of finance lease rental payments (39,531) (53,250)
Capital contribution from minority interests — 3,600
Increase in short-term loans repayable more than
three months from the date of advance 10,312 13,250
Repurchase of own shares (59,739) —
Dividends paid to shareholders (31,028) (7,757)
Dividends paid to minority interests (255) (470)
Net cash used in financing activities (70,351) (47,342)
Net increase in cash and cash equivalents 284,586 20,922
Cash and cash equivalents at beginning of year 355,498 331,591
Changes in exchange rates 4,734 2,985
Cash and cash equivalents at end of year 34(c) 644,818 355,498
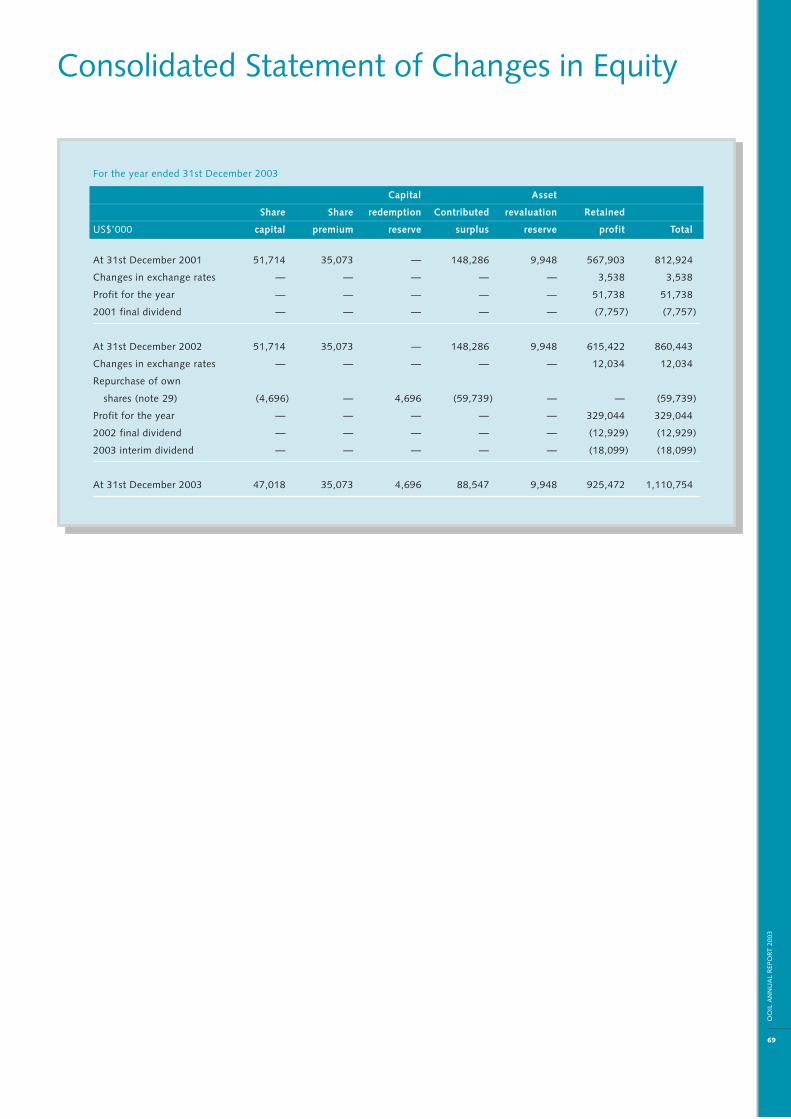
Consolidated Statement of Changes in Equity
69
OO
IL A
NN
UA
L R
EPO
R T 2
003
For the year ended 31st December 2003
Capital Asset
Share Share redemption Contributed revaluation Retained
US$’000 capital premium reserve surplus reserve profit Total
At 31st December 2001 51,714 35,073 — 148,286 9,948 567,903 812,924
Changes in exchange rates — — — — — 3,538 3,538
Profit for the year — — — — — 51,738 51,738
2001 final dividend — — — — — (7,757) (7,757)
At 31st December 2002 51,714 35,073 — 148,286 9,948 615,422 860,443
Changes in exchange rates — — — — — 12,034 12,034
Repurchase of own
shares (note 29) (4,696) — 4,696 (59,739) — — (59,739)
Profit for the year — — — — — 329,044 329,044
2002 final dividend — — — — — (12,929) (12,929)
2003 interim dividend — — — — — (18,099) (18,099)
At 31st December 2003 47,018 35,073 4,696 88,547 9,948 925,472 1,110,754
Notes to the Accounts
70
OO
IL A
NN
UA
L R
EPO
RT 2
003
1. Principal accounting policiesThe accounts have been prepared under the historical cost convention, as modified by the revaluation of certain property, plant
and equipment, and in conformity with Hong Kong Financial Reporting Standards.
The principal accounting policies adopted in the preparation of these accounts are set out below.
(a) Basis of consolidation
The consolidated accounts include the accounts of the Company and its subsidiaries made up to 31st December. Subsidiaries
are companies in which the Group has the power to exercise control governing the financial and operating policies of the
company.
The consolidated accounts also include the Group’s attributable share of post-acquisition results and reserves of its jointly
controlled entities.
Results attributable to subsidiaries acquired or disposed of during the year are included in the consolidated profit and loss
account from the date on which control is transferred to the Group or to the date that control ceases, as applicable.
All significant inter-company transactions and balances between group companies are eliminated.
(b) Goodwill and capital reserve
Goodwill represents the difference between the cost of an acquisition over the fair values ascribed to the Group’s share of
the net assets of the acquired subsidiaries and jointly controlled entities at the effective date of acquisition. Goodwill on
acquisitions is included in the balance sheet as a separate asset and amortised using the straight line method over its
estimated useful life of not more than twenty years. Where the fair values ascribed to the net assets exceed the purchase
consideration, such differences are recognised as income in the year of acquisition or over the weighted average useful life
of the acquired non-monetary assets.
The carrying amount of goodwill is reviewed annually and provision is only made where, in the opinion of the Directors,
there is impairment in value other than temporary in nature.
The profit or loss on disposal of subsidiaries and jointly controlled entities is calculated by reference to the net assets at the
date of disposal including the attributable amount of goodwill which remains unamortised.
(c) Jointly controlled entities
A jointly controlled entity is a joint venture in respect of which a contractual arrangement is established between the
participating venturers and whereby the Group together with the venturers undertake an economic activity which is
subject to joint control and none of the venturers has unilateral control over the economic activity. Jointly controlled
entities are accounted for under the equity method whereby the Group’s share of profits less losses is included in the
consolidated profit and loss account and the Group’s share of net assets is included in the consolidated balance sheet.
71
OO
IL A
NN
UA
L R
EPO
R T 2
003
1. Principal accounting policies (Continued)(d) Property, plant and equipment
Property, plant and equipment are stated at cost or valuation less accumulated depreciation and provision for significant
permanent impairment in values.
No depreciation is provided for vessels under construction, the investment property and freehold land.
The investment property, being a commercial building, is held for long-term yields and is not occupied by the Group. The
investment property is carried at fair value, representing open market value determined annually based on Directors’ or
independent valuation. A deficit in valuation is charged to the profit and loss account; an increase is first credited to the
profit and loss account to the extent of valuation deficit previously charged and thereafter is credited to the assets revaluation
reserve. Upon disposal of the investment property, any revaluation surplus is transferred to the profit and loss account.
Other assets are depreciated, using the straight line method, to write off their cost or valuation over their estimated useful
lives or if shorter, the relevant finance lease periods, to their estimated residual values. Estimated useful lives are summarised
as follows:
Container vessels 25 years
Containers 5 to 12 years
Chassis 10 to 12 years
Terminal equipment and improvements 10 to 15 years
Freehold buildings Not exceeding 75 years
Medium-term leasehold land and buildings Over period of the lease
Vehicles, furniture, computer and other equipment 5 to 10 years
Major costs incurred in restoring assets to their normal working condition are charged to the profit and loss account.
Improvements are capitalised and depreciated over their expected useful lives to the Group. The carrying amounts of
assets are reviewed regularly. Where the estimated recoverable amounts have declined permanently below their carrying
amounts, the carrying amounts are written down to their estimated recoverable amounts.
Profits and losses on disposal are determined as the difference between the net disposal proceeds and the carrying amounts
of the assets and are dealt with in the profit and loss account. Upon disposal of revalued assets, any revaluation reserve is
transferred directly to retained profit.
Notes to the Accounts
72
OO
IL A
NN
UA
L R
EPO
RT 2
003
1. Principal accounting policies (Continued)(e) Investments
Debt securities expected to be held until maturity and equity shares intended to be held for the long term are included in
the balance sheet under long-term investments and are carried at cost, as adjusted for the amortisation of the premiums
and discounts on acquisition, less provisions. Provision is made when, in the opinion of the Directors, there is impairment
in value other than temporary in nature.
Premiums or discounts on the acquisition of long-term debt securities are amortised through the profit and loss account
over the period from the date of purchase to the expected date of maturity. Any profit or loss on the realisation of long-
term investments is recognised as it arises and is included in the profit and loss account under other operating income.
Portfolio investments comprising mainly marketable securities, which are acquired principally for the purpose of generating
a profit from short-term fluctuation in price and are readily convertible into cash, are included in the balance sheet under
current assets and are carried at their realisable values. Income from portfolio investments, together with surplus or
deficit, including exchange differences, arising from the sale or revaluation is included in the profit and loss account under
net financing charges.
(f) Investments in finance leases
Assets leased to third parties under agreements that transfer substantially all the risks and rewards incident to ownership
of the relevant assets to the lessees are classified as investments in finance leases. The present value of the lease payments
is recognised as a receivable in the balance sheet. Gross earnings under finance leases are recognised over the term of the
lease using the net investment method which reflects a constant periodic rate of return on the net investment in the
leases.
(g) Leased assets
Assets leased from third parties under agreements that transfer substantially all the risks and rewards incident to ownership
of the relevant assets to the Group are classified as finance leases. At the inception of a finance lease, the fair value of the
asset or, if lower, the present value of the minimum lease payments, derived by discounting them at the interest rate
implicit in the lease, is capitalised as an asset; the corresponding obligations, net of finance charges, is included under
long-term liabilities. Assets held under finance leases are depreciated on the basis described in note (d) above. Gross
rental payable in respect of finance leases are apportioned between interest charges and a reduction of the lease obligations
based on the interest rates implicit in the relevant leases.
Leases where a significant portion of the risk and rewards of ownership are retained by the lessors are classified as
operating leases. Rentals payable, net of incentives received from the lessors, under operating leases are charged to the
profit and loss account over the periods of the respective leases on a straight line basis or another systematic basis which
is representative of the time pattern of the benefit to the lessees.
73
OO
IL A
NN
UA
L R
EPO
R T 2
003
1. Principal accounting policies (Continued)(h) Computer software development costs
Costs that are directly associated with identifiable and unique software products controlled by the Group and have probable
economic benefit exceeding the cost beyond one year are recognised as intangible assets. Direct costs include staff costs
of the software development team and an appropriate portion of relevant overheads. Other costs associated with developing
and maintaining computer software programmes are recognised as an expense as incurred.
Expenditure which enhances or extends the performance of computer software programmes beyond their original
specifications is recognised as a capital improvement and added to the original cost of the software. Computer software
development costs recognised as assets are amortised on completion of development using the straight line method over
their estimated useful lives of five years.
(i) Deferred expenditure
Expenses incurred in connection with long-term financing and leasing arrangements are deferred and amortised on a
straight line basis over the relevant tenure of the loan and lease periods. Expenditure associated with the leasing of the
investment property is deferred and amortised on a straight line basis over a period of up to five years.
(j) Properties held for sale
Properties under development for sale are included under current assets and comprise land at cost, construction costs and
any interest capitalised, less provisions for foreseeable losses. Completed properties held for sale are carried at the lower
of cost and net realisable value. Net realisable value is determined on the basis of anticipated sales proceeds less estimated
selling expenses.
(k) Provisions
Provisions are recognised when there is a present legal or constructive obligation as a result of past events. It is probable
that an outflow of resources will be required to settle the obligation, and a reliable estimate of the amount can be made.
Where a provision is expected to be reimbursed, the reimbursement is recognised as a separate asset but only when the
reimbursement is virtually certain.
Restructuring provisions mainly comprise lease termination penalties and employee termination payments, and are
recognised in the period in which the Group becomes legally or constructively committed to payment. Employee termination
benefits are recognised only after either an agreement is in place with the appropriate employee representatives specifying
the terms of redundancy and the number of employees affected, or after individual employees have been advised of the
specific terms. Costs related to the ongoing activities of the Group are not provided in advance. Any property, plant and
equipment that are no longer required for their original use are transferred to current assets and carried at the lower of the
carrying amount or estimated net realisable value.
Notes to the Accounts
74
OO
IL A
NN
UA
L R
EPO
RT 2
003
1. Principal accounting policies (Continued)(l) Deferred taxation
Deferred taxation is provided in full, using the liability method, on temporary differences arising between the tax bases of
assets and liabilities and their carrying amounts in the accounts. The principal temporary differences arise from depreciation
on property, plant and equipment, provisions for retirement benefits and tax losses carried forward. Tax rates enacted or
substantively enacted by the balance sheet date are used to determine deferred taxation.
Deferred taxation assets relating to carry forward of unused tax losses are recognised to the extent that it is probable that
future taxable profit will be available against which the unused tax losses can be utilised.
Deferred taxation is provided on temporary differences arising on investments in subsidiaries and jointly controlled entities,
except where the timing of the reversal of the temporary difference can be controlled and it is probable that the temporary
difference will not reverse in the foreseeable future.
(m) Employee benefits
The Group operates a number of defined benefit and defined contribution pension and retirement benefit schemes in the
main countries in which the Group operates. These schemes are generally funded by payments from employees and by
relevant group companies, taking into account of the recommendations of independent qualified actuaries where required.
Contributions under the defined contribution schemes are charged to the profit and loss account in the year to which the
contributions relate.
For the defined benefit pension schemes, annual contributions are made in accordance with the advice of qualified actuaries
for the funding of retirement benefits in order to build up reserves for each scheme member during the employee’s service
life and which are used to pay to the employee or dependent a pension after retirement. Such pension costs are assessed
using the projected unit credit method, under which, the cost of providing pensions is charged to the profit and loss
account so as to spread the regular cost over the service lives of employees in accordance with the advice of the actuaries
with full valuation of the plans every two to three years. The pension obligations are measured as the present value of the
estimated future cash outflows using interest rates of high quality corporate bonds which have terms to maturity
approximating the terms of the related liabilities. Plan assets are measured at fair values. Actuarial gains and losses are
recognised in the profit and loss account over the expected average remaining service lives of employees to the extent of
the amount in excess of 10% of the greater of the present value of the plan obligations and the fair value of plan assets.
Employee entitlements to annual leave and long service leave are recognised when they accrue to employees. A provision
is made for the estimated liability for annual leave and long-service leave as a result of services rendered by employees up
to the balance sheet date. Employee entitlements to sick leave and maternity leave are not recognised until the time of
leave.
Provisions for bonus plans due wholly within twelve months after balance sheet date are recognised when the Group has
a present legal or constructive obligation as a result of services rendered by employees and a reliable estimate of the
obligation can be made.

75
OO
IL A
NN
UA
L R
EPO
R T 2
003
1. Principal accounting policies (Continued)(n) Revenue recognition
Freight revenues from the operation of the international containerised transportation business are recognised on a percentage
of completion basis, which is determined on the time proportion method of each individual vessel voyage. Revenues from
the operation of container terminals and provision of other services are recognised when services are rendered or on an
accrual basis. Rental income under operating leases is recognised over the periods of the respective leases on a straight
line basis. Sales of properties under construction are recognised over the course of development based on the proportion
of construction work completed or if lower, the proportion of sales proceeds received. Sales of completed properties are
recognised upon completion of the sale and purchase contracts.
(o) Vessel repairs and surveys
Dry-docking and special survey costs for vessels are charged to the profit and loss account as incurred.
(p) Borrowing costs
Interest and related costs on borrowings directly incurred to finance the construction or acquisition of an asset are capitalised
during the period of time that is required to complete and prepare the asset for its intended use. All other borrowing costs
are expensed.
(q) Financial instruments
The Group enters into financial instruments, including futures, forward, swap and option transactions, in order to hedge
its exposure to fluctuations in foreign exchange, interest rates and other operating costs as part of the Group’s risk
management strategy against assets, liabilities, position or cash flows measured on an accrual basis. These financial
instruments are accounted for on an equivalent basis to the underlying assets, liabilities or net positions at the balance
sheet date. Any profit or loss arising is recognised on the same basis as that arising from the related assets, liabilities or
positions. Premiums on options are however charged to the profit and loss account as they are incurred. Unrealised gains
and losses at the balance sheet date on open exchange contracts for future obligations are dealt with in the profit and loss
account.
(r) Cash and cash equivalents
Cash and cash equivalents comprise cash and bank balances, deposits with banks and financial institutions repayable
within three months from the date of placement and portfolio investments which are readily convertible into cash, net of
bank overdrafts and advances from banks and financial institutions repayable within three months from the date of
advance.
(s) Foreign currencies
The functional currency of the Group is US dollar.
Transactions in other currencies during the year are converted at rates of exchange ruling at the transaction dates. Monetary
assets and liabilities denominated in other currencies at the balance sheet date are translated at rates of exchange ruling
at that date. Exchange differences arising are dealt with in the profit and loss account.
Profit and loss accounts of subsidiaries expressed in other currencies are translated at the weighted average exchange
rates for the year and balance sheets are translated at the exchange rates ruling at the balance sheet date. Exchange
differences arising from the translation of net investment in foreign subsidiaries are taken directly to reserves.
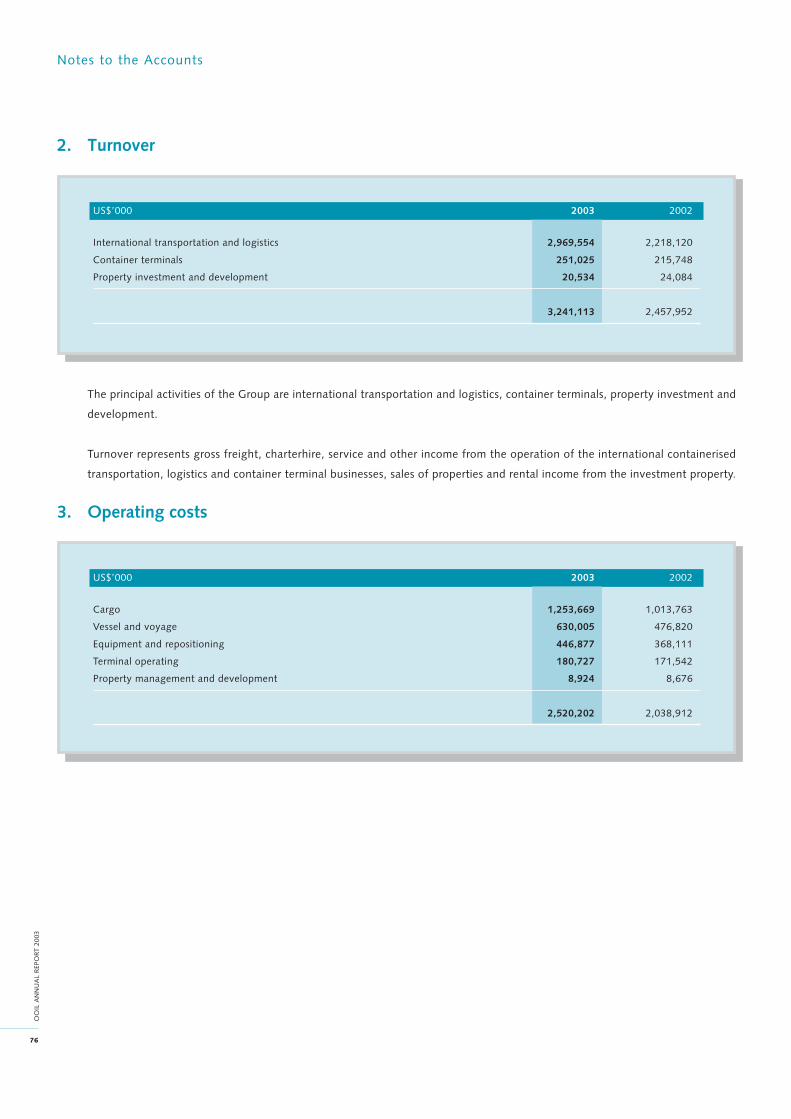
Notes to the Accounts
76
OO
IL A
NN
UA
L R
EPO
RT 2
003
2. Turnover
US$’000 2003 2002
International transportation and logistics 2,969,554 2,218,120
Container terminals 251,025 215,748
Property investment and development 20,534 24,084
3,241,113 2,457,952
The principal activities of the Group are international transportation and logistics, container terminals, property investment and
development.
Turnover represents gross freight, charterhire, service and other income from the operation of the international containerised
transportation, logistics and container terminal businesses, sales of properties and rental income from the investment property.
3. Operating costs
US$’000 2003 2002
Cargo 1,253,669 1,013,763
Vessel and voyage 630,005 476,820
Equipment and repositioning 446,877 368,111
Terminal operating 180,727 171,542
Property management and development 8,924 8,676
2,520,202 2,038,912
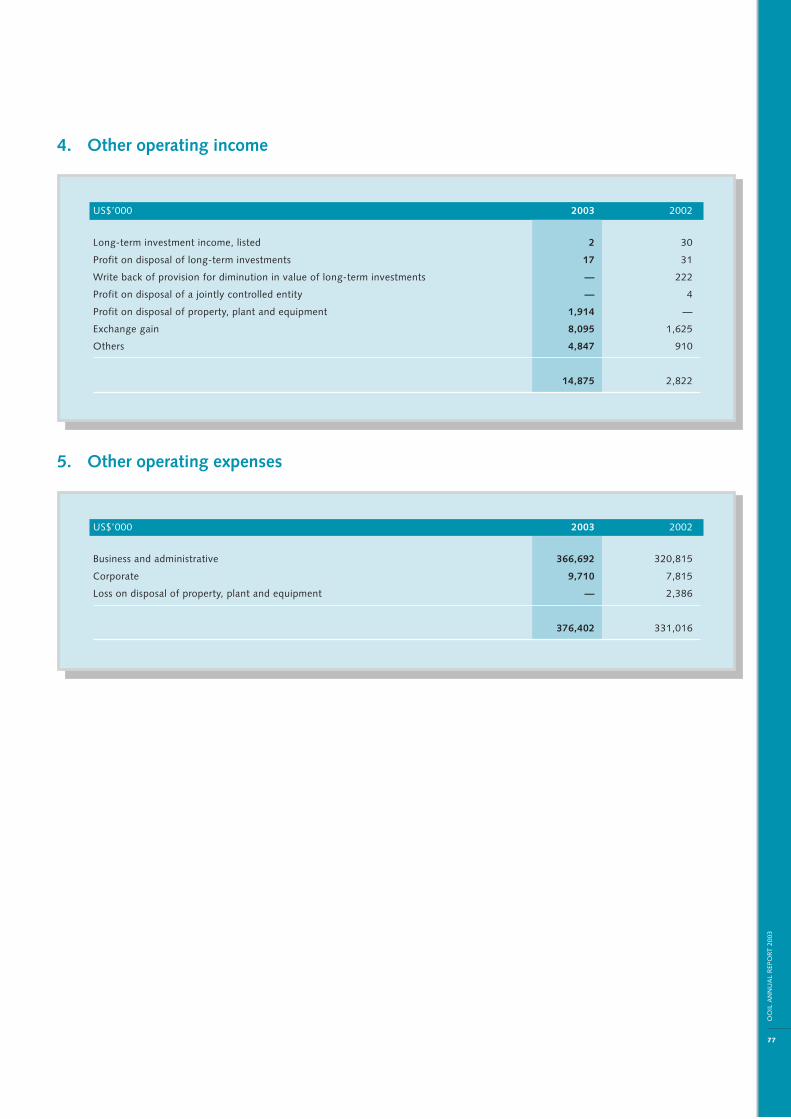
77
OO
IL A
NN
UA
L R
EPO
R T 2
003
4. Other operating income
US$’000 2003 2002
Long-term investment income, listed 2 30
Profit on disposal of long-term investments 17 31
Write back of provision for diminution in value of long-term investments — 222
Profit on disposal of a jointly controlled entity — 4
Profit on disposal of property, plant and equipment 1,914 —
Exchange gain 8,095 1,625
Others 4,847 910
14,875 2,822
5. Other operating expenses
US$’000 2003 2002
Business and administrative 366,692 320,815
Corporate 9,710 7,815
Loss on disposal of property, plant and equipment — 2,386
376,402 331,016
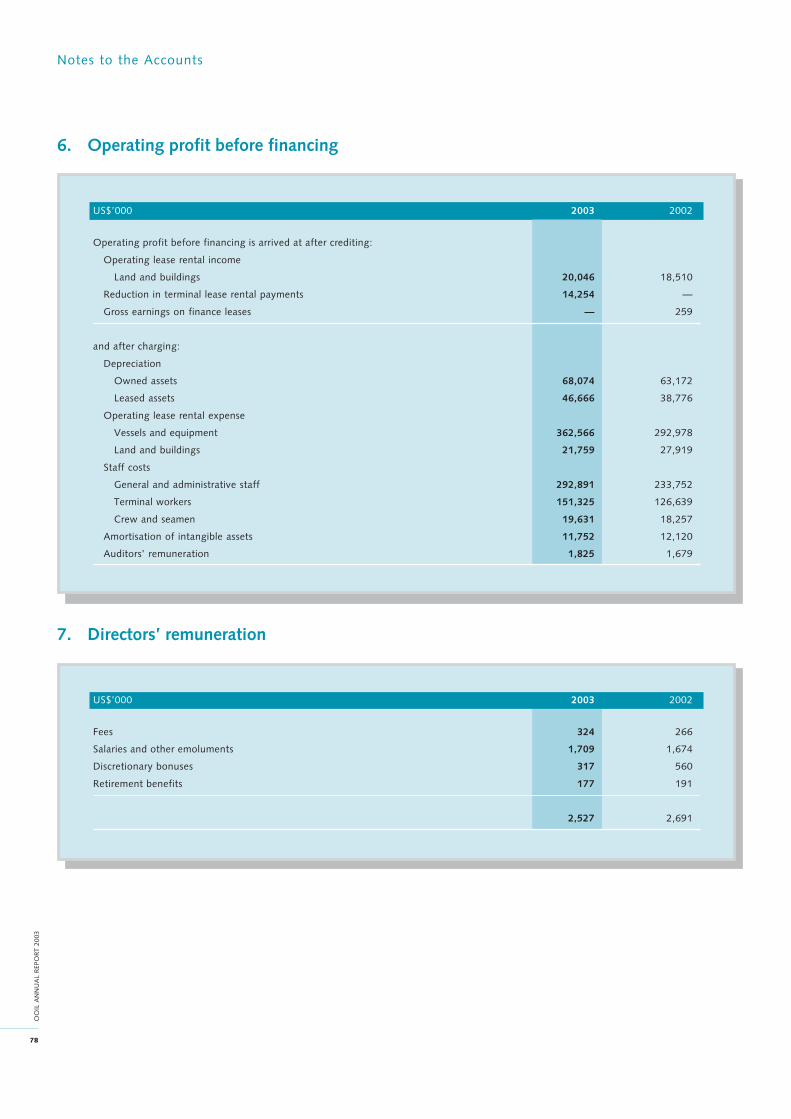
Notes to the Accounts
78
OO
IL A
NN
UA
L R
EPO
RT 2
003
6. Operating profit before financing
US$’000 2003 2002
Operating profit before financing is arrived at after crediting:
Operating lease rental income
Land and buildings 20,046 18,510
Reduction in terminal lease rental payments 14,254 —
Gross earnings on finance leases — 259
and after charging:
Depreciation
Owned assets 68,074 63,172
Leased assets 46,666 38,776
Operating lease rental expense
Vessels and equipment 362,566 292,978
Land and buildings 21,759 27,919
Staff costs
General and administrative staff 292,891 233,752
Terminal workers 151,325 126,639
Crew and seamen 19,631 18,257
Amortisation of intangible assets 11,752 12,120
Auditors’ remuneration 1,825 1,679
7. Directors’ remuneration
US$’000 2003 2002
Fees 324 266
Salaries and other emoluments 1,709 1,674
Discretionary bonuses 317 560
Retirement benefits 177 191
2,527 2,691

79
OO
IL A
NN
UA
L R
EPO
R T 2
003
7. Directors’ remuneration (Continued)The emoluments of individual Directors fall within the following bands:
Number of Directors
Emoluments bands (US$) 2003 2002
Nil ~ 128,200 (Nil ~ HK$1,000,000) 5 3
320,501 ~ 384,600 (HK$2,500,001 ~ HK$3,000,000) 1 1
384,601 ~ 448,700 (HK$3,000,001 ~ HK$3,500,000) 1 —
448,701 ~ 512,800 (HK$3,500,001 ~ HK$4,000,000) — 1
769,231 ~ 833,300 (HK$6,000,001 ~ HK$6,500,000) 2 —
833,301 ~ 897,400 (HK$6,500,001 ~ HK$7,000,000) — 1
897,401 ~ 961,500 (HK$7,000,001 ~ HK$7,500,000) — 1
9 7
None of the Directors has waived the right to receive their emoluments. Fees and other emoluments paid to non-executive
directors amount to US$14,400 (2002: US$13,000) and US$35,200 (2002: US$32,000), respectively.
Details of the emoluments paid to the five individuals, including three (2002: two) Directors, whose emoluments were the
highest in the Group are:
US$’000 2003 2002
Salaries and other emoluments 2,419 2,262
Discretionary bonuses 562 1,012
Retirement benefits 266 303
3,247 3,577
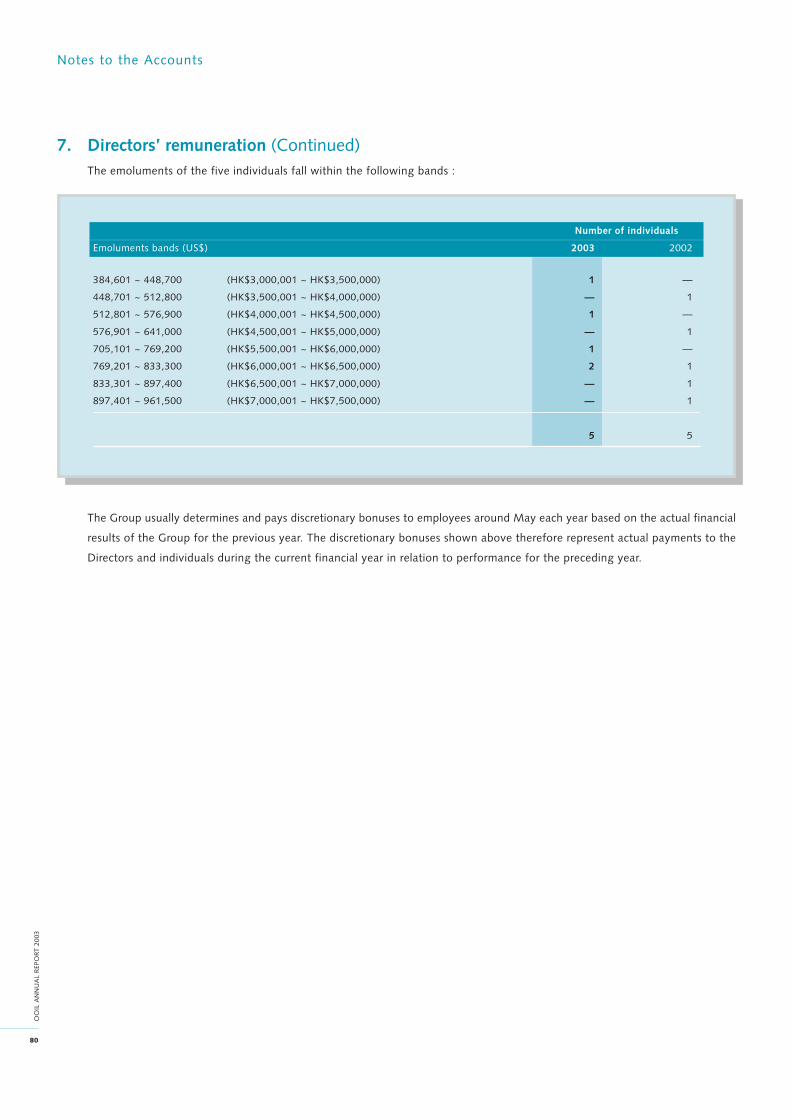
Notes to the Accounts
80
OO
IL A
NN
UA
L R
EPO
RT 2
003
7. Directors’ remuneration (Continued)The emoluments of the five individuals fall within the following bands :
Number of individuals
Emoluments bands (US$) 2003 2002
384,601 ~ 448,700 (HK$3,000,001 ~ HK$3,500,000) 1 —
448,701 ~ 512,800 (HK$3,500,001 ~ HK$4,000,000) — 1
512,801 ~ 576,900 (HK$4,000,001 ~ HK$4,500,000) 1 —
576,901 ~ 641,000 (HK$4,500,001 ~ HK$5,000,000) — 1
705,101 ~ 769,200 (HK$5,500,001 ~ HK$6,000,000) 1 —
769,201 ~ 833,300 (HK$6,000,001 ~ HK$6,500,000) 2 1
833,301 ~ 897,400 (HK$6,500,001 ~ HK$7,000,000) — 1
897,401 ~ 961,500 (HK$7,000,001 ~ HK$7,500,000) — 1
5 5
The Group usually determines and pays discretionary bonuses to employees around May each year based on the actual financial
results of the Group for the previous year. The discretionary bonuses shown above therefore represent actual payments to the
Directors and individuals during the current financial year in relation to performance for the preceding year.
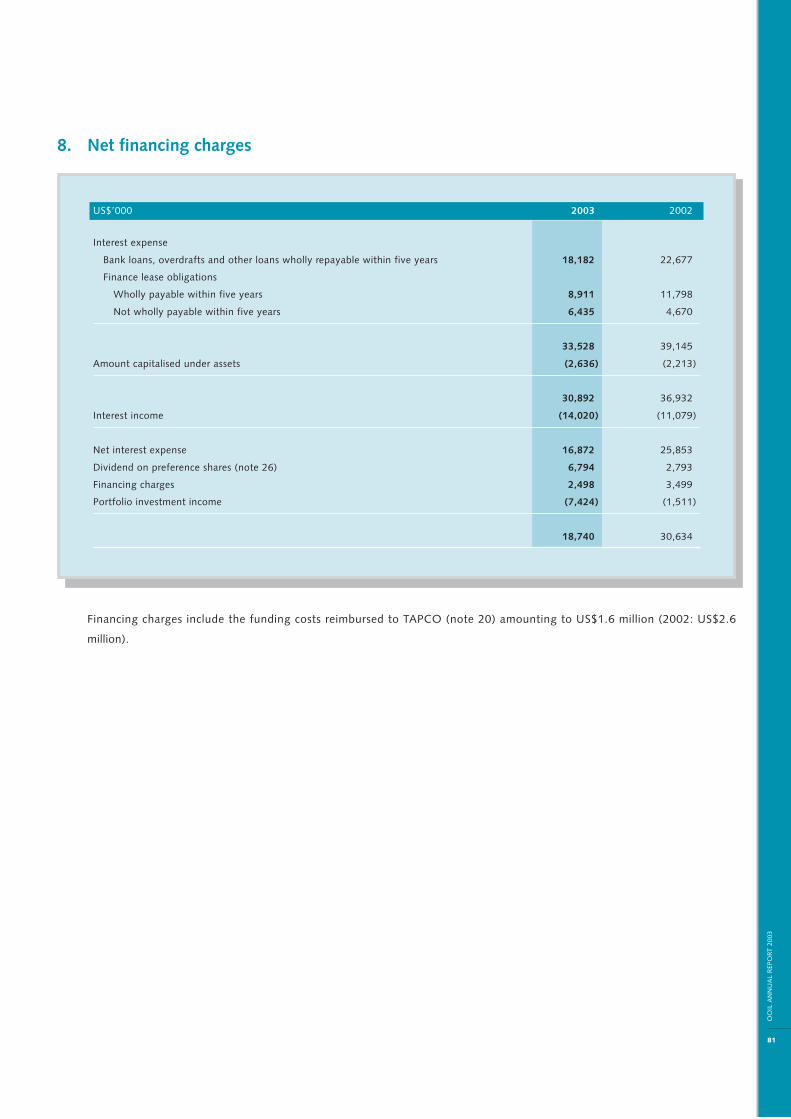
81
OO
IL A
NN
UA
L R
EPO
R T 2
003
8. Net financing charges
US$’000 2003 2002
Interest expense
Bank loans, overdrafts and other loans wholly repayable within five years 18,182 22,677
Finance lease obligations
Wholly payable within five years 8,911 11,798
Not wholly payable within five years 6,435 4,670
33,528 39,145
Amount capitalised under assets (2,636) (2,213)
30,892 36,932
Interest income (14,020) (11,079)
Net interest expense 16,872 25,853
Dividend on preference shares (note 26) 6,794 2,793
Financing charges 2,498 3,499
Portfolio investment income (7,424) (1,511)
18,740 30,634
Financing charges include the funding costs reimbursed to TAPCO (note 20) amounting to US$1.6 million (2002: US$2.6
million).
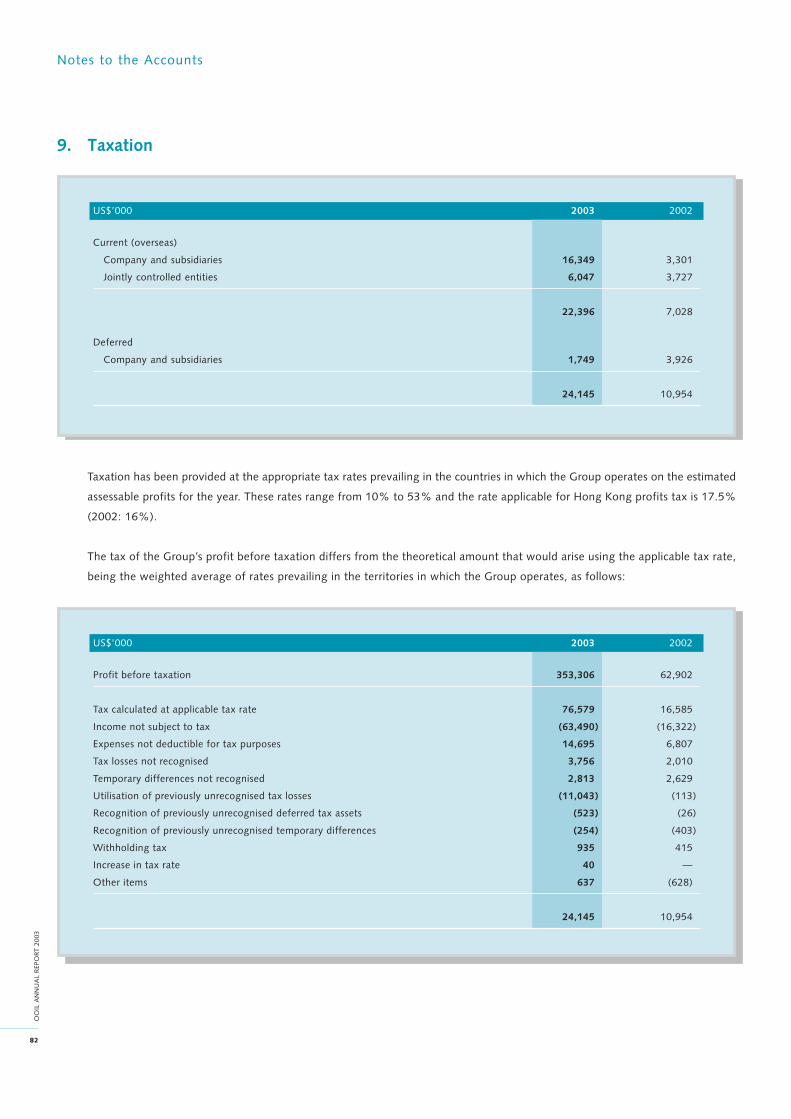
Notes to the Accounts
82
OO
IL A
NN
UA
L R
EPO
RT 2
003
9. Taxation
US$’000 2003 2002
Current (overseas)
Company and subsidiaries 16,349 3,301
Jointly controlled entities 6,047 3,727
22,396 7,028
Deferred
Company and subsidiaries 1,749 3,926
24,145 10,954
Taxation has been provided at the appropriate tax rates prevailing in the countries in which the Group operates on the estimated
assessable profits for the year. These rates range from 10% to 53% and the rate applicable for Hong Kong profits tax is 17.5%
(2002: 16%).
The tax of the Group’s profit before taxation differs from the theoretical amount that would arise using the applicable tax rate,
being the weighted average of rates prevailing in the territories in which the Group operates, as follows:
US$’000 2003 2002
Profit before taxation 353,306 62,902
Tax calculated at applicable tax rate 76,579 16,585
Income not subject to tax (63,490) (16,322)
Expenses not deductible for tax purposes 14,695 6,807
Tax losses not recognised 3,756 2,010
Temporary differences not recognised 2,813 2,629
Utilisation of previously unrecognised tax losses (11,043) (113)
Recognition of previously unrecognised deferred tax assets (523) (26)
Recognition of previously unrecognised temporary differences (254) (403)
Withholding tax 935 415
Increase in tax rate 40 —
Other items 637 (628)
24,145 10,954

83
OO
IL A
NN
UA
L R
EPO
R T 2
003
10. Earnings per ordinary share
The calculation of earnings per ordinary share is based on the profit attributable to ordinary shareholders of US$329.0 million
(2002: US$51.7 million) and the weighted average number of 504.5 million (2002: 517.1 million) ordinary shares in issue during
the year.
11. Dividends
US$’000 2003 2002
Interim paid of US3.85 cents (2002: nil) per ordinary share 18,099 —
Proposed final of US12.8 cents (2002: US2.5 cents) per ordinary share 60,184 12,929
78,283 12,929
The Board of Directors proposes a final dividend in respect of 2003 of US12.8 cents (2002: US2.5 cents) per ordinary share. This
dividend will be accounted for as an appropriation of retained profit in the year ending 31st December 2004.
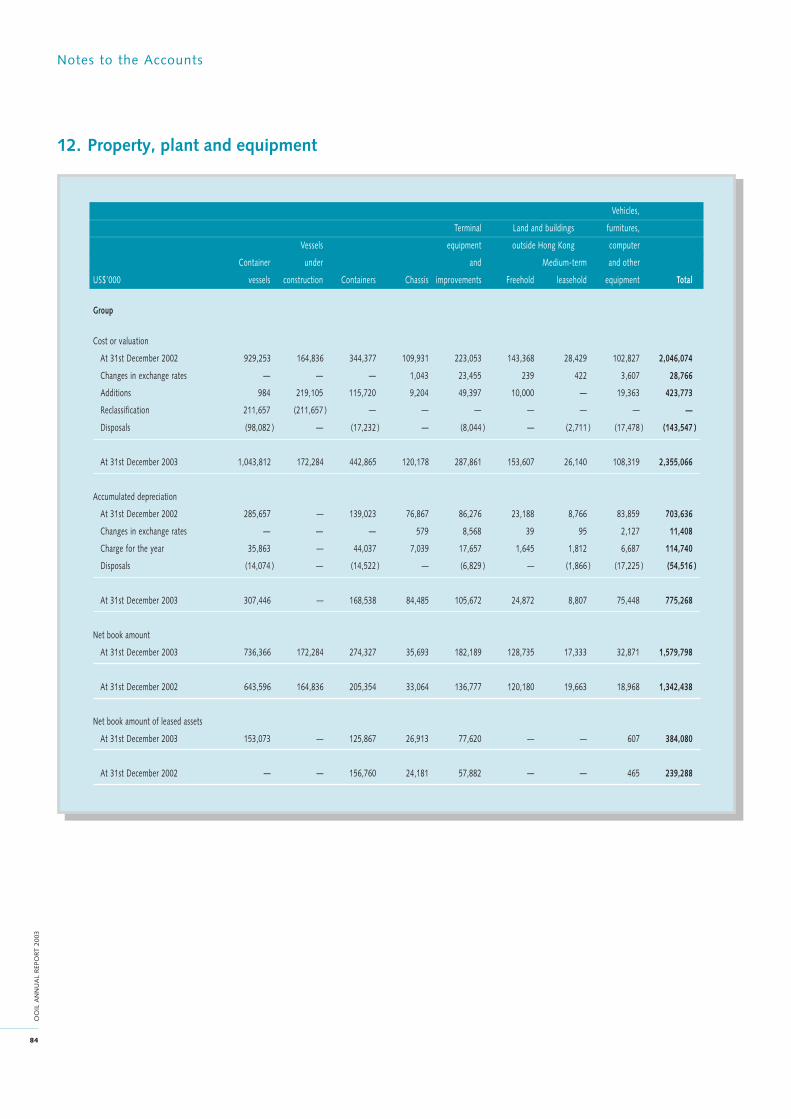
Notes to the Accounts
84
OO
IL A
NN
UA
L R
EPO
RT 2
003
12. Property, plant and equipment
Vehicles,
Terminal Land and buildings furnitures,
Vessels equipment outside Hong Kong computer
Container under and Medium-term and other
US$’000 vessels construction Containers Chassis improvements Freehold leasehold equipment Total
Group
Cost or valuation
At 31st December 2002 929,253 164,836 344,377 109,931 223,053 143,368 28,429 102,827 2,046,074
Changes in exchange rates — — — 1,043 23,455 239 422 3,607 28,766
Additions 984 219,105 115,720 9,204 49,397 10,000 — 19,363 423,773
Reclassification 211,657 (211,657 ) — — — — — — —
Disposals (98,082 ) — (17,232 ) — (8,044 ) — (2,711 ) (17,478 ) (143,547 )
At 31st December 2003 1,043,812 172,284 442,865 120,178 287,861 153,607 26,140 108,319 2,355,066
Accumulated depreciation
At 31st December 2002 285,657 — 139,023 76,867 86,276 23,188 8,766 83,859 703,636
Changes in exchange rates — — — 579 8,568 39 95 2,127 11,408
Charge for the year 35,863 — 44,037 7,039 17,657 1,645 1,812 6,687 114,740
Disposals (14,074 ) — (14,522 ) — (6,829 ) — (1,866 ) (17,225 ) (54,516 )
At 31st December 2003 307,446 — 168,538 84,485 105,672 24,872 8,807 75,448 775,268
Net book amount
At 31st December 2003 736,366 172,284 274,327 35,693 182,189 128,735 17,333 32,871 1,579,798
At 31st December 2002 643,596 164,836 205,354 33,064 136,777 120,180 19,663 18,968 1,342,438
Net book amount of leased assets
At 31st December 2003 153,073 — 125,867 26,913 77,620 — — 607 384,080
At 31st December 2002 — — 156,760 24,181 57,882 — — 465 239,288

85
OO
IL A
NN
UA
L R
EPO
R T 2
003
12. Property, plant and equipment (Continued)
(a) Freehold land and buildings include the investment property, “Wall Street Plaza”, a commercial property located at 88,
Pine Street, New York, USA. The property is situated on three parcels of freehold land, two of which are wholly owned by
the Group. The freehold interest in the third parcel, representing approximately 10% of the site, is owned 50% by the
Group and under a long-term lease to the Group expiring in the year 2066 (2002: 2 parcels of about 34% were held under
leases). The property is stated at Directors’ valuation of US$100.0 million (2002: US$90.0 million), by reference to a
professional valuation made in December 2003 on an open market basis.
(b) Container vessels include three (2002: three) vessels which were previously operated under finance lease terms and direct
ownership was acquired by the Group in May 1990. These vessels are carried at Directors’ valuation, representing the
then purchase consideration which was determined by reference to professional valuations on a cum-charter open market
basis of US$87.0 million. Subsequent revaluations of these vessels are not required to be made in accordance with paragraph
72 of Hong Kong Statement of Standard Accounting Practice 17 “Property, plant and equipment”. Had these vessels been
carried at cost, the net book amount of the container vessels would have been reduced by US$2.7 million (2002: US$3.1
million).
(c) Apart from the investment property and container vessels mentioned under (a) and (b) above, all other property, plant
and equipment are carried at cost.
(d) The aggregate net book amount of assets pledged as securities for loans amounts to US$999.0 million (2002: US$976.7
million). Specific charges on vessels of the Group include legal mortgages and assignments of insurance claims and charterhire
income relating to these vessels.
(e) Interest costs of US$1.6 million (2002: US$1.7 million) during the year were capitalised as part of vessels under construction.
13. Subsidiaries
US$’000 2003 2002
Company
Unlisted shares, at cost less provision 169,482 169,482
Amounts receivable 688,368 465,994
Amounts payable (528,013) (217,098)
329,837 418,378
Particulars of the principal subsidiaries at 31st December 2003 are shown on pages 114 to 123. The amounts receivable and
payable are unsecured, interest free and have no specific repayment terms.
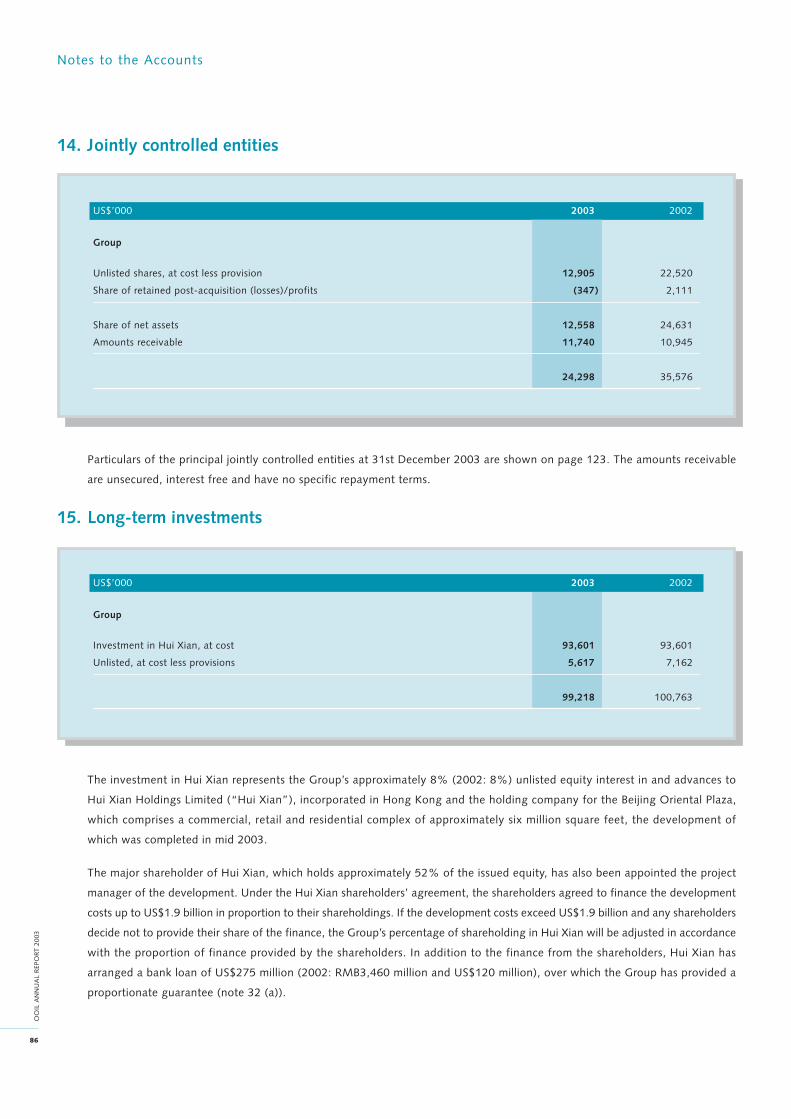
Notes to the Accounts
86
OO
IL A
NN
UA
L R
EPO
RT 2
003
14. Jointly controlled entities
US$’000 2003 2002
Group
Unlisted shares, at cost less provision 12,905 22,520
Share of retained post-acquisition (losses)/profits (347) 2,111
Share of net assets 12,558 24,631
Amounts receivable 11,740 10,945
24,298 35,576
Particulars of the principal jointly controlled entities at 31st December 2003 are shown on page 123. The amounts receivable
are unsecured, interest free and have no specific repayment terms.
15. Long-term investments
US$’000 2003 2002
Group
Investment in Hui Xian, at cost 93,601 93,601
Unlisted, at cost less provisions 5,617 7,162
99,218 100,763
The investment in Hui Xian represents the Group’s approximately 8% (2002: 8%) unlisted equity interest in and advances to
Hui Xian Holdings Limited (“Hui Xian”), incorporated in Hong Kong and the holding company for the Beijing Oriental Plaza,
which comprises a commercial, retail and residential complex of approximately six million square feet, the development of
which was completed in mid 2003.
The major shareholder of Hui Xian, which holds approximately 52% of the issued equity, has also been appointed the project
manager of the development. Under the Hui Xian shareholders’ agreement, the shareholders agreed to finance the development
costs up to US$1.9 billion in proportion to their shareholdings. If the development costs exceed US$1.9 billion and any shareholders
decide not to provide their share of the finance, the Group’s percentage of shareholding in Hui Xian will be adjusted in accordance
with the proportion of finance provided by the shareholders. In addition to the finance from the shareholders, Hui Xian has
arranged a bank loan of US$275 million (2002: RMB3,460 million and US$120 million), over which the Group has provided a
proportionate guarantee (note 32 (a)).
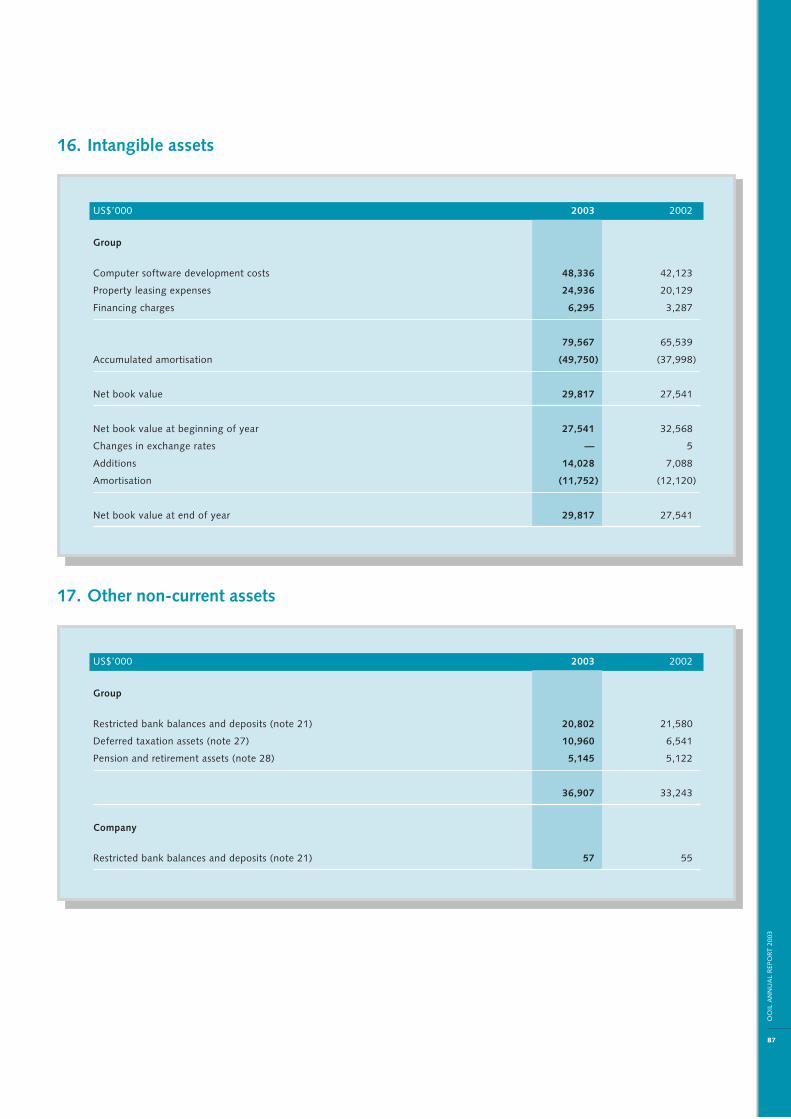
87
OO
IL A
NN
UA
L R
EPO
R T 2
003
16. Intangible assets
US$’000 2003 2002
Group
Computer software development costs 48,336 42,123
Property leasing expenses 24,936 20,129
Financing charges 6,295 3,287
79,567 65,539
Accumulated amortisation (49,750) (37,998)
Net book value 29,817 27,541
Net book value at beginning of year 27,541 32,568
Changes in exchange rates — 5
Additions 14,028 7,088
Amortisation (11,752) (12,120)
Net book value at end of year 29,817 27,541
17. Other non-current assets
US$’000 2003 2002
Group
Restricted bank balances and deposits (note 21) 20,802 21,580
Deferred taxation assets (note 27) 10,960 6,541
Pension and retirement assets (note 28) 5,145 5,122
36,907 33,243
Company
Restricted bank balances and deposits (note 21) 57 55
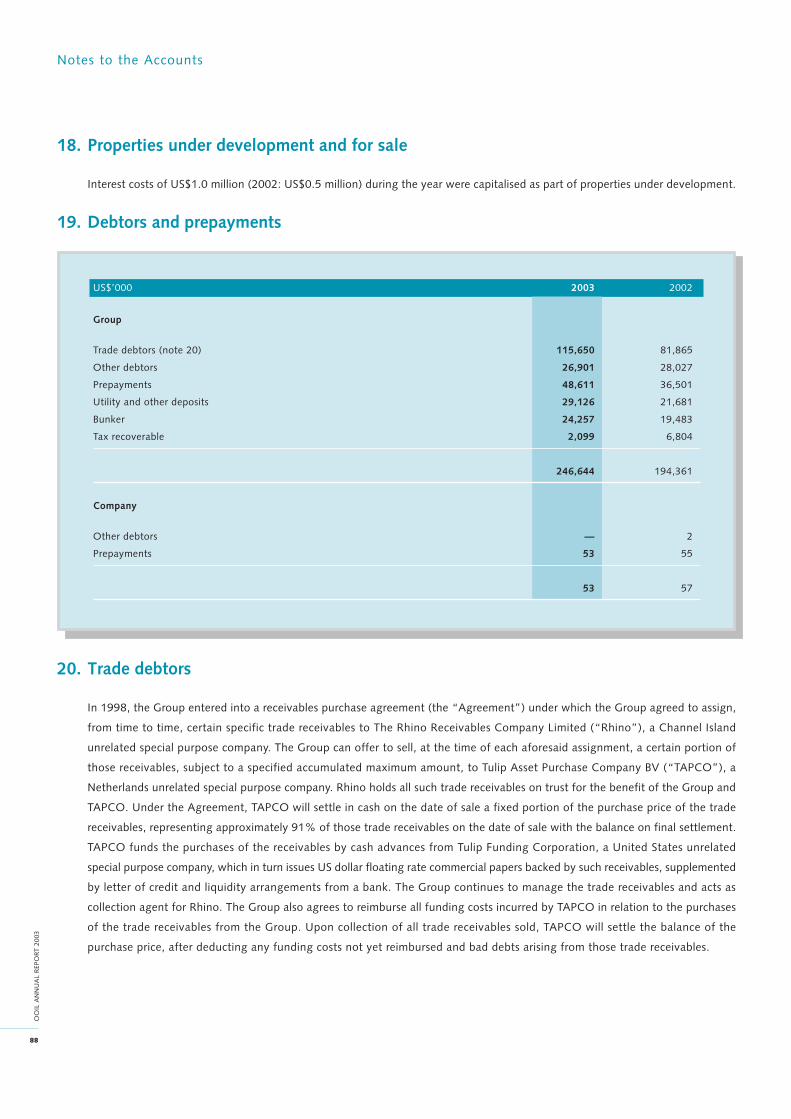
Notes to the Accounts
88
OO
IL A
NN
UA
L R
EPO
RT 2
003
18. Properties under development and for sale
Interest costs of US$1.0 million (2002: US$0.5 million) during the year were capitalised as part of properties under development.
19. Debtors and prepayments
US$’000 2003 2002
Group
Trade debtors (note 20) 115,650 81,865
Other debtors 26,901 28,027
Prepayments 48,611 36,501
Utility and other deposits 29,126 21,681
Bunker 24,257 19,483
Tax recoverable 2,099 6,804
246,644 194,361
Company
Other debtors — 2
Prepayments 53 55
53 57
20. Trade debtors
In 1998, the Group entered into a receivables purchase agreement (the “Agreement”) under which the Group agreed to assign,
from time to time, certain specific trade receivables to The Rhino Receivables Company Limited (“Rhino”), a Channel Island
unrelated special purpose company. The Group can offer to sell, at the time of each aforesaid assignment, a certain portion of
those receivables, subject to a specified accumulated maximum amount, to Tulip Asset Purchase Company BV (“TAPCO”), a
Netherlands unrelated special purpose company. Rhino holds all such trade receivables on trust for the benefit of the Group and
TAPCO. Under the Agreement, TAPCO will settle in cash on the date of sale a fixed portion of the purchase price of the trade
receivables, representing approximately 91% of those trade receivables on the date of sale with the balance on final settlement.
TAPCO funds the purchases of the receivables by cash advances from Tulip Funding Corporation, a United States unrelated
special purpose company, which in turn issues US dollar floating rate commercial papers backed by such receivables, supplemented
by letter of credit and liquidity arrangements from a bank. The Group continues to manage the trade receivables and acts as
collection agent for Rhino. The Group also agrees to reimburse all funding costs incurred by TAPCO in relation to the purchases
of the trade receivables from the Group. Upon collection of all trade receivables sold, TAPCO will settle the balance of the
purchase price, after deducting any funding costs not yet reimbursed and bad debts arising from those trade receivables.
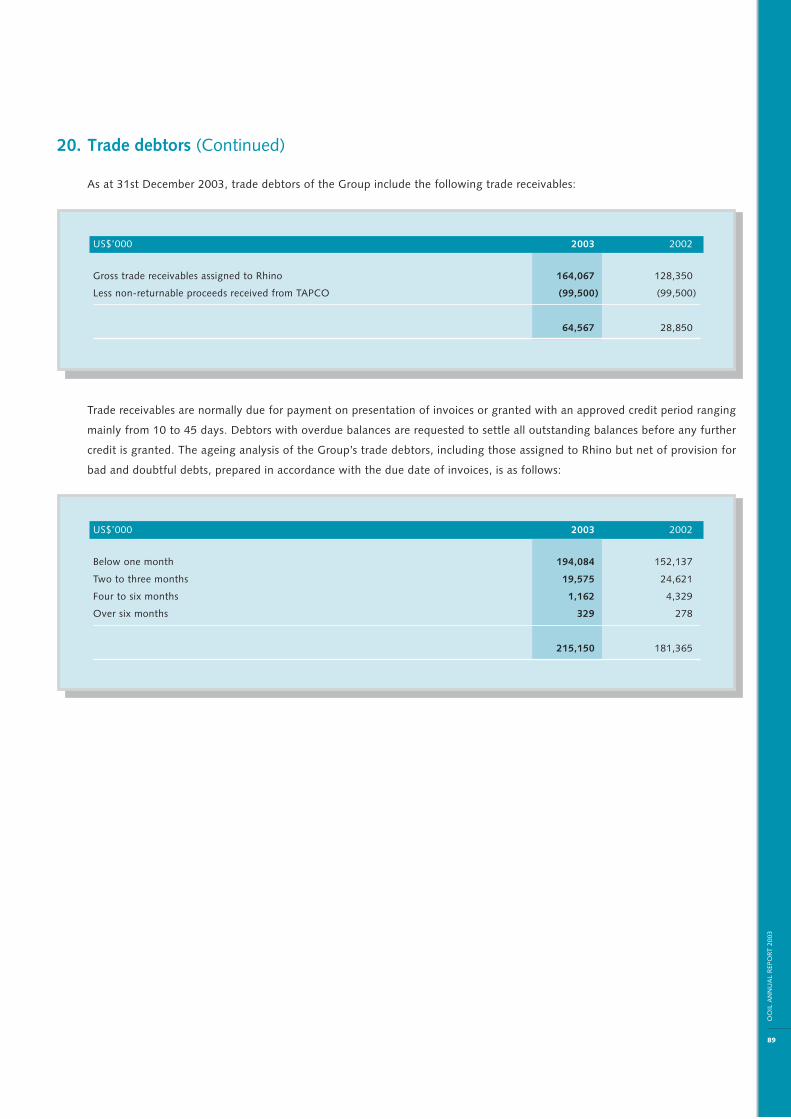
89
OO
IL A
NN
UA
L R
EPO
R T 2
003
20. Trade debtors (Continued)
As at 31st December 2003, trade debtors of the Group include the following trade receivables:
US$’000 2003 2002
Gross trade receivables assigned to Rhino 164,067 128,350
Less non-returnable proceeds received from TAPCO (99,500) (99,500)
64,567 28,850
Trade receivables are normally due for payment on presentation of invoices or granted with an approved credit period ranging
mainly from 10 to 45 days. Debtors with overdue balances are requested to settle all outstanding balances before any further
credit is granted. The ageing analysis of the Group’s trade debtors, including those assigned to Rhino but net of provision for
bad and doubtful debts, prepared in accordance with the due date of invoices, is as follows:
US$’000 2003 2002
Below one month 194,084 152,137
Two to three months 19,575 24,621
Four to six months 1,162 4,329
Over six months 329 278
215,150 181,365

Notes to the Accounts
90
OO
IL A
NN
UA
L R
EPO
RT 2
003
21. Bank balances and deposits
US$’000 2003 2002
Group
Restricted 127,825 153,312
Not restricted 536,791 304,858
664,616 458,170
Less restricted and included in
Non-current assets (note 17) (20,802) (21,580)
Non-current liabilities (note 26) (91,975) (100,000)
551,839 336,590
Company
Restricted 57 55
Not restricted 15,728 18,398
15,785 18,453
Less restricted and included in
Non-current assets (note 17) (57) (55)
15,728 18,398
Restricted bank balances and deposits are funds which are pledged as securities for banking facilities and performance under
leasing arrangements or required to be utilised for specific purposes. A restricted deposit of the Group amounting to US$15.0
million (2002: US$30.4 million), which has been pledged as security for a short-term bank loan of the same amount (note 23),
is not classified as a non-current asset.
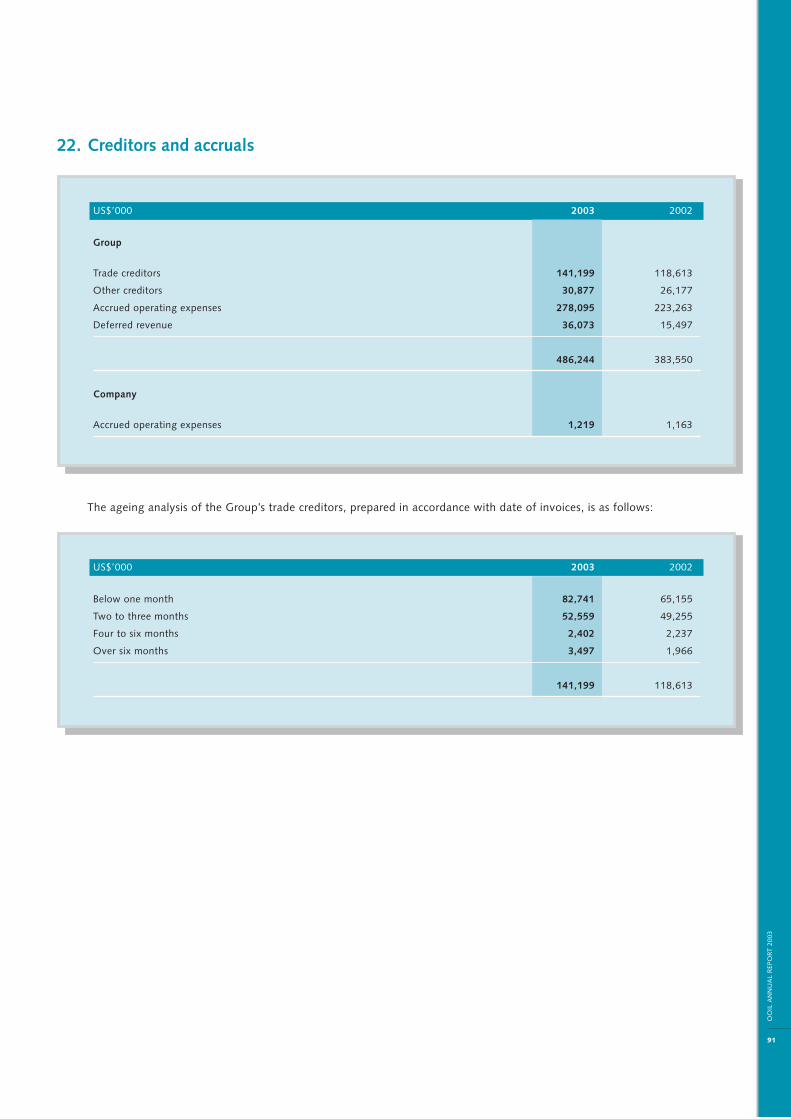
91
OO
IL A
NN
UA
L R
EPO
R T 2
003
22. Creditors and accruals
US$’000 2003 2002
Group
Trade creditors 141,199 118,613
Other creditors 30,877 26,177
Accrued operating expenses 278,095 223,263
Deferred revenue 36,073 15,497
486,244 383,550
Company
Accrued operating expenses 1,219 1,163
The ageing analysis of the Group’s trade creditors, prepared in accordance with date of invoices, is as follows:
US$’000 2003 2002
Below one month 82,741 65,155
Two to three months 52,559 49,255
Four to six months 2,402 2,237
Over six months 3,497 1,966
141,199 118,613

Notes to the Accounts
92
OO
IL A
NN
UA
L R
EPO
RT 2
003
23. Bank overdrafts and short-term loans
US$’000 2003 2002
Group
Short-term loans
Secured 29,283 35,998
Unsecured 9,625 8,000
Bank overdrafts
Unsecured 50 16
38,958 44,014
A secured bank loan of US$15.0 million (2002: US$30.4 million) is secured by a bank deposit of the same amount (note 21).
24. Long-term liabilities
US$’000 2003 2002
Group
Bank loans
Secured 594,334 590,788
Unsecured 51,405 —
Other loans wholly repayable within five years
Secured 15,541 21,606
Unsecured 2,580 —
Finance lease obligations
Wholly payable within five years 190,317 189,079
Not wholly payable within five years 205,027 50,121
1,059,204 851,594
Current portion included in current liabilities (218,527) (168,835)
840,677 682,759
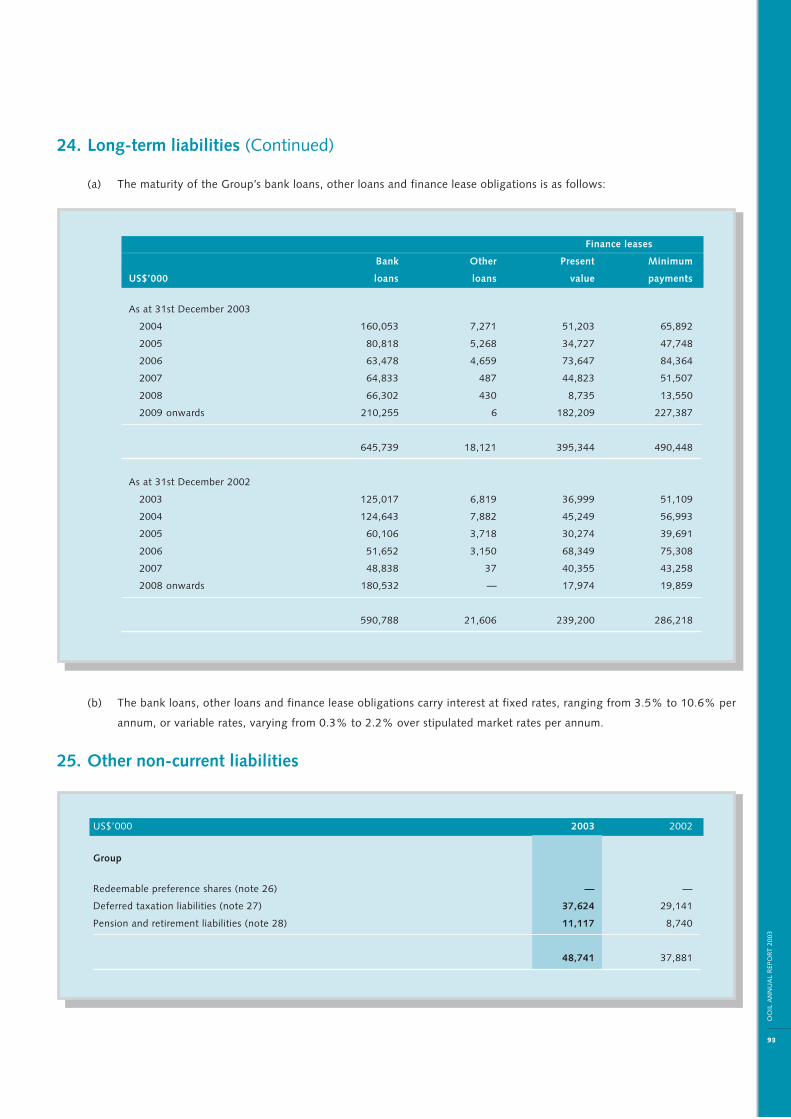
93
OO
IL A
NN
UA
L R
EPO
R T 2
003
24. Long-term liabilities (Continued)
(a) The maturity of the Group’s bank loans, other loans and finance lease obligations is as follows:
Finance leases
Bank Other Present Minimum
US$’000 loans loans value payments
As at 31st December 2003
2004 160,053 7,271 51,203 65,892
2005 80,818 5,268 34,727 47,748
2006 63,478 4,659 73,647 84,364
2007 64,833 487 44,823 51,507
2008 66,302 430 8,735 13,550
2009 onwards 210,255 6 182,209 227,387
645,739 18,121 395,344 490,448
As at 31st December 2002
2003 125,017 6,819 36,999 51,109
2004 124,643 7,882 45,249 56,993
2005 60,106 3,718 30,274 39,691
2006 51,652 3,150 68,349 75,308
2007 48,838 37 40,355 43,258
2008 onwards 180,532 — 17,974 19,859
590,788 21,606 239,200 286,218
(b) The bank loans, other loans and finance lease obligations carry interest at fixed rates, ranging from 3.5% to 10.6% per
annum, or variable rates, varying from 0.3% to 2.2% over stipulated market rates per annum.
25. Other non-current liabilities
US$’000 2003 2002
Group
Redeemable preference shares (note 26) — —
Deferred taxation liabilities (note 27) 37,624 29,141
Pension and retirement liabilities (note 28) 11,117 8,740
48,741 37,881

Notes to the Accounts
94
OO
IL A
NN
UA
L R
EPO
RT 2
003
26. Redeemable preference shares
US$’000 2003 2002
Group
Redeemable preference shares and premium 91,975 100,000
Less restricted deposits under the put options (note 21) (91,975) (100,000)
— —
In June 2002, the Group entered into, inter alia, a Shareholders Agreement with, inter alios, two unrelated third parties (together
the “Preference Shareholders”) in relation to a subsidiary. Under the Shareholders Agreement, the Preference Shareholders
acquired from the Group 90 cumulative preference shares (the “Preference Shares”) of €150 each in this subsidiary and contributed
an aggregate of US$100.0 million less the nominal value of the Preference Shares as share premium (the “Premium”). The
Preference Shareholders are entitled to receive annual dividends of 7.08% per annum on the aggregate amount of the nominal
value of the Preference Shares and Premium (collectively “Preference Shares Contributions”) outstanding from time to time. To
the extent permitted by local law, the Preference Shareholders may propose a repayment of the Premium annually, provided
that such repayment does not exceed a maximum percentage specified in the Shareholders Agreement. During the year, Premium
amounting to US$8.0 million was repaid to the Preference Shareholders.
The Preference Shareholders have been granted irrevocable options to sell their Preference Shares to the Group under certain
circumstances. As securities for the options, the Group has placed certain bank deposits (the “Deposits”) equivalent to the
outstanding Preference Shares Contributions, amounting to US$92.0 million (2002: US$100.0 million), and has pledged the
Deposits in favour of the Preference Shareholders. The consideration for the Preference Shares under the options is equal to the
Preference Shares Contributions outstanding plus the accrued interest from the Deposits. The Group has also given irrevocable
instructions to the banks to pay the Deposits and accrued interest to the Preference Shareholders upon receiving relevant
notices from them. In view of the various arrangements, the Directors consider it fair and appropriate to deduct the Deposits
from the redeemable Preference Shares Contributions in the accounts.
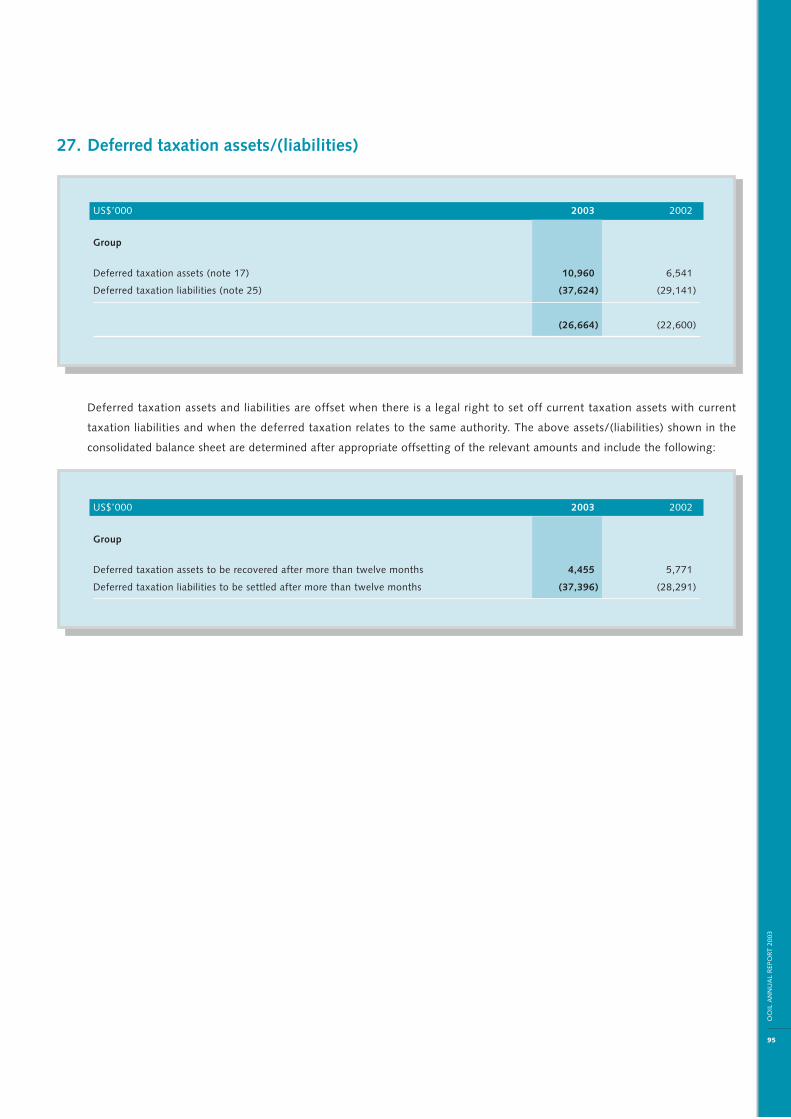
95
OO
IL A
NN
UA
L R
EPO
R T 2
003
27. Deferred taxation assets/(liabilities)
US$’000 2003 2002
Group
Deferred taxation assets (note 17) 10,960 6,541
Deferred taxation liabilities (note 25) (37,624) (29,141)
(26,664) (22,600)
Deferred taxation assets and liabilities are offset when there is a legal right to set off current taxation assets with current
taxation liabilities and when the deferred taxation relates to the same authority. The above assets/(liabilities) shown in the
consolidated balance sheet are determined after appropriate offsetting of the relevant amounts and include the following:
US$’000 2003 2002
Group
Deferred taxation assets to be recovered after more than twelve months 4,455 5,771
Deferred taxation liabilities to be settled after more than twelve months (37,396) (28,291)

Notes to the Accounts
96
OO
IL A
NN
UA
L R
EPO
RT 2
003
27. Deferred taxation assets/(liabilities) (Continued)
Deferred taxation is calculated in full on temporary differences under the liability method using applicable tax rates prevailing in
the countries in which the Group operates. Movements on the deferred taxation account are as follows:
Accelerated
depreciation Revenue Tax
US$’000 allowances expenditure losses Pensions Total
Deferred taxation assets
At 31st December 2001 590 5,077 2,037 1,857 9,561
Changes in exchange rates — (2) — — (2)
Credited/(charged) to
profit and loss account (497) 479 1,095 (905) 172
At 31st December 2002 93 5,554 3,132 952 9,731
Changes in exchange rates — 255 8 — 263
Credited/(charged) to
profit and loss account (93) 1,521 740 589 2,757
At 31st December 2003 — 7,330 3,880 1,541 12,751
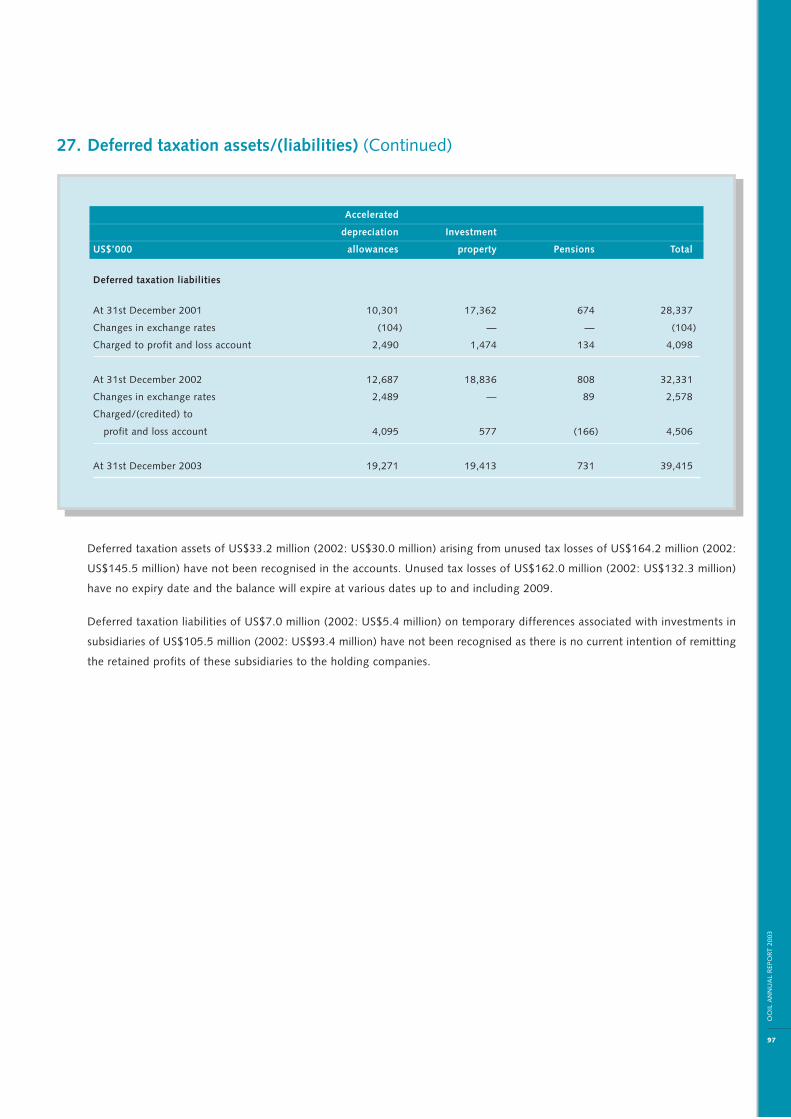
97
OO
IL A
NN
UA
L R
EPO
R T 2
003
27. Deferred taxation assets/(liabilities) (Continued)
Accelerated
depreciation Investment
US$’000 allowances property Pensions Total
Deferred taxation liabilities
At 31st December 2001 10,301 17,362 674 28,337
Changes in exchange rates (104) — — (104)
Charged to profit and loss account 2,490 1,474 134 4,098
At 31st December 2002 12,687 18,836 808 32,331
Changes in exchange rates 2,489 — 89 2,578
Charged/(credited) to
profit and loss account 4,095 577 (166) 4,506
At 31st December 2003 19,271 19,413 731 39,415
Deferred taxation assets of US$33.2 million (2002: US$30.0 million) arising from unused tax losses of US$164.2 million (2002:
US$145.5 million) have not been recognised in the accounts. Unused tax losses of US$162.0 million (2002: US$132.3 million)
have no expiry date and the balance will expire at various dates up to and including 2009.
Deferred taxation liabilities of US$7.0 million (2002: US$5.4 million) on temporary differences associated with investments in
subsidiaries of US$105.5 million (2002: US$93.4 million) have not been recognised as there is no current intention of remitting
the retained profits of these subsidiaries to the holding companies.
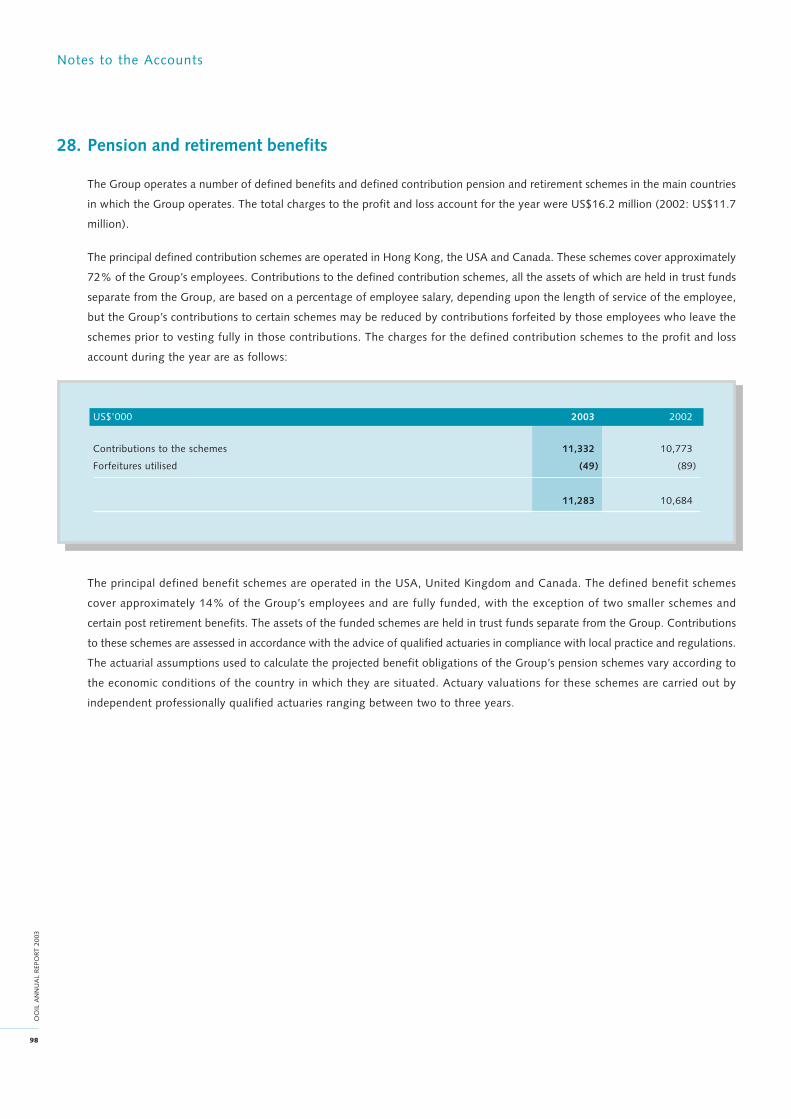
Notes to the Accounts
98
OO
IL A
NN
UA
L R
EPO
RT 2
003
28. Pension and retirement benefits
The Group operates a number of defined benefits and defined contribution pension and retirement schemes in the main countries
in which the Group operates. The total charges to the profit and loss account for the year were US$16.2 million (2002: US$11.7
million).
The principal defined contribution schemes are operated in Hong Kong, the USA and Canada. These schemes cover approximately
72% of the Group’s employees. Contributions to the defined contribution schemes, all the assets of which are held in trust funds
separate from the Group, are based on a percentage of employee salary, depending upon the length of service of the employee,
but the Group’s contributions to certain schemes may be reduced by contributions forfeited by those employees who leave the
schemes prior to vesting fully in those contributions. The charges for the defined contribution schemes to the profit and loss
account during the year are as follows:
US$’000 2003 2002
Contributions to the schemes 11,332 10,773
Forfeitures utilised (49) (89)
11,283 10,684
The principal defined benefit schemes are operated in the USA, United Kingdom and Canada. The defined benefit schemes
cover approximately 14% of the Group’s employees and are fully funded, with the exception of two smaller schemes and
certain post retirement benefits. The assets of the funded schemes are held in trust funds separate from the Group. Contributions
to these schemes are assessed in accordance with the advice of qualified actuaries in compliance with local practice and regulations.
The actuarial assumptions used to calculate the projected benefit obligations of the Group’s pension schemes vary according to
the economic conditions of the country in which they are situated. Actuary valuations for these schemes are carried out by
independent professionally qualified actuaries ranging between two to three years.
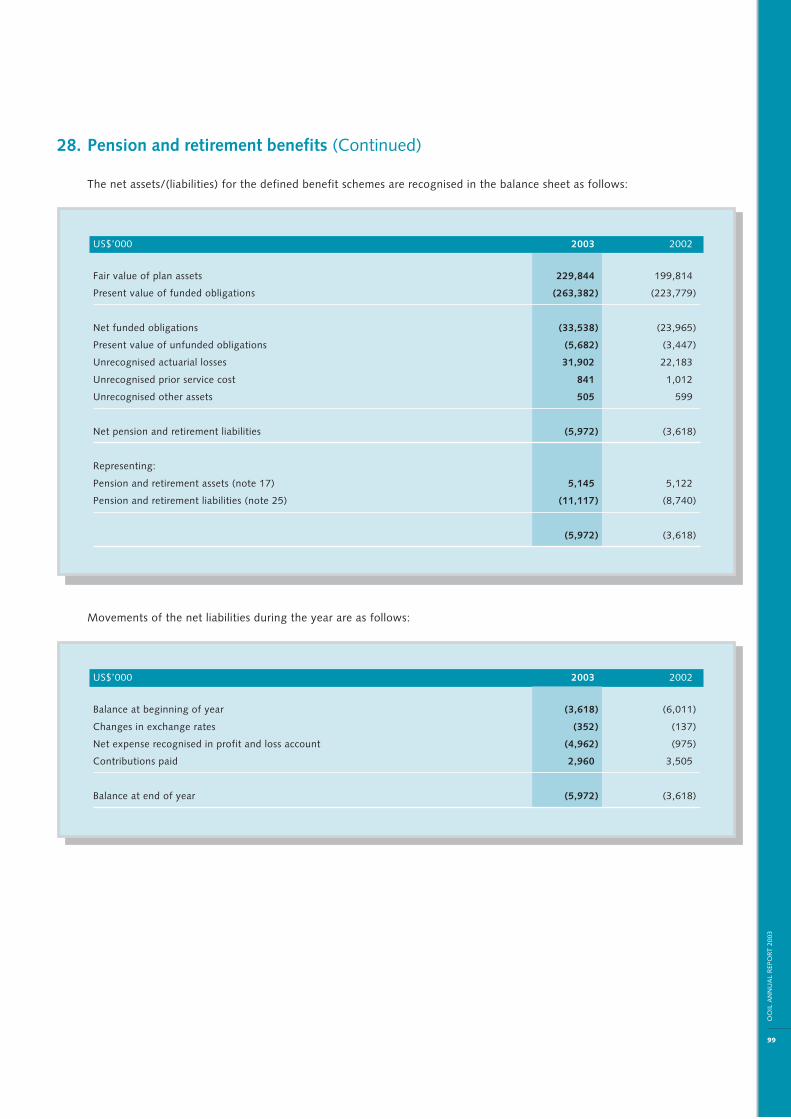
99
OO
IL A
NN
UA
L R
EPO
R T 2
003
28. Pension and retirement benefits (Continued)
The net assets/(liabilities) for the defined benefit schemes are recognised in the balance sheet as follows:
US$’000 2003 2002
Fair value of plan assets 229,844 199,814
Present value of funded obligations (263,382) (223,779)
Net funded obligations (33,538) (23,965)
Present value of unfunded obligations (5,682) (3,447)
Unrecognised actuarial losses 31,902 22,183
Unrecognised prior service cost 841 1,012
Unrecognised other assets 505 599
Net pension and retirement liabilities (5,972) (3,618)
Representing:
Pension and retirement assets (note 17) 5,145 5,122
Pension and retirement liabilities (note 25) (11,117) (8,740)
(5,972) (3,618)
Movements of the net liabilities during the year are as follows:
US$’000 2003 2002
Balance at beginning of year (3,618) (6,011)
Changes in exchange rates (352) (137)
Net expense recognised in profit and loss account (4,962) (975)
Contributions paid 2,960 3,505
Balance at end of year (5,972) (3,618)
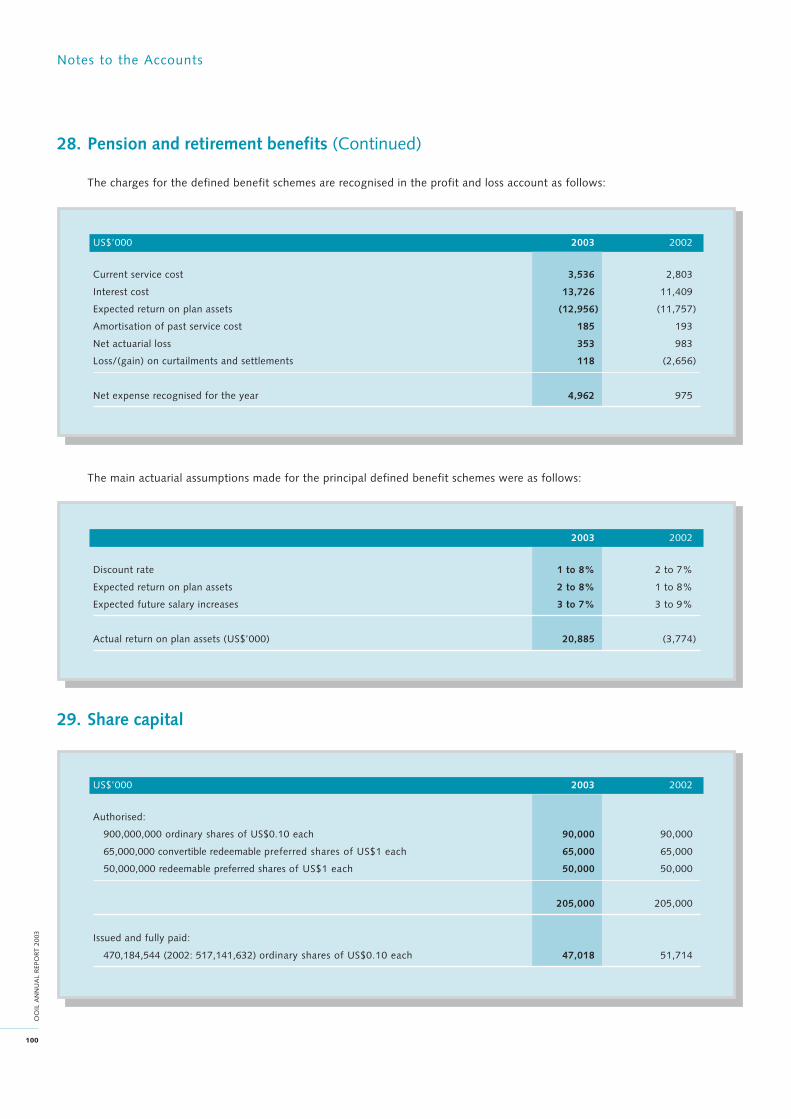
Notes to the Accounts
100
OO
IL A
NN
UA
L R
EPO
RT 2
003
28. Pension and retirement benefits (Continued)
The charges for the defined benefit schemes are recognised in the profit and loss account as follows:
US$’000 2003 2002
Current service cost 3,536 2,803
Interest cost 13,726 11,409
Expected return on plan assets (12,956) (11,757)
Amortisation of past service cost 185 193
Net actuarial loss 353 983
Loss/(gain) on curtailments and settlements 118 (2,656)
Net expense recognised for the year 4,962 975
The main actuarial assumptions made for the principal defined benefit schemes were as follows:
2003 2002
Discount rate 1 to 8% 2 to 7%
Expected return on plan assets 2 to 8% 1 to 8%
Expected future salary increases 3 to 7% 3 to 9%
Actual return on plan assets (US$’000) 20,885 (3,774)
29. Share capital
US$’000 2003 2002
Authorised:
900,000,000 ordinary shares of US$0.10 each 90,000 90,000
65,000,000 convertible redeemable preferred shares of US$1 each 65,000 65,000
50,000,000 redeemable preferred shares of US$1 each 50,000 50,000
205,000 205,000
Issued and fully paid:
470,184,544 (2002: 517,141,632) ordinary shares of US$0.10 each 47,018 51,714
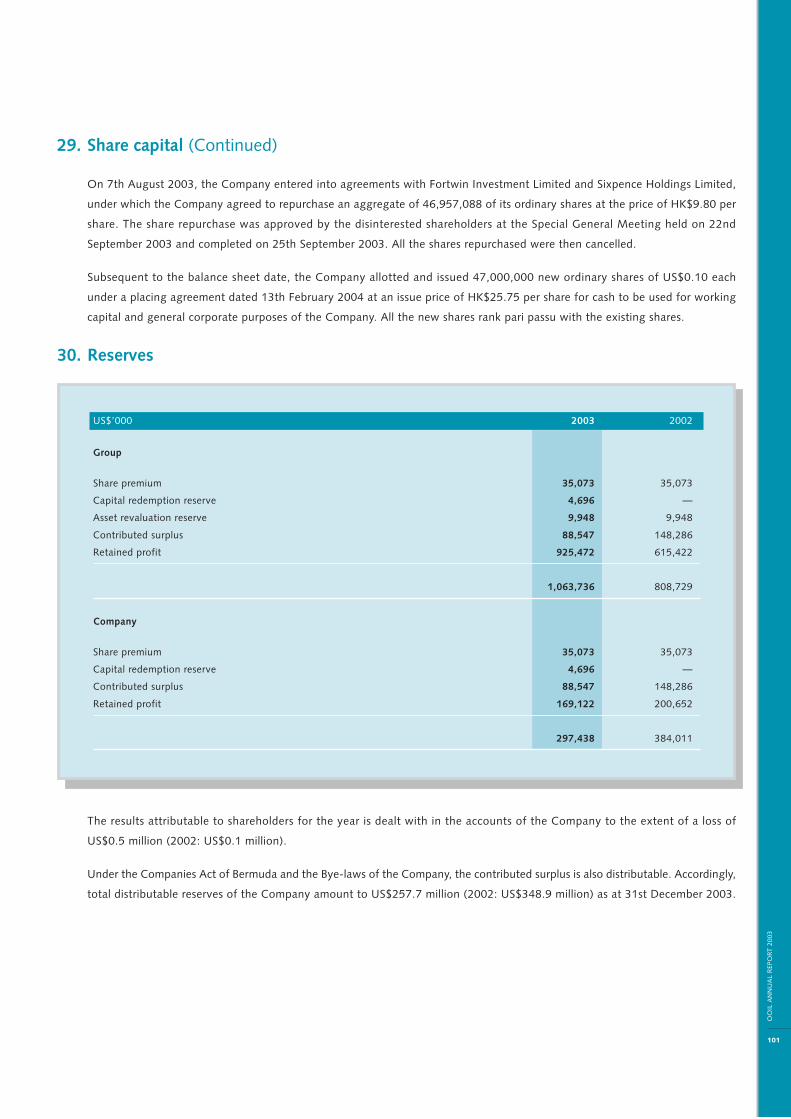
101
OO
IL A
NN
UA
L R
EPO
R T 2
003
29. Share capital (Continued)
On 7th August 2003, the Company entered into agreements with Fortwin Investment Limited and Sixpence Holdings Limited,
under which the Company agreed to repurchase an aggregate of 46,957,088 of its ordinary shares at the price of HK$9.80 per
share. The share repurchase was approved by the disinterested shareholders at the Special General Meeting held on 22nd
September 2003 and completed on 25th September 2003. All the shares repurchased were then cancelled.
Subsequent to the balance sheet date, the Company allotted and issued 47,000,000 new ordinary shares of US$0.10 each
under a placing agreement dated 13th February 2004 at an issue price of HK$25.75 per share for cash to be used for working
capital and general corporate purposes of the Company. All the new shares rank pari passu with the existing shares.
30. Reserves
US$’000 2003 2002
Group
Share premium 35,073 35,073
Capital redemption reserve 4,696 —
Asset revaluation reserve 9,948 9,948
Contributed surplus 88,547 148,286
Retained profit 925,472 615,422
1,063,736 808,729
Company
Share premium 35,073 35,073
Capital redemption reserve 4,696 —
Contributed surplus 88,547 148,286
Retained profit 169,122 200,652
297,438 384,011
The results attributable to shareholders for the year is dealt with in the accounts of the Company to the extent of a loss of
US$0.5 million (2002: US$0.1 million).
Under the Companies Act of Bermuda and the Bye-laws of the Company, the contributed surplus is also distributable. Accordingly,
total distributable reserves of the Company amount to US$257.7 million (2002: US$348.9 million) as at 31st December 2003.

Notes to the Accounts
102
OO
IL A
NN
UA
L R
EPO
RT 2
003
31. Commitments
Group
(a) Capital commitments
US$’000 2003 2002
Contracted but not provided for 653,597 533,407
Authorised but not contracted for 214,770 186,173
868,367 719,580
The commitments include the balance of the purchase cost of ten 8,063 TEU container vessels (2002: eight 8,063 TEU and
one 4,402 TEU ice-strengthened container vessels) to be delivered between 2004 to 2007. In March 2002, the Group
entered into agreements under which two 8,063 TEU container vessels will be sold to third parties at considerations equal
to the acquisition costs to the Group upon delivery in 2004. The Group also entered into agreements to bareboat charter
these two vessels under operating lease terms for minimum periods ranging from nine to twelve years from their respective
dates of delivery.

103
OO
IL A
NN
UA
L R
EPO
R T 2
003
31. Commitments (Continued)
Group (Continued)
(b) Operating lease commitments
The future aggregate minimum lease rental expense under non-cancellable operating leases are payable in the following
years:
Vessels and Land and
US$’000 equipment buildings Total
As at 31st December 2003
2004 219,425 41,487 260,912
2005 174,986 36,280 211,266
2006 165,582 31,653 197,235
2007 159,902 31,062 190,964
2008 161,857 30,060 191,917
2009 onwards 995,849 413,386 1,409,235
1,877,601 583,928 2,461,529
As at 31st December 2002
2003 214,171 22,605 236,776
2004 170,958 32,629 203,587
2005 152,757 29,089 181,846
2006 117,473 25,290 142,763
2007 89,437 24,896 114,333
2008 onwards 215,085 399,868 614,953
959,881 534,377 1,494,258
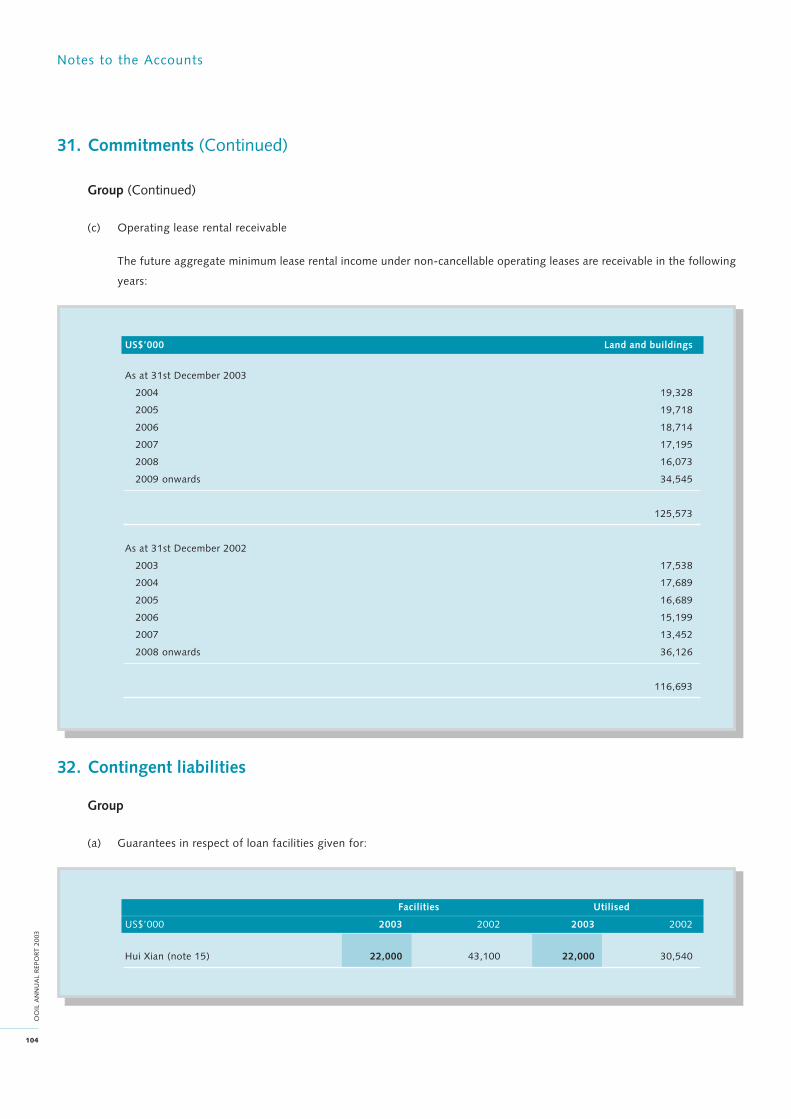
Notes to the Accounts
104
OO
IL A
NN
UA
L R
EPO
RT 2
003
31. Commitments (Continued)
Group (Continued)
(c) Operating lease rental receivable
The future aggregate minimum lease rental income under non-cancellable operating leases are receivable in the following
years:
US$’000 Land and buildings
As at 31st December 2003
2004 19,328
2005 19,718
2006 18,714
2007 17,195
2008 16,073
2009 onwards 34,545
125,573
As at 31st December 2002
2003 17,538
2004 17,689
2005 16,689
2006 15,199
2007 13,452
2008 onwards 36,126
116,693
32. Contingent liabilities
Group
(a) Guarantees in respect of loan facilities given for:
Facilities Utilised
US$’000 2003 2002 2003 2002
Hui Xian (note 15) 22,000 43,100 22,000 30,540

105
OO
IL A
NN
UA
L R
EPO
R T 2
003
32. Contingent liabilities (Continued)
Group (Continued)
(b) Litigation
The Group is a member of the Trans-Atlantic Conference Agreement (“TACA”) and involved in litigation with the European
Commission as more fully described in note 33 (c) to the 2002 Annual Accounts. In September 2003, the European Court
of First Instance delivered its judgement annulling the decisions of the Commission and all the fines imposed on the TACA
parties, including the Group. The Commission has not, so far, lodged any further appeal to the European Court of Justice.
Company
(a) Guarantees in respect of loans, finance lease obligations and bank overdraft facilities given for:
Facilities Utilised
US$’000 2003 2002 2003 2002
Subsidiaries 1,052,136 1,096,260 965,697 785,371
Hui Xian (note 15) 22,000 43,100 22,000 30,540
1,074,136 1,139,360 987,697 815,911
(b) The Company has given guarantees for its subsidiaries in respect of future payment of operating lease rentals amounting
to US$246.3 million (2002: US$266.3 million).
(c) The Company has provided an undertaking to the Foreign Investment Commission of Shanghai Municipal Government
for a subsidiary in respect of its capital contribution for property development projects in the People’s Republic of China.
As at 31st December 2003, the outstanding contribution amounted to US$5.5 million (2002: US$8.5 million).
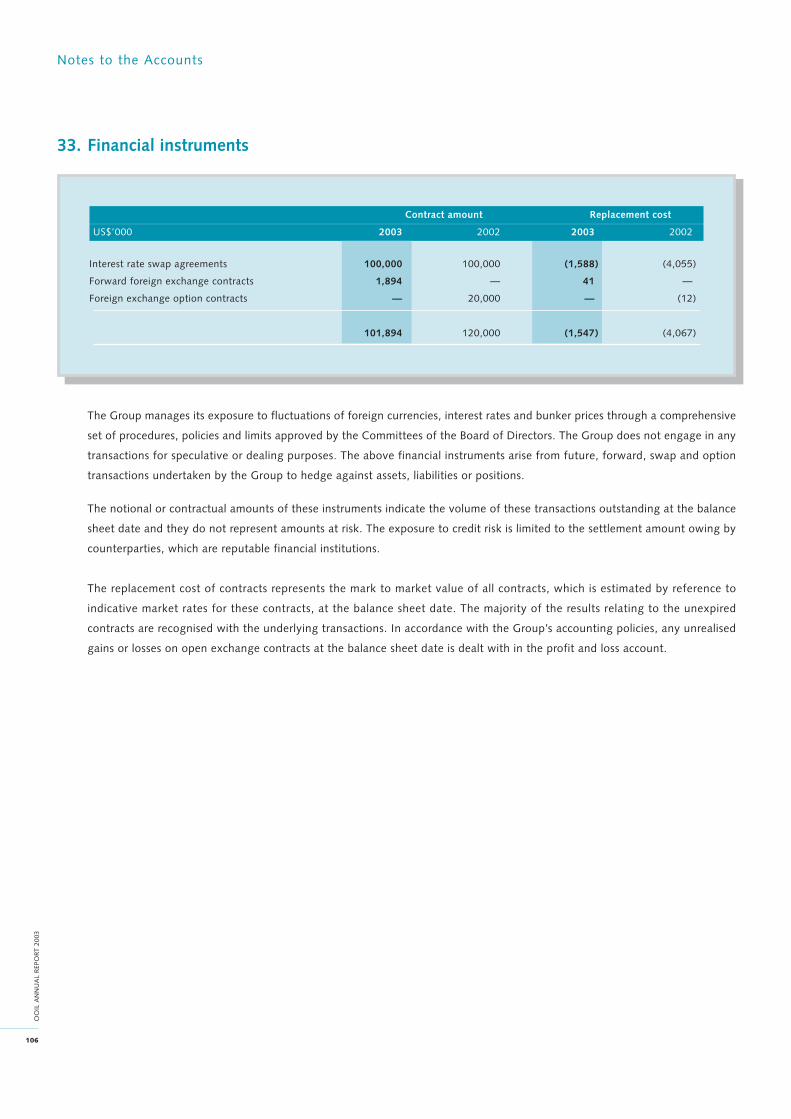
Notes to the Accounts
106
OO
IL A
NN
UA
L R
EPO
RT 2
003
33. Financial instruments
Contract amount Replacement cost
US$’000 2003 2002 2003 2002
Interest rate swap agreements 100,000 100,000 (1,588) (4,055)
Forward foreign exchange contracts 1,894 — 41 —
Foreign exchange option contracts — 20,000 — (12)
101,894 120,000 (1,547) (4,067)
The Group manages its exposure to fluctuations of foreign currencies, interest rates and bunker prices through a comprehensive
set of procedures, policies and limits approved by the Committees of the Board of Directors. The Group does not engage in any
transactions for speculative or dealing purposes. The above financial instruments arise from future, forward, swap and option
transactions undertaken by the Group to hedge against assets, liabilities or positions.
The notional or contractual amounts of these instruments indicate the volume of these transactions outstanding at the balance
sheet date and they do not represent amounts at risk. The exposure to credit risk is limited to the settlement amount owing by
counterparties, which are reputable financial institutions.
The replacement cost of contracts represents the mark to market value of all contracts, which is estimated by reference to
indicative market rates for these contracts, at the balance sheet date. The majority of the results relating to the unexpired
contracts are recognised with the underlying transactions. In accordance with the Group’s accounting policies, any unrealised
gains or losses on open exchange contracts at the balance sheet date is dealt with in the profit and loss account.
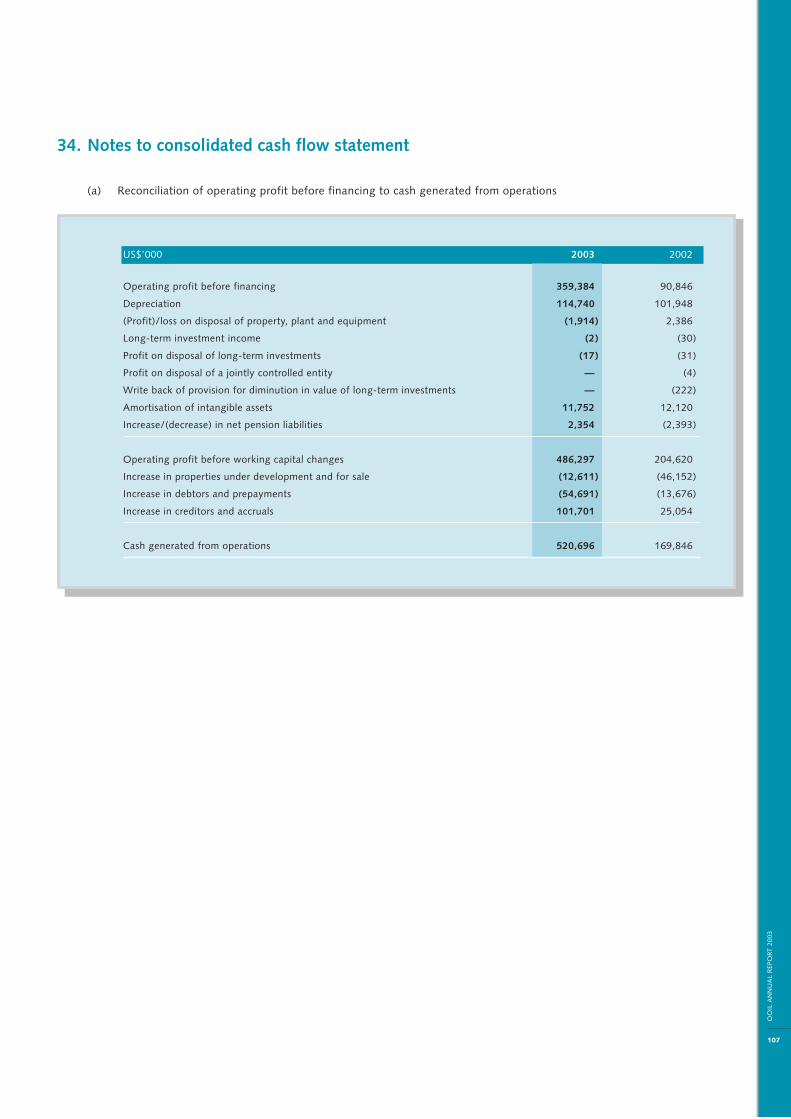
107
OO
IL A
NN
UA
L R
EPO
R T 2
003
34. Notes to consolidated cash flow statement
(a) Reconciliation of operating profit before financing to cash generated from operations
US$’000 2003 2002
Operating profit before financing 359,384 90,846
Depreciation 114,740 101,948
(Profit)/loss on disposal of property, plant and equipment (1,914) 2,386
Long-term investment income (2) (30)
Profit on disposal of long-term investments (17) (31)
Profit on disposal of a jointly controlled entity — (4)
Write back of provision for diminution in value of long-term investments — (222)
Amortisation of intangible assets 11,752 12,120
Increase/(decrease) in net pension liabilities 2,354 (2,393)
Operating profit before working capital changes 486,297 204,620
Increase in properties under development and for sale (12,611) (46,152)
Increase in debtors and prepayments (54,691) (13,676)
Increase in creditors and accruals 101,701 25,054
Cash generated from operations 520,696 169,846
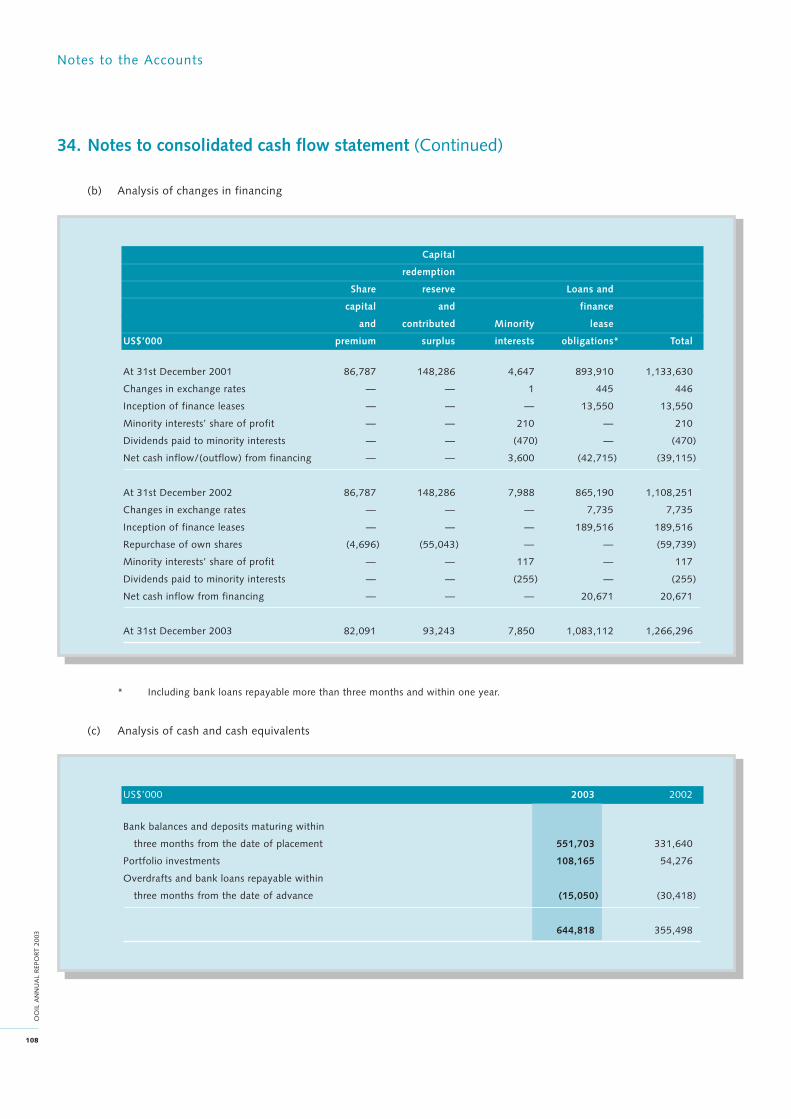
Notes to the Accounts
108
OO
IL A
NN
UA
L R
EPO
RT 2
003
34. Notes to consolidated cash flow statement (Continued)
(b) Analysis of changes in financing
Capital
redemption
Share reserve Loans and
capital and finance
and contributed Minority lease
US$’000 premium surplus interests obligations* Total
At 31st December 2001 86,787 148,286 4,647 893,910 1,133,630
Changes in exchange rates — — 1 445 446
Inception of finance leases — — — 13,550 13,550
Minority interests’ share of profit — — 210 — 210
Dividends paid to minority interests — — (470) — (470)
Net cash inflow/(outflow) from financing — — 3,600 (42,715) (39,115)
At 31st December 2002 86,787 148,286 7,988 865,190 1,108,251
Changes in exchange rates — — — 7,735 7,735
Inception of finance leases — — — 189,516 189,516
Repurchase of own shares (4,696) (55,043) — — (59,739)
Minority interests’ share of profit — — 117 — 117
Dividends paid to minority interests — — (255) — (255)
Net cash inflow from financing — — — 20,671 20,671
At 31st December 2003 82,091 93,243 7,850 1,083,112 1,266,296
* Including bank loans repayable more than three months and within one year.
(c) Analysis of cash and cash equivalents
US$’000 2003 2002
Bank balances and deposits maturing within
three months from the date of placement 551,703 331,640
Portfolio investments 108,165 54,276
Overdrafts and bank loans repayable within
three months from the date of advance (15,050) (30,418)
644,818 355,498
109
OO
IL A
NN
UA
L R
EPO
R T 2
003
35. Subsequent event
On 20th February 2004, the Company allotted and issued 47,000,000 new ordinary shares of US$0.10 each at an issue price of
HK$25.75 per share for cash to be used for working capital and general corporate purposes of the Company.
36. Approval of accounts
The accounts were approved by the Board of Directors on 19th March 2004.
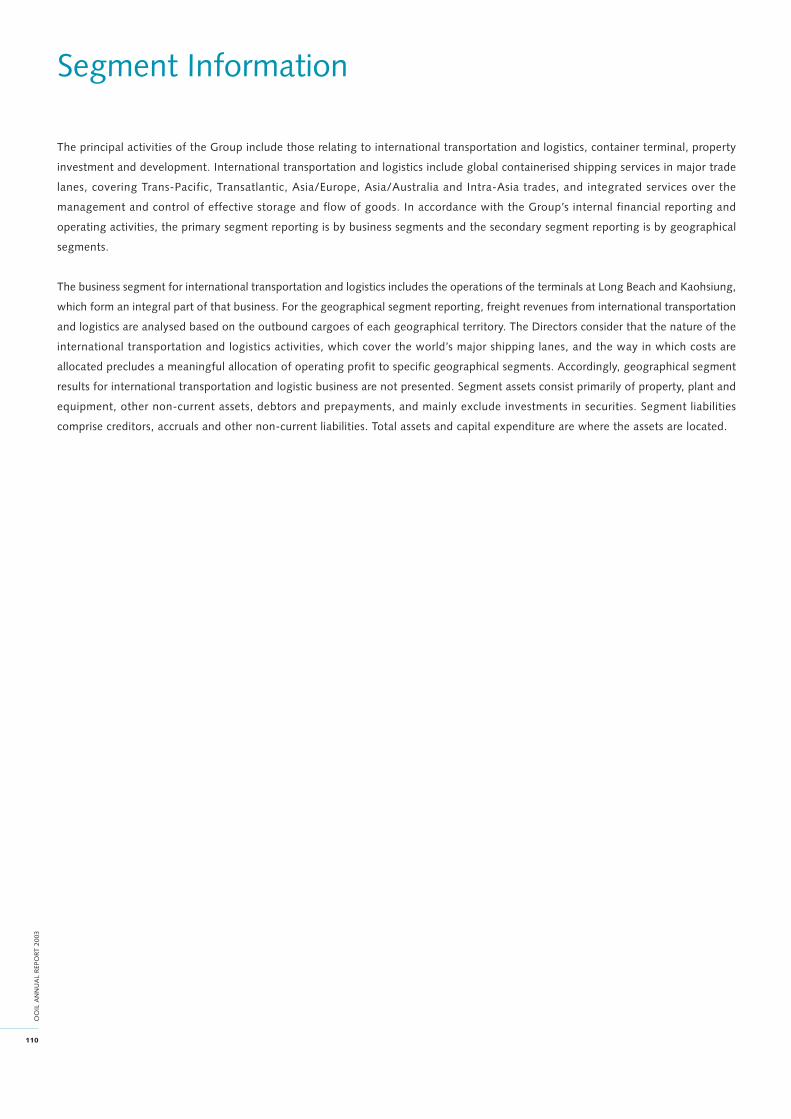
Segment Information
110
OO
IL A
NN
UA
L R
EPO
RT 2
003
The principal activities of the Group include those relating to international transportation and logistics, container terminal, property
investment and development. International transportation and logistics include global containerised shipping services in major trade
lanes, covering Trans-Pacific, Transatlantic, Asia/Europe, Asia/Australia and Intra-Asia trades, and integrated services over the
management and control of effective storage and flow of goods. In accordance with the Group’s internal financial reporting and
operating activities, the primary segment reporting is by business segments and the secondary segment reporting is by geographical
segments.
The business segment for international transportation and logistics includes the operations of the terminals at Long Beach and Kaohsiung,
which form an integral part of that business. For the geographical segment reporting, freight revenues from international transportation
and logistics are analysed based on the outbound cargoes of each geographical territory. The Directors consider that the nature of the
international transportation and logistics activities, which cover the world’s major shipping lanes, and the way in which costs are
allocated precludes a meaningful allocation of operating profit to specific geographical segments. Accordingly, geographical segment
results for international transportation and logistic business are not presented. Segment assets consist primarily of property, plant and
equipment, other non-current assets, debtors and prepayments, and mainly exclude investments in securities. Segment liabilities
comprise creditors, accruals and other non-current liabilities. Total assets and capital expenditure are where the assets are located.
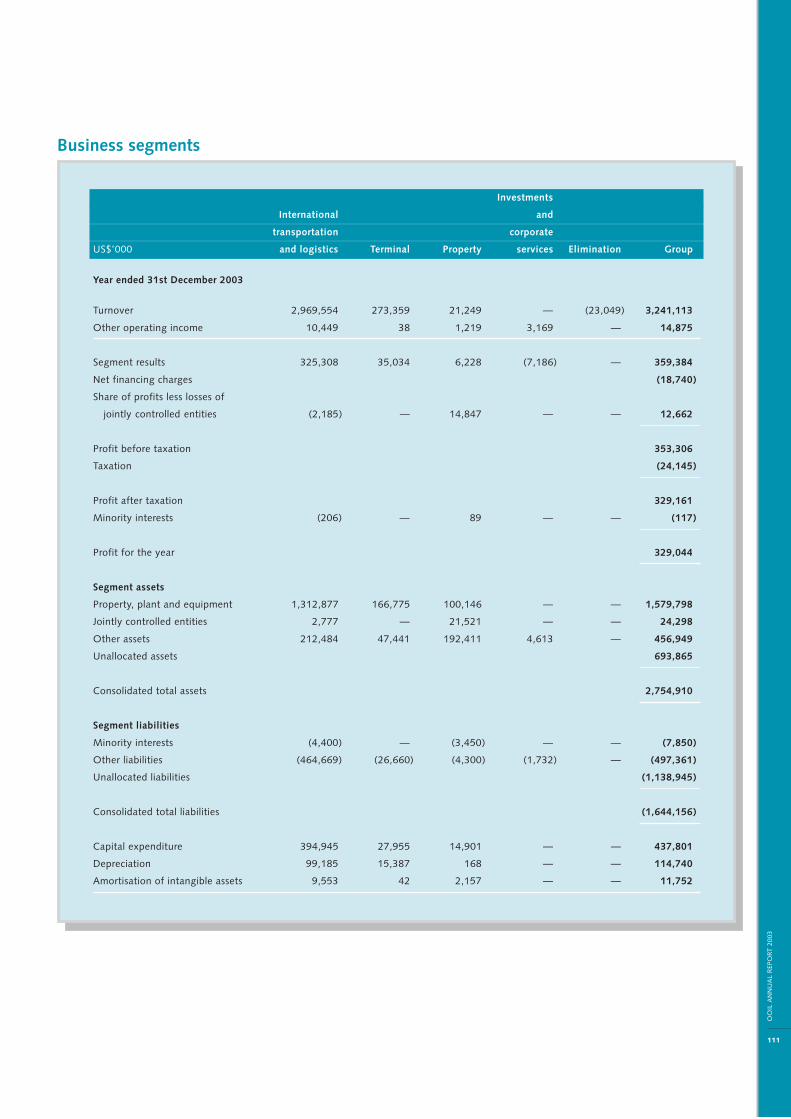
111
OO
IL A
NN
UA
L R
EPO
R T 2
003
Business segments
Investments
International and
transportation corporate
US$’000 and logistics Terminal Property services Elimination Group
Year ended 31st December 2003
Turnover 2,969,554 273,359 21,249 — (23,049) 3,241,113
Other operating income 10,449 38 1,219 3,169 — 14,875
Segment results 325,308 35,034 6,228 (7,186) — 359,384
Net financing charges (18,740)
Share of profits less losses of
jointly controlled entities (2,185) — 14,847 — — 12,662
Profit before taxation 353,306
Taxation (24,145)
Profit after taxation 329,161
Minority interests (206) — 89 — — (117)
Profit for the year 329,044
Segment assets
Property, plant and equipment 1,312,877 166,775 100,146 — — 1,579,798
Jointly controlled entities 2,777 — 21,521 — — 24,298
Other assets 212,484 47,441 192,411 4,613 — 456,949
Unallocated assets 693,865
Consolidated total assets 2,754,910
Segment liabilities
Minority interests (4,400) — (3,450) — — (7,850)
Other liabilities (464,669) (26,660) (4,300) (1,732) — (497,361)
Unallocated liabilities (1,138,945)
Consolidated total liabilities (1,644,156)
Capital expenditure 394,945 27,955 14,901 — — 437,801
Depreciation 99,185 15,387 168 — — 114,740
Amortisation of intangible assets 9,553 42 2,157 — — 11,752
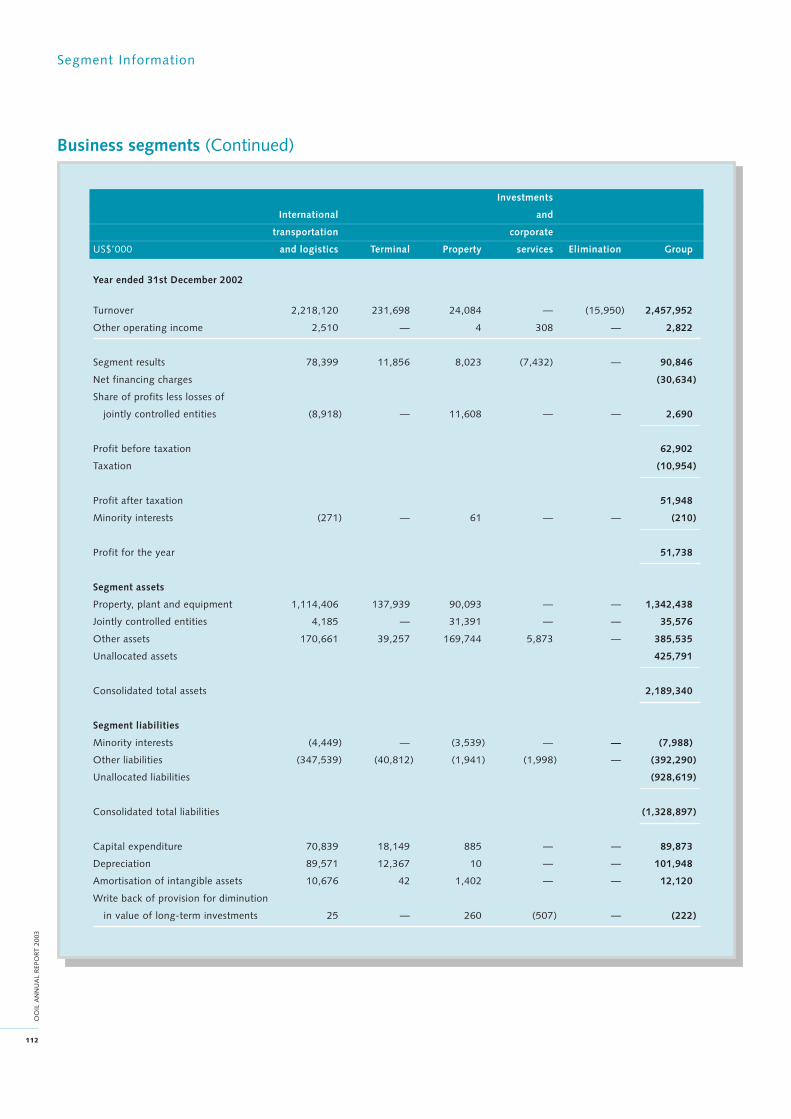
Segment Information
112
OO
IL A
NN
UA
L R
EPO
RT 2
003
Business segments (Continued)
Investments
International and
transportation corporate
US$’000 and logistics Terminal Property services Elimination Group
Year ended 31st December 2002
Turnover 2,218,120 231,698 24,084 — (15,950) 2,457,952
Other operating income 2,510 — 4 308 — 2,822
Segment results 78,399 11,856 8,023 (7,432) — 90,846
Net financing charges (30,634)
Share of profits less losses of
jointly controlled entities (8,918) — 11,608 — — 2,690
Profit before taxation 62,902
Taxation (10,954)
Profit after taxation 51,948
Minority interests (271) — 61 — — (210)
Profit for the year 51,738
Segment assets
Property, plant and equipment 1,114,406 137,939 90,093 — — 1,342,438
Jointly controlled entities 4,185 — 31,391 — — 35,576
Other assets 170,661 39,257 169,744 5,873 — 385,535
Unallocated assets 425,791
Consolidated total assets 2,189,340
Segment liabilities
Minority interests (4,449) — (3,539) — — (7,988)
Other liabilities (347,539) (40,812) (1,941) (1,998) — (392,290)
Unallocated liabilities (928,619)
Consolidated total liabilities (1,328,897)
Capital expenditure 70,839 18,149 885 — — 89,873
Depreciation 89,571 12,367 10 — — 101,948
Amortisation of intangible assets 10,676 42 1,402 — — 12,120
Write back of provision for diminution
in value of long-term investments 25 — 260 (507) — (222)
113
OO
IL A
NN
UA
L R
EPO
R T 2
003
Geographical segments
Operating
profit before Total Capital
US$’000 Turnover financing assets expenditure
Year ended 31st December 2003
Asia 2,043,205 (1,634) 450,080 37,230
North America 752,356 42,896 420,007 61,237
Europe 399,068 — 12,882 504
Australia 46,484 — 139 13
Unallocated* — 318,122 1,871,802 338,817
3,241,113 359,384 2,754,910 437,801
Year ended 31st December 2002
Asia 1,445,558 2,796 365,118 5,813
North America 651,713 17,083 375,468 22,631
Europe 316,557 — 26,443 1,930
Australia 44,124 — 334 21
Unallocated* — 70,967 1,421,977 59,478
2,457,952 90,846 2,189,340 89,873
* Operating profit before financing comprise of results from international transportation and logistics and investment activities whereas
total assets, comprise of vessels, containers, portfolio investments and bank balances while capital expenditure comprise of vessels,
containers and financing charges under intangible assets.

Principal Subsidiaries and Jointly Controlled Entities
114
OO
IL A
NN
UA
L R
EPO
RT 2
003
As at 31st December 2003
Effective
percentage
held by Particulars of issued share Principal Country of Area of
Name of Company Group and loan capital activities incorporation operations
Subsidiaries
Beaufort Shipping Ltd 100 500 shares of no par value Ship owning Liberia † Worldwide
US$5,000
Betterment International Ltd 100 5,000 shares of US$1 each Property investment British Virgin China
US$5,000 Islands
Cargo System Warehouse and 100 3,000 shares of HK$100 each Equipment owning Hong Kong Hong Kong
Transport Ltd HK$300,000
Consolidated Leasing & 100 1 share of no par value Equipment owning USA USA
Terminals, Inc. US$100 and leasing
Containers No. 1 Inc. 100 500 shares of no par value Equipment owning Marshall Worldwide
US$5,000 and leasing Islands
Croydon Investment Ltd 100 500 shares of no par value Investment holding Liberia † Worldwide
US$5,000
Dongguan Orient Container Co Ltd 100 Registered capital Container depot China China
HK$29,000,000
DT Ltd 100 500 shares of no par value Investment Marshall Europe
US$5,000 Islands
Far Gain Investment Ltd 100 2 shares of HK$1 each Investment holding Hong Kong Hong Kong
HK$2
Global Terminal & Container 100 24,750 shares of no par value Terminal operating USA USA
Services, Inc. US$5,500,000
Goodlink Shipping Ltd 100 500 shares of no par value Ship chartering Liberia † Worldwide
US$5,000
Hai Dong Transportation Co Ltd 100 100,000 shares of HK$1 each Container transportation Hong Kong Hong Kong
HK$100,000
Hillingdon Steamship and 100 200 shares of US$100 each Investment Bermuda Worldwide
Navigation Company Ltd US$20,000

115
OO
IL A
NN
UA
L R
EPO
R T 2
003
Effective
percentage
held by Particulars of issued share Principal Country of Area of
Name of Company Group and loan capital activities incorporation operations
Subsidiaries (Continued)
Howland Hook Container 100 1,000,000 common stock Terminal operating USA USA
Terminal, Inc. of US$1 each
100 5,200 cumulative
preferred stock
of US$1,000 each
US$6,200,000
Island Securing and Maintenance, Inc. 100 1,000 shares of no par value Lashing and USA USA
US$10,000 maintenance of
container equipment
Joyocean Navigation Ltd 100 500 shares of no par value Ship chartering Liberia † Worldwide
US$5,000
Kenwake Ltd 100 1,600,000 shares of £1 each Investment holding United United
100 520,000 5% cumulative Kingdom Kingdom
preference shares
of £1 each
£2,120,000
Laronda Company Ltd 100 5,000 shares of US$1 each Portfolio investment British Virgin Worldwide
US$5,000 Islands
Long Beach Container Terminal, Inc. 100 5,000 shares of no par value Terminal operating USA USA
US$500,000
Longtex Investment Ltd 100 2 shares of HK$1 each Investment holding Hong Kong China
HK$2
Loyalton Shipping Ltd 100 500 shares of no par value Ship owning Marshall Worldwide
US$5,000 Islands
Millerian Company Ltd 100 5,000 shares of US$1 each Portfolio investment British Virgin Worldwide
US$5,000 Islands
Newcontainer No. 1 Shipping Inc. 100 500 shares of no par value Ship owning Liberia † Worldwide
US$5,000
Newcontainer No. 2 Shipping Inc. 100 500 shares of no par value Ship owning Liberia † Worldwide
US$5,000

Principal Subsidiaries and Jointly Controlled Entities
116
OO
IL A
NN
UA
L R
EPO
RT 2
003
Effective
percentage
held by Particulars of issued share Principal Country of Area of
Name of Company Group and loan capital activities incorporation operations
Subsidiaries (Continued)
Newcontainer No. 3 Shipping Inc. 100 500 shares of no par value Ship owning Liberia † Worldwide
US$5,000
Newcontainer No. 4 Shipping Inc. 100 500 shares of no par value Ship owning Liberia † Worldwide
US$5,000
Newcontainer No. 5 Shipping Inc. 100 500 shares of no par value Ship owning Liberia † Worldwide
US$5,000
Newcontainer No. 6 Shipping Inc. 100 500 shares of no par value Ship owning Liberia † Worldwide
US$5,000
Newcontainer No. 7 Shipping Inc. 100 500 shares of no par value Ship owning Liberia † Worldwide
US$5,000
Newcontainer No. 9 100 500 shares of no par value Ship owning Marshall Worldwide
(Marshall Islands) Shipping Inc. US$5,000 Islands
Newcontainer No. 10 100 500 shares of no par value Ship owning Marshall Worldwide
(Marshall Islands) Shipping Inc. US$5,000 Islands
Newcontainer No. 15 100 500 shares of no par value Ship owning Marshall Worldwide
(Marshall Islands) Shipping Inc. US$5,000 Islands
Newcontainer No. 16 100 500 shares of no par value Ship owning Marshall Worldwide
(Marshall Islands) Shipping Inc. US$5,000 Islands
Newcontainer No. 18 100 500 shares of no par value Ship owning Marshall Worldwide
(Marshall Islands) Shipping Inc. US$5,000 Islands
Newcontainer No. 19 100 500 shares of no par value Ship owning Marshall Worldwide
(Marshall Islands) Shipping Inc. US$5,000 Islands
Newcontainer No. 20 100 500 shares of no par value Ship owning Marshall Worldwide
(Marshall Islands) Shipping Inc. US$5,000 Islands
Newcontainer No. 21 100 500 shares of no par value Ship owning Marshall Worldwide
(Marshall Islands) Shipping Inc. US$5,000 Islands
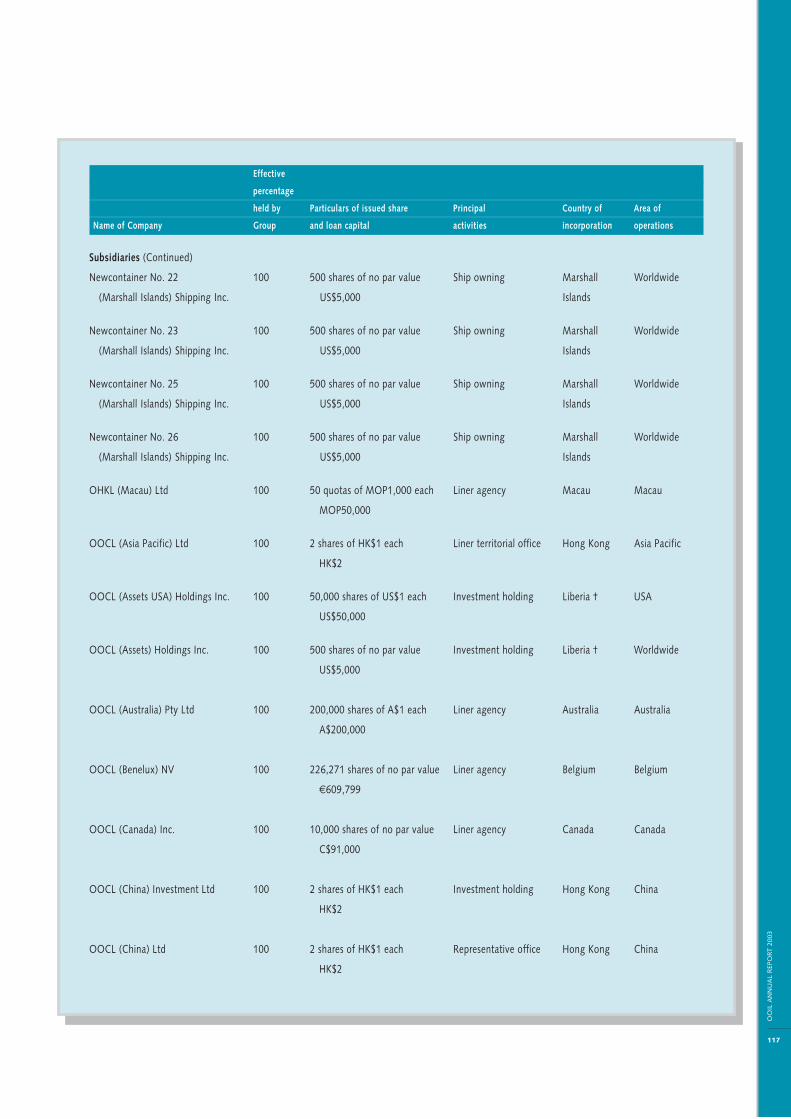
117
OO
IL A
NN
UA
L R
EPO
R T 2
003
Effective
percentage
held by Particulars of issued share Principal Country of Area of
Name of Company Group and loan capital activities incorporation operations
Subsidiaries (Continued)
Newcontainer No. 22 100 500 shares of no par value Ship owning Marshall Worldwide
(Marshall Islands) Shipping Inc. US$5,000 Islands
Newcontainer No. 23 100 500 shares of no par value Ship owning Marshall Worldwide
(Marshall Islands) Shipping Inc. US$5,000 Islands
Newcontainer No. 25 100 500 shares of no par value Ship owning Marshall Worldwide
(Marshall Islands) Shipping Inc. US$5,000 Islands
Newcontainer No. 26 100 500 shares of no par value Ship owning Marshall Worldwide
(Marshall Islands) Shipping Inc. US$5,000 Islands
OHKL (Macau) Ltd 100 50 quotas of MOP1,000 each Liner agency Macau Macau
MOP50,000
OOCL (Asia Pacific) Ltd 100 2 shares of HK$1 each Liner territorial office Hong Kong Asia Pacific
HK$2
OOCL (Assets USA) Holdings Inc. 100 50,000 shares of US$1 each Investment holding Liberia † USA
US$50,000
OOCL (Assets) Holdings Inc. 100 500 shares of no par value Investment holding Liberia † Worldwide
US$5,000
OOCL (Australia) Pty Ltd 100 200,000 shares of A$1 each Liner agency Australia Australia
A$200,000
OOCL (Benelux) NV 100 226,271 shares of no par value Liner agency Belgium Belgium
€609,799
OOCL (Canada) Inc. 100 10,000 shares of no par value Liner agency Canada Canada
C$91,000
OOCL (China) Investment Ltd 100 2 shares of HK$1 each Investment holding Hong Kong China
HK$2
OOCL (China) Ltd 100 2 shares of HK$1 each Representative office Hong Kong China
HK$2
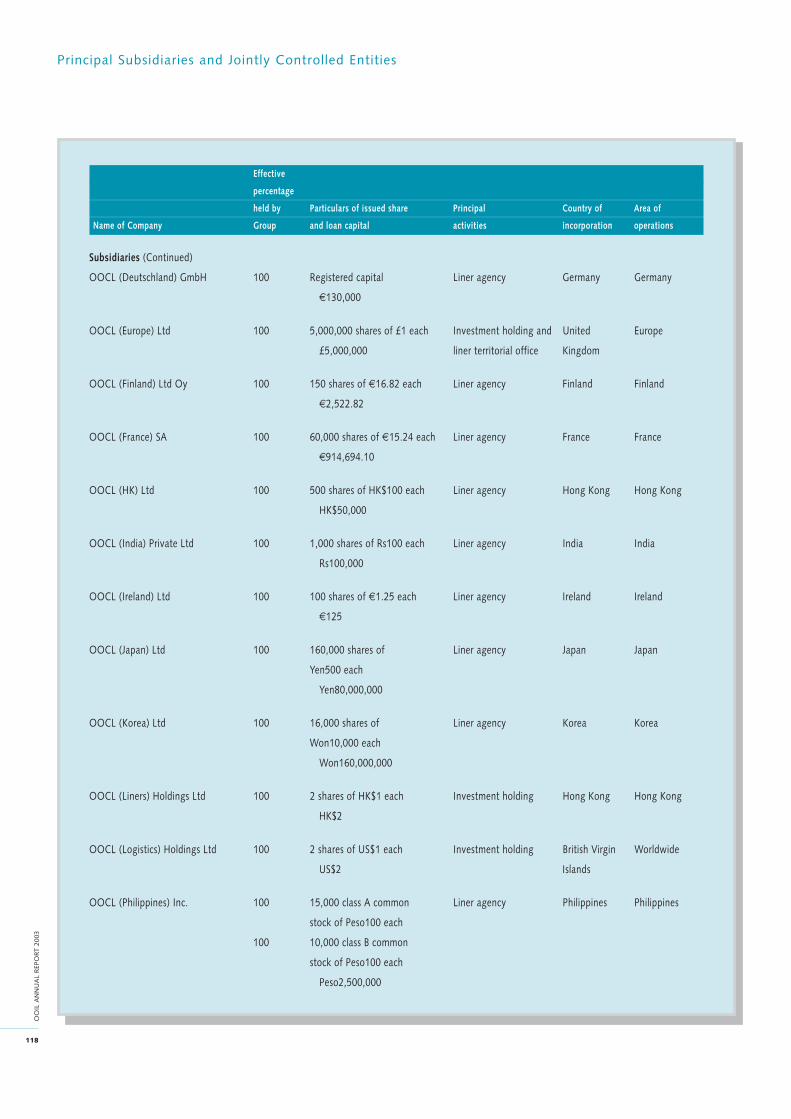
Principal Subsidiaries and Jointly Controlled Entities
118
OO
IL A
NN
UA
L R
EPO
RT 2
003
Effective
percentage
held by Particulars of issued share Principal Country of Area of
Name of Company Group and loan capital activities incorporation operations
Subsidiaries (Continued)
OOCL (Deutschland) GmbH 100 Registered capital Liner agency Germany Germany
€130,000
OOCL (Europe) Ltd 100 5,000,000 shares of £1 each Investment holding and United Europe
£5,000,000 liner territorial office Kingdom
OOCL (Finland) Ltd Oy 100 150 shares of €16.82 each Liner agency Finland Finland
€2,522.82
OOCL (France) SA 100 60,000 shares of €15.24 each Liner agency France France
€914,694.10
OOCL (HK) Ltd 100 500 shares of HK$100 each Liner agency Hong Kong Hong Kong
HK$50,000
OOCL (India) Private Ltd 100 1,000 shares of Rs100 each Liner agency India India
Rs100,000
OOCL (Ireland) Ltd 100 100 shares of €1.25 each Liner agency Ireland Ireland
€125
OOCL (Japan) Ltd 100 160,000 shares of Liner agency Japan Japan
Yen500 each
Yen80,000,000
OOCL (Korea) Ltd 100 16,000 shares of Liner agency Korea Korea
Won10,000 each
Won160,000,000
OOCL (Liners) Holdings Ltd 100 2 shares of HK$1 each Investment holding Hong Kong Hong Kong
HK$2
OOCL (Logistics) Holdings Ltd 100 2 shares of US$1 each Investment holding British Virgin Worldwide
US$2 Islands
OOCL (Philippines) Inc. 100 15,000 class A common Liner agency Philippines Philippines
stock of Peso100 each
100 10,000 class B common
stock of Peso100 each
Peso2,500,000
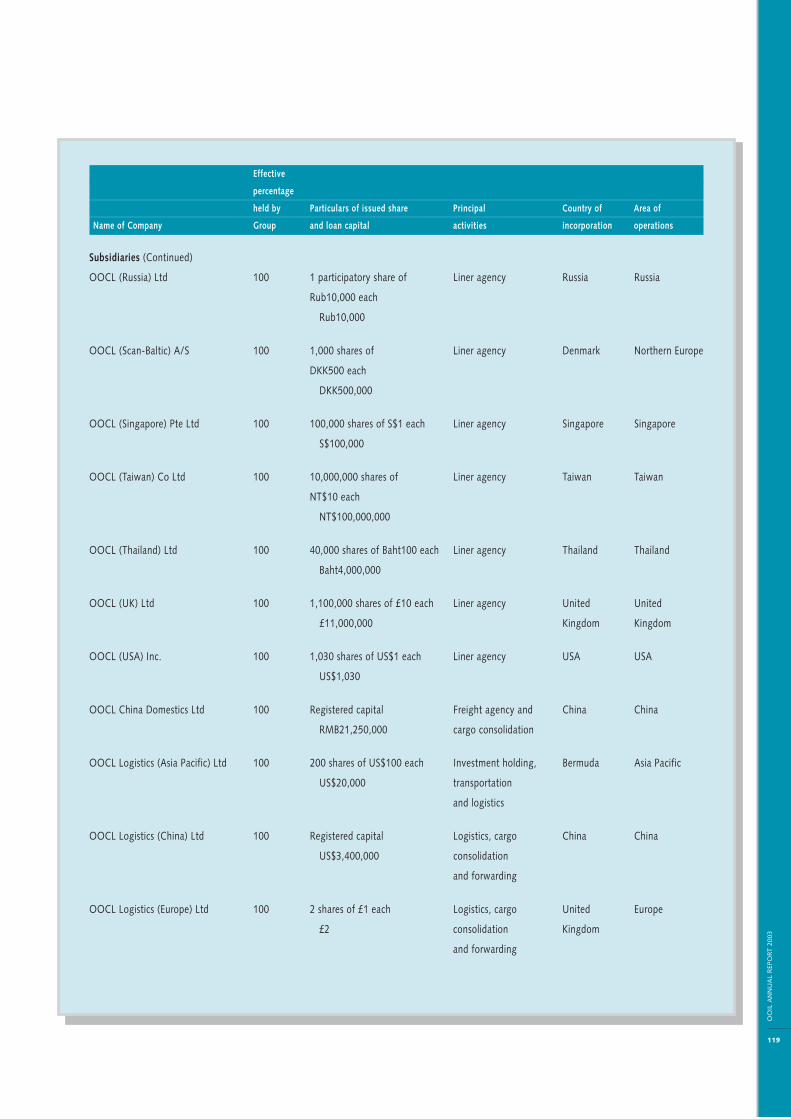
119
OO
IL A
NN
UA
L R
EPO
R T 2
003
Effective
percentage
held by Particulars of issued share Principal Country of Area of
Name of Company Group and loan capital activities incorporation operations
Subsidiaries (Continued)
OOCL (Russia) Ltd 100 1 participatory share of Liner agency Russia Russia
Rub10,000 each
Rub10,000
OOCL (Scan-Baltic) A/S 100 1,000 shares of Liner agency Denmark Northern Europe
DKK500 each
DKK500,000
OOCL (Singapore) Pte Ltd 100 100,000 shares of S$1 each Liner agency Singapore Singapore
S$100,000
OOCL (Taiwan) Co Ltd 100 10,000,000 shares of Liner agency Taiwan Taiwan
NT$10 each
NT$100,000,000
OOCL (Thailand) Ltd 100 40,000 shares of Baht100 each Liner agency Thailand Thailand
Baht4,000,000
OOCL (UK) Ltd 100 1,100,000 shares of £10 each Liner agency United United
£11,000,000 Kingdom Kingdom
OOCL (USA) Inc. 100 1,030 shares of US$1 each Liner agency USA USA
US$1,030
OOCL China Domestics Ltd 100 Registered capital Freight agency and China China
RMB21,250,000 cargo consolidation
OOCL Logistics (Asia Pacific) Ltd 100 200 shares of US$100 each Investment holding, Bermuda Asia Pacific
US$20,000 transportation
and logistics
OOCL Logistics (China) Ltd 100 Registered capital Logistics, cargo China China
US$3,400,000 consolidation
and forwarding
OOCL Logistics (Europe) Ltd 100 2 shares of £1 each Logistics, cargo United Europe
£2 consolidation Kingdom
and forwarding
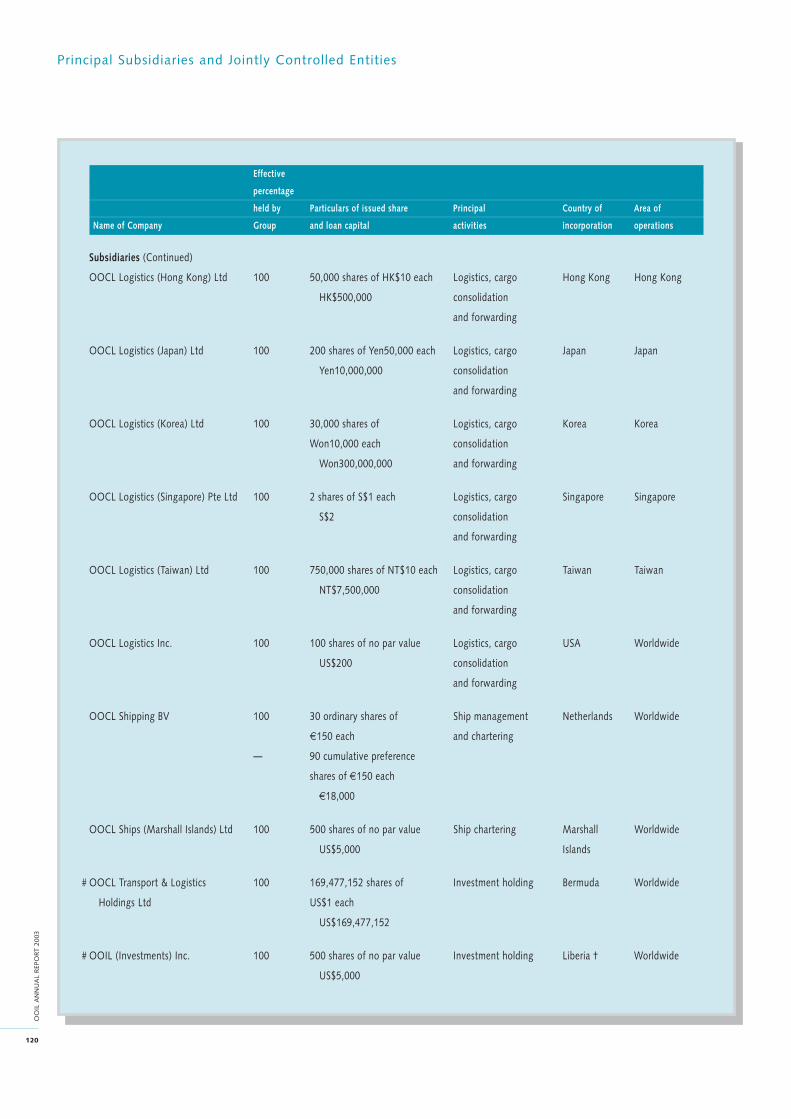
Principal Subsidiaries and Jointly Controlled Entities
120
OO
IL A
NN
UA
L R
EPO
RT 2
003
Effective
percentage
held by Particulars of issued share Principal Country of Area of
Name of Company Group and loan capital activities incorporation operations
Subsidiaries (Continued)
OOCL Logistics (Hong Kong) Ltd 100 50,000 shares of HK$10 each Logistics, cargo Hong Kong Hong Kong
HK$500,000 consolidation
and forwarding
OOCL Logistics (Japan) Ltd 100 200 shares of Yen50,000 each Logistics, cargo Japan Japan
Yen10,000,000 consolidation
and forwarding
OOCL Logistics (Korea) Ltd 100 30,000 shares of Logistics, cargo Korea Korea
Won10,000 each consolidation
Won300,000,000 and forwarding
OOCL Logistics (Singapore) Pte Ltd 100 2 shares of S$1 each Logistics, cargo Singapore Singapore
S$2 consolidation
and forwarding
OOCL Logistics (Taiwan) Ltd 100 750,000 shares of NT$10 each Logistics, cargo Taiwan Taiwan
NT$7,500,000 consolidation
and forwarding
OOCL Logistics Inc. 100 100 shares of no par value Logistics, cargo USA Worldwide
US$200 consolidation
and forwarding
OOCL Shipping BV 100 30 ordinary shares of Ship management Netherlands Worldwide
€150 each and chartering
— 90 cumulative preference
shares of €150 each
€18,000
OOCL Ships (Marshall Islands) Ltd 100 500 shares of no par value Ship chartering Marshall Worldwide
US$5,000 Islands
# OOCL Transport & Logistics 100 169,477,152 shares of Investment holding Bermuda Worldwide
Holdings Ltd US$1 each
US$169,477,152
# OOIL (Investments) Inc. 100 500 shares of no par value Investment holding Liberia † Worldwide
US$5,000
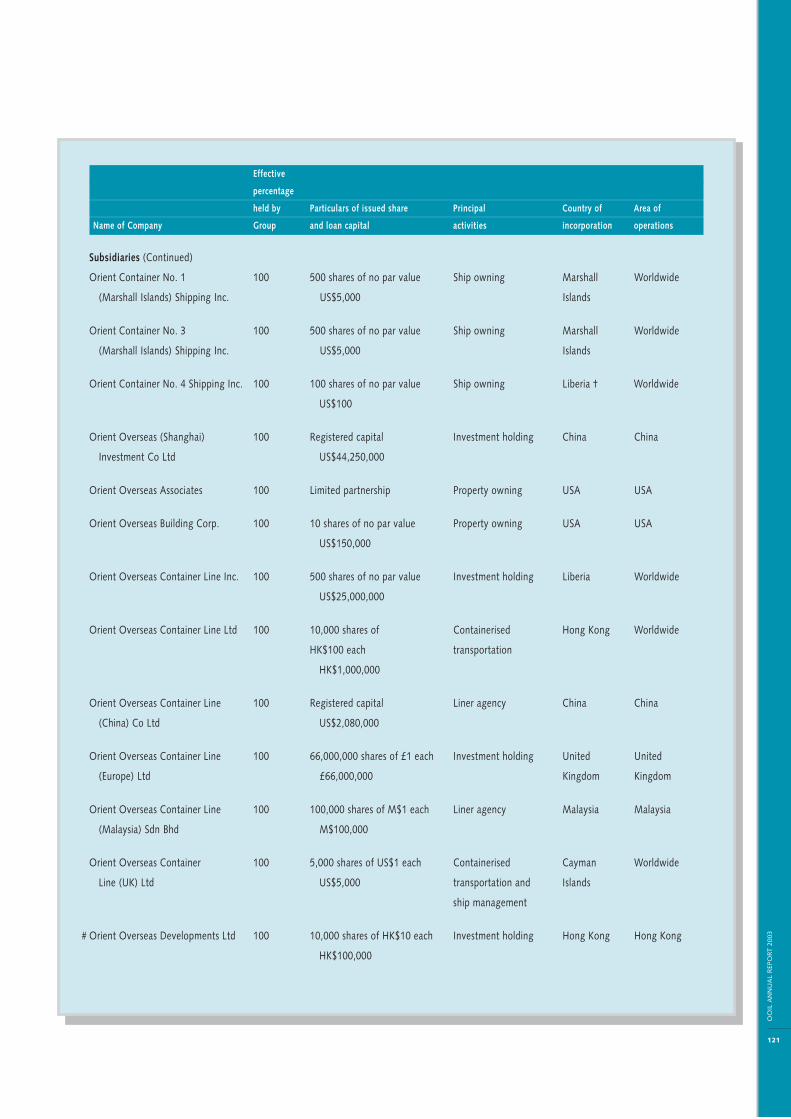
121
OO
IL A
NN
UA
L R
EPO
R T 2
003
Effective
percentage
held by Particulars of issued share Principal Country of Area of
Name of Company Group and loan capital activities incorporation operations
Subsidiaries (Continued)
Orient Container No. 1 100 500 shares of no par value Ship owning Marshall Worldwide
(Marshall Islands) Shipping Inc. US$5,000 Islands
Orient Container No. 3 100 500 shares of no par value Ship owning Marshall Worldwide
(Marshall Islands) Shipping Inc. US$5,000 Islands
Orient Container No. 4 Shipping Inc. 100 100 shares of no par value Ship owning Liberia † Worldwide
US$100
Orient Overseas (Shanghai) 100 Registered capital Investment holding China China
Investment Co Ltd US$44,250,000
Orient Overseas Associates 100 Limited partnership Property owning USA USA
Orient Overseas Building Corp. 100 10 shares of no par value Property owning USA USA
US$150,000
Orient Overseas Container Line Inc. 100 500 shares of no par value Investment holding Liberia Worldwide
US$25,000,000
Orient Overseas Container Line Ltd 100 10,000 shares of Containerised Hong Kong Worldwide
HK$100 each transportation
HK$1,000,000
Orient Overseas Container Line 100 Registered capital Liner agency China China
(China) Co Ltd US$2,080,000
Orient Overseas Container Line 100 66,000,000 shares of £1 each Investment holding United United
(Europe) Ltd £66,000,000 Kingdom Kingdom
Orient Overseas Container Line 100 100,000 shares of M$1 each Liner agency Malaysia Malaysia
(Malaysia) Sdn Bhd M$100,000
Orient Overseas Container 100 5,000 shares of US$1 each Containerised Cayman Worldwide
Line (UK) Ltd US$5,000 transportation and Islands
ship management
# Orient Overseas Developments Ltd 100 10,000 shares of HK$10 each Investment holding Hong Kong Hong Kong
HK$100,000

Principal Subsidiaries and Jointly Controlled Entities
122
OO
IL A
NN
UA
L R
EPO
RT 2
003
Effective
percentage
held by Particulars of issued share Principal Country of Area of
Name of Company Group and loan capital activities incorporation operations
Subsidiaries (Continued)
Orient Overseas Property 100 Registered capital Property development China China
(Shanghai) Co Ltd US$2,100,000
Shanghai OOCL Container 60 Registered capital Container depot China China
Transportation Co Ltd US$9,350,000
Shanghai Orient Overseas Yongye 88 Registered capital Property development China China
Real Estate Co Ltd US$30,000,000
Soberry Investments Ltd 100 5,000 shares of US$1 each Portfolio investment British Virgin Worldwide
US$5,000 Islands
Surbiton Ltd 100 500 shares of no par value Portfolio investment Liberia † Worldwide
US$5,000
Treasure King Shipping Ltd 100 500 shares of no par value Ship chartering Liberia † Worldwide
US$5,000
TSI Terminal Systems Inc. 100 233,400 shares of C$1 each Terminal operating Canada Canada
C$233,400
Wall Street Plaza, Inc. 100 40 A shares of US$1 each Investment holding USA USA
100 160 B shares of US$1 each
100 20,000 12% series A
non-cumulative
non-voting preferred stock of
US$1,000 each
100 18,000 11% series B
non-cumulative
non-voting preferred stock of
US$1,000 each
100 19,500 12% series C
non-cumulative
non-voting preferred stock of
US$1,000 each
100 19,000 12% series D
non-cumulative
non-voting preferred stock of
US$1,000 each
US$76,500,200
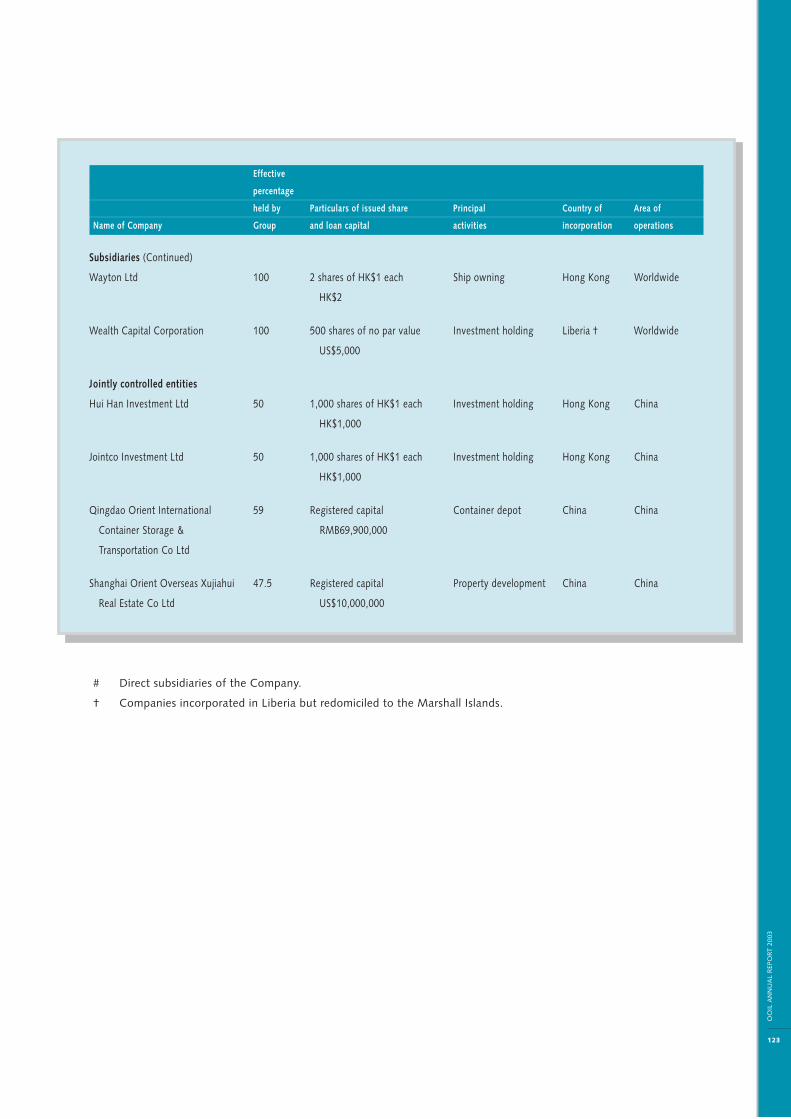
123
OO
IL A
NN
UA
L R
EPO
R T 2
003
Effective
percentage
held by Particulars of issued share Principal Country of Area of
Name of Company Group and loan capital activities incorporation operations
Subsidiaries (Continued)
Wayton Ltd 100 2 shares of HK$1 each Ship owning Hong Kong Worldwide
HK$2
Wealth Capital Corporation 100 500 shares of no par value Investment holding Liberia † Worldwide
US$5,000
Jointly controlled entities
Hui Han Investment Ltd 50 1,000 shares of HK$1 each Investment holding Hong Kong China
HK$1,000
Jointco Investment Ltd 50 1,000 shares of HK$1 each Investment holding Hong Kong China
HK$1,000
Qingdao Orient International 59 Registered capital Container depot China China
Container Storage & RMB69,900,000
Transportation Co Ltd
Shanghai Orient Overseas Xujiahui 47.5 Registered capital Property development China China
Real Estate Co Ltd US$10,000,000
# Direct subsidiaries of the Company.
† Companies incorporated in Liberia but redomiciled to the Marshall Islands.

124
OO
IL A
NN
UA
L R
EPO
RT 2
003
Major Customers and Suppliers
Approximately 5.2% and 18.3% of the Group’s total expenditure on purchases of goods and services for the year are attributable to the
largest supplier and five largest suppliers respectively.
Approximately 1.2% and 4.7% of the Group’s total reported revenues for the year are attributable to the largest customer and five largest
customers respectively.
The Group has entered into slot sharing arrangements with other container shipping companies. The receipts and payments from slot
sharing arrangements have not been included in determining the major customers and suppliers since it would be misleading to do so as the
receipts and payments are in respect of sharing arrangements for the utilisation of vessel space.
No director or any of his associates holds any equity interest in the suppliers or customers included above.

125
OO
IL A
NN
UA
L R
EPO
R T 2
003
10 Years Financial Summary
US$’000 1994 1995 1996 1997 1998 1999 2000 2001 2002 2003
Consolidated Profit and Loss Data
Turnover 1,516,018 1,671,628 1,882,322 1,895,997 1,832,764 2,139,071 2,395,160 2,378,950 2,457,952 3,241,113
Operating profit before financing 119,543 91,594 157,447 68,033 48,327 122,729 166,399 107,391 90,846 359,384
Net financing charges (59,620 ) (21,038 ) (42,899 ) (42,471 ) (42,911 ) (41,421 ) (48,246 ) (45,614 ) (30,634 ) (18,740 )
Profit before taxation 60,106 70,579 115,078 26,548 3,674 80,341 131,464 71,089 62,902 353,306
Profit after taxation 57,648 66,788 107,233 24,204 170 67,623 112,477 61,809 51,948 329,161
Preferred share dividends 9,097 9,097 9,003 4,875 2,564 — — — — —
Profit/(loss) attributable to
ordinary shareholders 48,113 56,108 97,149 18,790 (2,867 ) 67,221 111,863 61,287 51,738 329,044
Per Ordinary Share
Earnings/(loss) (US cents) 10.4 12.2 21.0 3.6 (0.6 ) 13.0 21.6 11.8 10.0 65.2
Dividends (US cents) 1.61 2.08 2.60 1.65 — 3.0 4.0 2.5 2.5 16.65
Weighted average number of
ordinary shares in issue (’000) 460,369 460,369 462,065 517,142 517,142 517,142 517,142 517,142 517,142 504,534
Notes:
(1) The estimated useful life of container vessels was revised from 20 years to 25 years in 1998. The depreciation of container vessels prior to 1998 has not
been restated to reflect the change.
(2) The accounting policy on dry-docking and special survey costs was changed in 1997 and again in 2000. The figures prior to 1996 and 1999 respectively
have not been restated to reflect this change.
(3) The accounting policy on pre-operating costs was changed in 2000 and the figures prior to 1998 have not been restated to reflect this change.
(4) The accounting policies on employee benefits and income taxes were changed in 2002 and the figures prior to 2000 have not been restated to reflect
this change.
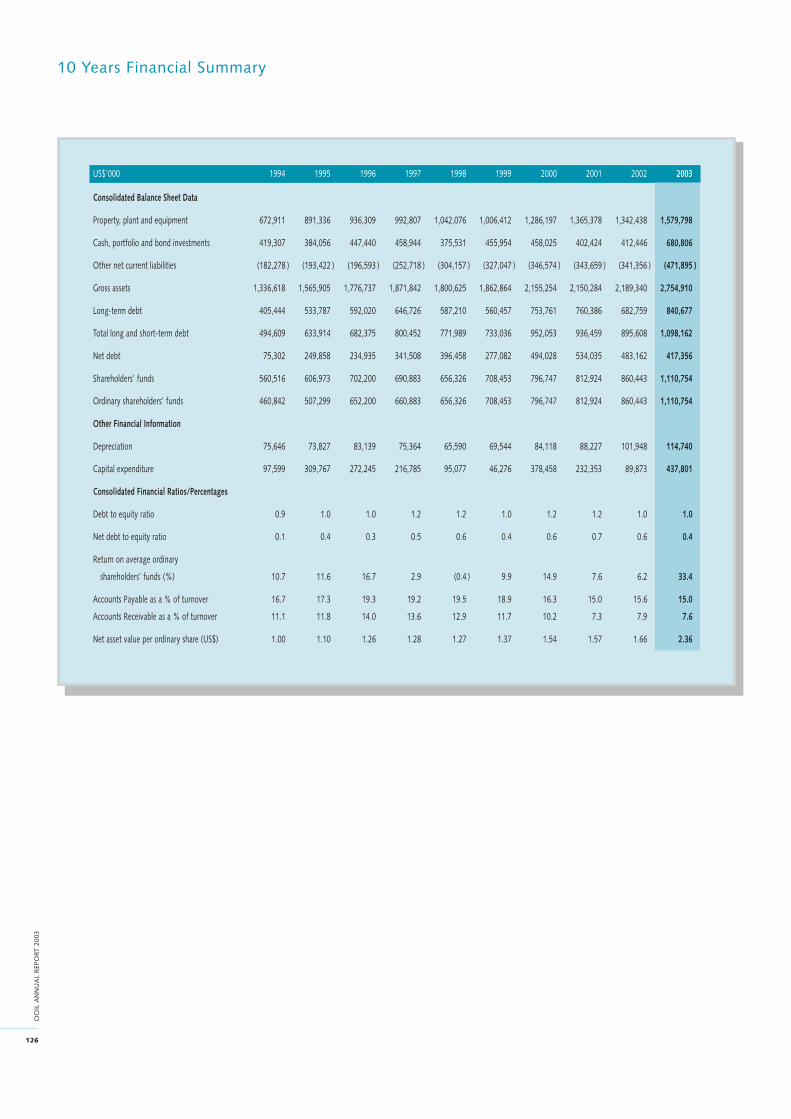
126
OO
IL A
NN
UA
L R
EPO
RT 2
003
10 Years Financial Summary
US$’000 1994 1995 1996 1997 1998 1999 2000 2001 2002 2003
Consolidated Balance Sheet Data
Property, plant and equipment 672,911 891,336 936,309 992,807 1,042,076 1,006,412 1,286,197 1,365,378 1,342,438 1,579,798
Cash, portfolio and bond investments 419,307 384,056 447,440 458,944 375,531 455,954 458,025 402,424 412,446 680,806
Other net current liabilities (182,278 ) (193,422 ) (196,593 ) (252,718 ) (304,157 ) (327,047 ) (346,574 ) (343,659 ) (341,356 ) (471,895 )
Gross assets 1,336,618 1,565,905 1,776,737 1,871,842 1,800,625 1,862,864 2,155,254 2,150,284 2,189,340 2,754,910
Long-term debt 405,444 533,787 592,020 646,726 587,210 560,457 753,761 760,386 682,759 840,677
Total long and short-term debt 494,609 633,914 682,375 800,452 771,989 733,036 952,053 936,459 895,608 1,098,162
Net debt 75,302 249,858 234,935 341,508 396,458 277,082 494,028 534,035 483,162 417,356
Shareholders’ funds 560,516 606,973 702,200 690,883 656,326 708,453 796,747 812,924 860,443 1,110,754
Ordinary shareholders’ funds 460,842 507,299 652,200 660,883 656,326 708,453 796,747 812,924 860,443 1,110,754
Other Financial Information
Depreciation 75,646 73,827 83,139 75,364 65,590 69,544 84,118 88,227 101,948 114,740
Capital expenditure 97,599 309,767 272,245 216,785 95,077 46,276 378,458 232,353 89,873 437,801
Consolidated Financial Ratios/Percentages
Debt to equity ratio 0.9 1.0 1.0 1.2 1.2 1.0 1.2 1.2 1.0 1.0
Net debt to equity ratio 0.1 0.4 0.3 0.5 0.6 0.4 0.6 0.7 0.6 0.4
Return on average ordinary
shareholders’ funds (%) 10.7 11.6 16.7 2.9 (0.4 ) 9.9 14.9 7.6 6.2 33.4
Accounts Payable as a % of turnover 16.7 17.3 19.3 19.2 19.5 18.9 16.3 15.0 15.6 15.0
Accounts Receivable as a % of turnover 11.1 11.8 14.0 13.6 12.9 11.7 10.2 7.3 7.9 7.6
Net asset value per ordinary share (US$) 1.00 1.10 1.26 1.28 1.27 1.37 1.54 1.57 1.66 2.36
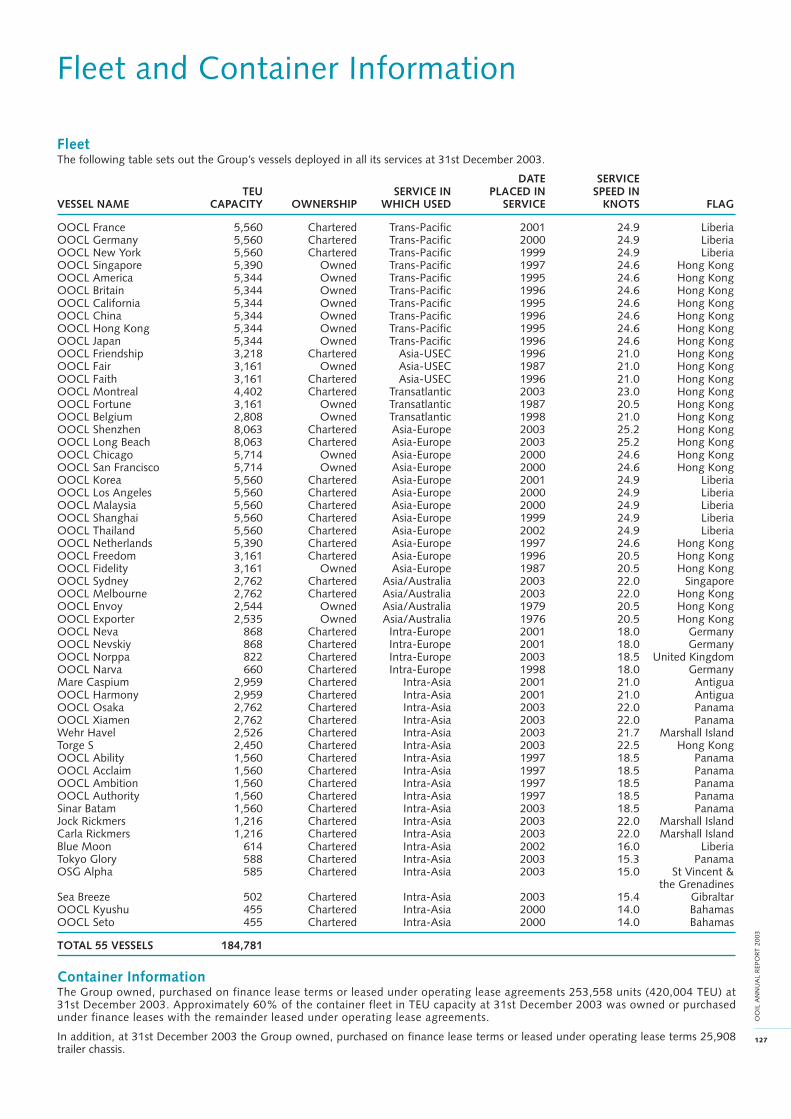
127
OO
IL A
NN
UA
L R
EPO
R T 2
003
Fleet and Container Information
FleetThe following table sets out the Group’s vessels deployed in all its services at 31st December 2003.
DATE SERVICETEU SERVICE IN PLACED IN SPEED IN
VESSEL NAME CAPACITY OWNERSHIP WHICH USED SERVICE KNOTS FLAG
OOCL France 5,560 Chartered Trans-Pacific 2001 24.9 LiberiaOOCL Germany 5,560 Chartered Trans-Pacific 2000 24.9 LiberiaOOCL New York 5,560 Chartered Trans-Pacific 1999 24.9 LiberiaOOCL Singapore 5,390 Owned Trans-Pacific 1997 24.6 Hong KongOOCL America 5,344 Owned Trans-Pacific 1995 24.6 Hong KongOOCL Britain 5,344 Owned Trans-Pacific 1996 24.6 Hong KongOOCL California 5,344 Owned Trans-Pacific 1995 24.6 Hong KongOOCL China 5,344 Owned Trans-Pacific 1996 24.6 Hong KongOOCL Hong Kong 5,344 Owned Trans-Pacific 1995 24.6 Hong KongOOCL Japan 5,344 Owned Trans-Pacific 1996 24.6 Hong KongOOCL Friendship 3,218 Chartered Asia-USEC 1996 21.0 Hong KongOOCL Fair 3,161 Owned Asia-USEC 1987 21.0 Hong KongOOCL Faith 3,161 Chartered Asia-USEC 1996 21.0 Hong KongOOCL Montreal 4,402 Chartered Transatlantic 2003 23.0 Hong KongOOCL Fortune 3,161 Owned Transatlantic 1987 20.5 Hong KongOOCL Belgium 2,808 Owned Transatlantic 1998 21.0 Hong KongOOCL Shenzhen 8,063 Chartered Asia-Europe 2003 25.2 Hong KongOOCL Long Beach 8,063 Chartered Asia-Europe 2003 25.2 Hong KongOOCL Chicago 5,714 Owned Asia-Europe 2000 24.6 Hong KongOOCL San Francisco 5,714 Owned Asia-Europe 2000 24.6 Hong KongOOCL Korea 5,560 Chartered Asia-Europe 2001 24.9 LiberiaOOCL Los Angeles 5,560 Chartered Asia-Europe 2000 24.9 LiberiaOOCL Malaysia 5,560 Chartered Asia-Europe 2000 24.9 LiberiaOOCL Shanghai 5,560 Chartered Asia-Europe 1999 24.9 LiberiaOOCL Thailand 5,560 Chartered Asia-Europe 2002 24.9 LiberiaOOCL Netherlands 5,390 Chartered Asia-Europe 1997 24.6 Hong KongOOCL Freedom 3,161 Chartered Asia-Europe 1996 20.5 Hong KongOOCL Fidelity 3,161 Owned Asia-Europe 1987 20.5 Hong KongOOCL Sydney 2,762 Chartered Asia/Australia 2003 22.0 SingaporeOOCL Melbourne 2,762 Chartered Asia/Australia 2003 22.0 Hong KongOOCL Envoy 2,544 Owned Asia/Australia 1979 20.5 Hong KongOOCL Exporter 2,535 Owned Asia/Australia 1976 20.5 Hong KongOOCL Neva 868 Chartered Intra-Europe 2001 18.0 GermanyOOCL Nevskiy 868 Chartered Intra-Europe 2001 18.0 GermanyOOCL Norppa 822 Chartered Intra-Europe 2003 18.5 United KingdomOOCL Narva 660 Chartered Intra-Europe 1998 18.0 GermanyMare Caspium 2,959 Chartered Intra-Asia 2001 21.0 AntiguaOOCL Harmony 2,959 Chartered Intra-Asia 2001 21.0 AntiguaOOCL Osaka 2,762 Chartered Intra-Asia 2003 22.0 PanamaOOCL Xiamen 2,762 Chartered Intra-Asia 2003 22.0 PanamaWehr Havel 2,526 Chartered Intra-Asia 2003 21.7 Marshall IslandTorge S 2,450 Chartered Intra-Asia 2003 22.5 Hong KongOOCL Ability 1,560 Chartered Intra-Asia 1997 18.5 PanamaOOCL Acclaim 1,560 Chartered Intra-Asia 1997 18.5 PanamaOOCL Ambition 1,560 Chartered Intra-Asia 1997 18.5 PanamaOOCL Authority 1,560 Chartered Intra-Asia 1997 18.5 PanamaSinar Batam 1,560 Chartered Intra-Asia 2003 18.5 PanamaJock Rickmers 1,216 Chartered Intra-Asia 2003 22.0 Marshall IslandCarla Rickmers 1,216 Chartered Intra-Asia 2003 22.0 Marshall IslandBlue Moon 614 Chartered Intra-Asia 2002 16.0 LiberiaTokyo Glory 588 Chartered Intra-Asia 2003 15.3 PanamaOSG Alpha 585 Chartered Intra-Asia 2003 15.0 St Vincent &
the GrenadinesSea Breeze 502 Chartered Intra-Asia 2003 15.4 GibraltarOOCL Kyushu 455 Chartered Intra-Asia 2000 14.0 BahamasOOCL Seto 455 Chartered Intra-Asia 2000 14.0 Bahamas
TOTAL 55 VESSELS 184,781
Container InformationThe Group owned, purchased on finance lease terms or leased under operating lease agreements 253,558 units (420,004 TEU) at31st December 2003. Approximately 60% of the container fleet in TEU capacity at 31st December 2003 was owned or purchasedunder finance leases with the remainder leased under operating lease agreements.
In addition, at 31st December 2003 the Group owned, purchased on finance lease terms or leased under operating lease terms 25,908trailer chassis.
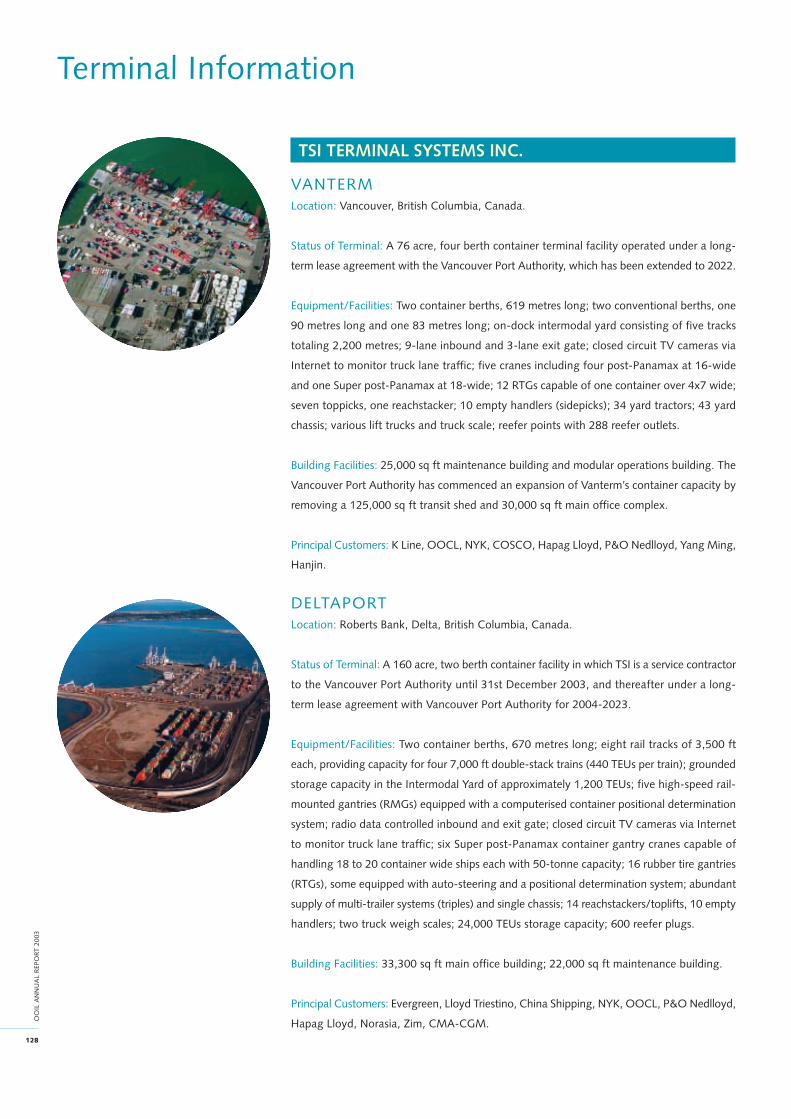
128
OO
IL A
NN
UA
L R
EPO
RT 2
003
Terminal Information
TSI TERMINAL SYSTEMS INC.
VANTERMLocation: Vancouver, British Columbia, Canada.
Status of Terminal: A 76 acre, four berth container terminal facility operated under a long-
term lease agreement with the Vancouver Port Authority, which has been extended to 2022.
Equipment/Facilities: Two container berths, 619 metres long; two conventional berths, one
90 metres long and one 83 metres long; on-dock intermodal yard consisting of five tracks
totaling 2,200 metres; 9-lane inbound and 3-lane exit gate; closed circuit TV cameras via
Internet to monitor truck lane traffic; five cranes including four post-Panamax at 16-wide
and one Super post-Panamax at 18-wide; 12 RTGs capable of one container over 4x7 wide;
seven toppicks, one reachstacker; 10 empty handlers (sidepicks); 34 yard tractors; 43 yard
chassis; various lift trucks and truck scale; reefer points with 288 reefer outlets.
Building Facilities: 25,000 sq ft maintenance building and modular operations building. The
Vancouver Port Authority has commenced an expansion of Vanterm’s container capacity by
removing a 125,000 sq ft transit shed and 30,000 sq ft main office complex.
Principal Customers: K Line, OOCL, NYK, COSCO, Hapag Lloyd, P&O Nedlloyd, Yang Ming,
Hanjin.
DELTAPORTLocation: Roberts Bank, Delta, British Columbia, Canada.
Status of Terminal: A 160 acre, two berth container facility in which TSI is a service contractor
to the Vancouver Port Authority until 31st December 2003, and thereafter under a long-
term lease agreement with Vancouver Port Authority for 2004-2023.
Equipment/Facilities: Two container berths, 670 metres long; eight rail tracks of 3,500 ft
each, providing capacity for four 7,000 ft double-stack trains (440 TEUs per train); grounded
storage capacity in the Intermodal Yard of approximately 1,200 TEUs; five high-speed rail-
mounted gantries (RMGs) equipped with a computerised container positional determination
system; radio data controlled inbound and exit gate; closed circuit TV cameras via Internet
to monitor truck lane traffic; six Super post-Panamax container gantry cranes capable of
handling 18 to 20 container wide ships each with 50-tonne capacity; 16 rubber tire gantries
(RTGs), some equipped with auto-steering and a positional determination system; abundant
supply of multi-trailer systems (triples) and single chassis; 14 reachstackers/toplifts, 10 empty
handlers; two truck weigh scales; 24,000 TEUs storage capacity; 600 reefer plugs.
Building Facilities: 33,300 sq ft main office building; 22,000 sq ft maintenance building.
Principal Customers: Evergreen, Lloyd Triestino, China Shipping, NYK, OOCL, P&O Nedlloyd,
Hapag Lloyd, Norasia, Zim, CMA-CGM.

129
OO
IL A
NN
UA
L R
EPO
R T 2
003
LONG BEACH CONTAINER TERMINAL, INC.
Location: Long Beach, California, USA.
Status of Terminal: A 104 acre, three berth container terminal facility operated under a
long-term preferential use agreement from the Port of Long Beach, which expires in 2011.
Equipment/Facilities: Three container vessel berths; five post-Panamax quayside container
gantry cranes; eight rubber-tired gantry cranes; 60 yard tractors; three top handlers; six side
picks; 12 utility forklifts; 26 yard chassis; various pick-up trucks and other vehicles and
handling equipment.
Building Facilities: 13,000 sq ft main office building; 3,200 sq ft marine operations building;
9,600 sq ft repair shop.
Principal Customers: OOCL, NYK, P&O Nedlloyd, Hapag Lloyd.
GLOBAL TERMINAL & CONTAINER SERVICES, INC.
Location: Jersey City, New Jersey, USA.
Status of Terminal: A freehold 98.2 acre, two berth container facility.
Equipment/Facilities: 20 receiving/delivery gates; closed-circuit television system through-out
the Terminal for security and monitoring of operations; two deep water container vessel
berths (1,800 ft); six quayside container cranes including four Super post-Panamax cranes;
ten rubber-tyred gantry cranes (RTG’s) capable of stacking one over five containers high
and six wide plus a truck lane. All RTG’s are equipped with global positioning systems for
steering and live-time container locations; 44 yard tractors; seven toploaders; four side pickers;
24 yard chassis; various terminal vehicles for use by terminal supervision.
Building Facilities: 28,000 sq ft administration building; 4,000 sq ft marine operations building
and 25,000 sq ft maintenance and repair building.
Principal Customers: NYK, Hapag Lloyd, P&O Nedlloyd, OOCL, Columbia Coastal Transport,
The United States Military Traffic Management Command.
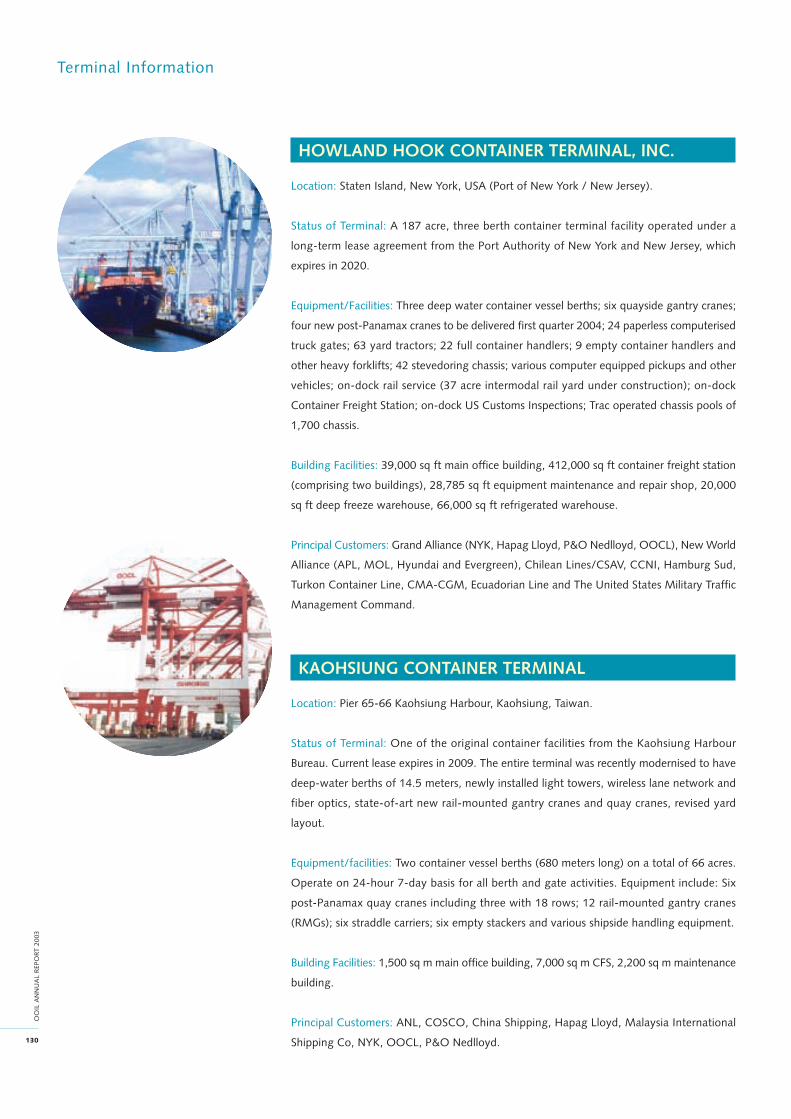
130
OO
IL A
NN
UA
L R
EPO
RT 2
003
Terminal Information
HOWLAND HOOK CONTAINER TERMINAL, INC.
Location: Staten Island, New York, USA (Port of New York / New Jersey).
Status of Terminal: A 187 acre, three berth container terminal facility operated under a
long-term lease agreement from the Port Authority of New York and New Jersey, which
expires in 2020.
Equipment/Facilities: Three deep water container vessel berths; six quayside gantry cranes;
four new post-Panamax cranes to be delivered first quarter 2004; 24 paperless computerised
truck gates; 63 yard tractors; 22 full container handlers; 9 empty container handlers and
other heavy forklifts; 42 stevedoring chassis; various computer equipped pickups and other
vehicles; on-dock rail service (37 acre intermodal rail yard under construction); on-dock
Container Freight Station; on-dock US Customs Inspections; Trac operated chassis pools of
1,700 chassis.
Building Facilities: 39,000 sq ft main office building, 412,000 sq ft container freight station
(comprising two buildings), 28,785 sq ft equipment maintenance and repair shop, 20,000
sq ft deep freeze warehouse, 66,000 sq ft refrigerated warehouse.
Principal Customers: Grand Alliance (NYK, Hapag Lloyd, P&O Nedlloyd, OOCL), New World
Alliance (APL, MOL, Hyundai and Evergreen), Chilean Lines/CSAV, CCNI, Hamburg Sud,
Turkon Container Line, CMA-CGM, Ecuadorian Line and The United States Military Traffic
Management Command.
KAOHSIUNG CONTAINER TERMINAL
Location: Pier 65-66 Kaohsiung Harbour, Kaohsiung, Taiwan.
Status of Terminal: One of the original container facilities from the Kaohsiung Harbour
Bureau. Current lease expires in 2009. The entire terminal was recently modernised to have
deep-water berths of 14.5 meters, newly installed light towers, wireless lane network and
fiber optics, state-of-art new rail-mounted gantry cranes and quay cranes, revised yard
layout.
Equipment/facilities: Two container vessel berths (680 meters long) on a total of 66 acres.
Operate on 24-hour 7-day basis for all berth and gate activities. Equipment include: Six
post-Panamax quay cranes including three with 18 rows; 12 rail-mounted gantry cranes
(RMGs); six straddle carriers; six empty stackers and various shipside handling equipment.
Building Facilities: 1,500 sq m main office building, 7,000 sq m CFS, 2,200 sq m maintenance
building.
Principal Customers: ANL, COSCO, China Shipping, Hapag Lloyd, Malaysia International
Shipping Co, NYK, OOCL, P&O Nedlloyd.

131
OO
IL A
NN
UA
L R
EPO
R T 2
003
Property Information
Property Development
a) Completed Projects - Residential
Group’s Year of Gross Floor Area
Project Name Location Interest % Completion (in square metre)
Orient Garden Shang Tang Lu, Hangzhou 50 1999 39,884
Fontainebleau Xing Guo Lu, Shanghai 100 1999 2,614
Joffre Gardens Nan Chang Lu, Shanghai 47.5 2000 72,502
The Courtyards Zhenning Lu, Shanghai 47.5 2001 65,789
Century Metropolis Ziyang Lu, Shanghai 47.5
- Phase 1A 2001 64,896
- Phase 1B 2003 83,298
- Phase 2A 2003 27,227
b) Projects Under Construction/Development - Residential
Group’s To Be Gross Floor Area
Project Name Location Interest % Completed In (in square metre)
Century Metropolis Ziyang Lu, Shanghai 47.5
- Phase 2B 2005 58,000
Changle Lu Project Changle Lu, Shanghai 88 2007 135,000
132
OO
IL A
NN
UA
L R
EPO
RT 2
003
Corporate Information
Executive Directors
Mr CC TUNG (Chairman)
Mr Tsann Rong CHANG
Mr Robert H SUAN
Mr Nicholas D SIMS
Mr Philip CHOW
Non-executive Director
Mr Roger KING
IndependentNon-executive Directors
Mr Simon MURRAY
Dr Victor K FUNG
Prof Richard WONG
Company Secretary
Ms Lammy LEE
Authorised Representative
Mr Nicholas D SIMS
Ms Lammy LEE
Audit Committee
Dr Victor K FUNG (Chairman)
Mr Simon MURRAY
Prof Richard WONG
Mr Nicholas D SIMS
Principal Office
33rd Floor
Harbour Centre
25 Harbour Road, Wanchai
Hong Kong
Registered Office
Clarendon House
2 Church Street
Hamilton HM11
Bermuda
Principal Registrar
Butterfield Fund Services (Bermuda) Limited
Rosebank Centre
11 Bermudiana Road
Pembroke
Bermuda
Branch Registrar
Computershare Hong Kong
Investor Services Limited
19th Floor
Hopewell Centre
183 Queen’s Road East, Wanchai
Hong Kong
Listing Exchange
The Stock Exchange of Hong Kong Limited
Stock Code : 0316
Website
http://www.ooilgroup.com
Major Bankers
HSBC Holdings plc
ABN AMRO Bank NV
Deutsche Bank AG
Deutsche Schiffsbank AG
ING Bank NV
HSH Nordbank AG
Den Norske Bank ASA
Solicitors
Conyers Dill & Pearman
Clarendon House
2 Church Street
Hamilton HM11
Bermuda
and at
2901 One Exchange Square
8 Connaught Place
Central
Hong Kong
Ince & Co
Rooms 3801-6, 38th Floor
Asia Pacific Finance Tower
Citibank Plaza
3 Garden Road
Hong Kong
Slaughter and May
47th Floor, Jardine House
One Connaught Place
Central
Hong Kong
Auditors
PricewaterhouseCoopers
Certified Public Accountants
22nd Floor
Prince’s Building
Hong Kong


