Report to: Overview and Scrutiny Committee (Regulatory, Compliance and Corporate services) Date of Meeting: 14 July 2015 Subject: Air Quality Monitoring Report of: Greg Martin Wards Affected: All Principal Environmental Health Officer Is this a Key Decision? No Is it included in the Forward Plan? No Exempt/Confidential No Purpose/Summary To provide a Briefing report on Air Quality Management in Sefton and the location of Monitoring Equipment and Air Quality Management Areas in the Borough Recommendation(s) The report be noted. Corporate Objective Positive Impact Neutral Impact Negative Impact 1 Creating a Learning Community X 2 Jobs and Prosperity X 3 Environmental Sustainability X 4 Health and Well-Being X 5 Children and Young People X 6 Creating Safe Communities X 7 Creating Inclusive Communities X 8 Improving the Quality of Council Services and Strengthening Local Democracy X
Transcript
Report to: Overview and Scrutiny Committee (Regulatory, Compliance and Corporate services)
Date of Meeting: 14 July 2015
Subject: Air Quality Monitoring
Report of: Greg Martin Wards Affected: All
Principal Environmental Health Officer
Is this a Key Decision? No Is it included in the Forward Plan? No
Exempt/Confidential No
Purpose/Summary
To provide a Briefing report on Air Quality Management in Sefton and the location of Monitoring Equipment and Air Quality Management Areas in the Borough
Recommendation(s)
The report be noted.
Corporate Objective Positive Impact
Neutral Impact
Negative Impact
1 Creating a Learning Community X
2 Jobs and Prosperity X
3 Environmental Sustainability X
4 Health and Well-Being X
5 Children and Young People X
6 Creating Safe Communities X
7 Creating Inclusive Communities X
8 Improving the Quality of Council Services and Strengthening Local Democracy
X
Reasons for the Recommendation:
To update member on the location of Air Quality monitoring equipment in the Borough
What will it cost and how will it be financed?
(A) Revenue Costs
None
(B) Capital Costs
None
Implications:
The following implications of this proposal have been considered and where there are specific implications, these are set out below:
Legal
None
Human Resources
None
Equality
1. No Equality Implication
2. Equality Implications identified and mitigated
3. Equality Implication identified and risk remains
Impact on Service Delivery:
None
What consultations have taken place on the proposals and when?
The Head of Corporate Finance and ICT has been consulted (FD3642/15) and notes the report indicates no direct financial implications for the Council.
The Head of Corporate Legal Services has been consulted and any comments have been incorporated into this report
x
Are there any other options available for consideration?
Implementation Date for the Decision
Following the meeting of the Committee
Contact Officer: Greg Martin Principal Environmental Health Officer
1.1 The concept of Local Air Quality Management (LAQM) was introduced under the Environment Act 1995. Evidence had shown that certain atmospheric pollutants are linked to poor health. The Environment Act places a statutory duty on all Local Authorities to review and assess air quality in their areas at regular intervals. The Air Quality Regulations made under the Environment Act 1995 specify the pollutants that must be considered and sets standards and objectives for each of the pollutants, which are referred to as National Air Quality Standard (NAQS) Objectives.
The pollutants that have to be considered are:
Pollutant Description National Air Quality Standard Objective (NAQS)
Date to be Achieved
Benzene An organic chemical compound emitted by some industrial processes and a constituent of petrol
5 µg/m3 (Annual Mean)
31.12.2010
1,3 Butadiene A Hydrocarbon based gas released from car exhausts
2.25µg/m3
(Annual Mean)31.12.2003
Carbon Monoxide An odourless colourless gas produced by incomplete combustion
10mg/m3
(8 hour mean)31.12.2003
Lead A heavy metal emitted by certain industrial processes
0.25µg/m3
(Annual Mean)31.12.2008
Nitrogen Dioxide A gas produced by internal combustion engines
200µg/m3
(1hr mean)not to exceeded more than 18 times per annum
31.12.2005
40µg/m3
(Annual mean)
Particulate Matter PM10
Particulates less than 10µm in diameter.
50µg/m3
(24hr mean)not to be exceeded more than 35 times per annum
40µg/m3
(Annual mean)
31.12.2004
Sulphur dioxide A gas which can be produced when burning fossil fuel
266µg/m3
(15 min mean)Not to be exceeded more than 35 times a year350µg/m3
(1hr mean)Not to be exceeded more than 24 times per year125µg/m3
(24hr mean)Not to be exceeded more than 3 times a year
31.12.2005
1.2 The review and assessment process has to take place every 3 years and if this review and assessment determines that any of the health based air quality objectives detailed above are unlikely to be met, the Local Authority has to identify Air Quality Management Area(s) (AQMA) for that defined area and produce an action plan to work towards compliance with the objective(s). In intervening years a progress report is also prepared.
1.3 The Review and Assessment is a 2 stage process. Initially an Updating and Screening Assessment (USA) is undertaken. This is intended to identify any significant changes that have occurred since the previous rounds of Review and Assessment were completed. The assessment includes a review of all new monitoring data, modelling, any new or changed sources and any other changes that might affect air quality, including new roads or major developments like the port expansion or the Thornton Link road.
1.4 If the updating and Screening Assessment identifies a risk of failing to meet the objectives then a Detailed Assessment has to be carried out. If this detailed assessment confirms that an exceedence is likely, an AQMA must be
identified. An action plan must also be developed to work towards compliance with the relevant NAQS objective(s).
1.5 Sefton has undertaken a number of Review and Assessments since the Environment Act placed this duty on Local Authorities. Copies of these reports can found be on Sefton’s Breathing space website along with air pollution monitoring data. http://breathingspace.sefton.gov.uk . As part of these previous assessments it has been determined that for the following pollutants, Benzene, 1,3 Butadiene, Carbon Monoxide, Lead and Sulphur Dioxide, the NAQS objectives will not be exceeded in Sefton and as such, no AQMAs have been declared for these pollutants. These pollutants will however be kept under regular review as part of the Review and Assessment process.
1.6 Through Detailed Assessments, however, a number of locations in Sefton have been identified where NAQS objectives for Particulates (PM10) and Nitrogen Dioxide (NO2) will not be met. AQMA’s have been identified in these locations which will be discussed in more detail later.
Monitoring
Real Time Automatic Monitoring Stations
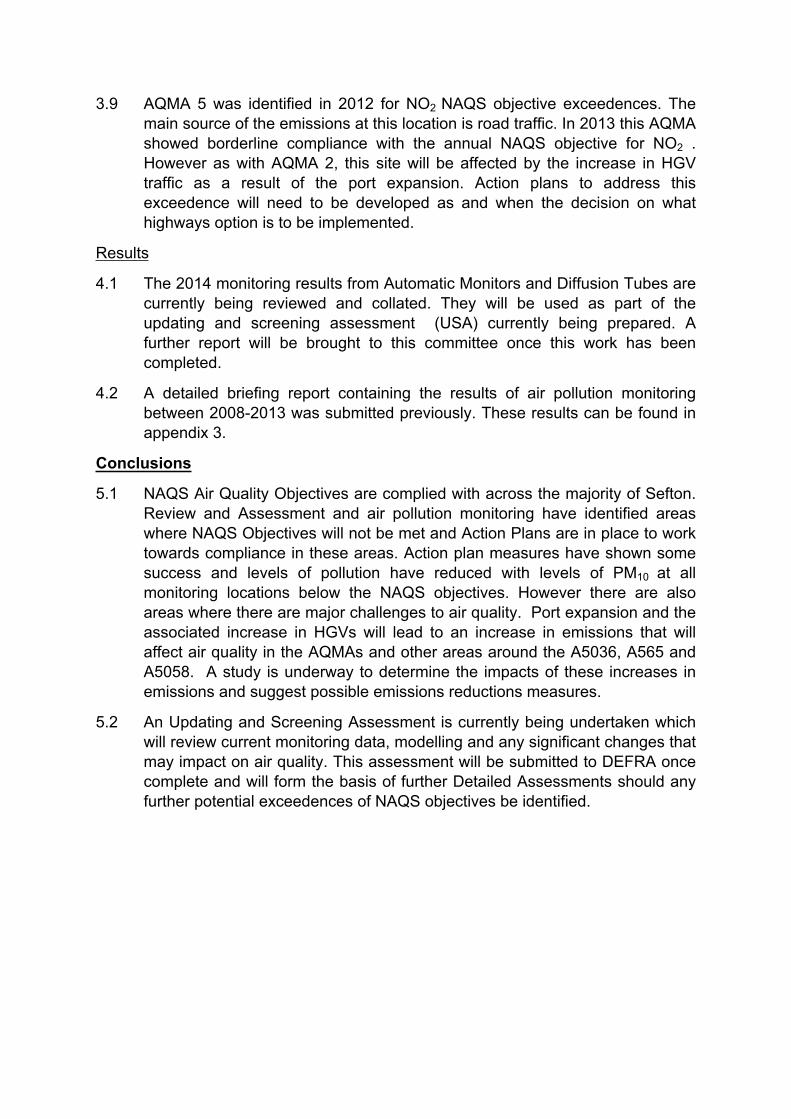
2.1 To assist and provide relevant data for the ongoing Air Quality Assessment process, Sefton currently monitors air quality in 5 locations in the South of the Borough measuring particulates (PM10), Nitrogen Dioxide (NO2 ) and Sulphur Dioxide (SO2) using sophisticated, real time automatic monitors. They are located in areas that represent relevant public exposure and are either in areas identified as AQMA’s or areas where further data is required to support the USA process. They are constantly recording levels of these pollutants to enable direct comparison with hourly, daily and annual mean NAQS objectives detailed above. The location of all 5 monitors is described in the table 1.
Maps showing the exact location can be found in appendix1
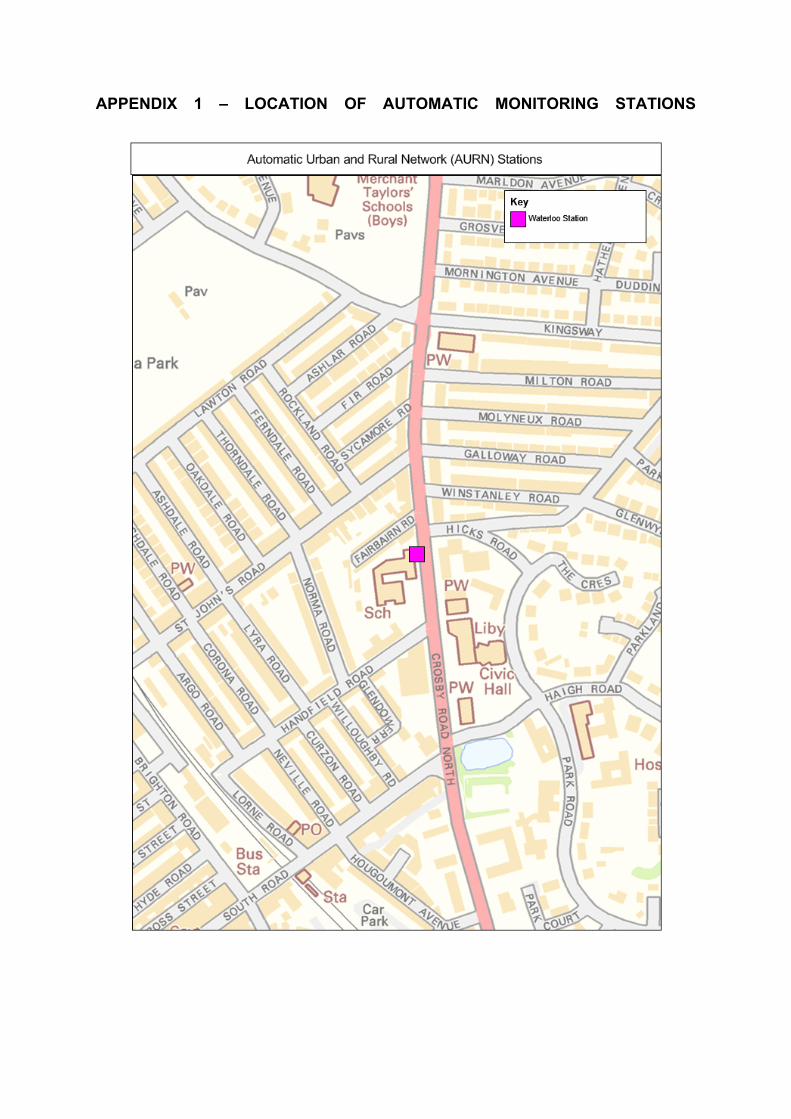
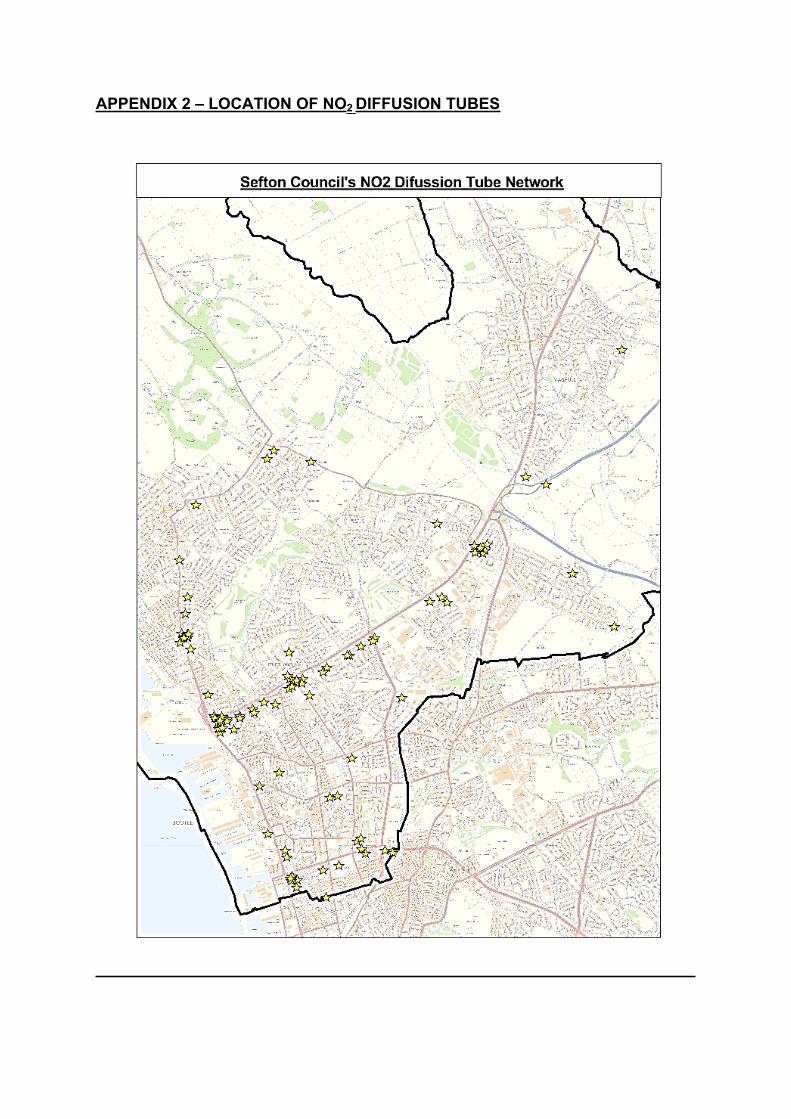
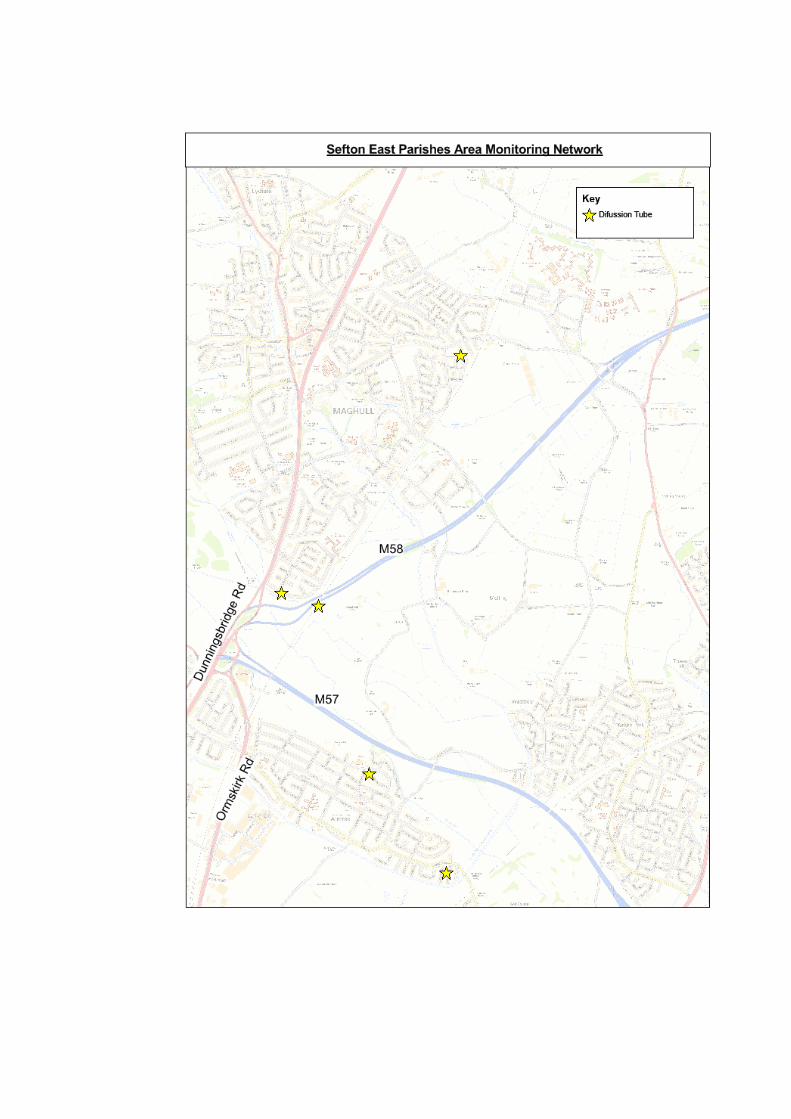
2.2 In addition to the real time monitors, Sefton measures monthly NO2 levels at approximately 100 sites across the Borough using diffusion tubes.
2.2 Diffusion tubes work by drawing air into the tube by the process of molecular diffusion. This works because the nitrogen dioxide in the air moves from a higher level at the open end of the tube to lower concentrations at the closed end of the tube. The NO2 is absorbed in the tube by a chemical called triethanolamine. After the monitoring has been completed (usually 4-5 weeks) the tube is collected and sent to a laboratory where the NO2 is removed and measured. The result is the average NO2 in the air at that location for one month.
2.3 The diffusion tubes are located in areas that have already been identified as AQMA’s or are located in areas, in close proximity to sensitive premises where additional data and monitoring is required into assess current/future NO2 levels as part of the ongoing Review and Assessment process. The monthly results from these tubes are combined to enable comparison with the annual mean NAQS objective for NO2. A number of sites have also been added to assess the impact the port expansion and subsequent highway improvement will have on NO2 levels.
Appendix 2 includes maps showing the current location of the diffusion tubes across the Borough.
Air Quality Management Areas (AQMAs)
3.1 As part of the ongoing air quality assessment process the boundaries of 5 AQMAs have been identified across the Borough where NAQS objectives have not been met.
AQMA 1 A565 Crosby Road North, WaterlooAQMA 2 A5036 Princess Way and Crosby Road South Junction,
Seaforth.AQMA 3 A5058 Millers Bridge and Derby Road Junction, Bootle.AQMA 4 A565 Crosby Road North and South Road Junction, WaterlooAQMA 5 B5422 Hawthorne Road and Church Road Junction, Litherland.
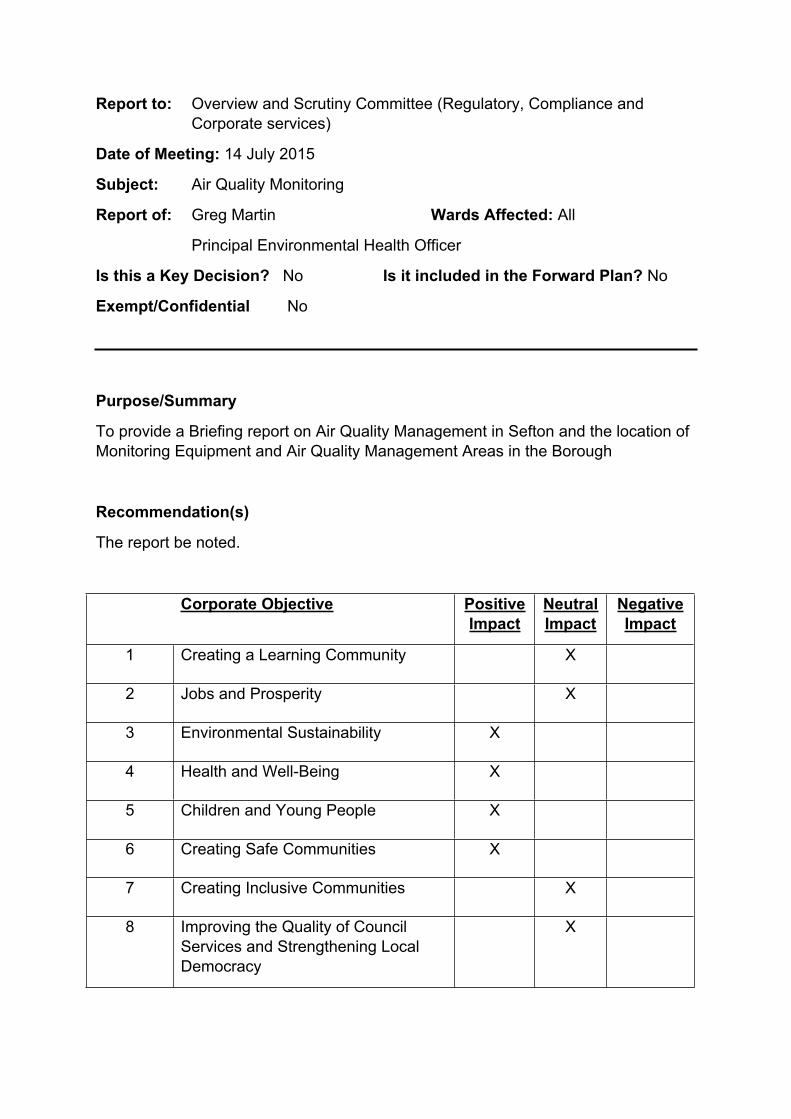
AQMA 1- Crosby Road North, Waterloo.
3.2 AQMA 1 was identified in 2009 for NAQS objective exceedences for PM10. The further assessment confirmed the exact boundaries of the AQMA. Since then a number of measures have been implemented as part of the Action Plan to reduce levels of PM10. The development of a Route Management Strategy Action Plan has also improved traffic flows in the area. As a result of these measures, the NAQS objective has consistently been met at this AQMA for the last 6 years.
AQMA 2-Princess Way, Seaforth.
3.3 AQMA 2 was identified in 2009 for NO2 exceedences. The boundaries of the AQMA were defined as part of the Further Assessment process. The main source of NO2 in this AQMA is considered to be emissions from HGV’s. Work is well underway on the deep water berth at the Port of Liverpool, which once in operation will undoubtedly increase the numbers of HGV’s using the A5036 and surrounding network. A major highways improvement intervention will be required to accommodate the increase in road traffic as a result of the port expansion. Action plans have been developed to look at options to reduce the levels of NO2 in this area, however, compliance with the NAQS objective in the short term is unlikely as the improvements predicted as a result of the site specific measures currently in place (the Eco Stars fleet recognition scheme and Port Booking system) are unlikely to have enough of an impact to enable compliance.
3.4 To try and address the significant challenge of reducing NO2 in this area, the Department has recently been successful in obtaining DEFRA grant funding to employ consultants to undertake a feasibility study into the use of alternative fuels for HGV’s. This may encourage fleet operators to use alternative fuelled vehicles which emit less NO2. The Highways Agency is currently looking at options to improve the highway network as a result of the port expansion and have appointed Atkins Consultants to assess the options. The Department is also undertaking internal air quality modelling to assess the air quality impact of the port expansion. This will allow us to challenge and critically review options put forward by the Highways Agency.
AQMA 3 Millers Bridge
3.5 AQMA 3 was identified in 2009 for exceedences of the PM10 and NO2 NAQS objectives. The main contributors to the emissions in this area were HGV’s and industrial processes on the dock estate. A number of measures have been implemented, historically, in this area as part of the action plan to reduce emissions. Intensive road and footpath washing has been undertaken to reduce the amount of particulates being re-suspended. A HGV hurry call system has also been introduced which gives priority to HGV’s heading up Millers Bridge, reducing the need for stopping at the traffic lights thus reducing emissions.
3.6 Officers from the Department continually work with operators and the Environment Agency to ensure industrial emissions are monitored and controlled effectively. The measures described above are having consistent positive effects on lowering emissions in the area.
3.7 As a result of these measures the NAQS objective for PM10 has consistently been met for the last 5 years. However this will be kept under review as the port expands in the future. With regard to NO2 the results of diffusion tube monitoring still show some exceedences of the annual NAQS objective in this AQMA .
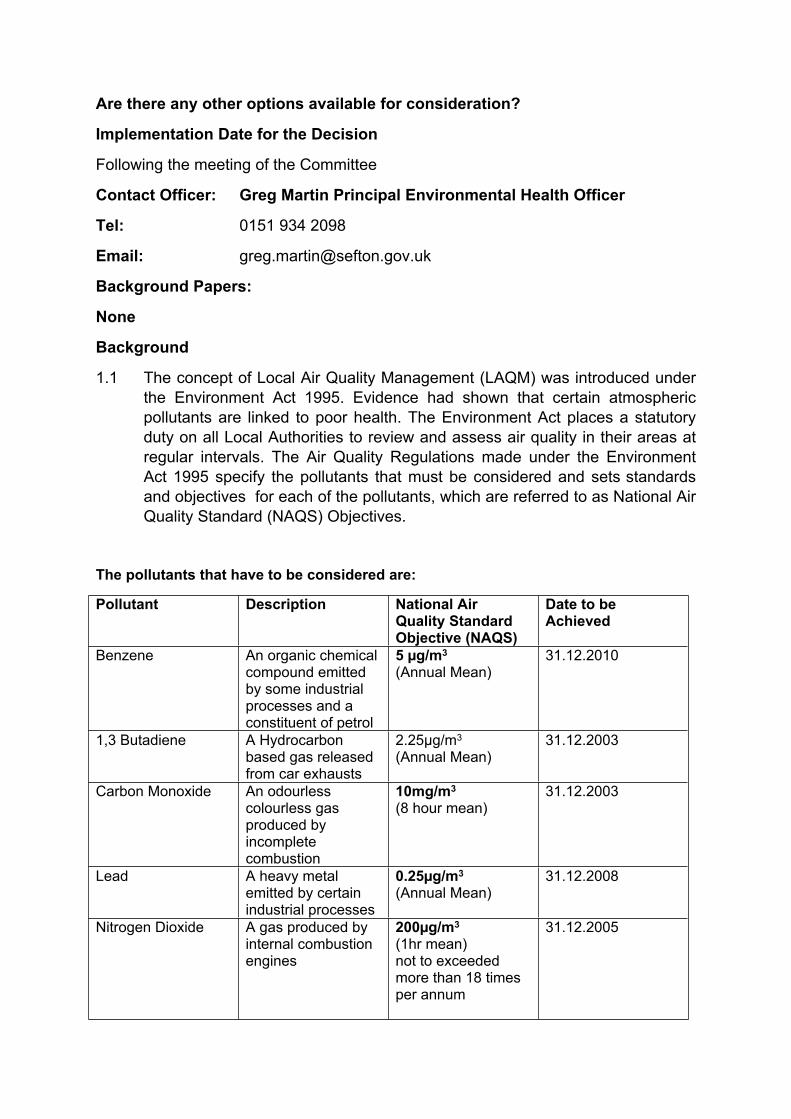
AQMA 4 Crosby Road North, South Road Waterloo
3.8 AQMA 4 was identified in 2012 for exceedences of the NO2 NAQS objective. As part the Action Plan to address this exceedence, improvements to the South Road and Haigh Road junction are planned to improve traffic flow. The junction improvement scheme has commenced and once complete, the results of the works will be assessed to determine compliance with the NAQS objective.
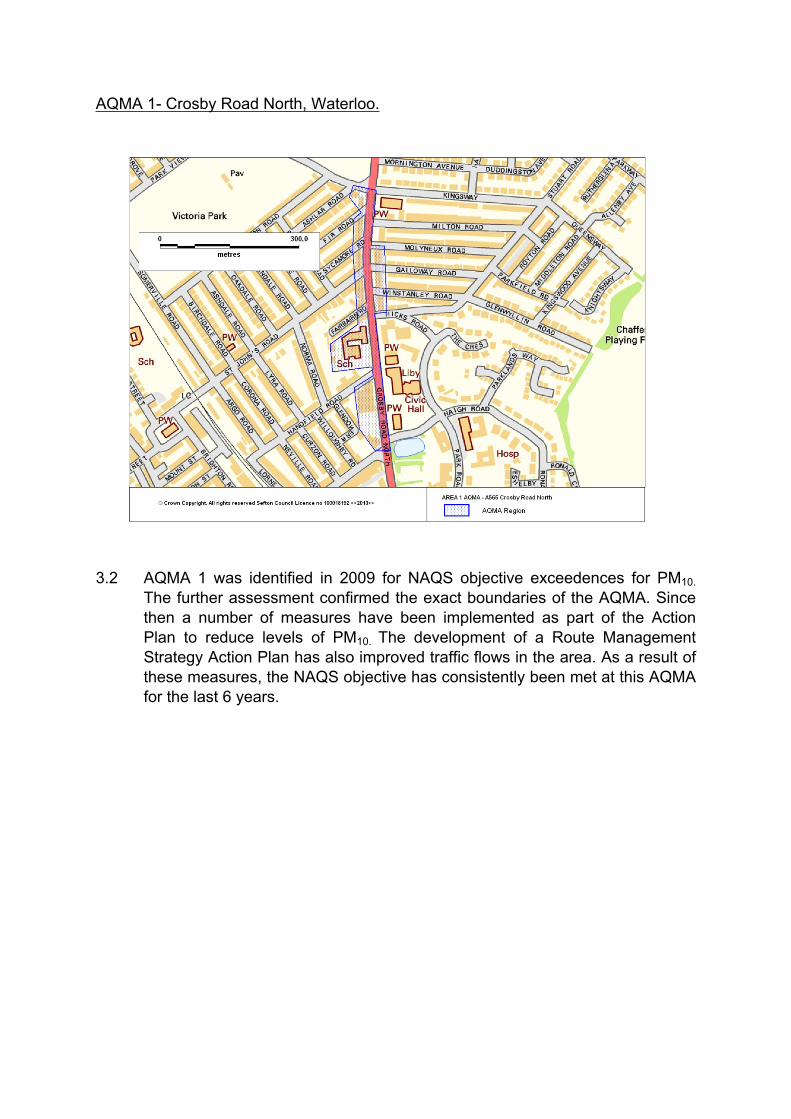
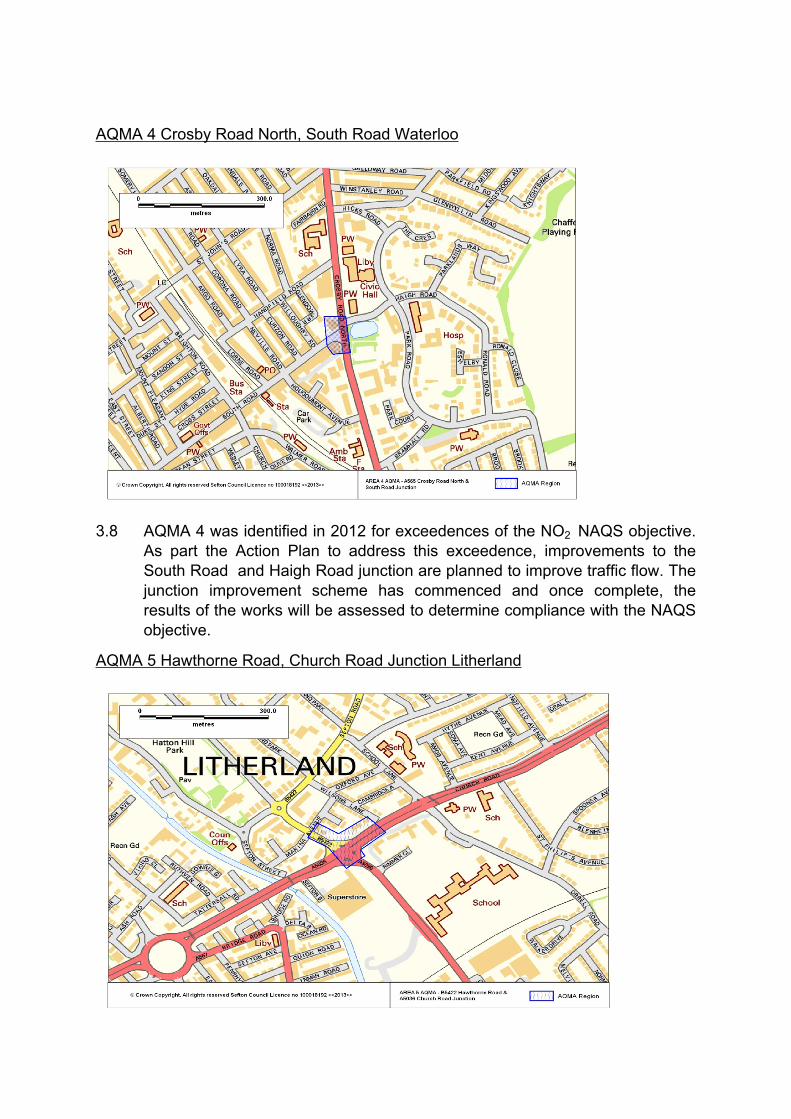
AQMA 5 Hawthorne Road, Church Road Junction Litherland
3.9 AQMA 5 was identified in 2012 for NO2 NAQS objective exceedences. The main source of the emissions at this location is road traffic. In 2013 this AQMA showed borderline compliance with the annual NAQS objective for NO2 . However as with AQMA 2, this site will be affected by the increase in HGV traffic as a result of the port expansion. Action plans to address this exceedence will need to be developed as and when the decision on what highways option is to be implemented.
Results
4.1 The 2014 monitoring results from Automatic Monitors and Diffusion Tubes are currently being reviewed and collated. They will be used as part of the updating and screening assessment (USA) currently being prepared. A further report will be brought to this committee once this work has been completed.
4.2 A detailed briefing report containing the results of air pollution monitoring between 2008-2013 was submitted previously. These results can be found in appendix 3.
Conclusions
5.1 NAQS Air Quality Objectives are complied with across the majority of Sefton. Review and Assessment and air pollution monitoring have identified areas where NAQS Objectives will not be met and Action Plans are in place to work towards compliance in these areas. Action plan measures have shown some success and levels of pollution have reduced with levels of PM10 at all monitoring locations below the NAQS objectives. However there are also areas where there are major challenges to air quality. Port expansion and the associated increase in HGVs will lead to an increase in emissions that will affect air quality in the AQMAs and other areas around the A5036, A565 and A5058. A study is underway to determine the impacts of these increases in emissions and suggest possible emissions reductions measures.
5.2 An Updating and Screening Assessment is currently being undertaken which will review current monitoring data, modelling and any significant changes that may impact on air quality. This assessment will be submitted to DEFRA once complete and will form the basis of further Detailed Assessments should any further potential exceedences of NAQS objectives be identified.
APPENDIX 1 – LOCATION OF AUTOMATIC MONITORING STATIONS
APPENDIX 2 – LOCATION OF NO2 DIFFUSION TUBES
APPENDIX 3 – MONITORING RESULTS UPTO 2013
Nitrogen dioxide (NO2)
Real Time Monitors
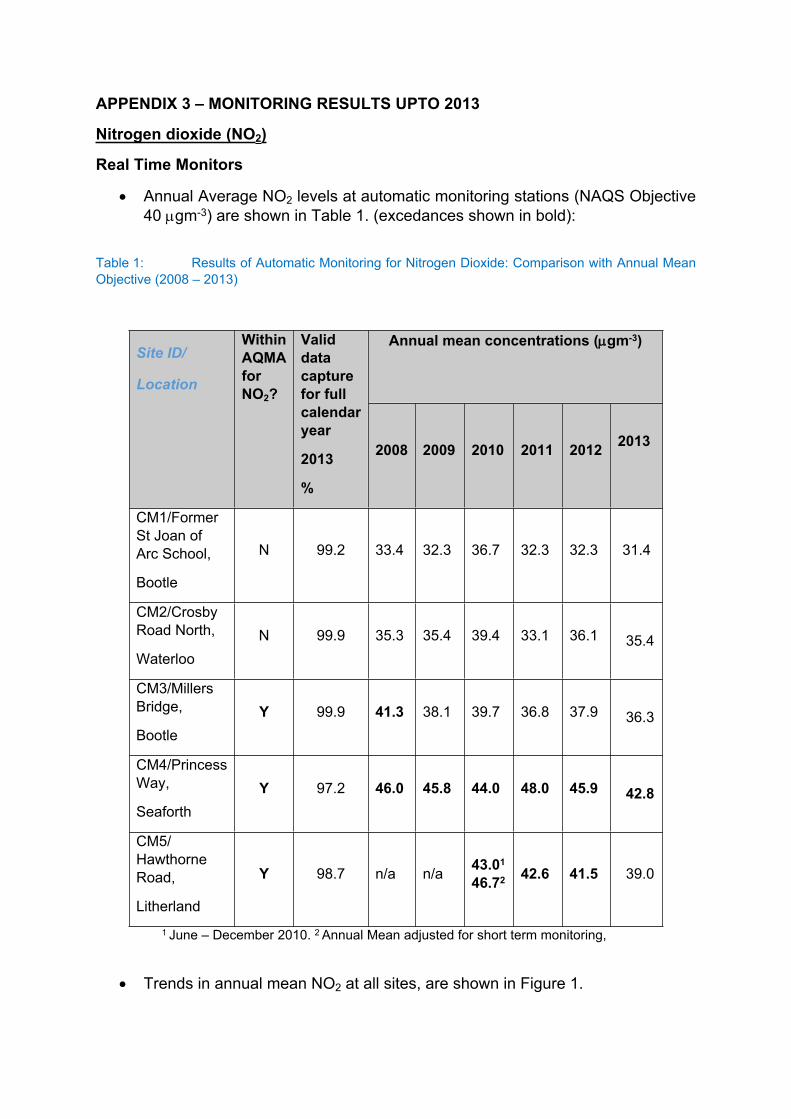
Annual Average NO2 levels at automatic monitoring stations (NAQS Objective 40 gm-3) are shown in Table 1. (excedances shown in bold):
Table 1: Results of Automatic Monitoring for Nitrogen Dioxide: Comparison with Annual Mean Objective (2008 – 2013)
Annual mean concentrations (gm-3)Site ID/
Location
Within AQMA for NO2?
Valid data capture for full calendar year
2013
%
2008 2009 2010 2011 2012 2013
CM1/Former St Joan of Arc School,
Bootle
N 99.2 33.4 32.3 36.7 32.3 32.3 31.4
CM2/Crosby Road North,
WaterlooN 99.9 35.3 35.4 39.4 33.1 36.1 35.4
CM3/Millers Bridge,
BootleY 99.9 41.3 38.1 39.7 36.8 37.9 36.3
CM4/Princess Way,
SeaforthY 97.2 46.0 45.8 44.0 48.0 45.9 42.8
CM5/ Hawthorne Road,
Litherland
Y 98.7 n/a n/a 43.01 46.72 42.6 41.5 39.0
1 June – December 2010. 2 Annual Mean adjusted for short term monitoring,
Trends in annual mean NO2 at all sites, are shown in Figure 1.
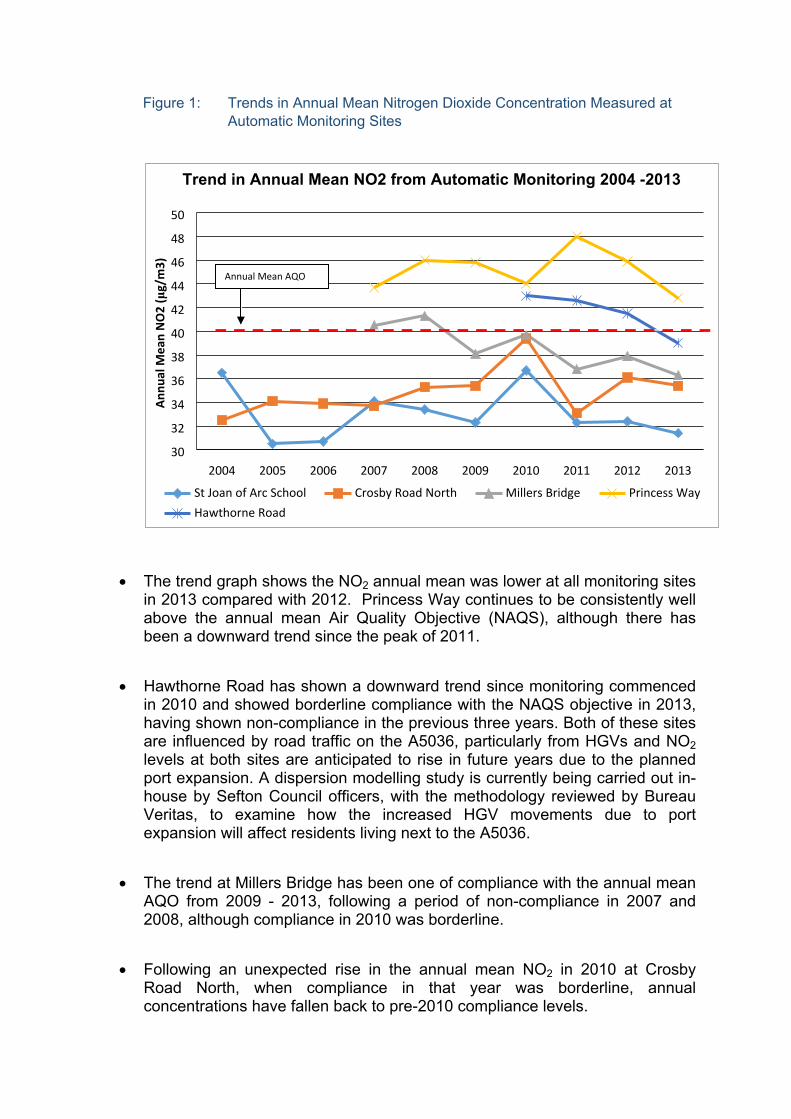
Figure 1: Trends in Annual Mean Nitrogen Dioxide Concentration Measured at Automatic Monitoring Sites
St Joan of Arc School Crosby Road North Millers Bridge Princess Way
Hawthorne Road
Trend in Annual Mean NO2 from Automatic Monitoring 2004 -2013A
nnua
l Mea
n N
O2
(μg/
m3)
The trend graph shows the NO2 annual mean was lower at all monitoring sites in 2013 compared with 2012. Princess Way continues to be consistently well above the annual mean Air Quality Objective (NAQS), although there has been a downward trend since the peak of 2011.
Hawthorne Road has shown a downward trend since monitoring commenced in 2010 and showed borderline compliance with the NAQS objective in 2013, having shown non-compliance in the previous three years. Both of these sites are influenced by road traffic on the A5036, particularly from HGVs and NO2 levels at both sites are anticipated to rise in future years due to the planned port expansion. A dispersion modelling study is currently being carried out in-house by Sefton Council officers, with the methodology reviewed by Bureau Veritas, to examine how the increased HGV movements due to port expansion will affect residents living next to the A5036.
The trend at Millers Bridge has been one of compliance with the annual mean AQO from 2009 - 2013, following a period of non-compliance in 2007 and 2008, although compliance in 2010 was borderline.
Following an unexpected rise in the annual mean NO2 in 2010 at Crosby Road North, when compliance in that year was borderline, annual concentrations have fallen back to pre-2010 compliance levels.
Annual Mean AQO
The former St Joan of Arc School site continues to show compliance with the NO2 annual mean AQO. Due to sale of the land at this site the monitoring station will be moved to a new location in this area.
Automatic monitoring results for NO2 for comparison with the 1-hour mean Objective continue to show compliance with the AQO at all current monitoring sites in Sefton. Results from 2008 - 2013 are shown in Table 2.
Table 2 Results of Automatic Monitoring for Nitrogen Dioxide: Comparison with 1-hour Mean Objective (2008 – 2013)
Number of Exceedences of hourly mean (200 gm-3) no more than 18 per year
*Where the period of valid data is less than 90% of a full year, the 99.8th percentile of hourly means is shown in brackets.
Site ID/ Location
Within AQMA for NO2?
Valid data capture for full calendar year
2013
%2008 2009 2010 2011 2012 2013
CM1/ Former St Joan of Arc School,
Bootle
N 99.2 0 0 0 0 0 0
CM2/ Crosby Road North,
Waterloo
N 99.9 0 0 0 0 1 1
CM3/ Millers Bridge,
Bootle
Y 99.9 2 2 1 0 0 0
CM4/Princess Way,
Seaforth
Y 97.2 0 0 0 2 3 0
CM5/ Hawthorne Road,
Litherland
Y 98.7 n/a n/a 1 0 0 0
Diffusion Tubes
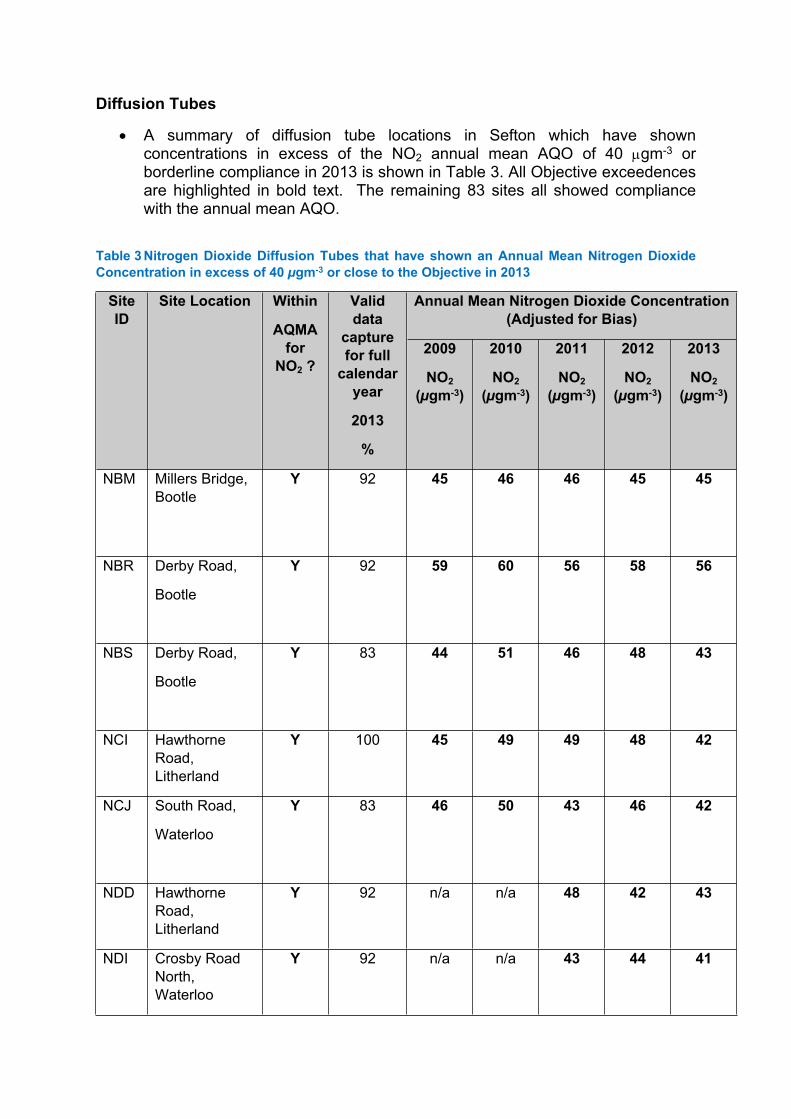
A summary of diffusion tube locations in Sefton which have shown concentrations in excess of the NO2 annual mean AQO of 40 gm-3 or borderline compliance in 2013 is shown in Table 3. All Objective exceedences are highlighted in bold text. The remaining 83 sites all showed compliance with the annual mean AQO.
Table 3 Nitrogen Dioxide Diffusion Tubes that have shown an Annual Mean Nitrogen Dioxide Concentration in excess of 40 µgm-3 or close to the Objective in 2013
Annual Mean Nitrogen Dioxide Concentration (Adjusted for Bias)
Site ID
Site Location Within
AQMA for
NO2 ?
Valid data
capture for full
calendar year
2013
%
2009
NO2 (µgm-3)
2010
NO2 (µgm-3)
2011
NO2 (µgm-3)
2012
NO2 (µgm-3)
2013
NO2 (µgm-3)
NBM Millers Bridge, Bootle
Y 92 45 46 46 45 45
NBR Derby Road,
Bootle
Y 92 59 60 56 58 56
NBS Derby Road,
Bootle
Y 83 44 51 46 48 43
NCI Hawthorne Road, Litherland
Y 100 45 49 49 48 42
NCJ South Road,
Waterloo
Y 83 46 50 43 46 42
NDD Hawthorne Road, Litherland
Y 92 n/a n/a 48 42 43
NDI Crosby Road North, Waterloo
Y 92 n/a n/a 43 44 41
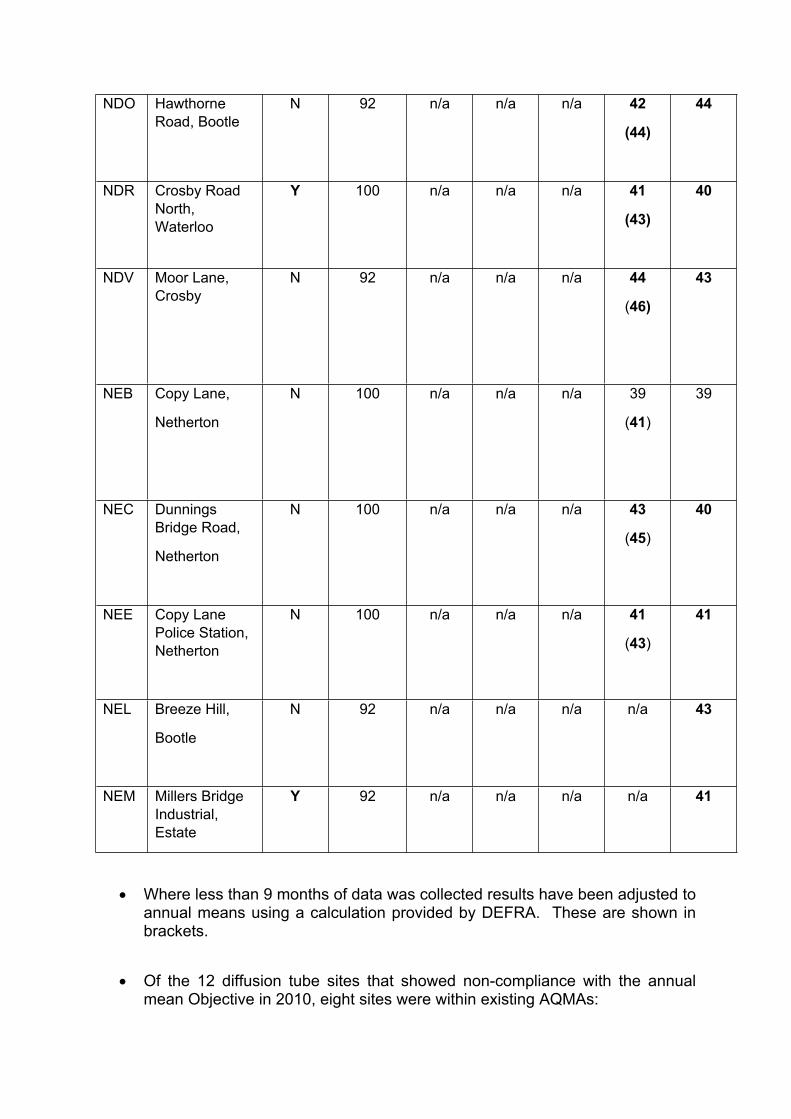
NDO Hawthorne Road, Bootle
N 92 n/a n/a n/a 42
(44)
44
NDR Crosby Road North, Waterloo
Y 100 n/a n/a n/a 41
(43)
40
NDV Moor Lane, Crosby
N 92 n/a n/a n/a 44
(46)
43
NEB Copy Lane,
Netherton
N 100 n/a n/a n/a 39
(41)
39
NEC Dunnings Bridge Road,
Netherton
N 100 n/a n/a n/a 43
(45)
40
NEE Copy Lane Police Station, Netherton
N 100 n/a n/a n/a 41
(43)
41
NEL Breeze Hill,
Bootle
N 92 n/a n/a n/a n/a 43
NEM Millers Bridge Industrial, Estate
Y 92 n/a n/a n/a n/a 41
Where less than 9 months of data was collected results have been adjusted to annual means using a calculation provided by DEFRA. These are shown in brackets.
Of the 12 diffusion tube sites that showed non-compliance with the annual mean Objective in 2010, eight sites were within existing AQMAs:
Four locations, sites NBM, NBR, NBS and NEM are within the existing Millers Bridge, Bootle AQMA (AQMA 3).
Two locations, sites NCJ and NDI are within the existing South Road/Crosby Road North AQMA (AQMA 4).
Two locations, sites NCI and NDD Hawthorne Road are within the existing Hawthorne Road AQMA (AQMA 5).
Of the remaining 4 diffusion tube sites that showed non-compliance with the annual mean Objective in 2012:
NDO (Hawthorne Road, Bootle) is located near to the junction with Linacre Lane and was sited to monitor NO2 levels at a new development of flats on Hawthorne Road. An annual mean of 44 µgm-3 was recorded in 2013. As the AQO applies at the façade of the property, the Defra NO2 fall off with distance calculator was used to estimate the NO2 concentration at the property façade to assess relevant exposure. This showed at annual mean of 36.5 µgm-3 at the façade which is below the AQO.
NDV (Moor Lane, Crosby) is located close to a roundabout and was sited to assess levels at the property opposite a pedestrian crossing, as this appeared to be a potentially more polluted site than a site which had been set up at the opposite side of the roundabout, site NCK (The Northern Road, Crosby) which had previously shown an annual mean of 36 µgm-3 in 2010. An annual mean of 43 µgm-3 was recorded for NDV in 2013. The Defra NO2 fall off with distance calculator was used to estimate the NO2 concentration at the property façade to assess relevant exposure. This showed an annual mean of 30.6 µgm-3 at the façade which is below the AQO.
NEE (Copy Lane Police Station) is located close to the A5036 Dunnings Bridge Road / Copy Lane junction. An annual mean of 41 µgm-3 was recorded for NEE in 2013, however there is no relevant public exposure at this location as employment sites are not counted as relevant exposure in the LAQM regime. The tube was sited here to build up a picture of NO2 levels close to the A5036 and the junction to assist in the assessment of the impacts of port expansion.
NEL (Breeze Hill) is located near to the A5058 Breeze Hill/ A5038Southport Road junction. This tube was set up to replace tube NEN Manor Close, to assess NO2 level at residential property more affected by queuing traffic at the traffic lights in this area. An annual mean of 43 µgm-3
was recorded for NEL in 2013. The Defra NO2 fall off with distance
calculator was used to estimate the NO2 concentration at the property façade to assess relevant exposure. This showed at annual mean of 36.4 µgm-3 at the façade which is below the AQO.
Of the two sites that recorded an annual mean of 40 µgm-3 :
NDR (Crosby Road North) is within the existing South Road/Crosby Road North AQMA 4.
NEC (Dunnings Bridge Road) is located close to the A5036 Dunnings Bridge Road/Copy Lane junction. There is no relevant public exposure at this location. The site was selected to build up a picture of NO2 levels close to the A5036 and the junction to assist in the assessment of the impacts of port expansion.
The single site that showed borderline compliance with the Objective in 2013, with a recorded annual mean of 39 µgm-3 was NEB (Copy Lane). The measurement was taken 0.5 m from the kerb and the nearest relevant exposure is 15m away. The Defra NO2 fall off with distance calculator was used to estimate the NO2 concentration at the property façade to assess relevant exposure. This showed an annual mean of 28.8 µgm-3 at the façade which is below the AQO.
The results of diffusion tube monitoring have shown annual mean NO2 concentrations to be above the annual mean Air Quality Objective at a number of locations. However these were either at sites already within existing AQMAs, at locations where there is no relevant public exposure, or were such that the drop off in concentration with distance showed compliance with the Objective at the nearest public exposure receptor.
Nitrogen dioxide diffusion tubes are widely used to assess annual mean concentrations against the Objective. However research studies have looked at the relationship between the annual mean and the 1-hour mean Objective. The technical guidance currently advises that local authorities can assume that exceedences of the 1-hour Objective are only likely to occur where the annual mean concentrations are 60 gm-3 or above. There were no diffusion tube site locations where the measured annual mean concentration in 2013 was greater than 60 µgm-3.
Fine particles (PM10)
Automatic monitoring results for PM10: comparison with the annual mean Objective (40 µgm-3), at all current monitoring sites in Sefton are shown in Table 4. Objective exceedences are highlighted in bold text.
Table 4 Results of PM10 Automatic Monitoring: Comparison with Annual Mean Objective (2008 – 2013)
Annual Mean PM10 Concentrations (µgm-
3)Site ID/ Location
Within AQMA
for PM10?
Valid data capture for full calendar year
2013
%
2008 2009 2010 2011 2012 2013
CM1/Former St Joan of Arc School,
Bootle
N 85.5 26.11 22.92 22.4 24.6 27.1 28.5
CM2/Crosby Road North,
WaterlooY 96.1 27.3 26.1 27.0 31.3 25.4 28.3
CM3/Millers Bridge,
Bootle Y 94.0 33.3 29.9 28.4 29.8 26.1 28.1
CM4/Princess Way,
Seaforth N 83.4 26.3 24.3 23.1 27.8 24.9 26.5
1Jan – Sept, 2 March – Dec
Results of automatic monitoring has shown compliance with the PM10 annual mean Objective at all sites in 2013 and in all years that monitoring has been undertaken.
The trends in annual mean PM10 at all sites are shown in Figure 2.
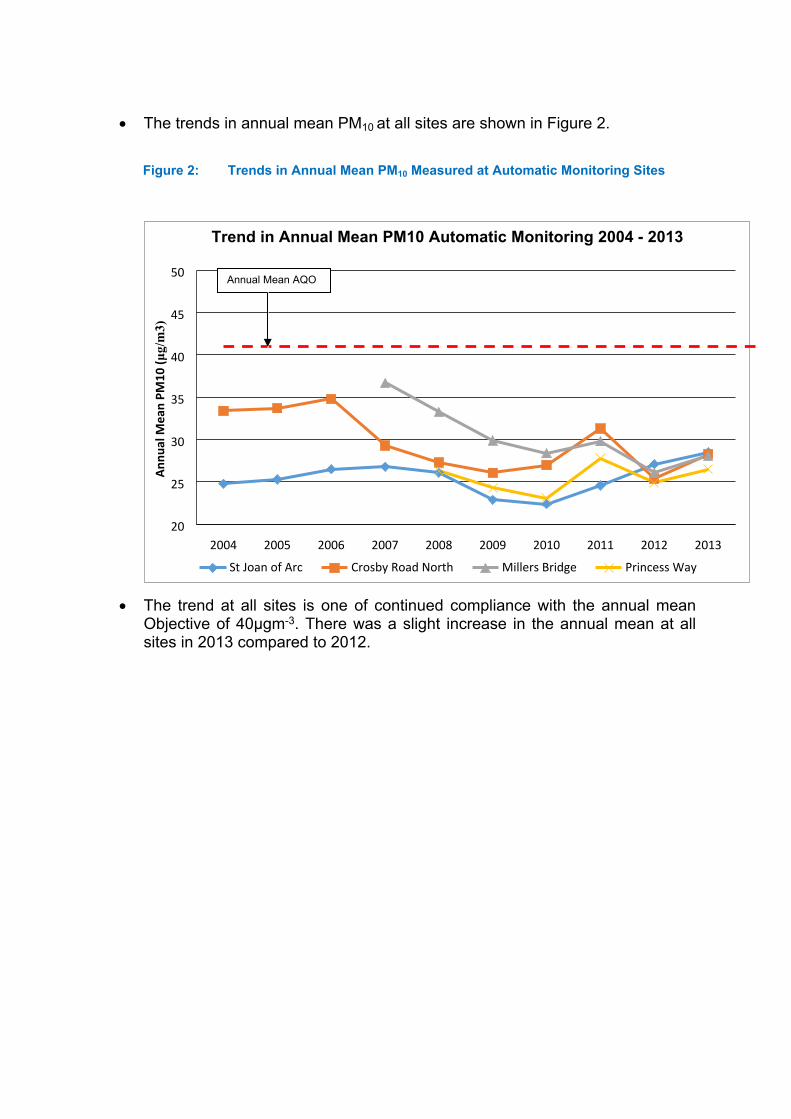
Figure 2: Trends in Annual Mean PM10 Measured at Automatic Monitoring Sites
St Joan of Arc Crosby Road North Millers Bridge Princess Way
Trend in Annual Mean PM10 Automatic Monitoring 2004 - 2013
Ann
ual M
ean
PM10
(μg/m3)
The trend at all sites is one of continued compliance with the annual mean Objective of 40µgm-3. There was a slight increase in the annual mean at all sites in 2013 compared to 2012.
Annual Mean AQO
Automatic monitoring results for PM10: for comparison with the 24-hour mean Objective (50 µgm-3, 35 exceedences allowed in 1 year), at all current monitoring sites in Sefton are shown in Table 5. Objective exceedences are highlighted in bold text.
Table 5: Results of PM10 Automatic Monitoring: Comparison with 24-hour Mean Objective (2008 – 2013)
Number of Exceedences of PM10 Daily Mean Objective (50 µgm-3)
Max 35 exceedences
Site ID/ Location
Within AQMA
for PM10?
Valid data capture for full calendar year
2013
%2008 2009 2010 2011 2012 2013
CM1/Former St Joan of Arc School
Bootle
N 85.5 51 02 1 4 5 183
CM2/Crosby Road North Waterloo
Y 96.1 14 10 16 31 18 17
CM3/Millers Bridge
BootleY 94.0 33 11 20 25 13 17
CM4/Princess Way
SeaforthN 83.4 15 7 6 20 15 124
1Jan – Sept, 2 March – Dec, 3 90.4th percentile of daily means 44 µgm-3, 4 90.4th percentile of daily means 43 µgm-3.
Results of automatic monitoring has shown compliance with the daily mean Objective at all sites in 2013.
The trends in the number of exceedences of the PM10 24-hour mean Standard at all sites are shown in Figure 3
Figure 3 Trends in the number of exceedences of the PM10 24-hour mean Standard Measured at Automatic Monitoring Sites
St Joan of Arc Crosby Road North Millers Bridge Princess Way
Trend in the number of Exceedences of the24-Hour Mean PM10 Standard 2004 - 2013
No.
of d
ays
of e
xcee
denc
e
The trends show continued compliance with the 24 hour mean Objective at all sites since 2008. The number of exceedences at Crosby Road North, Millers Bridge and Princess Way in 2013 was not significantly different from 2012. However the former St Joan of Arc School site showed a marked increase in the number of exceedences from 5 to 18. The reason for this is currently being investigated.
The high number of daily exceedences recorded at Crosby Road North in 2006 that led to AQMA declaration has not been repeated. The actions as part of the Route Management Plan adopted for the A565 corridor through Crosby have contributed to compliance with the AQO at this site. A Detailed Assessment completed in 2014 concluded that the AQMA declaration at Crosby Road North could be revoked. A briefing report concerning revocation of this AQMA has been provided for Cabinet member Environment.