Corporate Social and Financial Performance: A Meta-analysisMarc Orlitzky, Frank L. Schmidt, Sara L. Rynes
Abstract
Most theorizing on the relationship between corporate social/environmentalperformance (CSP) and corporate financial performance (CFP) assumes that thecurrent evidence is too fractured or too variable to draw any generalizable conclusions.With this integrative, quantitative study, we intend to show that the mainstream claimthat we have little generalizable knowledge about CSP and CFP is built on shakygrounds. Providing a methodologically more rigorous review than previous efforts,we conduct a meta-analysis of 52 studies (which represent the population of priorquantitative inquiry) yielding a total sample size of 33,878 observations. The meta-analytic findings suggest that corporate virtue in the form of social responsibility and,to a lesser extent, environmental responsibility is likely to pay off, although theoperationalizations of CSP and CFP also moderate the positive association. Forexample, CSP appears to be more highly correlated with accounting-based measuresof CFP than with market-based indicators, and CSP reputation indices are more highlycorrelated with CFP than are other indicators of CSP. This meta-analysis establishesa greater degree of certainty with respect to the CSP–CFP relationship than is currentlyassumed to exist by many business scholars.
Keywords: social responsibility, business ethics, stakeholder theory, reputation,environmental management, correlation analysis
‘Can business meet new social, environmental, and financial expectations and stillwin?’ (Business Week 1999)
Introduction
The performance of business organizations is affected by their strategies andoperations in market and non-market environments (Baron 2000). Theincreasing power of activist groups and the media in pluralist western societiescan be expected to make organizations’ non-market strategies even moreimportant. One construct that might capture a major element of these non-market strategies is corporate social performance (CSP). CSP can be definedas ‘a business organization’s configuration of principles of social responsi-bility, processes of social responsiveness, and policies, programs, andobservable outcomes as they relate to the firm’s societal relationships’ (Wood1991a: 693).
The impression that ‘in the aggregate, results are inconclusive’ regardingany theoretical conclusions about the relationship between CSP and corporatefinancial performance (CFP) has persisted until today (Jones and Wicks 1999:212; cf. also Donaldson 1999; McWilliams and Siegel 2001; Roman et al.1999). Ullmann (1985) and Wood and Jones (1995) argued that during thepast three decades of empirical research on this relationship, researchers haveengaged in a futile search for stable causal patterns. A number of narrativereviews and theories (for example, Aupperle et al. 1985; Griffin and Mahon1997; Husted 2000; McWilliams and Siegel 2001; Pava and Krausz 1995;Ullmann 1985; Wartick and Cochran 1985; Wood 1991a, 1991b; Wood andJones 1995) have proposed conceptual explanations for the existence (or lackthereof) of a causal relationship between CSP and CFP, but failed to provideclear answers. Previous reviews of this area have suggested that such factorsas stakeholder mismatching (Wood and Jones 1995), the general neglect ofcontingency factors (for example, Ullmann 1985), and measurement errors(for example, Waddock and Graves 1997) may explain inconsistent findings.Other authors, failing to see important differences between theory andoperational context, are even more pessimistic and call for a moratorium ofCSP–CFP research (Margolis and Walsh 2001; Rowley and Berman 2000).Before we embark on a costly search for contingencies or abandon a line ofinquiry altogether, a theoretically and empirically meaningful integration ofthis area might be useful. In this article, we argue that this line of inquirycontains a number of theoretical conclusions that have hitherto beenoverlooked or ignored by many organizational scholars.
This article presents a meta-analytic review of primary quantitative studiesof the CSP–CFP relationship. Meta-analysis has proven to be a usefultechnique in many substantive areas where multiple individual studies haveyielded inconclusive or conflicting results (for example, Damanpour 1991;Datta et al. 1992; Gooding and Wagner 1985; Schwenk 1989; see also Hedges1987; Hunt 1997; Rosenthal and DiMatteo 2001; and Schmidt 1992 forbroader reviews of meta-analysis). By statistically aggregating results acrossindividual studies and correcting for statistical artefacts such as samplingerror and measurement error, psychometric meta-analysis allows for muchgreater precision than other forms of research reviews. Ironically, thoseresearchers that question the meaningfulness of the CSP–CFP research streamthe most (Griffin and Mahon 1997; Margolis and Walsh 2001) have integratedthe empirical evidence with the so-called ‘vote-counting’ technique, which,for a variety of reasons, has been shown to be invalid by many statisticalexperts (Hedges and Olkin 1980; Hunter and Schmidt 1990; Rosenthal 1995;Schmidt 1992). When, in ‘vote counting’, studies are simply coded asshowing significantly positive, negative, or statistically non-significant results,conclusions are likely to be false (Hedges and Olkin 1980; Hunter andSchmidt 1990). In contrast, psychometric meta-analysis quantifies the impactof theoretical and methodological deficiencies in a given line of inquiry andis, therefore, at present, the most sophisticated research-integration technique.
The specific objectives of this meta-analysis are to: (1) provide a statisticalintegration of the accumulated research on the relationship between CSP and
404 Organization Studies 24(3)
CFP; (2) assess the relative predictive validity of instrumental stakeholdertheory in the context of the CSP–CFP relationship; and (3) examine severalmoderators, such as operationalization of CSP and CFP (that is, measurementstrategies) and timing of CSP and CFP measurement. In so doing, it buildson earlier research by: (a) including market (stock) return measures in additionto accounting returns; (b) including CSP measures other than social-responsibility audits performed by Kinder, Lydenberg, Domini & Co., Inc.;(c) responding to Waddock and Graves’ (1997: 315) call for research on thetemporal consistency of results, independent of the time lag chosen betweenCSP and CFP measures; and (d) integrating empirical results across diversestudy contexts and enabling us to look for theoretical moderators andstatistical artefacts that might explain the highly variable results acrossprevious studies.
Theory and Hypotheses
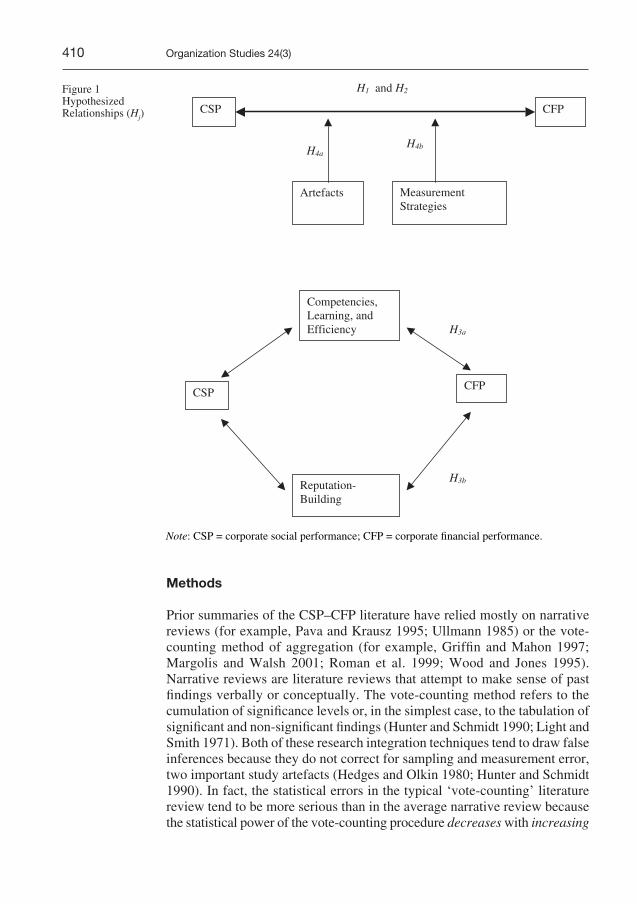
Overall CSP–CFP Relationship
Instrumental stakeholder theory (for example, Clarkson 1995; Cornell andShapiro 1987; Donaldson and Preston 1995; Freeman 1984; Mitchell et al.1997 (the classification of these studies as exemplifying ‘instrumentalstakeholder theory’ was made ex post)) suggests a positive relationshipbetween CSP and CFP. According to this theory, the satisfaction of variousstakeholder groups is instrumental for organizational financial performance(Donaldson and Preston 1995; Jones 1995). Stakeholder-agency theory arguesthat the implicit and explicit negotiation and contracting processes entailedby reciprocal, bilateral stakeholder–management relationships serve asmonitoring and enforcement mechanisms that prevent managers fromdiverting attention from broad organizational financial goals (Hill and Jones1992; Jones 1995). Furthermore, by addressing and balancing the claims ofmultiple stakeholders (Freeman and Evan 1990), managers can increase theefficiency of their organization’s adaptation to external demands.
Additionally, according to a firm-as-contract analysis (Freeman and Evan1990), high corporate performance results not only from the separatesatisfaction of bilateral relationships (Hill and Jones 1992), but also from thesimultaneous coordination and prioritization of multilateral stakeholderinterests. These strategic and tactical steps may be necessary to reduce thelikelihood of the organization’s becoming stuck in a high-density network.High network density can reduce CFP in a number of ways (Rowley 1997).For example, in a high-density network, firms may become stuck in the roleof compromiser or subordinate, depending on the degree of the firm’s networkcentrality (Rowley 1997). Either of these roles may lead to furtherconsumption of valuable firm resources such as time, labour, and capital.Conversely, high CSP bolsters a company’s competitive advantage byweighing and addressing the claims of various constituents in a fair, rationalmanner. This perspective, which is primarily derived from instrumental
Orlitzky et al.: Corporate Social and Financial Performance 405
stakeholder theory (Jones 1995), has also been identified as the ‘goodmanagement theory’ (Waddock and Graves 1997). Therefore, we predict that:
H1: Corporate social performance and financial performance are generallypositively related across a wide variety of industry and study contexts.
Temporal Sequence
Like the ‘good management theory’, slack resources theory also proposes apositive association between CSP and CFP. However, it proposes a differenttemporal ordering — namely, that prior CFP is directly associated withsubsequent CSP. Prior high levels of CFP may provide the slack resourcesnecessary to engage in corporate social responsibility and responsiveness(Ullmann 1985; Waddock and Graves 1997). Because CSP often representsan area of relatively high managerial discretion, the initiation or cancellationof voluntary social and environmental policies may, to a large extent, dependon the availability of excess funds (McGuire et al. 1988).
To distinguish between slack resources theory and the good managementtheory, the meta-analytic data set will be examined for three sets of temporalassociations: (a) prior CSP related to subsequent CFP; (b) prior CFP relatedto subsequent CSP; and (c) contemporaneous (cross-sectional) associations.If effect sizes are highly similar across all three meta-analytic subgroups,Waddock and Graves’s (1997) argument about a virtuous cycle between CSPand CFP would be supported irrespective of study context, sampling error,and measurement error. Based on prior theory and empirical findings(McGuire et al. 1990; Waddock and Graves 1997), we believe that bothinstrumental stakeholder theory and slack resources descriptions are accurate,such that the two constructs are related to each other reciprocally.
H2: There is bidirectional causality between corporate social performanceand financial performance.
Mediating Effects
CSP may be an organizational resource that provides internal or externalbenefits, or both. Internally, investments in CSP may help firms develop newcompetencies, resources, and capabilities which are manifested in a firm’sculture, technology, structure, and human resources (Barney 1991; Russo andFouts 1997; Wernerfelt 1984). Especially when CSP is pre-emptive (Hart1995) and a firm’s environment is dynamic or complex, CSP may help buildmanagerial competencies because preventive efforts necessitate significantemployee involvement, organization-wide coordination, and a forward-thinking managerial style (Shrivastava 1995). Thus, CSP can help manage-ment develop better scanning skills, processes, and information systems,which increase the organization’s preparedness for external changes, turbu-lence, and crises (for example, Russo and Fouts 1997). These competencies,
406 Organization Studies 24(3)
which are acquired internally through the CSP process, would then lead tomore efficient utilization of resources (Majumdar and Marcus 2001).According to the ‘internal resources/learning’ perspective, whether CSPbehaviours and outcomes are also disclosed to outside constituents is largelyirrelevant to the development of internal capabilities and organizationalefficiency.
In addition, however, CSP may have external effects on organizationalreputation. According to the reputation perspective, an organization’scommunication with external parties about its level of CSP may help build apositive image with customers, investors, bankers, and suppliers (Fombrunand Shanley 1990). Firms high in CSP may use corporate social responsibilitydisclosures as one of the informational signals upon which stakeholders basetheir assessments of corporate reputation under conditions of incompleteinformation (Fombrun and Shanley 1990). Furthermore, firms with high CSPreputation ratings may improve relations with bankers and investors and thusfacilitate their access to capital (Spicer 1978). They may also attract betteremployees (Greening and Turban 2000; Turban and Greening 1997) orincrease current employees’ goodwill, which in turn may improve financialoutcomes (Davis 1973; McGuire et al. 1988; Waddock and Graves 1997). Insum, the reputation perspective postulates reputational effects as mediatorsof the CSP–CFP linkage, while the internal-resources perspective proposesmanagerial competencies and learning as the intervening generativemechanism between a positive CSP–CFP association. Therefore, we proposethat:
H3: CSP is positively correlated with CFP because (a) CSP increasesmanagerial competencies, contributes to organizational knowledge about thefirm’s market, social, political, technological, and other environments, andthus enhances organizational efficiency, and (b) CSP helps the firm build apositive reputation and goodwill with its external stakeholders.
Measurement Strategy: An Important Moderator Variable
Because both CSP and CFP are such broad meta-constructs, a given study’soperationalization of each construct may act as an important moderator. Totest this hypothesis, the entire meta-analytic set is broken down into differentCFP and CSP subsets employing different measurement strategies. Thisbreakdown can establish whether correlations between different CSP and CFPmeasures are similar across subgroups, or whether different operationaliz-ations lead to systematically different effect sizes across studies. Thefollowing section gives an overview of how CFP and CSP have beenmeasured in the past.
The three broad subdivisions of CFP consist of market-based (investorreturns), accounting-based (accounting returns), and perceptual (survey)measures. First, market-based measures of CFP, such as price per share orshare price appreciation, reflect the notion that shareholders are a primarystakeholder group whose satisfaction determines the company’s fate (Cochran
Orlitzky et al.: Corporate Social and Financial Performance 407
and Wood 1984). The bidding and asking processes of stock-market partici-pants, who rely on their perceptions of past, current, and future stock returnsand risk, determine a firm’s stock price and thus market value. Alternatively,accounting-based indicators, such as the firm’s return on assets (ROA), returnon equity (ROE), or earnings per share (EPS), capture a firm’s internalefficiency in some way (Cochran and Wood 1984). Accounting returns aresubject to managers’ discretionary allocations of funds to different projectsand policy choices, and thus reflect internal decision-making capabilities andmanagerial performance rather than external market responses to organiz-ational (non-market) actions. Lastly, perceptual measures of CFP ask surveyrespondents to provide subjective estimates of, for instance, the firm’s‘soundness of financial position’, ‘wise use of corporate assets’, or ‘financialgoal achievement relative to competitors’ (Conine and Madden 1987;Reimann 1975; Wartick 1988).
The construct of CSP is associated with the following four broadmeasurement strategies: (a) CSP disclosures; (b) CSP reputation ratings; (c)social audits, CSP processes, and observable outcomes; and (d) managerialCSP principles and values (Post 1991). First, CSP disclosure measurementconsists of content analysis of annual reports, letters to shareholders, 10Ks,and a number of other corporate disclosures to the public as surrogates ofCSP. Content analysis is employed to compare units of text against particularCSP themes in order to draw inferences about the organization’s underlyingsocial performance (Wolfe 1991).
A second approach to measuring CSP is the use of reputational indices, suchas Moskowitz’s (1972, 1975) tripartite ratings (‘outstanding’, ‘honourablemention’, and ‘worst’ companies; for example, Cochran and Wood 1984;Sturdivant and Ginter 1977) or Fortune magazine ratings of a corporation’s‘responsibility to the community and environment’ (for example, Conine andMadden 1987; Fombrun and Shanley 1990; McGuire et al. 1988). Otherresearchers (Alexander and Buchholz 1978; Heinze 1976; Vance 1975) havedeveloped their own reputational measures by surveying business professionalsand business students. Reputation indices are based on the assumption that CSPreputations are good reflections of underlying CSP values and behaviours.
Social audits and concrete observable CSP processes and outcomes are thethird broad measurement category of CSP. Social audits consist of asystematic third-party effort to assess a firm’s ‘objective’ CSP behaviours,such as community service, environmental programmes, and corporatephilanthropy. Objective data are the foundation for so-called ‘behavioural’measures of CSP. However, behavioural measures based on social audits maystill result in a ranking, such as the measure provided by the Council onEconomic Priorities (CEP). Various studies have used the CEP social auditrankings of companies’ pollution records (for example, Bragdon and Marlin1972; Fogler and Nutt 1975; Spicer 1978; see also the overview of studies inAppendix A). Although this subset of studies differs from the other threesubsets, it is still very broad. Therefore, this third group will be broken downfurther to examine the instrumental effectiveness of processes of socialresponsiveness.
408 Organization Studies 24(3)
The fourth measurement category of CSP assesses the values and principlesinherent in a company’s culture. Aupperle (1984) developed a forced-choicesurvey of corporate social orientations, drawing on Carroll’s (1979) corporatesocial responsibility construct with its four dimensions of economic, legal,ethical, and discretionary responsibilities. The last three elements comprise theconstruct ‘concern for society’. Volume 12 of Research in Corporate SocialPerformance and Policy (Post 1991: Part III, 265–401) reviews in greater depththe history and psychometric properties of the different CSP measures brieflydelineated here (Aupperle 1991; Carroll 1991; Clarkson 1991; Gephardt 1991;Wokutch and McKinney 1991; Wolfe 1991; Wolfe and Aupperle 1991).
Differences in CSP–CFP statistical associations across these four measure-ment subsets may result from three sources. First, there might be ‘real’(substantive) cross-study variation in correlations between CSP and CFP, aspredicted by Wood and Jones’s (1995) mismatching thesis. Wood and Jones(1995) argued that effects would vary depending on expectations andevaluations of CSP, which differ from one stakeholder group to another. Nopositive correlations would be expected between measures that cannot belinked theoretically, such as CSP disclosures and accounting-based efficiencymeasures of CFP. For example, Wood and Jones’s (1995) review suggestedthat the match between market measures and market-oriented stakeholders(for example, customers) would produce significant positive results, whilethe correlation between market measures and charitable contributions, forinstance, would not.
Alternatively, differences in correlations across variable measurementsubsets may simply be a function of statistical artefacts. For example, if onemeasurement subgroup were found to contain many studies with very smallsample sizes, this subgroup would show a relatively large random samplingerror. Thus, differences in sampling error across measurement subgroups mayexplain CSP/CFP correlational differences in primary studies. In addition,measurement error of CFP and CSP (that is, unreliability) might act as anotherartefactual source of cross-study variability in correlations. If, for example, CSPdisclosure measures were plagued by comparatively low psychometric quality(for example, Abbott and Monsen 1979; Ingram and Frazier 1980; Wiseman1982), observed correlations between CSP disclosures and CFP would besystematically lower than the correlations between CFP and other, more reliablemeasures of CSP. Therefore, this meta-analysis hierarchically breaks down theoverall data set in order to compare the relative magnitudes of correlationsarising from different CSP and CFP measurement subcategories, and to test forthese three possible sources of cross-study variation of correlations (substantivedifferences, sampling error, and measurement error). We hypothesize that:
H4a: A large proportion of cross-study variance is due to statistical ormethodological artefacts (sampling error and measurement error).
H4b: Consistent with stakeholder mismatching, after accounting forstatistical artefacts, there will still be differences in the statistical associationsbetween different sub-dimensions of CFP and CSP (after correct matching).
Orlitzky et al.: Corporate Social and Financial Performance 409
Methods
Prior summaries of the CSP–CFP literature have relied mostly on narrativereviews (for example, Pava and Krausz 1995; Ullmann 1985) or the vote-counting method of aggregation (for example, Griffin and Mahon 1997;Margolis and Walsh 2001; Roman et al. 1999; Wood and Jones 1995).Narrative reviews are literature reviews that attempt to make sense of pastfindings verbally or conceptually. The vote-counting method refers to thecumulation of significance levels or, in the simplest case, to the tabulation ofsignificant and non-significant findings (Hunter and Schmidt 1990; Light andSmith 1971). Both of these research integration techniques tend to draw falseinferences because they do not correct for sampling and measurement error,two important study artefacts (Hedges and Olkin 1980; Hunter and Schmidt1990). In fact, the statistical errors in the typical ‘vote-counting’ literaturereview tend to be more serious than in the average narrative review becausethe statistical power of the vote-counting procedure decreases with increasing
number of studies reviewed (Hedges and Olkin 1980; Hunter and Schmidt1990). Although we have known for more than 20 years that vote countingis marred by a lack of validity, the technique is still widely used today (forexample, Griffin and Mahon 1997; Margolis and Walsh 2001; Roman et al.1999; Wood and Jones 1995).
In contrast, effect-size (r) meta-analysis is a rigorous approach to externalvalidation, which calculates population parameter estimates (ρ) by correctingfor the aforementioned artefacts. The effect of sampling error is importantbecause sample sizes that are smaller than the population cause observedsample correlation statistics r to vary randomly from the population parameter,the true-score correlation ρ. In addition, as mentioned before, measurementerror (that is, unreliability) systematically attenuates observed correlations(Nunnally and Bernstein 1994).
Search for Relevant Studies
Computer searches of ABI/Inform Global and PsycINFO were conducted,using the keyword search ‘organizational effectiveness and corporate socialperformance’. Synonyms for the former, used in separate computer searches,were ‘organizational performance’, ‘profitability’, ‘economic success’, and‘financial performance’. ‘Corporate social performance’ as a keyword searchterm was alternately substituted with ‘(corporate) social responsibility’,‘corporate environmental performance’, ‘responsiveness’, and simply ‘resp?’.ABI/Inform Global gives access to the full text and images of more than 1,200US and international business and trade journal articles (1970–current), whilePsycINFO indexes abstracts of journal articles and book chapters inpsychology starting in 1974. To increase the scope of our search, cross-citations from previous narrative reviews (for example, Aldag and Bartol1978; McGuire et al. 1988: 857–860; Preston 1978a; Waddock and Mahon1991; Wood and Jones 1995) were explored as well.
Criteria for Relevance
The studies that were deemed relevant for the meta-analysis had the followingcharacteristics. First, the studies quantitatively examined the relationshipbetween CSP and CFP. The reported effect size did not have to be a Pearson’sproduct-moment correlation r, but could also be a t-test statistic or effect sized (both t and d can be transformed to r; Hunter and Schmidt 1990). Second,the studies were concerned with at least one aspect of a firm’s economicperformance, as circumscribed by the definition of CFP. For the purpose ofthis study, CFP was defined as a company’s financial viability, or the extentto which a company achieves its economic goals (Price and Mueller 1986;Venkatraman and Ramanujam 1986). Third, all retrieved studies were double-checked for conformance to Wood’s (1991a) definition of CSP (seeIntroduction above). Wood’s (1991a) now classic definition is used becauseit is one of the most influential, helpful, parsimonious, and yet comprehensiveconceptualizations of CSP. If the particular variable could not be classified
Orlitzky et al.: Corporate Social and Financial Performance 411
as an example belonging to one of the nine subcategories of Wood’s model,the study was excluded. In addition, unclear reporting of empirical resultswas also a reason for exclusion.
Studies of environmental management and CFP are included in the meta-analysis for several reasons. First, several studies, especially earlier ones, useenvironmental performance as a proxy for social responsibility. Second,stakeholder proxies, such as environmental interest groups and governmentagencies, may in fact give voice to, or claim a social ‘stake’ for, non-humannature (Starik 1995). Lastly, the business community tends to regard socialresponsibility as including both social and environmental performance (forexample, Willums 1999). Still, the argument can be made that the literatureon CSP differs from the one on corporate environmental performance invarious aspects. To investigate differences between social and environmentalperformance, the entire set (k = number of effect sizes integrated = 388) isdisaggregated into purely social performance measures only (that is,excluding all environmental performance measures; k = 249) and environ-mental measures only (k = 139).
Characteristics of Primary Studies
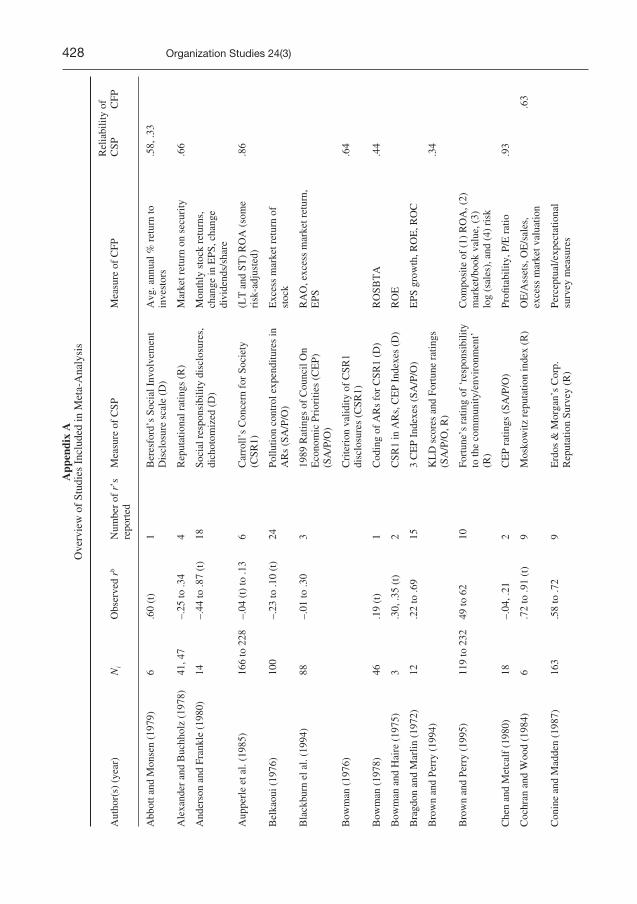
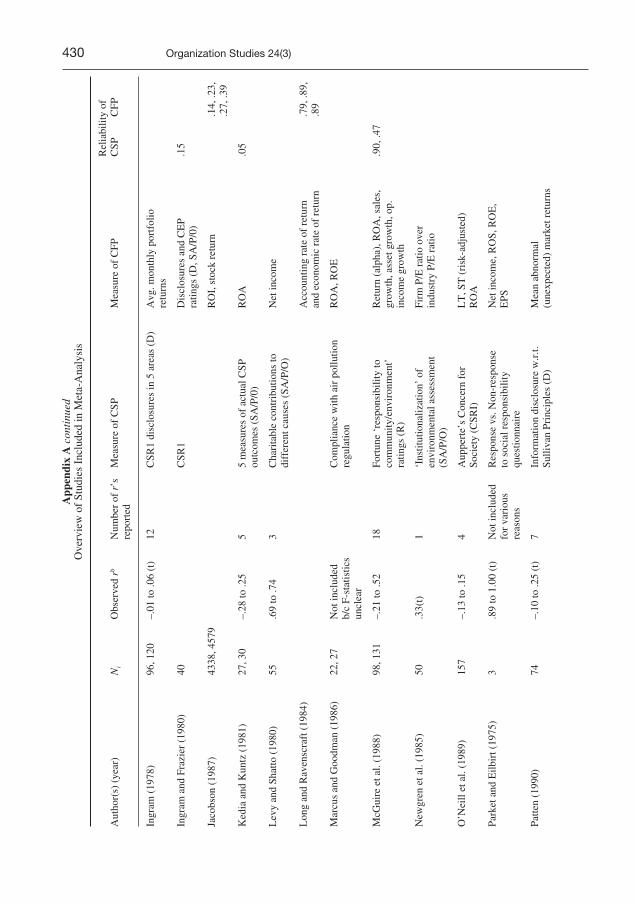
The most important study characteristics, such as author(s), date of study,study sample size Ni, observed r or transformed and/or partially corrected r(that is, corrected for dichotomization and unequal sample sizes in the twogroups compared in a t-test), number of correlations per study, operationaliz-ation of CSP and CFP, and estimates of reliability are listed in Appendix A.
Reliability is traditionally defined as the ratio of true-score variance toobserved-score variance (Traub 1994). Thus, classical measurement theoryis concerned with the correspondence between observed scores and truescores. Some of the reliability coefficients used in this study are in thetradition of classical reliability theory, such as coefficient alpha. Sometimes,however, it becomes necessary to count not only variation due to itemsampling, but also day-to-day variation in scores as measurement error. Inclassical theory, one can accomplish this task by using an alternate-formscoefficient of reliability. Generalizability theory is less restrictive in itsassumptions than classical theory (Cronbach et al. 1972). The coefficient ofgeneralizability reflects the degree to which observed scores (of CSP or CFPin this case) allow for generalization about a firm’s behaviour in a defineduniverse of situations (Cronbach et al. 1972; Shavelson et al. 1989).Generalizability is estimated through ‘alternate-forms’ correlations betweendifferent CSP, and CFP, measures.
The present study estimates reliability by including coefficients of gener-alizability (76 percent), stability (4 percent), internal reliability (8 percent),and inter-rater reliability (12 percent). Both stability and generalizabilitycoefficients are underestimates of reliability (Orlitzky 1998). Because of thepredominance of coefficients of stability and generalizability, the meta-analysis provides conservative estimates (that is, lower-bound estimates) ofthe reliability of the CSP or CFP measurement instrument.
412 Organization Studies 24(3)
In addition to listing the reliabilities of both constructs, Appendix A showsthe great variety of study contexts and operationalizations of both constructs.From the vantage point of generating cumulative knowledge, multipleoperationism is an advantage because it helps determine whether a ‘true’relationship exists in different industry contexts with different operationaliz-ations of the two focal constructs (Cook and Campbell 1979; Cooper 1989;Webb et al. 1981). In past meta-analyses, integrated studies often containedbroad meta-constructs as well, such as job or organizational performance,operationalized in many different ways (for example, Gooding and Wagner1985; Ketchen et al. 1997; Roth et al. 1996; Wagner and Gooding 1987).During data collection, the inclusion criteria for relevance (see above) servedas constant checks on the operationalizations’ conformance to the broadconceptual definitions of CSP and CFP.
Empirically, the standard deviation of ρ serves as an indicator of cross-study heterogeneity. The percentage of cross-study variance explained byartefacts is another indicator of the degree of cross-study generalizability(Hunter and Schmidt 1990).
Statistical Conventions Used in the Meta-analysis
The meta-analysis uses Hunter and Schmidt’s (1990) statistical aggregationtechniques for cumulating correlations and correcting for various studyartefacts in order to estimate the true score correlation (ρ) between CSP andCFP. Meta-analysis arrives at a mean true-score correlation by correctingobserved correlations for sampling error (which can be written as σe =
) and for measurement error. Since sampling error variesdirectly with sample size, all studies are weighted by sample size Ni beforecorrecting for the average attenuation factor (Schmidt and Hunter 1977).
Because measurement error data points are not always available for individualstudies (see Appendix A), study correlations cannot be corrected individuallyfor measurement error. Instead, correlations are meta-analysed using artefactdistributions (for more details on artefact-distribution meta-analysis, see Hunterand Schmidt 1990). The moderator analyses use Hunter and Schmidt’s (1990)subgrouping algorithm, as described in the Results section below.
Non-independence in any meta-analytic data set can present certainproblems. Therefore, sensitivity analyses were conducted by using two otheraggregation techniques. In the first sensitivity analysis, we used only oneindependent correlation per study, that is, composite scores. Furthermore, asecond sensitivity analysis tested the stability of our transformations of effectsizes (reported t or d statistics into r).
Results
Overall CSP–CFP Relationships
As shown in the first line of Table 1, the mean observed correlation (robs) forthe total set of 388 correlations and a total sample size N of 33,878
Orlitzky et al.: Corporate Social and Financial Performance 413
ρ N− −( ) / ( )1 12
414 Organization Studies 24(3)
Tab
le 1
. Ove
rall
Met
a-A
naly
tic F
indi
ngs
(Hyp
othe
sis
1)
Rel
atio
nshi
p be
twee
n…
k a
Tot
alSa
mpl
e-Si
ze
Obs
erve
d%
Var
ianc
eM
ean
‘Tru
e-V
aria
nce
ofFi
le D
raw
erSa
mpl
e W
eigh
ted
Var
ianc
e E
xpla
ined
bSc
ore’
rρ
[σ2 (
ρ)]
Ana
lysi
sc
Size
M
ean
Obs
erve
d(m
ean
ρ)r
(rob
s)
1. C
SP a
nd C
FP38
833
,878
.183
6.0
646
23.8
9.3
648
.189
61,
037
(ent
ire
met
a-an
alyt
ic s
et)
2. C
SP a
nd C
FP w
ithou
t CSP
252
20,6
62.0
776
.029
643
.94
.154
3.0
641
139
repu
tatio
n an
d C
FP
surv
ey m
easu
res
3.a.
CSP
with
out c
orpo
rate
24
924
,055
.230
1.0
638
27.0
4.4
671
.189
189
7en
viro
nmen
tal
perf
orm
ance
and
CFP
3.b.
Cor
pora
te e
nvir
onm
enta
l 13
99,
823
.056
2.0
383
40.3
3.1
246
.109
717
perf
orm
ance
and
CFP
a k
: num
ber
of c
orre
latio
n co
effic
ient
s m
eta-
anal
ysed
.b re
fers
to p
erce
ntag
e of
cro
ss-s
tudy
obs
erve
d va
rian
ce e
xpla
ined
by
thre
e st
udy
arte
fact
s: s
ampl
ing
erro
r, m
easu
rem
ent e
rror
in C
SP, m
easu
rem
ent e
rror
in C
FP.
c H
unte
r an
d Sc
hmid
t’s
(199
0) e
ffec
t siz
e fil
e dr
awer
ana
lysi
s: n
umbe
r of
mis
sing
stu
dies
ave
ragi
ng n
ull fi
ndin
gs n
eede
d to
bri
ng r
obsdo
wn
to .0
5.
Orlitzky et al.: Corporate Social and Financial Performance 415
observations is .18, with an observed variance of .06. The study artefacts ofsampling and measurement error in CSP and CFP explain 24 percent of thecross-study variance of robs. After correction for sampling and measurementerrors, the true score (corrected) correlation (ρ) was .36, which is twice thesize of the observed correlation, with a variance (.19), which is slightly morethan three times the size of the observed variance. As shown in the secondline of Table 1, the relationship remains positive even after we removedstudies that may be affected by response bias (survey measures of CFP) andhalo (CSP reputation indices; Brown and Perry 1994); the remaining meta-analytic set showed an average observed correlation of .08 and a true-scorecorrelation of .15. Although this true-score correlation is smaller than in thelarger set including CSP reputation and CFP survey measures, it is not trivial.Thus, the meta-analytic findings support hypothesis H1.
The sensitivity analyses tend to confirm this conclusion. The first sensitivityanalysis, which uses only one effect size per study (thus, k = 52, N = 4924),showed a mean observed correlation of .21 and a corrected correlation of .42.The second sensitivity analysis, on 210 product-moment correlations (k) witha total sample size of 22,218 observations (N), also showed slightly higherestimates (robs = .20, ρ = .41) than the overall meta-analysis reported in Table1. Thus, in both ‘sensitivity’ meta-analyses (not reported in the tables), themean observed and corrected correlations were positive and of similarmagnitude as the correlations in the entire meta-analytic set. If anything, thesensitivity analyses suggest that our meta-analytic estimates are actuallyconservative estimates of the relationships between CSP and CFP.
Corporate Social and Environmental Performance
Table 1 also shows analyses for two different conceptualizations of CSP.When the entire meta-analytic set was divided into two sets, that is, (a) thosestudies using a narrow definition of ‘social’ performance (thus excludingmeasures of environmental performance; k = 249, N = 24,055) and (b) studiesof corporate environmental performance only (k = 139, N = 9823), thefindings show that corporate environmental performance has a smallerrelationship with CFP (robs = .06, ρ = .12) than do all other measures of CSP(robs = .23, ρ = .47), such as managerial principles and corporate reputationsfor minority hiring, for example. In the corporate environmental performancesubset, the variances of observed and true-score correlations were also smallerthan those in the ‘pure’ CSP subset. Furthermore, measurement error andsampling error explained more of the cross-study variance of robs in thecorporate environmental performance subset than in the ‘pure’ CSP subset.Thus, the last two lines of Table 1 (entries 3.a and 3.b) demonstrate that therelatively lower correlation between corporate environmental performanceand CFP is, in fact, much more consistent across industry and study contextsthan the primary empirical studies would have us believe.
File Drawer Analysis
In the overall meta-analysis as in all subsequent meta-analyses, an effect sizefile drawer analysis was performed to address the possibility of availability
416 Organization Studies 24(3)
Tab
le 2
a. ‘
Goo
d M
anag
emen
t’ T
heor
y an
d Sl
ack
Res
ourc
es T
heor
y (H
ypot
hesi
s 2,
All
mea
sure
s of
CSP
, Inc
l. E
nvir
onm
enta
l Per
form
ance
)
Rel
atio
nshi
p be
twee
n…
k a
Tot
alSa
mpl
e-Si
ze
Obs
erve
d%
Var
ianc
eM
ean
‘Tru
e-V
aria
nce
ofFi
le D
raw
erSa
mpl
e W
eigh
ted
Var
ianc
e E
xpla
ined
bsc
ore’
rρ
[σ2 (
ρ)]
Ana
lysi
sc
Size
M
ean
Obs
erve
d(m
ean
ρ)r
(rob
s)
CSP
and
sub
sequ
ent C
FP68
6,96
6 .1
450
.060
2 20
.47
.288
1 .1
847
129
CSP
and
pri
or C
FP11
1 9,
929
.148
1 .0
578
23.9
0.2
944
.169
7 21
8
CSP
and
con
curr
ent C
FP20
9 16
,983
.2
201
.067
7 26
.47
.437
5 .1
919
711
(cro
ss-s
ectio
nal s
tudi
es)
a k
: num
ber
of c
orre
latio
n co
effic
ient
s m
eta-
anal
ysed
.b
refe
rs to
per
cent
age
of c
ross
-stu
dy o
bser
ved
vari
ance
exp
lain
ed b
y th
ree
stud
y ar
tefa
cts:
sam
plin
g er
ror,
mea
sure
men
t err
or in
CSP
, mea
sure
men
t err
or in
CFP
.c
Hun
ter
and
Schm
idt’
s (1
990)
eff
ect s
ize
file
draw
er a
naly
sis:
num
ber
of m
issi
ng s
tudi
es a
vera
ging
nul
l find
ings
nee
ded
to b
ring
rob
sdo
wn
to .0
5.
Tab
le 2
b. H
ypot
hesi
s 2
‘Pur
e’ C
SP M
easu
res
only
Rel
atio
nshi
p be
twee
n…
k a
Tot
alSa
mpl
e-Si
ze
Obs
erve
d%
Var
ianc
eM
ean
‘Tru
e-V
aria
nce
ofFi
le D
raw
erSa
mpl
e W
eigh
ted
Var
ianc
e E
xpla
ined
bSc
ore’
rρ
[σ2 (
ρ)]
Ana
lysi
sc
Size
M
ean
Obs
erve
d(m
ean
ρ)r
(rob
s)
CSP
and
sub
sequ
ent C
FP31
4,18
9.2
016
.072
217
.20
.400
5.2
306
94
CSP
and
pri
or C
FP54
6,80
0.2
262
.044
332
.07
.449
5.1
161
190
CSP
and
con
curr
ent C
FP15
812
,764
.252
9.0
755
26.1
3.5
027
.215
164
1(c
ross
-sec
tiona
l stu
dies
)
a k
: num
ber
of c
orre
latio
n co
effic
ient
s m
eta-
anal
ysed
.b
refe
rs to
per
cent
age
of c
ross
-stu
dy o
bser
ved
vari
ance
exp
lain
ed b
y th
ree
stud
y ar
tefa
cts:
sam
plin
g er
ror,
mea
sure
men
t err
or in
CSP
, mea
sure
men
t err
or in
CFP
.c
Hun
ter
and
Schm
idt’
s (1
990)
eff
ect s
ize
file
draw
er a
naly
sis:
num
ber
of m
issi
ng s
tudi
es a
vera
ging
nul
l find
ings
nee
ded
to b
ring
rob
sdo
wn
to .0
5.
Orlitzky et al.: Corporate Social and Financial Performance 417
bias. Availability bias is one of the most common criticisms levelled againstmeta-analysis, in that critics of meta-analysis often suspect that publishedstudies will report larger effect sizes than unpublished studies. File draweranalysis addresses this issue by computing the number of additional unlocated(that is, ‘lost’ or overlooked) studies needed to cause the correlation todecrease to a minimal critical level (rcrit), which is set at .05 in this study.Hunter and Schmidt (1990) present the underlying assumptions andtechniques of file drawer analysis. For each correlation computed in Tables1–4, the results of the file drawer analysis are presented in the last column.As shown in Table 1, a very large number of studies (1,037) would be neededto change the overall substantive conclusions of this meta-analysis (entry 1in Table 1).
Temporal Sequence
Tables 2a and 2b show the results relevant to Hypothesis 2, which suggesteda virtuous cycle between CSP and CFP. Consistent with that hypothesis, theprimary studies supported the instrumental stakeholder and slack resourcestheories to about the same degree. Specifically, both the prior CFP andsubsequent CFP subsets yielded observed correlations of .15, and correctedcorrelations of .29 (first two lines in Table 2a). Concurrent studies yieldedobserved and corrected correlations with CFP of .22 and .44, respectively(third line of Table 2a). Taken together, these findings suggest a virtuous cyclewith quick cycle times or concurrent bidirectionality. However, the lowpercentages of observed cross-study variance explained by artefacts, rangingfrom 20 percent to 26 percent, and large true-score variances ranging from.17 to .19, indicate the presence of at least one moderator. As Table 2b shows,consistent with the overall analysis (Table 1, entries 3.a and 3.b), the resultsare stronger after corporate environmental measures were removed from CSP.Generally, though, the relationships reported in Table 2b confirm theconclusions of Table 2a.
Mediator Variables: Learning and Reputation
To investigate Hypothesis 3, studies were divided into two broad subsets: (a)studies that correlated both internal and external measures of CSP with onlyaccounting CFP measures (that is, measures of internal resource utilization,such as ROA or ROE); and (b) studies which correlated only externally visiblemeasures of CSP, such as CSP reputation or disclosures, with exclusivelyexternal (for example, market return or sales growth) measures of CFP. Thereputational argument is further subdivided into studies correlating externalindicators of CFP with: (a) reputation indices of CSP; (b) CSP disclosures inannual reports and letters to shareholders; and (c) other externally visiblemeasures of CSP such as social audits and charitable contributions.
Based on the magnitude of the meta-analytic correlations, the meta-analysed studies support the reputation-effects viewpoint relatively morestrongly than the internal viewpoint, as shown in Table 3 (compare first two
418 Organization Studies 24(3)
Tab
le 3
. Sub
set M
eta-
Ana
lysi
s: R
eput
atio
n T
heor
y an
d In
tern
al S
kills
The
ory
of C
SP (
Hyp
othe
sis
3)
Typ
e of
Rel
atio
nshi
p k
a,d
Tot
alSa
mpl
e-Si
ze
Obs
erve
d%
Var
ianc
eM
ean
‘Tru
e-V
aria
nce
ofFi
le D
raw
erSa
mpl
e W
eigh
ted
Var
ianc
e E
xpla
ined
bSc
ore’
rρ
[σ2 (
ρ)]
Ana
lysi
sc
Size
M
ean
Obs
erve
d(m
ean
ρ)r
(rob
s)
1. E
ffici
ency
, ski
lls, l
earn
ing,
130
12,9
57.1
630
.028
0 49
.66
.332
4.0
572
294
and/
or c
ompe
tenc
y
2. R
eput
atio
n th
eory
177
14,2
74.2
484
.102
419
.59
.494
2.3
185
702
2.a.
Rep
utat
ion
inde
xes
656,
858
.419
7.0
992
24.7
7.7
593
.238
648
12.
a.1.
Subs
eque
nt C
FP
101,
088
.368
1.1
869
15.4
3.7
504
.642
064
2.a.
2.Pr
ior
CFP
9
1,07
4.3
558
.105
325
.58
.725
4 .3
182
552.
a.3.
Con
curr
ent C
FP
464,
696
.446
3.0
752
51.2
9.9
099
.148
836
52.
b.D
iscl
osur
e m
easu
res
754,
351
.058
6.0
192
93.4
9.1
399
.007
013
2.c.
Oth
er
373,
065
.135
6.0
978
14.7
5.2
698
.322
663
a k
: num
ber
of c
orre
latio
n co
effic
ient
s m
eta-
anal
ysed
.b
refe
rs to
per
cent
age
of c
ross
-stu
dy o
bser
ved
vari
ance
exp
lain
ed b
y th
ree
stud
y ar
tefa
cts:
sam
plin
g er
ror,
mea
sure
men
t err
or in
CSP
, mea
sure
men
t err
or in
CFP
.c
Hun
ter
and
Schm
idt’
s (1
990)
eff
ect s
ize
file
draw
er a
naly
sis:
num
ber
of m
issi
ng s
tudi
es a
vera
ging
nul
l find
ings
nee
ded
to b
ring
rob
sdo
wn
to .0
5.d
Cor
rela
tions
in s
ubse
ts 1
and
2 d
o no
t add
up
to 3
88 b
ecau
se a
ssig
nmen
t to
type
of
rela
tions
hip
was
que
stio
nabl
e in
cer
tain
cas
es.
Orlitzky et al.: Corporate Social and Financial Performance 419
lines in Table 3, that is, entry 1 with entry 2). In addition, further hierarchicalbreakdown of the reputation view subset indicates that CSP disclosures appearto have a low reputational impact on CFP. This statistical conclusion isgeneralizable across study settings because a high proportion of variance (93percent) is explained by study artefacts (entry 2.b in Table 3). Moreover,timing of measurement (temporal sequence) is not an important moderatorwithin the ‘reputation view’ argument. As was the case in the overall meta-analysis, the correlations between CSP and subsequent CFP are almostidentical to the ones found between CSP and prior CFP (ρ = .75 and .73,respectively; entries 2.a.1 and 2.a.2 in Table 3). Again, the correlations arehighest when CSP and CFP were measured less than a year apart (ρ = .91,and 51 percent of cross-study variance explained by artefacts; entry 2.a.3).
Moderator Analysis
The analyses relevant to Hypothesis 3 already alluded to an important featureof Hunter and Schmidt’s (1990) meta-analytic technique; namely, detectionof cross-study moderators. Because this algorithm will be used extensivelyin the remaining meta-analyses, a brief explanation seems in order. Hunterand Schmidt’s (1990) moderator analysis consists of two distinct methods.First, the ‘75% rule’ can be applied, stating that if 75 percent or more of theobserved variance of correlations across studies is due to artefacts, thenprobably all of it is artefactual variance (on the grounds that the remaining25 percent is likely due to artefacts not corrected for). Thus, in cases where75 percent or more of the variance is explained by artefacts, includingsampling error variance, moderators are unlikely to have caused a realvariation in observed correlations (robs). This first method is able to detect theexistence of unsuspected moderators.
The second method, which can detect discontinuous, theoretically predictedmoderators, compares mean observed and true-score correlations across studydomain subsets of the original entire set of studies aggregated in the meta-analysis. If in these meta-analytic subgroups, a higher percentage of varianceis accounted for by study artefacts relative to the entire meta-analytic set,moderators are said to exist.
Measurement Strategy as Moderator
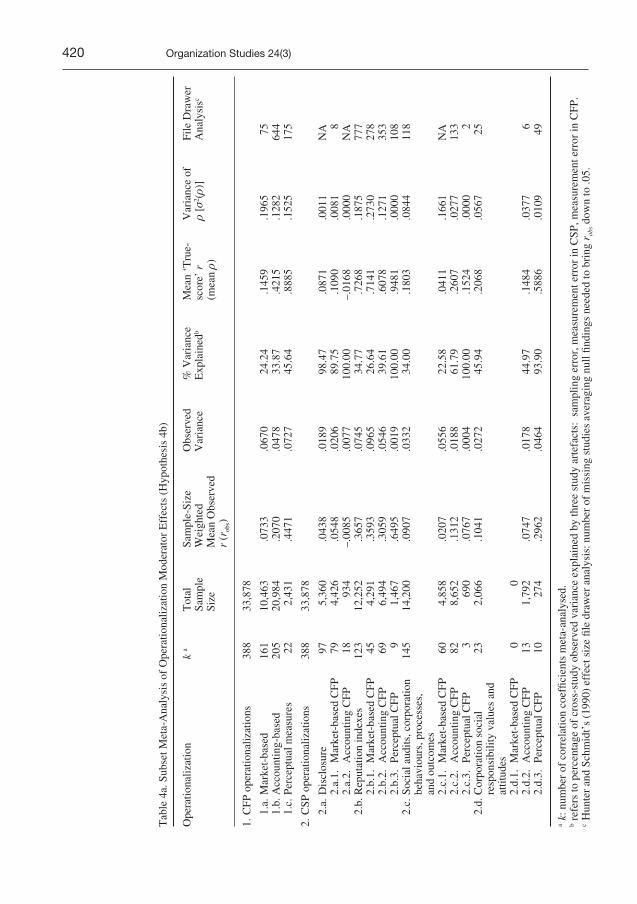
To examine Hypotheses 4a and 4b, the entire data set of 388 correlations wasbroken down hierarchically to investigate the presence of moderator effectsbased on the operationalizations of CSP and CFP (see Table 4a). First, CFPand CSP operationalizations were disaggregated separately. Second, the fourbroad CSP operationalization subsets were broken down hierarchically intothe two (or three, where available) CFP measurement categories. The lowestlevel in Table 4a is the only one that is not confounded by lack of standardizedmeasurement and, thus, is the most informative.
In general, Table 4a indicates that the association between CSP and CFPdepends on the firm’s or researcher’s operational definition of each construct,or both. Accounting measures were more highly correlated with CSP than
420 Organization Studies 24(3)
Tab
le 4
a. S
ubse
t Met
a-A
naly
sis
of O
pera
tiona
lizat
ion
Mod
erat
or E
ffec
ts (
Hyp
othe
sis
4b)
Ope
ratio
naliz
atio
n k
aT
otal
Sam
ple-
Size
O
bser
ved
% V
aria
nce
Mea
n ‘T
rue-
Var
ianc
e of
File
Dra
wer
Sam
ple
Wei
ghte
dV
aria
nce
Exp
lain
edb
scor
e’ r
ρ[σ
2 (ρ)
] A
naly
sisc
Size
M
ean
Obs
erve
d(m
ean
ρ)r
(rob
s)
1.C
FP o
pera
tiona
lizat
ions
388
33,8
78
1.a.
Mar
ket-
base
d16
110
,463
.073
3.0
670
24.2
4.1
459
.196
575
1.b.
Acc
ount
ing-
base
d20
520
,984
.207
0.0
478
33.8
7.4
215
.128
264
41.
c.Pe
rcep
tual
mea
sure
s22
2,43
1.4
471
.072
745
.64
.888
5.1
525
175
2.C
SP o
pera
tiona
lizat
ions
38
8 33
,878
2.a.
Dis
clos
ure
975,
360
.043
8.0
189
98.4
7.0
871
.001
1N
A2.
a.1.
Mar
ket-
base
d C
FP79
4,42
6.0
548
.020
689
.75
.109
0.0
081
82.
a.2.
Acc
ount
ing
CFP
1893
4–.
0085
.007
710
0.00
–.01
68.0
000
NA
2.b.
Rep
utat
ion
inde
xes
123
12,2
52.3
657
.074
534
.77
.726
8.1
875
777
2.b.
1.M
arke
t-ba
sed
CFP
45
4,29
1.3
593
.096
526
.64
.714
1.2
730
278
2.b.
2.A
ccou
ntin
g C
FP69
6,
494
.305
9.0
546
39.6
1.6
078
.127
135
32.
b.3.
Perc
eptu
al C
FP9
1,46
7.6
495
.001
910
0.00
.948
1.0
000
108
2.c.
Soci
al a
udits
, cor
pora
tion
145
14,2
00.0
907
.033
234
.00
.180
3.0
844
118
beha
viou
rs, p
roce
sses
,an
d ou
tcom
es
2.c.
1.M
arke
t-ba
sed
CFP
60
4,85
8.0
207
.055
622
.58
.041
1.1
661
NA
2.c.
2.A
ccou
ntin
g C
FP82
8,65
2.1
312
.018
861
.79
.260
7.0
277
133
2.c.
3.Pe
rcep
tual
CFP
3
690
.076
7.0
004
100.
00.1
524
.000
02
2.d.
Cor
pora
tion
soci
al
232,
066
.104
1.0
272
45.9
4.2
068
.056
725
resp
onsi
bilit
y va
lues
and
at
titud
es
2.d.
1.M
arke
t-ba
sed
CFP
00
2.d.
2.A
ccou
ntin
g C
FP
131,
792
.074
7.0
178
44.9
7.1
484
.037
76
2.d.
3.Pe
rcep
tual
CFP
1027
4.2
962
.046
493
.90
.588
6.0
109
49
a k
: num
ber
of c
orre
latio
n co
effic
ient
s m
eta-
anal
ysed
.b
refe
rs to
per
cent
age
of c
ross
-stu
dy o
bser
ved
vari
ance
exp
lain
ed b
y th
ree
stud
y ar
tefa
cts:
sam
plin
g er
ror,
mea
sure
men
t err
or in
CSP
, mea
sure
men
t err
or in
CFP
.c
Hun
ter
and
Schm
idt’
s (1
990)
eff
ect s
ize
file
draw
er a
naly
sis:
num
ber
of m
issi
ng s
tudi
es a
vera
ging
nul
l find
ings
nee
ded
to b
ring
rob
sdo
wn
to .0
5.
Orlitzky et al.: Corporate Social and Financial Performance 421
Tab
le 4
b. F
urth
er S
ubse
t Ana
lyse
s of
CSP
in T
erm
s of
Soc
ial A
udits
, Cor
pora
tion
Beh
avio
urs,
Pro
cess
es, a
nd O
utco
mes
with
CFP
(H
ypot
hesi
s 4b
)
Typ
e of
CSP
k
aT
otal
Sam
ple-
Size
O
bser
ved
% V
aria
nce
Mea
n ‘T
rue-
Var
ianc
e of
File
Dra
wer
Sam
ple
Wei
ghte
dV
aria
nce
Exp
lain
edb
Scor
e’ r
ρ[σ
2 (ρ)
]A
naly
sisc
Size
M
ean
Obs
erve
d(m
ean
ρ)r
(rob
s)
Soci
al a
udits
355,
016
.114
3.0
081
100.
00.2
272
.000
045
CSP
beh
avio
urs:
Phila
nthr
opic
don
atio
ns17
1,28
3.1
463
.064
224
.60
.290
7.1
867
33E
nvir
onm
enta
las
sess
men
t / f
orec
astin
g3
401
.059
2.0
143
55.6
2.1
177
.024
51
Issu
es m
anag
emen
t3
690
.076
7.0
004
100.
00.1
524
.000
02
Stak
ehol
der
man
agem
ent
751
3.0
717
.010
510
0.00
.142
5.0
000
3E
nvir
onm
enta
l man
agem
ent
806,
297
.065
7.0
517
25.8
3.1
306
.147
925
a k:
num
ber
of c
orre
latio
n co
effic
ient
s m
eta-
anal
ysed
bre
fers
to p
erce
ntag
e of
cro
ss-s
tudy
obs
erve
d va
rian
ce e
xpla
ined
by
thre
e st
udy
arte
fact
s: s
ampl
ing
erro
r, m
easu
rem
ent e
rror
in C
SP, m
easu
rem
ent e
rror
in C
FP.
c H
unte
r an
d Sc
hmid
t’s
(199
0) e
ffec
t siz
e fil
e dr
awer
ana
lysi
s: n
umbe
r of
mis
sing
stu
dies
ave
ragi
ng n
ull fi
ndin
gs n
eede
d to
bri
ng r
obsdo
wn
to .0
5.
422 Organization Studies 24(3)
market-based measures (ρ = .42 as against .15; entries 1.b versus 1.a in Table 4a), and were particularly highly correlated with CSP reputation indices(ρ = .61; entry 2.b.2). In fact, overall the findings with respect to CSPoperationalizations suggest that studies that used reputation indices as proxiesfor CSP showed the highest average correlation with CFP (ρ of .73 with alarge variance of .19; entry 2.b in Table 4a). Of course, this high correlationmay partially be due to halo (Brown and Perry 1994).
Furthermore, repeating the pattern of results testing reputation-theoryeffects (Table 3), disclosure measures appear to be only minimally related toCFP (robs = .04, ρ = .09, as shown in entry 2.a). This finding is generalizablebecause almost all the observed variance is explained by artefacts. Socialaudits, CSP processes, and outcomes are only modestly correlated with CFP(robs = .09, ρ = .18; entry 2.c). Similar mean correlations were found for therelationship between corporate social responsibility values or attitudes andCFP (robs = .10, ρ =.21; entry 2.d).
The second level in the hierarchical breakdown supports the view thatdifferences in previous findings resulted from study artefacts, stakeholdermismatching, other theoretical mis-specifications, or lack of theory (cf. alsoMcWilliams and Siegel 2000). As discussed above, the overall percentage ofcross-study variance (in robs) explained is 24 percent. In general, thispercentage tends to increase in the measurement subgroups listed in Table4a, which suggests that studies systematically differ with respect to thedistortions caused by (previously uncorrected) statistical and methodologicalartefacts. The fact that artefacts account for 15–100 percent of cross-studyvariance (the notorious ‘inconsistencies’ of this research stream) providessupport for Hypothesis 4a.
The support for theoretical inconsistencies (stakeholder mismatching)becomes apparent by looking at some second-level hierarchical subgroups.First, the correlation of CSP disclosure measures with accounting CFPmeasures is slightly negative (ρ = –.02; entry 2.a.2). This small correlationsupports the stakeholder mismatching thesis because there is no theoreticalcausal mechanism between CSP disclosures and internal (that is, accounting)CFP measures. Second, the observed and corrected correlations between (a)social audit and other observable or ‘objective’ (for example, dollar amountof charitable contributions) measures of CSP processes and (b) market-basedmeasures of CFP are close to zero (Table 4a, entry 2.c.1), which againsupports the stakeholder mismatching thesis. As Wood and Jones (1995: 242)argued earlier, ‘There is no theory to explain why stockholders would orwould not prefer a company that gives one percent of pre-tax earnings tocharity, that hires and develops minority or women workers, or that rankshigher in pollution control indices.’ In other words, the data suggest thatcapital market participants dismiss certain concrete behavioural measures ofCSP (such as charitable donations), perhaps because they are perceived asdirect attempts by firms to manage external impressions.
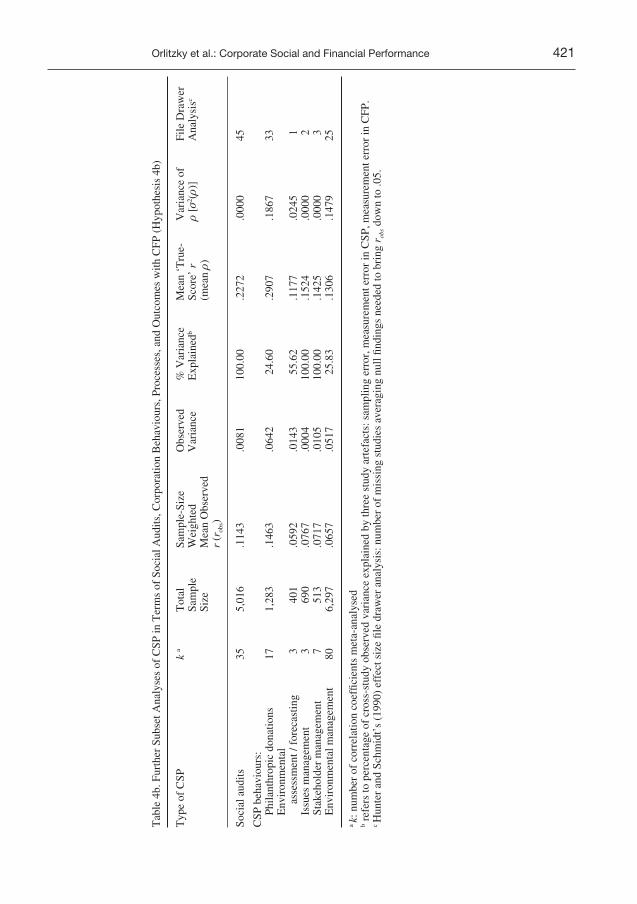
To examine the measurement moderators within subgroup 2.c even moreclosely, Table 4b shows results for social audits disaggregated from otherCSP behaviours, which are further broken down. Two findings are note-
Orlitzky et al.: Corporate Social and Financial Performance 423
worthy. First, social audits were consistently, but only modestly, correlatedwith CFP (ρ = .23, 100 per cent of cross-study variance explained). Second,across industry contexts, philanthropic donations were related with CFP at ρ = .29, which was higher than the respective correlation coefficients foundfor all other measures of CSP behaviours. However, the file drawer analyses(last column of Table 4b) suggest that some of the findings presented in Table4b are not conclusive because a small number of additional studies couldchange our conclusions.
Discussion
Theoretical Implications
Based on this meta-analysis integrating 30 years of research, the answer tothe introductory question posed by Business Week is affirmative. The resultsof this meta-analysis show that there is a positive association between CSPand CFP across industries and across study contexts. In that sense, we canconfirm Frooman’s (1997) conclusions, based on event studies, supportingthe validity of enlightened self-interest in the social responsibility arena. Thedata accumulated over the past 30 years do not support the latest contingencytheory in the area of corporate social responsibility (McWilliams and Siegel2001). Like earlier research reviews, McWilliams and Siegel (2001) takeinconsistent findings in primary studies at face value (that is, ignore thepossible impact of sampling error and measurement error) and explain the(apparent) inconsistency with a demand/supply model of corporate socialresponsibility. Moreover, the temporal analysis of our meta-analysis showsthat the positive association between CFP and lagged CSP (slack resourcesargument) does not mask a weaker negative association between CSP andlagged CFP.
Can CSP be motivated by an ‘ecological selection process based on profitmaximization or organizational survival’ (Wholey and Brittain 1986, inHusted 2000: 33)? Husted (2000: 34) agrees with the narrative reviews in thisarea, stating that it is ‘premature’ to conclude that adaptation to market andnon-market environments might force organizations to consider social issuesand CSP in their day-to-day strategizing. Our meta-analysis suggests theopposite. In fact, some of our observed correlations are higher than thecorrelations typically found between strategy-structure fit and CFP(Amburgey and Dacin 1994; Donaldson 1987). Despite those lowercorrelations, the strategy-structure-performance paradigm is firmly groundedon an economic survival mechanism (across industry contexts) analogous toHypothesis 1. On the one hand, our meta-analysis contradicts Rowley andBerman’s (2000) suggestion that there cannot be a consistently positiverelationship between CSP and CFP. On the other hand, in agreement withRowley and Berman (2000), we demonstrate that the universally positiverelationship varies (from highly positive to modestly positive) because ofcontingencies, such as reputation effects, market measures of CFP, or CSPdisclosures.
Traditionally, researchers have worried that any positive correlations areartefactual, due to halo effects (Brown and Perry 1994, 1995; Wood 1995).However, it is important to keep in mind that the only credible halo linkagewould be from CFP to CSP; that is, companies that perform better financiallyreceive higher CSP ratings, regardless of their true underlying CSP. The meta-analytic breakdown has shown that the potential halo effect (CFP → laggedCSP correlation) does not dominate a weaker CSP → lagged CFP correlationand distort results. In fact, the two correlations are identical at two digits (.29,see Table 2a). Also, when all potentially problematic studies are removed(that is, those that measure CSP reputations only and those that measure CFPwith a survey instrument), the meta-analysis still shows a non-trivial positive‘true-score’ correlation of .15 (see Table 1). Furthermore, the halo argumentwould suggest a much higher correlation between external (market) CFP andCSP reputation than between internal (accounting) CFP and CSP reputation.In fact, however, the correlations in both subgroups were similar (entries 2.b.1versus 2.b.2 in Table 4a).
When the CFP survey measures and CSP reputation measures are removed,the cross-study variation of robs can be shown to be increasingly a function ofthe artefacts of sampling and measurement error (44 percent; see entry 2 inTable 1). Thus, many of the negative findings in individual studies areartefactual, so that the generalization of a positive CSP–CFP relationshipapplies more broadly than previously suggested (for example, Jones andWicks 1999; Pava and Krausz 1995; Ullmann 1985; Wood and Jones 1995).We can, therefore, state with some confidence that the association betweenCSP and lagged CFP is not negative. Moreover, the causation seems to bethat CSP and CFP mutually affect each other through a virtuous cycle:financially successful companies spend more because they can afford it, butCSP also helps them become a bit more successful. Moreover, the file draweranalysis indicates that the present findings cannot be dismissed by availabilitybias.
This meta-analysis both rejects and confirms notions developed by neo-classical economists. On the one hand, it rejects the idea that CSP isnecessarily inconsistent with shareholder wealth maximization (Friedman1970; Levitt 1958). Instead, organizational effectiveness may be a broadconcept encompassing both financial and social performance (Andrews 1987;Judge 1994). It is also worth noting that, according to most credible versionsof stakeholder theory, shareholders are legitimate stakeholders. On the otherhand, our findings also confirm the notions of libertarians such as Friedmanthat government regulation in the area of CSP may not be necessary. If thestatistical relationship between CSP and CFP were negative, bottom-lineconsiderations might constitute barriers to outcomes desired by the public,which in turn would make government intervention, which serves the ‘publicinterest’, a necessity. Yet, with CSP, the case for regulation and social controlby governments (acting on behalf of ‘society’ or ‘the public’) is relativelyweak because organizations and their shareholders tend to benefit frommanagers’ prudent analysis, evaluation, and balancing of multiple con-stituents’ preferences. Therefore, these actions are most likely adopted
424 Organization Studies 24(3)
voluntarily, based on managers’ cost-benefit analyses of a firm’s investments.In contrast, ‘socially responsible’ command-and-control regulation mayprescribe inflexible means–ends chains that are inappropriate for a particularfirm’s non-market and market environments (Majumdar and Marcus 2001).
Implications for Future Research
The meta-analysis helps to identify areas in which there have been relativelyfew studies conducted, and which warrant more research (for example, socialresponsibility values and market CFP; see Table 4a). Additionally, theanalysis shows areas in which the unexplained variance across studies remainsrelatively large, so that further inquiry is needed to identify moderators (forexample, CSP reputation measures and market-based CFP; see Table 4a).Moreover, Appendix A shows that the field must make a concerted effort toimprove the reliability of CSP and CFP measures. In several subgroups, thepercentage of variance of robs explained by measurement error (that is, lowreliability) was substantial. In addition to psychometric refinements, CSPresearchers must decide whether CSP ‘processes’ should really be regardedas a social performance measure. Including processes is equivalent toacknowledging effort. More broadly, some readers may share the authors’concern that previous studies were over-inclusive with respect to definitionsof stakeholders and, thus, the CSP proxies (cf. also Roman et al. 1999). Wewould argue that in future studies, only social and environmental performance‘outcomes’ should count as CSP and that the concept of ‘stakeholder’ mustbe more restrictive than it currently is.
Another concern that may be raised concerns the different variable CSPmeasures. This issue needs to be examined in future theoretical and empiricalwork. We believe that CSP, like CFP, is a valid theoretical construct —admittedly a meta-construct — which can be measured in a variety of ways.Like Meyer and Gupta (1994), we see the possible independence of theoperationalizations as a natural outcome of differences in organizationalstrategies, structures, and environments. Moreover, we share the view ofmany meta-analysts (for example, Cooper 1989; Dalton et al. 1999; Hunterand Schmidt 1990; Smith and Glass 1977) that broad constructs can, andshould, be operationalized in a number of ways. As long as researchers’choices of CSP (and CFP) measures are informed by prior judgements of theirtheoretical meaningfulness and subjected to peer review, then relatively lowcorrelations across measurement categories do not present an obstacle toresearch integration. More important to the present case, however, is that ourreview of CSP generalizability coefficients shows that different CSP measuresare, in fact, rather highly correlated (average rxx = .71; Appendix A). In otherwords, conceptual speculations about the impossibility of meaningfulintegration of prior research are not supported by empirical evidence (for adetailed review of this topic, cf. Orlitzky 1998).
Overall, we reach very different conclusions than Margolis and Walsh(2001). Although we agree with some of their more definitive conclusions asto a positive CSP–CFP relationship, we also argue that our data analysis
Orlitzky et al.: Corporate Social and Financial Performance 425
shows that interesting questions remain. The research effort does not have tobe abandoned because of poor theory or poor methods in this line of inquiry.We are particularly concerned with the conclusions of Margolis and Walsh(2001) because their criticism of other studies is argued from the vantagepoint of a method (the ‘vote-counting’ literature review) whose lack ofvalidity has been known for more than 20 years (Hedges and Olkin 1980;Hunter and Schmidt 1990). First, they do not take into account sampling andmeasurement errors. Moreover, their review relies on a binary world-view,which holds that a relationship between CSP and CFP either exists (if resultsare statistically positive, or negative) or does not exist (if results are mixedor statistically non-significant, which they falsely call ‘zero’ effects (cf. Cohen1990, 1994)). The relationship between business and society is too importanttheoretically to base our conclusions on methodologically ill-advised researchreviews.
Implications for Managers
Despite previous assumptions of inconclusive findings (for example, Jonesand Wicks 1999; McWilliams and Siegel 2001; Roman et al. 1999; Ullmann1985; Wood and Jones 1995), we can legitimately derive implications forcorporate strategy from the meta-analysis. First and foremost, market forcesgenerally do not penalize companies that are high in corporate socialperformance; thus, managers can afford to be socially responsible. Ifmanagers believe that CSP is an antecedent of CFP, they may eventuallyactively pursue CSP because they think the market will reward them for doingso. Top managers must learn to use CSP as a reputational lever (ρ = .73) andbe attentive to the perceptions of third parties, regardless of whether they aremarket analysts, public interest groups, or the media. Whereas social auditsin and of themselves are only moderately beneficial (ρ = .23), a company thatis high in CSP may especially benefit from receiving public endorsement fromfederal agencies such as the Environmental Protection Agency orOccupational Safety and Health Administration. As Fombrun (1996)suggested, the key to reaping benefits from CSP is a return from reputation(cf. also Roberts and Dowling 2002).
As findings about the positive relationships between CSP and CFP becomemore widely known, managers may be more likely to pursue CSP as part oftheir strategy for attaining high CFP. These strategic managementconsiderations would be consistent with Baron’s (2000) managerial approachto the business–society interface. Baron (2000) argues that successfulexecutives are able to integrate market strategies with non-market strategiesin order to position their firm for optimal effectiveness. Baron’s (2000) bookoffers guidelines as to how firms can strategically achieve this integration ina number of areas (such as the news media, activists, social movements,legislatures, ethics, and so on). Alternatively, social performance mayincrease through less deliberate decision processes, as firms emulate othersthat are experiencing high financial success (DiMaggio and Powell 1983).Either evolutionary process would reduce the importance of coercive control
426 Organization Studies 24(3)
mechanisms (in the form of government regulations) for effecting publicwelfare and ecological sustainability. If the mental models of managers andregulators moved to this more libertarian framework, the primary role ofregulations would be their signalling function with respect to prioritizingcertain issues and certain constituents’ claims over others.
Conclusion
Theoretically, portraying managers’ choices with respect to CSP and CFP asan either/or trade-off is not justified in light of 30 years of empirical data.This meta-analysis has shown that (1) across studies, CSP is positivelycorrelated with CFP, (2) the relationship tends to be bidirectional andsimultaneous, (3) reputation appears to be an important mediator of therelationship, and (4) stakeholder mismatching, sampling error, andmeasurement error can explain between 15 percent and 100 percent of thecross-study variation in various subsets of CSP–CFP correlations. Corporatevirtue in the form of social and, to a lesser extent, environmental responsibilityis rewarding in more ways than one.
Orlitzky et al.: Corporate Social and Financial Performance 427
428 Organization Studies 24(3)A
ppen
dix
AO
verv
iew
of
Stud
ies
Incl
uded
in M
eta-
Ana
lysi
s
Rel
iabi
lity
ofA
utho
r(s)
(ye
ar)
Ni
Obs
erve
d rb
Num
ber
of r
’sM
easu
re o
f C
SP
Mea
sure
of
CFP
C
SPC
FPre
port
ed
Abb
ott a
nd M
onse
n (1
979)
6.6
0 (t
) 1
Ber
esfo
rd’s
Soc
ial I
nvol
vem
ent
Avg
. ann
ual %
ret
urn
to.5
8, .3
3D
iscl
osur
e sc
ale
(D)
inve
stor
s
Ale
xand
er a
nd B
uchh
olz
(197
8)41
, 47
–.25
to .3
4 4
Rep
utat
iona
l rat
ings
(R
) M
arke
t ret
urn
on s
ecur
ity
.66
And
erso
n an
d Fr
ankl
e (1
980)
14–.
44 to
.87
(t)
18So
cial
res
pons
ibili
ty d
iscl
osur
es,
Mon
thly
sto
ck r
etur
ns,
dich
otom
ized
(D
) ch
ange
in E
PS, c
hang
edi
vide
nds/
shar
e
Aup
perl
e et
al.
(198
5)16
6 to
228
–.04
(t)
to .1
3 6
Car
roll’
s C
once
rn f
or S
ocie
ty(L
T a
nd S
T)
RO
A (
som
e.8
6(C
SR1)
risk
-adj
uste
d)
Bel
kaou
i (19
76)
100
–.23
to .1
0 (t
)24
Pollu
tion
cont
rol e
xpen
ditu
res
inE
xces
s m
arke
t ret
urn
of
AR
s (S
A/P
/O)
stoc
k
Bla
ckbu
rn e
l al.
(199
4)88
–.01
to .3
0 3
1989
Rat
ings
of
Cou
ncil
On
RA
O, e
xces
s m
arke
t ret
urn,
Eco
nom
ic P
rior
ities
(C
EP)
EPS
(SA
/P/O
)
Bow
man
(19
76)
Cri
teri
on v
alid
ity o
f C
SR1
.64
disc
losu
res
(CSR
1)
Bow
man
(19
78)
46.1
9 (t
)1
Cod
ing
of A
Rs
for
CSR
1 (D
)R
OSB
TA
.4
4
Bow
man
and
Hai
re (
1975
) 3
.30,
.35
(t)
2C
SR1
in A
Rs,
CE
P In
dexe
s (D
)R
OE
Bra
gdon
and
Mar
lin (
1972
) 12
.22
to .6
915
3
CE
P In
dexe
s (S
A/P
/O)
EPS
gro
wth
, RO
E, R
OC
Bro
wn
and
Perr
y (1
994)
KL
D s
core
s an
d Fo
rtun
e ra
tings
.3
4(S
A/P
/O, R
)
Bro
wn
and
Perr
y (1
995)
119
to 2
3249
to 6
210
Fo
rtun
e’s
ratin
g of
‘re
spon
sibi
lity
Com
posi
te o
f (1
) R
OA
, (2)
to th
e co
mm
unity
/env
iron
men
t’m
arke
t/boo
k va
lue,
(3)
(R)
log
(sal
es),
and
(4)
ris
k
Che
n an
d M
etca
lf (
1980
)18
–.04
, .21
2 C
EP
ratin
gs (
SA/P
/O)
Profi
tabi
lity,
P/E
rat
io
.93
Coc
hran
and
Woo
d (1
984)
6.7
2 to
.91
(t)
9 M
osko
witz
rep
utat
ion
inde
x (R
) O
E/A
sset
s, O
E/s
ales
, .6
3ex
cess
mar
ket v
alua
tion
Con
ine
and
Mad
den
(198
7)16
3.5
8 to
.72
9 E
rdos
& M
orga
n’s
Cor
p.Pe
rcep
tual
/exp
ecta
tiona
lR
eput
atio
n Su
rvey
(R
) su
rvey
mea
sure
s
Orlitzky et al.: Corporate Social and Financial Performance 429C
owen
et a
l. (1
987)
10 to
15
–.25
to .1
89
Num
ber
of v
ario
us C
SR1
RO
Edi
sclo
sure
s (D
)
Dav
idso
n an
d W
orre
ll (1
992)
51
–.09
to .2
4 (t
)8
Vol
unta
ry (
vs. g
over
nmen
t–
Dai
ly s
ecur
ity r
etur
ns (
mea
n or
dere
d) p
rodu
ct r
ecal
l cu
mul
ativ
e pr
edic
tion
erro
r)an
noun
cem
ents
(C
SP in
the
face
of
adve
rsity
) (D
)
Doo
ley
and
Ler
ner
(199
4)
86
.07
to .2
1 4
Stak
ehol
der
orie
ntat
ions
/ Fi
rm-s
peci
fic
emph
asis
(C
SR1)
R
OA
/Ind
ustr
y’s
avg.
RO
A
Fogl
er a
nd N
utt (
1975
) 9
–.27
to –
.02
53
CE
P In
dexe
s (S
A/P
/O)
P/E
rat
io
.95
Fom
brun
and
Sha
nley
(19
90)
154
.00
to .2
69
Cha
rita
ble
cont
ribu
tions
, exi
stin
gR
OIC
, mar
ket-
to-b
ook
valu
e .8
8se
para
tely
end
owed
fou
ndat
ion
ratio
, yie
ld
(yes
/no)
, and
fav
oura
bilit
y m
edia
ra
tings
(SA
/P/O
, R)
Free
dman
and
Jag
gi (
1982
)10
9–.
04 to
.01
7A
R/1
0K p
ollu
tion
disc
losu
re(C
ash-
basi
s) R
OA
and
.15,
.37
inde
x (D
) R
OE
, 2 o
pera
ting
ratio
s
Free
dman
and
Jag
gi (
1986
) 56
–.
15 to
.32
(t)
34E
xten
t of
CSR
1 di
sclo
sure
(D
)A
vg. s
tand
ardi
zed
mar
ket
.38
retu
rn r
esid
uals
Gra
ves
and
Wad
dock
(19
94)
430
.03,
.15
2K
inde
r, L
yden
berg
, Dom
ini
RO
A, R
OE
(KL
D)
mea
sure
(SA
/P/O
)
Gre
enin
g (1
995)
131
.01
to .2
215
4 di
men
sion
s of
ele
ctri
c ut
ility
R
OA
, EPS
, div
iden
d yi
eld
.24
dem
and-
side
man
agem
ent
(DSM
) pr
ogra
mm
es, C
SP
repu
tatio
n (S
A/P
/O, R
)
Gri
ffin
and
Mah
on (
1997
)7
–.59
to .5
113
Fort
une
ratin
g, K
LD
sco
re,
RO
S, R
OE
, RO
A
.35,
.73
.71
Tox
ics
Rel
ease
Inv
ento
ry (
TR
I,re
vers
e-co
ded)
, phi
lant
hrop
y (R
, SA
/P/O
)
Han
sen
and
Wer
nerf
elt (
1989
)60
.60
1E
mph
asis
on
wel
fare
of
RO
A —
T-b
ill (
risk
-fre
e) r
ate
empl
oyee
s an
d go
od w
orki
ng
cond
ition
s (s
urve
y) (
CSR
1)
Hei
nze
(197
6)28
–.34
to .5
15
Nat
iona
l Affi
liatio
n of
Con
cern
edSa
les
grow
th r
ate,
RO
S,
Bus
ines
s St
uden
ts (
NA
CB
S)O
E/s
ales
, RO
A, R
OE
ratin
gs o
f so
cial
invo
lvem
ent (
R)
Her
rem
ans
et a
l. (1
993)
38–.
13 to
.48
12Fo
rtun
e ‘r
espo
nsib
ility
to th
e A
bnor
mal
mar
ket r
etur
ns
.71
com
mun
ity/e
nvir
onm
ent’
ra
ting
(R)
430 Organization Studies 24(3)A
ppen
dix
Aco
ntin
ued
Ove
rvie
w o
f St
udie
s In
clud
ed in
Met
a-A
naly
sis
Rel
iabi
lity
ofA
utho
r(s)
(ye
ar)
Ni
Obs
erve
d rb
Num
ber
of r
’sM
easu
re o
f C
SP
Mea
sure
of
CFP
C
SPC
FPre
port
ed
Ingr
am (
1978
)96
, 120
–.01
to .0
6 (t
)12
CSR
1 di
sclo
sure
s in
5 a
reas
(D
)A
vg. m
onth
ly p
ortf
olio
re
turn
s
Ingr
am a
nd F
razi
er (
1980
)40
CSR
1D
iscl
osur
es a
nd C
EP
.15
ratin
gs (
D, S
A/P
/0)
Jaco
bson
(19
87)
4338
, 457
9R
OI,
sto
ck r
etur
n.1
4, .2
3,.2
7, .3
9
Ked
ia a
nd K
untz
(19
81)
27, 3
0–.
28 to
.25
55
mea
sure
s of
act
ual C
SP
RO
A
.05
outc
omes
(SA
/P/0
)
Lev
y an
d Sh
atto
(19
80)
55.6
9 to
.74
3C
hari
tabl
e co
ntri
butio
ns to
N
et in
com
edi
ffer
ent c
ause
s (S
A/P
/O)
Lon
g an
d R
aven
scra
ft (
1984
)A
ccou
ntin
g ra
te o
f re
turn
.79,
.89,
and
econ
omic
rat
e of
ret
urn
.89
Mar
cus
and
Goo
dman
(19
86)
22, 2
7N
ot in
clud
edC
ompl
ianc
e w
ith a
ir p
ollu
tion
RO
A, R
OE
b/c
F-st
atis
tics
regu
latio
n un
clea
r
McG
uire
et a
l. (1
988)
98, 1
31–.
21 to
.52
18Fo
rtun
e ‘r
espo
nsib
ility
to
Ret
urn
(alp
ha),
RO
A, s
ales
, .9
0, .4
7co
mm
unity
/env
iron
men
t’
grow
th, a
sset
gro
wth
, op.
ra
tings
(R
) in
com
e gr
owth
New
gren
et a
l. (1
985)
50.3
3(t)
1‘I
nstit
utio
naliz
atio
n’ o
fFi
rm P
/E r
atio
ove
r en
viro
nmen
tal a
sses
smen
tin
dust
ry P
/E r
atio
(SA
/P/O
)
O’N
eill
et a
l. (1
989)
157
–.13
to .1
54
Aup
pert
e’s
Con
cern
for
L
T, S
T (
risk
-adj
uste
d)
Soci
ety
(CSR
I)
RO
A
Park
et a
nd E
ilbir
t (19
75)
3.8
9 to
1.0
0 (t
)N
ot in
clud
edR
espo
nse
vs. N
on-r
espo
nse
Net
inco
me,
RO
S, R
OE
, fo
r va
riou
sto
soc
ial r
espo
nsib
ility
EPS
reas
ons
ques
tionn
aire
Patte
n (1
990)
74
–.10
to .2
5 (t
)7
Info
rmat
ion
disc
losu
re w
.r.t.
Mea
n ab
norm
alSu
lliva
n Pr
inci
ples
(D
) (u
nexp
ecte
d) m
arke
t ret
urns
Orlitzky et al.: Corporate Social and Financial Performance 431Pa
va a
nd K
raus
z (1
995)
14–.
22 to
.66
(t)
7D
icho
tom
izat
ion
base
d on
M
arke
t ret
urn,
P/E
rat
io,
Cou
ncil
on E
cono
mic
m
arke
t-to
-boo
k va
lue,
RO
A,
Prio
ritie
s ra
nkin
gs (
SA/P
/O)
RO
E, E
PS, d
ivid
end
payo
ut
ratio
Pres
ton
(197
8b)
3.5
0 (t
)1
Soci
al in
volv
emen
t rep
ortin
g (D
)M
arke
t rat
e of
ret
urn
onst
ock
Rei
man
n (1
975)
19.0
0 to
.69
8O
sgoo
d’s
sem
antic
dif
fere
ntia
lSu
rvey
goa
l ach
ieve
men
t.3
9m
easu
re o
f pu
blic
val
ues
(CSR
I)ra
ting
in c
ompa
riso
n to
othe
r or
gani
zatio
ns
Ria
hi-B
elka
oui (
1991
)13
9N
ot in
clud
edFo
rtun
e’s
‘res
pons
ibili
ty to
10-y
ears
’ E
PS g
row
th,
com
mun
ity/e
nvir
onm
ent’
P/E
rat
iom
easu
re (
R)
Rob
erts
(19
92)
130
.16,
.20
2C
EP
mea
sure
of
soci
al
RO
A, fi
rm g
row
thdi
sclo
sure
, phi
lant
hrop
ic
foun
datio
n? (
Y/N
) (S
A/P
/O)
Rus
so a
nd F
outs
(19
97)
486
.13,
.16
2Fr
ankl
in R
esea
rch
and
RO
A, fi
rm g
row
thD
evel
opm
ent c
orp.
en
viro
nmen
tal p
erfo
rman
ce
ratin
gs (
SA/P
/O)
Shan
e an
d Sp
icer
(19
83)
48–.
74 to
.96
(t)
24D
icho
tom
ized
pol
lutio
n-co
ntro
lA
bnor
mal
mea
n-ad
just
edpe
rfor
man
ce in
dex
(SA
/P/O
) re
turn
s
Shar
fman
(19
96)
vari
esK
LD
sco
res,
For
tune
rat
ings
, .3
3, .4
7an
d ‘s
ocia
l cho
ice’
mut
ual f
und
hold
ings
(SA
/P/O
, R)
Sim
erly
(19
94)
110
.01
to.8
8 (t
)14
Fort
une
repu
tatio
n sc
ores
,E
PS, s
hare
pri
ce, m
arke
t di
chot
omiz
ed (
R)
valu
e, R
OE
, sal
es/e
quity
, R
OI,
sal
es r
ate
Sim
erly
(19
95)
48.5
9 (t
)1
Dic
hoto
miz
ed F
ortu
ne s
urve
yR
OE
mea
sure
(R
)
Spen
cer
and
Tay
lor
(198
7)10
7, 1
20
–.06
to .5
420
Fort
une
‘res
pons
ibili
ty to
R
OA
, RO
Sco
mm
unity
/env
iron
men
t’ (
R)
Spic
er (
1978
)18
.42,
.52
2C
ounc
il on
Eco
nom
ic P
rior
ities
RO
E
.93
repo
rt (
SA/P
/O)
Star
ik (
1990
)19
3–.
02, .
142
7 st
akeh
olde
r m
anag
emen
t R
OI,
cha
nge
in r
even
ues
.85
stra
tegi
es (
surv
ey),
com
bine
d (S
A/P
/O)
Stur
diva
nt a
nd G
inte
r 18
, 22
.58,
.72
(t)
2M
osko
witz
rat
ings
(R
)E
PS g
row
th r
elat
ive
to in
dust
ry
432 Organization Studies 24(3)
App
endi
x A
cont
inue
dO
verv
iew
of
Stud
ies
Incl
uded
in M
eta-
Ana
lysi
s
Rel
iabi
lity
ofA
utho
r(s)
(ye
ar)
Ni
Obs
erve
d rb
Num
ber
of r
’sM
easu
re o
f C
SP
Mea
sure
of
CFP
C
SPC
FPre
port
ed
Tur
ban
and
Gre
enin
g (1
997)
160
–.07
to .2
56
KL
D r
atin
gs (
5 di
men
sion
s),
Profi
tabi
lity
(RO
A)
.23,
.18
repu
tatio
n (S
A/P
/O, R
)
Van
ce (
1975
)14
, 45,
50
–.51
to –
.20
3Su
rvey
rat
ings
, Mos
kow
itzC
hang
e in
sha
re p
rice
.70,
.66
rank
ings
(re
vers
e-co
ded)
(R
)
Ven
katr
aman
and
86
Prim
ary/
perc
eptu
al
Ram
anuj
am (
1987
)m
easu
res
of s
ales
gro
wth
, net
inco
me
grow
th, a
nd R
OI
com
pare
d to
obj
ectiv
e se
cond
ary
mea
sure
s re
lativ
e.3
6, .4
4,to
indu
stry
.42,
.51
Wad
dock
and
Gra
ves
(199
7)46
9.0
8 to
.17
68
KL
D d
imen
sion
s (S
A/P
/O)
RO
A, R
OE
, RO
S.5
7
War
tick
(198
8)23
0.0
5 to
.10
(t)
3U
se o
f is
sues
man
agem
ent
Surv
ey r
atin
gs: L
T.7
5(S
A/P
/O)
inve
stm
ent v
alue
, sou
ndne
ss
of fi
nanc
ial p
ositi
on, a
nd
wis
e us
e of
cor
pora
tion
asse
ts
Wis
eman
(19
82)
26So
cial
dis
clos
ures
and
CE
P .1
5, .3
7po
llutio
n au
dit r
anki
ngs
(D, S
A/P
/O)
Wok
utch
and
Spe
ncer
(19
87)
4, 8
.80
to.8
4 (t
)3
Phila
nthr
opy/
sale
s an
d cr
imes
:R
OA
, RO
S.6
44
cell
clas
sific
atio
n (S
A/P
/O)
Wol
fe (
1991
)9
corp
s.C
SRI
disc
losu
res
(int
er-r
ater
and
.87,
.99,
te
st-r
etes
t rel
., cn
t. va
lidity
) (D
).6
9
aC
lass
ifica
tion
of C
SP (
in p
aren
thes
es):
D =
dis
clos
ures
/con
tent
ana
lysi
s; R
= r
eput
atio
nal i
ndic
es; S
A/P
/O =
soc
ial a
udit,
pro
cess
and
out
com
e m
easu
res;
CSR
1 =
Aup
perl
e’s
and
othe
rs’
mea
sure
s of
cor
pora
te p
rinc
iple
s an
d va
lues
.b
(t):
ref
ers
to tr
ansf
orm
atio
n pr
oced
ure,
usu
ally
t-te
st s
tatis
tic c
onve
rted
to P
Mr:
in s
ome
case
s, tr
ansf
orm
atio
n of
dto
r.
Orlitzky et al.: Corporate Social and Financial Performance 433
This article is based on Marc Orlitzky’s 1998 dissertation thesis. The authors would like tothank Lex Donaldson, Steve Frenkel, Peter Hansen, David Jacobs, Barry Markovsky, Jim Price,and Jerry Rose for many helpful comments on earlier drafts.
Note
References References marked with an asteriskindicate studies included in the meta-analysis.
* Abbott, Walter F., and Joseph R. Monsen1979 ‘On the measurement of corporate
social responsibility: Self-reporteddisclosure as a method of measuringcorporate social involvement’.Academy of Management Journal22: 501–515.
Aldag, Ramon J., and Kathryn M. Bartol1978 ‘Empirical studies of corporate
social performance and policy: Asurvey of problems and results’ inResearch in corporate socialperformance and policy. Lee E.Preston (ed.), 1, 165–199.Greenwich, CT: JAI Press.
* Alexander, Gordon J., and Rogene A.Buchholz1978 ‘Corporate social performance and
stock market performance’.Academy of Management Journal21: 479–486.
Amburgey, T. L., and T. Dacin1994 ‘As the left foot follows the right?
The dynamics of strategic andstructural change’. Academy ofManagement Journal 37:1427–1452.
* Anderson, John C., and Alan W. Frankle1980 ‘Voluntary social reporting: An iso-
Andrews, K. R.1987 The concept of corporate strategy,
3rd edn. Homewood, IL: Irwin.
Aupperle, Kenneth E.1984 ‘An empirical measure of corporate
social orientation’ in Research incorporate social performance andpolicy. Lee E. Preston (ed.), 6,27–54. Greenwich, CT: JAI Press.
Aupperle, Kenneth E.1991 ‘The use of forced-choice survey
procedures in assessing corporatesocial orientation’ in Research incorporate social performance andpolicy. James E. Post (ed.), 12,269–279. Greenwich, CT: JAIPress.
* Aupperle, Kenneth E., Archie B. Carroll,and John D. Hatfield1985 ‘An empirical investigation of the
relationship between corporatesocial responsibility andprofitability’. Academy ofManagement Journal 28: 446–463.
Baron, D. P.2000 Business and its environment, 3rd
edn. Upper Saddle River, NJ:Prentice Hall.
* Belkaoui, Ahmed1976 ‘The impact of the disclosure of the
environmental effects oforganizational behavior on themarket’. Financial Management 5:26–31.
* Blackburn, V. L., M. Doran, and C. B.Shrader1994 ‘Investigating the dimensions of
social responsibility and theconsequences for corporate financialperformance’. Journal ofManagerial Issues 6: 195–212.
* Bowman, Edward H.1976 ‘Strategy and the weather’. Sloan
Management Review 17: 49–58.
* Bowman, Edward H.1978 ‘Strategy, annual reports, and
alchemy’. California ManagementReview 20: 64–71.
* Bowman, Edward H., and Mason Haire1975 ‘A strategic posture toward corporate
social responsibility’. CaliforniaManagement Review 18: 49–58.
434 Organization Studies 24(3)
* Bragdon, Joseph H., Jr., and John A. T.Marlin1972 ‘Is pollution profitable?’ Risk
Management 19: 9–18.
* Brown, Brad, and Susan Perry1994 ‘Removing the financial
performance halo from Fortune’s“Most Admired Companies”’.Academy of Management Journal37: 1346–1359.
* Brown, Brad, and Susan Perry1995 ‘Halo-removed residuals of
Fortune’s “responsibility to thecommunity and environment”: Adecade of data’. Business & Society34: 199–215.
Business Week1999 ‘The next bottom line’, Asian edn,
3 May: 45–96.
Carroll, Archie B.1979 ‘A three-dimensional conceptual
model of corporate socialperformance’. Academy ofManagement Review 4: 497–506.
Carroll, Archie B.1991 ‘Corporate social performance
measurement: A commentary onmethods for evaluating an elusiveconstruct’ in Research in corporatesocial performance and policy.James E. Post (ed.), 12, 385–401.Greenwich, CT: JAI Press.
* Chen, Kung H., and Richard W. Metcalf1980 ‘The relationship between pollution
control record and financialindicators revisited’. AccountingReview 55: 168–177.
Clarkson, Max B. E.1991 ‘Defining, evaluating, and managing
corporate social performance: Thestakeholder management model’ inResearch in corporate socialperformance and policy. James E.Post (ed.), 12, 331–358. Greenwich,CT: JAI Press.
Clarkson, Max B. E.1995 ‘A stakeholder framework for
analyzing and evaluating corporatesocial performance’. Academy ofManagement Review 20: 92–117.
* Cochran, Phillip L., and Robert A. Wood1984 ‘Corporate social responsibility and
financial performance’. Academy ofManagement Journal 27: 42–56.
Cohen, J.1990 ‘Things I have learned (so far)’.
American Psychologist 45:1304–1312.
Cohen, J.1994 ‘The Earth is round (p < .05)’.
American Psychologist 49:997–1003.
* Conine, Thomas E., and Gerald P.Madden1987 ‘Corporate social responsibility and
investment value: The expectationalrelationship’ in Handbook ofbusiness strategy 1986/1987yearbook. W. D. Guth (ed.), 18–1 to18–9. Boston, MA: Warren,Gorham, & Lamont.
Cook, Thomas D., and Donald T.Campbell1979 Quasi-experimentation: Design &
analysis issues for field settings.Boston, MA: Houghton Mifflin.
Cooper, Harris M.1989 Integrating research: A guide for
literature reviews, 2nd edn.Newbury Park, CA: Sage.
Cornell, Bradford, and Alan Shapiro1987 ‘Corporate stakeholders and
corporate finance’. FinancialManagement 16: 5–14.
* Cowen, Scott S., Linda B. Ferreri andLee D. Parker1987 ‘The impact of corporate
characteristics on socialresponsibility disclosure: Atypology and frequency-basedanalysis’. Accounting,Organizations and Society 12:111–122.
Cronbach, Lee J., Goldine C. Gleser,Harinder Nanda, and NageswariRajaratnam1972 The dependability of behavioral
measurements: Theory ofgeneralizability of scores andprofiles. New York: Wiley.
Dalton, D. R., C. M. Daily, J. L. Johnson,and A. E. Ellstrand1999 ‘Number of directors and financial
performance: A meta-analysis’.Academy of Management Journal42: 674–686.
Orlitzky et al.: Corporate Social and Financial Performance 435
Damanpour, Fariborz1991 ‘Organizational innovation: A meta-
analysis of effects of determinantsand moderators’. Academy ofManagement Journal 34: 555–590.
Datta, Deepak K., George E. Pinches, andV. K. Narayanan1992 ‘Factors influencing wealth creation
from mergers and acquisitions: Ameta-analysis’. StrategicManagement Journal 13: 67–84.
* Davidson, Wallace N. III, and Dan L.Worrell1992 ‘Research notes and
Friedman, Milton1970 ‘The social responsibility of
business is to increase its profits’.New York Times Magazine, 13September: 33ff.
Frooman, Jeff1997 ‘Socially irresponsible and illegal
behavior and shareholder wealth: Ameta-analysis of event studies’.Business & Society 36: 221–249.
Gephardt, Richard P., Jr.1991 ‘Multiple methods for tracking
corporate social performance:Insights from a study of majorindustrial accidents’ in Research incorporate social performance andpolicy. James E. Post (ed.), 12,359–383. Greenwich, CT: JAIPress.
Gooding, Richard Z., and John A. Wagner,III1985 ‘A meta-analytic review of the
relationship between size andperformance: The productivity andefficiency of organizations and theirsubunits’. Administrative ScienceQuarterly 30: 462–481.
* Graves, Samuel B., and Sandra A.Waddock1994 ‘Institutional owners and corporate
social performance’. Academy ofManagement Journal 37:1034–1046.
* Greening, Daniel W.1995 ‘Conservation strategies, firm
performance, and corporatereputation in the U.S. electric utilityindustry’ in Research in CorporateSocial Performance and Policy,Supplement 1, 345–368. Greenwich,CT: JAI Press.
Greening, D. W., and D. B. Turban2000 ‘Corporate social performance as a
competitive advantage in attractinga quality workforce’. Business &Society 39: 254–280.
* Griffin, Jennifer J., and John F. Mahon1997 ‘The corporate social performance
and corporate financial performancedebate: Twenty-five years ofincomparable research’. Business &Society 36: 5–31.
* Hansen, Gary S., and Birger Wernerfelt1989 ‘Determinants of firm performance:
The relative importance ofeconomic and organizationalfactors’. Strategic ManagementJournal 10: 399–411.
Hart, Stuart L.1995 ‘A natural resource-based view of
the firm’. Academy of ManagementReview 20: 986–1014.
Hedges, Larry V.1987 ‘How hard is hard science, how soft
is soft science? The empiricalcumulativeness of research’.American Psychologist 42/2:443–455.
Hedges, Larry V., and Ingram Olkin1980 ‘Vote counting methods in research
synthesis’. Psychological Bulletin88: 359–369.
* Heinze, David C.1976 ‘Financial correlates of a social
involvement measure’. AkronBusiness and Economic Review 7:48–51.
* Herremans, Irene M., ParpornAkathaporn and Morris McInnes1993 ‘An investigation of corporate
social responsibility reputation andeconomic performance’.Accounting, Organizations andSociety 18: 587–604.
Hill, Charles W. L., and Thomas M. Jones1992 ‘Stakeholder-agency theory’.
Journal of Management Studies 29:131–154.
Hunt, Morton1997 How science takes stock: The story
of meta-analysis. New York:Russell Sage Foundation.
Hunter, John E., and Frank L. Schmidt1990 Methods of meta-analysis:
Correcting errors and bias inresearch findings. Newbury Park,CA: Sage.
Husted, Brian W.2000 ‘A contingency theory of corporate
social performance’. Business &Society 39: 24–48.
* Ingram, Robert W.1978 ‘An investigation of the information
content of (certain) socialresponsibility disclosures’. Journalof Accounting Research 16:270–285.
* Ingram, Robert W., and Katherine B.Frazier1980 ‘Environmental performance and
corporate disclosure’. Journal ofAccounting Research 18: 614–622.
* Jacobson, Robert1987 ‘The validity of ROI as a measure
of business performance’. AmericanEconomic Review 77: 470–478.
Jones, Thomas M.1995 ‘Instrumental stakeholder theory: A
synthesis of ethics and economics’.Academy of Management Review20: 404–437.
Jones, Thomas M., and Andrew C. Wicks1999 ‘Convergent stakeholder theory’.
Academy of Management Review24: 206–221.
436 Organization Studies 24(3)
Judge, W. Q., Jr.1994 ‘Correlates of organizational
effectiveness: A multilevel analysisof a multidimensional outcome’.Journal of Business Ethics 13: 1–10.
* Kedia, B. L., and E. C. Kuntz1981 ‘The context of social performance:
An empirical study of Texas banks’in Research in corporate socialperformance and policy. Lee E.Preston (ed.), 3, 133–154.Greenwich, CT: JAI Press.
Ketchen, David J., Jr., James G. Combs,Craig J. Russell, Chris Shook, et al.1997 ‘Organizational configurations and
performance’. Academy ofManagement Journal 40: 223–240.
* Levy, F. K., and G. M. Shatto1980 ‘Social responsibility in large
electric utility firms: The case forphilanthropy’ in Research incorporate social performance andpolicy. Lee E. Preston (ed.), 2,237–249. Greenwich, CT: JAIPress.
Light, R. J., and P. V. Smith1971 ‘Accumulating evidence:
Procedures for resolvingcontradictions among differentresearch studies’. HarvardEducational Review 41: 429–471.
* Long, William F., and David J.Ravenscraft1984 ‘The misuse of accounting rates of
Moskowitz, Milton R.1975 ‘Profiles in corporate social
responsibility’. Business andSociety Review 13: 29–42.
Orlitzky et al.: Corporate Social and Financial Performance 437
* Newgren, K. E., A. A. Rasher, M. E.LaRoe, and M. R. Szabo1985 ‘Environmental assessment and
corporate performance: Alongitudinal analysis using amarket-determined performancemeasure’ in Research in corporatesocial performance and policy. LeeE. Preston (ed.), 7, 153–164.Greenwich, CT: JAI Press.
Nunnally, Jum C., and Ira H. Bernstein1994 Psychometric theory, 3rd edn. New
York: McGraw-Hill.
* O’Neill, Hugh M., Charles B. Saunders,and Anne D. McCarthy1989 ‘Board members, corporate social
responsiveness and profitability:Are tradeoffs necessary?’ Journal ofBusiness Ethics 8: 353–357.
Orlitzky, Marc1998 ‘A meta-analysis of the relationship
between corporate socialperformance and firm financialperformance’, dissertation thesis.University of Iowa, UMI.
* Parket, I. Robert, and Henry Eilbirt1975 ‘Social responsibility: The
underlying factors’. BusinessHorizons 18: 5–10.
* Patten, Dennis M.1990 ‘The market reaction to social
responsibility disclosures: The caseof the Sullivan Principles signings’.Accounting, Organizations andSociety 15: 575–587.
* Pava, Moses L., and Joshua Krausz1995 Corporate responsibility and
financial performance: The paradoxof social cost. Westport, CT:Quorum.
Post, James E. (ed.)1991 Research in corporate social
performance and policy, Vol. 12.Greenwich, CT: JAI Press.
Preston, Lee E.1978a ‘Corporate social performance and
policy: A synthetic framework forresearch and analysis’ in Researchin corporate social performanceand policy. Lee E. Preston (ed.), 1,1–25. Greenwich, CT: JAI Press.
* Preston, Lee E.1978b ‘Analyzing corporate social
performance: Methods and results’.Journal of Contemporary Business7: 135–150.
Price, James L., and Charles W. Mueller1986 Handbook of organizational
measurement, 2nd edn. Marshfield,MA: Pitman.
* Reimann, Bernard C.1975 ‘Organizational effectiveness and
management’s public values: Acanonical analysis’. Academy ofManagement Journal 18: 224–241.
* Riahi-Belkaoui, Ahmed1991 ‘Organizational effectiveness, social
performance and economicperformance’ in Research incorporate social performance andpolicy. James E. Post (ed.), 12,143–153. Greenwich, CT: JAI Press.
Roberts, Peter W., and Grahame R.Dowling2002 ‘Corporate reputation and sustained
superior financial performance’.Strategic Management Journal 23:1077–1093.
* Roberts, Robin W.1992 Determinants of corporate social
responsibility disclosure: Anapplication of stakeholder theory’.Accounting, Organizations andSociety 17: 595–612.
Roman, R. M., S. Hayibor, and B. R. Agle1999 ‘The relationship between social
and financial performance:Repainting a portrait’. Business &Society 38: 109–125.
* Spencer, Barbara A., and Stephen G.Taylor1987 ‘A within and between analysis of
the relationship between corporatesocial responsibility and financialperformance’. Akron Business andEconomic Review 18: 7–18.
* Spicer, Barry H.1978 ‘Investors, corporate social
performance and informationdisclosure: An empirical study’.Accounting Review 53: 94–111.
* Starik, Mark1990 ‘Stakeholder management and firm
performance: Reputation andfinancial relationships to U.S. electricutility consumer-related strategies’,unpublished doctoral dissertation.University of Georgia, Athens.
Waddock, Sandra A., and John F. Mahon1991 ‘Corporate social performance
revisited: Dimensions of efficacy,effectiveness, and efficiency’ inResearch in corporate socialperformance and policy. James E.Post (ed.), 12, 231–262).Greenwich, CT: JAI Press.
Wagner, John A., II., and Richard Z.Gooding1987 ‘Effects of societal trends on
* Wartick, Stephen L.1988 ‘How issues management contributes
to corporate performance’. BusinessForum 13: 16–22.
Wartick, Stephen L., and Phillip L.Cochran1985 ‘The evolution of the corporate
social performance model’.Academy of Management Review10: 758–769.
Webb, Eugene J., D. Campbell, R.Schwartz, L. Sechrest, and J. Grove1981 Nonreactive measures in the social
sciences. Boston, MA: HoughtonMifflin.
Wernerfelt, Birger1984 ‘A resource-based view of the firm’.
Strategic Management Journal 5:171–180.
Wholey, D. R., and J. W. Brittain1986 ‘Organizational ecology: Findings
and implications’. Academy ofManagement Review 11: 513–533.
Willums, Jan-Olaf1999 ‘Social responsibility and
shareholder value’. Business Week(Asian Edition), 3 May: 85.
* Wiseman, Joanne1982 ‘An evaluation of environmental
disclosures made in corporateannual reports’. Accounting,Organizations and Society 7: 53–63.
Wokutch, Richard E., and E. W. McKinney1991 ‘Behavioral and perceptual
measures of corporate socialperformance’ in Research incorporate social performance andpolicy. James E. Post (ed.), 12,309–330. Greenwich, CT: JAIPress.
* Wokutch, Richard E., and Barbara A.Spencer1987 ‘Corporate sinners and saints: The
effects of philanthropic and illegalactivity on organizationalperformance’. CaliforniaManagement Review 29: 62–77.
* Wolfe, Robert1991 ‘The use of content analysis to
assess corporate social responsibility’in Research in corporate socialperformance and policy. James E.Post (ed.), 12, 281–307. Greenwich,CT: JAI Press.
440 Organization Studies 24(3)
Wolfe, Robert, and Kenneth E. Aupperle1991 ‘Introduction’ in Research in
corporate social performance andpolicy. James E. Post (ed.), 12,265–268. Greenwich, CT: JAIPress.
Wood, Donna J.1991a ‘Corporate social performance
revisited’. Academy of ManagementReview 16: 691–718.
Wood, Donna J.1991b ‘Social issues in management:
Theory and research in corporatesocial performance’. Journal ofManagement 17: 383–406.
Wood, Donna J.1995 ‘The Fortune database as a CSP
measure’. Business & Society 34:197–198.
Wood, Donna J., and Raymond E. Jones1995 ‘Stakeholder mismatching: A
theoretical problem in empiricalresearch on corporate socialperformance’. International Journalof Organizational Analysis 3:229–267.
Orlitzky et al.: Corporate Social and Financial Performance 441
Marc Orlitzky (Ph.D., University of Iowa) is Lecturer at the Australian GraduateSchool of Management (AGSM), which is jointly owned by the University of Sydneyand the University of New South Wales. His work focuses on business ethics, humanresource management, and small-group communication. Since 1997, his research hasbeen accepted by publication outlets such as Business & Society, Journal of BusinessEthics, Research in Corporate Social Performance and Policy, Personnel Psychology,Trends in Organizational Behavior, Small Group Research, Academy of ManagementReview, and Journal of Personal & Interpersonal Loss.Address: AGSM, UNSW Sydney NSW 2052, Australia.E-mail: [email protected].
Frank L. Schmidt (Ph.D., Purdue University) is Ralph L. Sheets Professor ofManagement & Organizations at the University of Iowa’s Henry B. Tippie Collegeof Business. He has authored numerous articles, book chapters, and books on meta-analysis, personnel selection, employment testing, workforce productivity, anddecision theory. He is a Fellow of the American Psychological Association and aCharter Fellow of the American Psychological Society, and serves on the editorialboards of Journal of Applied Psychology and Quantitative Series in the SocialSciences.Address: Department of Management & Organizations, W252 PBAB, University ofIowa, Iowa City, IA 52242-1000, USA.E-mail: [email protected]
Sara L. Rynes (Ph.D., University of Wisconsin) is John F. Murray Professor ofManagement & Organizations at the University of Iowa’s Henry B. Tippie Collegeof Business. She has authored more than 45 articles and book chapters on humanresource strategy, recruitment and selection, careers, compensation, training, diversity,and quality management. She is a Fellow of the American Psychological Associationand the Society for Industrial and Organizational Psychology, and serves on theeditorial boards of Academy of Management Journal, Journal of Applied Psychology,Personnel Psychology, and Frontiers in Industrial and Organizational Psychology.Address: Department of Management & Organizations, W252 PBAB, University ofIowa, Iowa City, IA 52242-1000, USA.E-mail: [email protected]