+ All Categories
Home > Documents > Corporate Social Responsibility and Internal Control Effectiveness …efmaefm.org/0EFMAMEETINGS/EFMA...

Corporate Social Responsibility and Internal Control Effectiveness …efmaefm.org/0EFMAMEETINGS/EFMA...

Date post: 23-May-2018
Category:
Upload: vutu
View: 215 times
Download: 2 times
Share this document with a friend
49
Corporate Social Responsibility and Internal Control Effectiveness * Young Sang Kim ** Northern Kentucky University Yura Kim University of Seoul Hyun-Dong Kim Korea Advanced Institute of Science and Technology (KAIST) Keywords: corporate social responsibility; internal control effectiveness; material weakness; financial reporting quality JEL: G34; M14 * This work was supported by the 2015 Research Fund of the University of Seoul. ** Corresponding author: Young Sang Kim, Professor of Finance, Department of Economics and Finance, Haile/US Bank College of Business, Northern Kentucky University, Highland Heights, KY 41099, Email: [email protected], Tel: 1-859-572-5160, Fax: 1-859-572-6177.
Transcript

Corporate Social Responsibility and Internal Control Effectiveness*

Young Sang Kim**

Northern Kentucky University

Yura Kim University of Seoul

Hyun-Dong Kim

Korea Advanced Institute of Science and Technology (KAIST)

Keywords: corporate social responsibility; internal control effectiveness; material

weakness; financial reporting quality

JEL: G34; M14

* This work was supported by the 2015 Research Fund of the University of Seoul.

** Corresponding author: Young Sang Kim, Professor of Finance, Department of Economics

and Finance, Haile/US Bank College of Business, Northern Kentucky University, Highland

Heights, KY 41099, Email: [email protected], Tel: 1-859-572-5160, Fax: 1-859-572-6177.

Corporate Social Responsibility and Internal Control Effectiveness

Abstract

This study empirically examines whether corporate social responsible firms exhibit more

effective internal control over financial reporting. Specifically, we investigate whether ethical

and socially responsible firms apply business practices to ensure financial transparency and

accountability for their stakeholders. Using various measures of corporate social responsibility

(CSR) and a battery of robust regression analysis over the period from 2004 to 2012, we find

that CSR firms are more likely to have effective internal control and less likely to have material

weakness under Section 404 of the Sarbanes-Oxley Act (SOX). Our results are robust to the

propensity matching of firm characteristics, considering various measures of CSR, and

adjusting for several endogenous problems.

Keywords: corporate social responsibility; internal control effectiveness; material

weakness; financial reporting quality

JEL: G34; M14

1

1. Introduction

Corporate social responsibility (CSR) has become a new area of concern for the

wellbeing of society. Various stakeholders beyond shareholders and investors are increasingly

demanding that firms be responsible and accountable for their impact on society and the

environment as a whole. Investors consider the ethical conducts of the firms when they make

investment decisions2, while customers consider environmental and corporate social impacts

in their purchasing decisions. As stakeholders are becoming increasingly aware of CSR as

members of civil society, corporations are not only promoting the business accountability of

the entity itself, but are also ensuring that their business partners in the supply chain are

operating business in a socially responsible manner. In response to this increasing demand in

the society, corporate social responsibility or corporate sustainability are becoming very

important parts of the business agenda and are considered prominent features of business and

society.3

From an organizational perspective, CSR refers to business stewardship that benefits

the environment, society, and economy. To be socially responsible and sustainable, firms are

under increased pressure to maintain a high level of ethical standards and transparency in every

business practice (Jones, 1995; Mackey, Mackey, and Barney, 2007; Jo and Harjoto, 2011; Kim,

Park, and Wier, 2012). The key objective of CSR from a financial reporting point of view is to

2 In the 2015 Good Must Grow survey, 65% of consumers said that they would consider purchasing from socially

conscious firms, up from 60% in 2013. 3 For instance, according to “2012 Corporate/ESG/Sustainability/Responsibility Reporting: Does It Matter?,” an

analysis released by the Governance and Accountability Institute, 57% of S&P 500 index companies issued

corporate sustainability or responsibility reports, up from 20% the previous year. The percentage of S&P 500

index companies that report on sustainability or responsibility also increased, going from 72% to 75% and then

to 81% in 2013, 2014, and 2015 respectively (www.ga-institute.com).

2

ensure that the firm’s control environment is compliant, effective, efficient, and sustainable,

and that its financial information is accurate and transparent.

As firms face increased pressure to act in socially responsible ways, they are also under

great public scrutiny to provide accurate and timely financial reporting. Sarbanes Oxley Act

(SOX, hereafter), signed into law on July 30, 2002, was designed to enhance financial reporting

quality so that potential stakeholders can stay fully apprised of the firm’s financial situation.

Under Section 404 of the SOX, companies are mandated to publish any “material” information

concerning the scope and adequacy of the structure and procedures of their internal control

over financial reporting. The Exchange Act, Rules 13a-15(f) and 15d-15(f) define internal

control over financial reporting as a “process designed by, or under the supervision of, the

issuer’s principal executive and principal financial officers, or persons performing similar

functions, and effected by the issuer’s board of directors, management and other personnel, to

provide reasonable assurance regarding the reliability of financial reporting and the preparation

of financial statements for external purposes in accordance with generally accepted accounting

principles and includes those policies and procedures.”

In this paper, we study whether CSR firms apply business practices to ensure financial

transparency and accountability in order to satisfy their stakeholders. Specifically, we examine

whether CSR firms exhibit effective internal control over financial reporting as measured by

material weakness disclosure over financial reporting under SOX Section 404.4 The evidence

4 Material weakness is defined as a deficiency, or combination of deficiencies, in internal control over financial

reporting, such that there is a reasonable possibility that a material misstatement of the company’s annual or

interim financial statements will not be prevented or detected in a timely way (Public Company Accounting

Oversight Board (PCAOB) Auditing Standard No. 2, 2004). The PCAOB Auditing Standard No. 5 replaces the

term “more than remote likelihood” with “reasonable possible” when defining internal control material weakness.

3

concerning CSR motivation and impacts on firm performance and/or policy implications is far

from clear conclusion and the link between CSR and internal control over financial reporting

has not yet been examined extensively in the literature. Prior research reports on the ethical

aspect of CSR activities. For example, Kim et al. (2012) claim that socially responsible firms

constrain both accruals and real earnings management and thus deliver more transparent and

reliable financial information to their stakeholders. Their research is based on a theoretical

foundation posting that moral firms operate based on trust and cooperation with their

stakeholders, which prevents opportunism (Jones, 1995). Stakeholder theory suggests that

entities should be accountable to all of their stakeholders who can affect, or be affected by the

achievement of the objectives of the entities (Freeman, 1984). Using a sample of Spanish firms,

Gras-Gil, Manzano, and Fernandez (2016) report that more socially committed firms engage

in less earnings management, improving financial reporting quality. Overall, socially

responsible firms are not inclined to pursue short-term gain, but set the right corporate culture

and develop long term corporate-stakeholder relationships.

The contrary evidence finds that firms may be motivated to engage in CSR for

opportunistic reasons. The firm may use CSR as a medium with which to signal the market that

it is a good corporation (Mahoney, 2012). Entrenched managers may conduct in CSR practices

to burnish their reputation, in turn causing agency conflicts between the managers and

shareholders (Jensen and Meckling, 1976; Barnea and Rubin, 2005). Some firms engage in

CSR activities irresponsibly, and thus bring negative consequences to the stakeholders

including shareholders, employees, customers, and suppliers. For example, firms that engage

in excessive CSR spending are more likely to avoid taxes measured in terms of the likelihood

of engaging in tax sheltering and the extent of book-tax differences (Hoi, Wu, and Hao, 2013).

4

To examine the impact of CSR on internal control over financial reporting effectiveness,

we utilize a firm’s corporate social ratings provided by MSCI ESG STATS (previously known

as “KLD”) to measure firms’ CSR activities and extract internal control effectiveness measures

from the Audit Analytics database. Our measure of internal control effectiveness over financial

reporting is material weakness disclosure under Section 404 of the SOX. As external auditors

influence the likelihood of internal control deficiencies (e.g., Zhang, Zhou, and Zhou, 2007),

we include external auditor-related variables. Using a large sample of U.S. firms over the period

of 2004-2012, we find that CSR firms are more likely to have effective internal control over

financial reporting. Specifically, CSR firms are less likely to have material weaknesses under

Section 404 of the SOX. Additionally, the likelihood of a multiple material weakness decreases

as firms are more active in their CSR.

The contributions of this article are twofold. First, to our knowledge, we are among the

first to document a robust negative relation between CSR and internal control weakness over

financial reporting. Our results show that higher CSR firms are less likely to report material

weakness, and exhibit more effective internal control over financial reporting. We employ

several measures of CSR and provide several robust tests including propensity matching and

two-stage regression with instrumental variables. Second, we shed light on how CSR extends

to corporate behavior and effective financial reporting. Although some studies explore the

association between CSR and earnings quality, their empirical results are inconsistent and do

not advance our understandings of internal control over financial reporting. In this paper, we

try to fill this gap between CSR and internal control effectiveness using a large sample of U.S.

firms and a battery of robust empirical tests.

5

The rest of the paper is organized as follows. Section two reviews the relevant literature

and builds the hypothesis. Section three describes the data collection and research model, and

the empirical findings of the study are then provided in section four. Finally, section five

concludes the paper.

2. Literature Review and Hypothesis Development

2.1. Literature review

Research on various aspects of CSR has received considerable attention in the literature

and the media over the decades. One strand of CSR research shows that a firm actively engages

in CSR activities by being ethical and transparent and therefore, brings a positive outcome to

the organization and stakeholders. Others argue that a firm’s engagement in CSR activities may

be for self-benefit purposes and CSR is a marketing strategy of “hypocritical window dressing”

(Forbes, 2011).

Proponents of CSR believe that it is a form of corporate culture related to ethical

conduct and “doing business right” and that firms engage in CSR activities to benefit society

at large. Kreps (1990) claims that corporate culture is a shared belief or principles among

members of the organization and that “designing and maintenance of the culture is crucial to

efficient organization.” A good design and maintenance of corporate culture foster beneficial

transactions in the future. Additional evidence show that socially responsible firms have been

shown to be less likely to engage in myopic earnings management (Kim et al., 2012; Gras-Gil

et al., 2016) and tax avoiding activities (Lanis and Richardson, 2015). Some prior works

examine the relation between CSR activities and future firm performance. Based on social

responsibility ratings provided by Fortune magazine’s annual survey of corporate reputations,

6

McGuire, Sundgren, and Schneeweis (1988) document that firms with high scores perform

better on stock-market based measures such as risk-adjusted return, alpha, and total return and

on accounting-based measures such as ROA, sales growth, asset growth, and operating income

growth. Likewise, Luo and Bhattacharya (2006) report that CSR activities increase market

value although the mediating effect of customer satisfaction. For a sample of Indian firms,

Mishra and Suar (2010) develop CSR score based on various CSR databases including KLD

database, GRI guidelines (Global Reporting Initiatives), and the SAI (Social Accountability

International). They find that CSR firms improve both their financial and non-financial

performance such as workplace relations and personnel development. Harjoto and Jo (2011)

find that firms with effective corporate governance engage in CSR activities to resolve conflicts

between managers and investing and non-investing stakeholders supporting their conflict-

resolution hypothesis of CSR engagement. Ultimately, a firm’s CSR engagement enhances

operational performance and increases firm value. Examining the relation between CSR and

insider trading, Gao, Lisic, and Zhang (2014) find empirical evidence that managers of “CSR-

conscious” firms are significantly less likely to be involved in insider trades than are those of

“non-CSR-conscious” firms. However, the finding that the managers of socially responsible

firms refrain from informed trading is stronger if the interests of the managers and of the firm

are more closely aligned.

Others argue that firms’ CSR is done for opportunistic reasons and that insiders such

as managers and large blockholders intend to build personal reputations as good corporate

citizens concerned for employees, society, and the environment, at the expense of other

stakeholders (Barnea and Rubin, 2005). They propose that the overinvestment problem can

occur and thus, that CSR initiatives hamper firm value and can be a source of conflicts among

7

different stakeholders. Supporting the view that excessive CSR spending can bring negative

consequences for a firm and its stakeholders, Hoi, et al. (2013) find that excessive and

irresponsible engagement of CSR activities can lead firms to be involved in unethical business

practices to avoid taxes. The empirical finding by Preuss (2010) that even firms headquartered

in tax havens or Offshore Finance Centres (OFCs) claim that they are social responsible firms

seem to suggest that some firms are strategic with CSR activities and that their commitment is

for window dressing. In addition, CSR activities impact the cost of equity financing. Firms

with high CSR ratings pay lower cost of equity financing (El Ghoul, Guedhami, Kwok, and

Mishra, 2011) and also pay significantly less for bank loans (Gross and Roberts, 2011). In a

theoretical paper, Mackey et al. (2007) prove that firms decide to make an investment in

socially responsible activities in order to maximize their market value. They argue that firms

are willing to move back and forth from socially responsible to traditional profit maximizing

firms in order to maximize profits. Thus, the firm’s choice to remain socially responsible or not

is dependent on the value maximization theory. Supporting this view, a number of studies find

that incumbent managers may strategically use CSR as an entrenchment mechanism while

colluding with social and environmental activist (Cespa and Cestone, 2007) or non-

shareholding stakeholders (Surroca and Tribo, 2008).

Another strand of the literature on internal control effectiveness is growing and has

become of much interest in social studies. As a result of corporate financial scandals such as

Enron and WorldCom, SOX was implemented on July 30, 2002 to ensure the quality of

financial reporting and safeguard stakeholders. In particular, SOX 404 became effective on

November 15, 2004. Under the Section 404 of the SOX, managers need to assess the

effectiveness of the internal control over financial reporting followed by external auditors’

8

attestation of that effectiveness. If any material weakness exists, auditors must issue an adverse

opinion on the effectiveness of internal control over financial reporting. (PCAOB Standard

No.2; Standard No. 5). In fact, Section 302 of the SOX became effective on August 29, 2002,

before SOX 404. Under Section 302, firms started to disclose information about their internal

controls on a quarterly basis. We focus on SOX 404 rather than SOX 302. While Section 302

as somewhat vague disclosure requirements concerning material weaknesses, Section 404

states clear rules for disclosure (Doyle, Ge, and McVay, 2007a). Moreover, Section requires

additional reports including the examination of independent auditors, making the examination

of a firm’s material weaknesses more careful and accurate (Rice and Weber, 2012).

Internal control research has examined what factors drive the effectiveness of internal

control. Various determinants of internal control effectiveness have been identified by a

growing body of recent literature. The earlier research confirms that internal control

effectiveness is closely related to various firm characteristics. Weak internal control firms are

smaller, have more operating segments, are more likely to have foreign currency transactions

and are less profitable (Bryan and Lilien, 2005; Ge and McVay, 2005; Doyle et al., 2007a).

Several studies also agree that firms with more effective corporate controls are less likely to

report internal control weaknesses. For example, independent audit committees, audit

committee with financial expertise, and a larger audit committees report fewer internal control

deficiencies (Ashbaugh-Skaife, Collins, and Kinney, 2007; Hoitash, Hoitash, and Bedard,

2009). Firms with more independent boards of directors are also less likely to disclose internal

control weakness (Li, Lim, and Wang, 2007). Furthermore, Rice and Weber (2012) investigate

various determinants of internal control reporting including both firm characteristics and

governance factors. They find that the possibility of disclosing existing material weaknesses is

9

negatively related to external capital needs, non-audit fees, and the size of the audit firm,

whereas it is positively related to financial distress, prior material weaknesses, auditor change,

and management replacement. Our paper complements this line of research by adding CSR as

a new determinant of a firm’s internal control effectiveness.

Corporate governance is very closely related to the effectiveness of internal control.

Li, Sun, and Ettredge (2010) argue that CFOs’ professional qualifications affects internal

control strength and that firms with CFOs possessing financial expertise and experience are

less likely to have material weaknesses. Similarly, Krishnan and Visvanathan (2007) show that

a smaller proportion of audit committee members with financial expertise is related to more

internal control deficiencies. Lin, Wang, Chiou, and Huang (2014) create a CEO entrenchment

measure based on the principal component analysis of several CEO characteristics such as CEO

compensation structure, and CEO duality and find that more entrenched CEOs are related to a

lower quality of internal control.

Ample research explores how internal control strength affects a firm’s conduct of

business. Material weaknesses are related to lower quality estimated accruals (Doyle, Ge, and

McVay, 2007b). Ineffective internal control has a negative impact on the accuracy of

management forecast reports since managers provide guidance based on erroneous internal

reports (Feng, Li, and McVay 2009). Furthermore, Donelson, Ege, and McInnis (2016)

document that those material weaknesses are positively associated with the future revelation of

fraud. Their research is related to our paper in that it provides evidence linking internal controls

and corporate ethical behavior. Prior studies also investigate how internal control effectiveness

affects audit-related factors. For example, firms with a material weakness are significantly

10

related to a higher audit fees (Raghunandan and Rama, 2006), and firms that pay high audit

fees tend to more frequently dismiss their auditors (Ettredge, Li, and Scholz, 2007).

2.2. Hypothesis development

Stakeholder theory argues that good firms maintain a positive relationship with their

stakeholders and involve in business practices to maximize long-term value (Donaldson and

Preston, 1995; Donaldson, 1999). The CSR process is related to the ethical and moral

dimensions of firm operations and is closely related to corporate culture of conducting business.

The concept of CSR extends beyond the traditional view posited by a Nobel prize-winning

economist, Milton Friedman that a firm uses its resources and engages in activities to increase

profits and also includes benefiting society. Based on stakeholder theory, socially responsible

firms aim to increase long-term profits, build stakeholder trust, and take responsibility for

society through transparent and ethical behaviors. Also managers engage in CSR in order to

resolve conflicts among stakeholders, with the ultimate aim of maximizing shareholders’

wealth (Jensen, 2001). Therefore, this view argues that CSR is adopted in order to promote

shareholders’ welfare. Both Kim et al. (2012) and Gras-Gil et al. (2016) report that more

socially committed firms constrain earnings management ensuring that their financial reporting

is accurate and transparent. In addition, Dhaliwal et al. (2012) find that CSR firms are

associated lower analyst forecast errors providing more value relevant information to investors.

Active engagement in CSR activities reduces financial risks to the firm (Ortizky and Benjamin,

2001) and creates shareholder value in acquisitions (Deng et al., 2013). If CSR firms operate

business at sustainable levels and seek to improve operating efficiency and the effectiveness of

11

their internal control structure, then the firms expect to report fewer material weaknesses in

internal control. Overall, the strand of literature suggests that CSR firms that are moral and

their corporate culture and governance play a role in setting the right course of action for the

business. We therefore propose the following hypothesis:

Stakeholder Hypothesis: A firm actively engaged in corporate social responsibility

(CSR) is positively associated with the effectiveness of internal control over financial

reporting pursuant to Section 404 of the SOX.

Alternatively, according to signaling theory, firms voluntarily disclose information to

the capital market to attract investors and gain a favorable reputation (Verrecchia, 1983).

Corporations may choose to engage in and disclose CSR activities to send a signal to the market

that they are better than others (Mahoney, 2012) and obtain support from and inhibit the

consumption by ethically responsible consumers and investors (Shea, 2010). Firms may use a

“halo effect” to improve brand strength and financial performance (The Economist, June 27,

2015). Individuals such as top managers and firms may choose to engage in CSR activities

opportunistically in the pursuit of self-interested profits. For examples, the top managers

involve in CSR activities to build personal reputations as good corporate citizens at the expense

of other stakeholders (Barnea and Rubin, 2005). Overall, firms’ CSR actions may be a strategic

choice and the costs of engagement can exceed benefits. If firms’ CSR activities are mere

“window-dressing” exercises for managing their presented image in the market at the cost of

some stakeholders of the firm, then CSR activities may have no or a negative relation to the

internal control structure. We thus propose the following hypothesis:

12

Signaling Hypothesis: A firm actively engaged in corporate social responsibility (CSR)

is negatively or insignificantly associated with the effectiveness of internal control over

financial reporting pursuant to Section 404 of the SOX.

3. Data and Research Design

3.1 Sample construction

Initially, we obtain our sample from Audit Analytics, which includes external auditor

information and internal control reports. We adopt SOX Section 404 Material Weakness to

measure the effectiveness of the internal control system. Section 404 has required accelerated

filers to report their material weakness since 2004. Non-accelerated filers have had to conform

to SOX Section 404 since 2008. A registrant must comply with all of the requirements to report

on internal control over financial reporting if it satisfies the definition of a “large accelerated

filer” or an “accelerated filer,” as defined in Exchange Act Rule 12b-2.

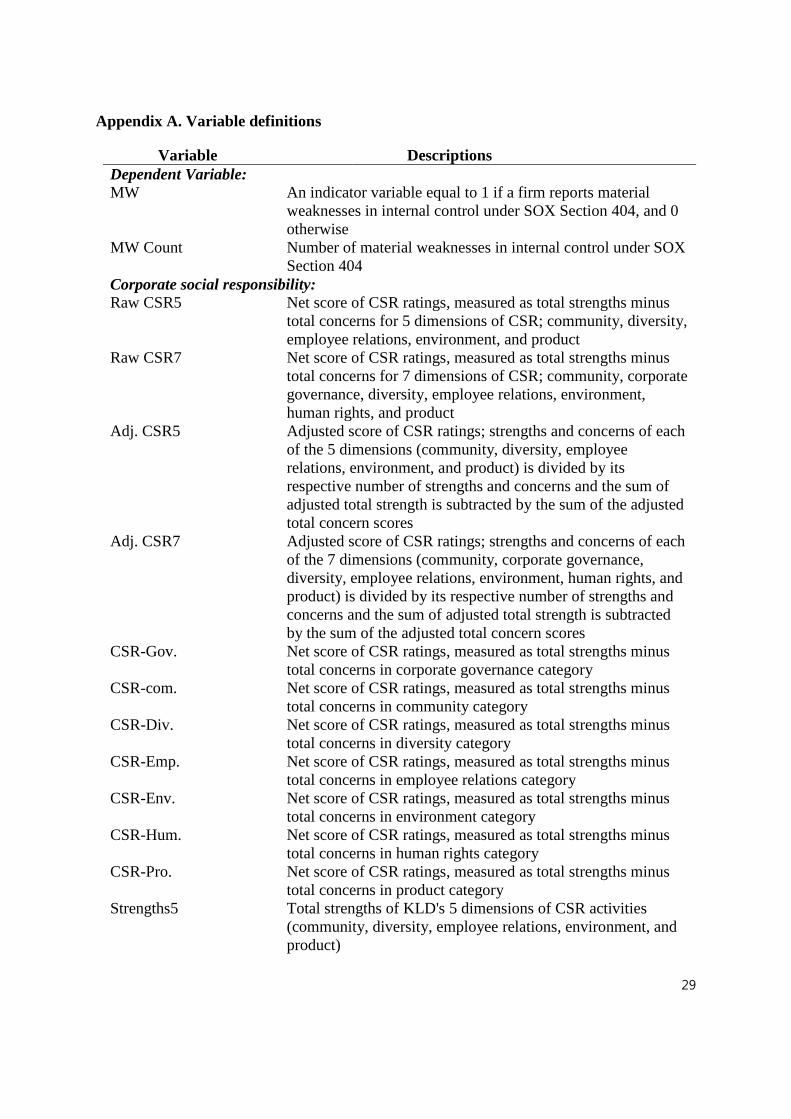
We utilize a firm’s corporate social ratings provided by MSCI ESG STATS (previously

known as KLD) to measure the firm’s CSR activities. Many practitioners and academics use

KLD data as a reliable measure of a firm’s CSR, and they are referenced in a number of articles

and papers. Sharfman (1996) provides a comprehensive review of the validity of KLD

measures. They evaluate firms’ CSR activities on seven dimensions - corporate governance,

community, diversity, employee relations, environment, human rights, product, and other

exclusionary screen categories (e.g., alcohol, gambling, tobacco and military) using financial

statements, media coverage, government documents, and peer-reviewed articles. For each firm,

the KLD evaluates strengths (positive indicators) and concerns (negative indicators) in seven

non-exclusionary dimensions and records only the concerns in exclusionary dimensions. For

each strength activities, KLD assigns a score if a firm acts socially responsibly. The firm

13

receives one point if it is involved in an activity of social concern. The composite KLD score

is measured by calculating the differences between the strengths and the concerns in each

dimension. However, raw CSR scores may create problems since the number and composition

of CSR strengths and concerns vary over time. To address this problem, we compute an

adjusted CSR score which divides the strengths and concerns of each dimension by its relative

number of strength and concern indications (Deng, Kang, and Low, 2013). In this paper, we

use both raw and adjusted KLD scores as the main independent variables in the analyses.

We obtain financial accounting data from the Compustat database and consider only

firm-year observations with available financial variables in Compustat, audit information from

Audit Analytics, and CSR measures from MSCI ESG STATS (KLD) database. Due to the

different regulations and reporting standards involved, we exclude financial institutions (SIC

code from 6000 to 6999) and regulated firms (SIC code from 4900 to 4949) from our sample.

The sample selection procedure yields a final sample of 15,961 firm-year observations from

3,070 unique firms covering 2004 to 2012.
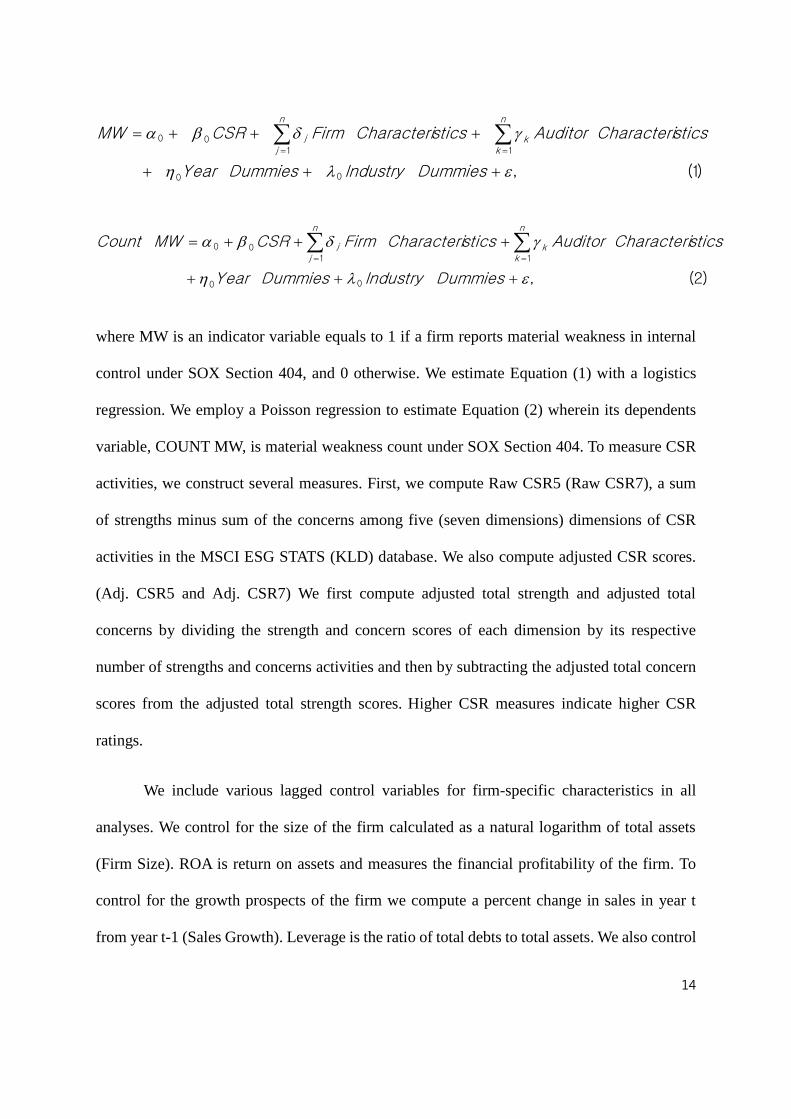
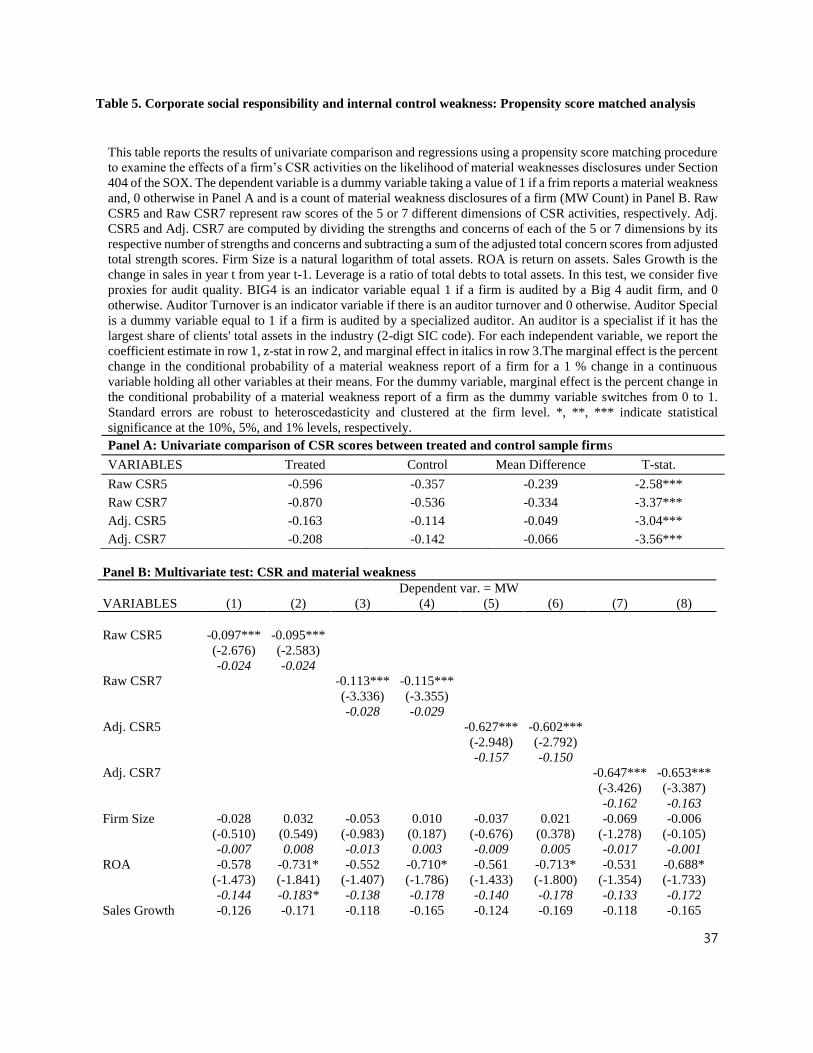
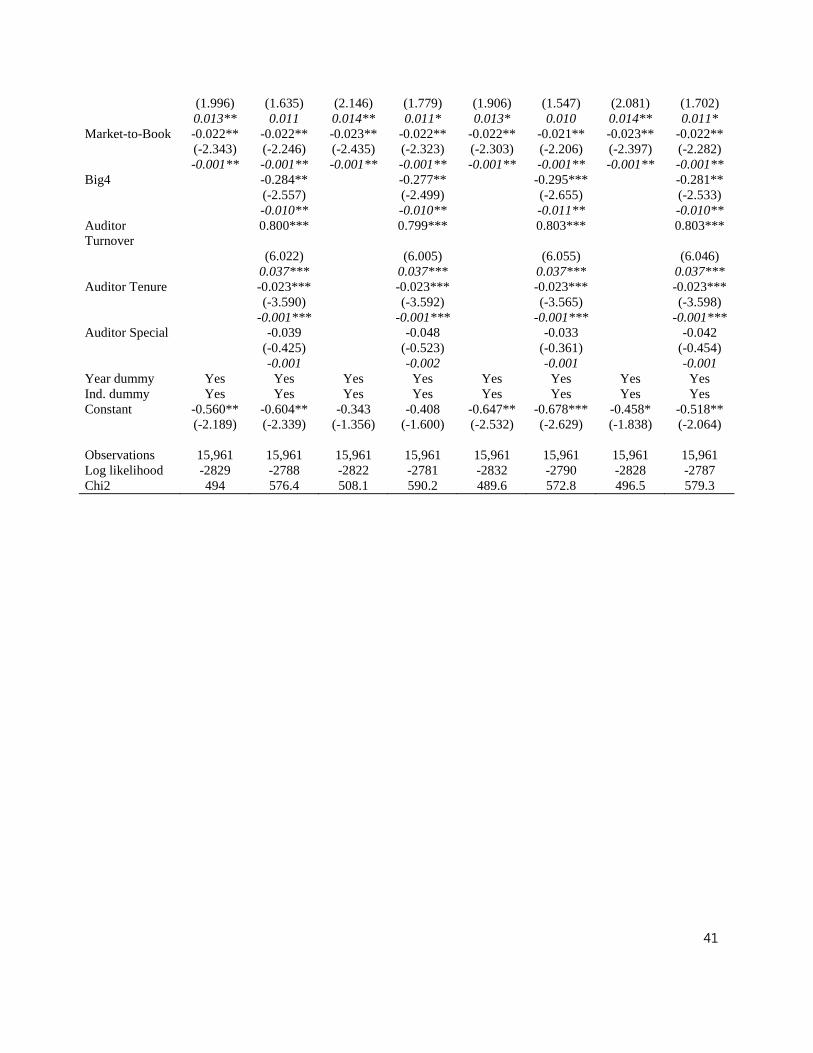
3.2 Research model

To examine the relation between CSR and thes effectiveness of a firm’s internal control

over financial reporting pursuant to Section 404 of SOX, we regress the effectiveness of

internal control measured by a dummy variable of material weakness disclosure (MW) as well

as the number of material weakness count (Count MW) on several CSR proxies along with

firm characteristics and external auditor characteristics as follows:

14

)1(,00

1100

DummiesIndustryDummiesYear

sticsCharacteriAuditorsticsCharacteriFirmCSRMWn

kk

n

jj

)2(,00

1100

DummiesIndustryDummiesYear

sticsCharacteriAuditorsticsCharacteriFirmCSRMWCountn

kk

n

jj

where MW is an indicator variable equals to 1 if a firm reports material weakness in internal

control under SOX Section 404, and 0 otherwise. We estimate Equation (1) with a logistics

regression. We employ a Poisson regression to estimate Equation (2) wherein its dependents

variable, COUNT MW, is material weakness count under SOX Section 404. To measure CSR

activities, we construct several measures. First, we compute Raw CSR5 (Raw CSR7), a sum

of strengths minus sum of the concerns among five (seven dimensions) dimensions of CSR

activities in the MSCI ESG STATS (KLD) database. We also compute adjusted CSR scores.

(Adj. CSR5 and Adj. CSR7) We first compute adjusted total strength and adjusted total

concerns by dividing the strength and concern scores of each dimension by its respective

number of strengths and concerns activities and then by subtracting the adjusted total concern

scores from the adjusted total strength scores. Higher CSR measures indicate higher CSR

ratings.

We include various lagged control variables for firm-specific characteristics in all

analyses. We control for the size of the firm calculated as a natural logarithm of total assets

(Firm Size). ROA is return on assets and measures the financial profitability of the firm. To

control for the growth prospects of the firm we compute a percent change in sales in year t

from year t-1 (Sales Growth). Leverage is the ratio of total debts to total assets. We also control

15

for the market-to-book equity ratio (Market-to-Book), measured as the market value of equity

which is the year-end stock price times the number of outstanding shares divided by the book

value of equity,

Internal control reports under SOX Section 404 are attested by external auditors who

play an important role in identifying internal control weaknesses (Hammersley, Myers, and

Shakespeare, 2008). We include several external auditor variables to control for the external

governance for internal control effectiveness.5 BIG4 is an indicator variable taking a value of

1 if a firm is audited by a Big 4 firm and 0 otherwise. Several studies find that firms audited by

Big 4 auditors are less likely to report material weaknesses (Ge and Mcvay, 2005; Hoitash et

al., 2009). We consider auditor changes (Auditor Turnover), which is expected to be associated

with MW disclosure (Ettredge, Heintz, Li, and Scholz, 2007; Zhang et al., 2007). In addition,

we expect that auditors’ industry expertise (Auditor Special) affects internal control

effectiveness as Zhang et al. (2007) report that audit committee industry expertise increases the

likelihood that the firm will be found to have internal control weakness. Finally, we consider

auditor tenure (Auditor Tenure) to capture the impact of auditors' tenure on audit quality, as in

prior research (Johnson, Khurana, and Reynolds, 2002; Ghosh and Moon, 2005).

4. Empirical Results

4.1. Descriptive statistics

Panel A of Table 1 shows the sample distribution of material weakness disclosure under

Section 404 of the SOX by year. About 4.8% (767 firms) of our sample firms (15,961 firms)

5 We initially considered an audit size, a natural logarithm of audit fees in the analysis but dropped the variable

from the analyses because of its high correlation with the firm (Firm Size).

16

disclose material weakness over financial reporting. The number of firms reporting material

weakness in internal control decreases over time from 140 in 2004 to 51 in 2012. Panel B of

Table 1 reports the count of a multiple material weaknesses. Approximately 57% of our sample

consists of a single material weakness disclosure. Very few firms disclose more than five

material weaknesses.

[Insert Table 1 here]

Table 2 reports descriptive statistics for all variables. On average, 4.8% of firms reports

material weakness in internal control under SOX Section 404 and. The raw score of CSR

ratings has a mean value of -0.286 and -0.612 for five and seven non-exclusionary categories

(Raw CSR5 and Raw CSR7), respectively. For adjusted CSR ratings, the mean value is -0.131

for five dimensions and -0.186 for seven dimensions. A mean firm in the sample has total assets

of 6.99 (in log scale), a return-on-asset ratio of 3.2%, a sales growth rate of 14.7%, a leverage

ratio of 22.4%, and a market-to-book ratio of 2.939. A total of 88.5% firms are audited by Big

4 auditors, 28.3% firms are audited by a specialized auditor, and 4.1% of firms experience an

auditor turnover. The average number of audit years (Audit Tenure) is 11.4 and ranges from 5

to 15.

[Insert Table 2 here]

Table 3 presents the correlation coefficients for the main variables. Material weakness

disclosures are negatively correlated with the CSR characteristics of the firms identified by the

net scores of total CSR ratings. Material weakness firms are negatively (positively) correlated

17

with the innate characteristics of firms such as firm size, return on assets, leverage, and market-

to-book ratio (sales growth). For external audit characteristics, material weakness disclosures

are positively (negatively) correlated with audit turnover and audit size (auditor tenure and

audit special).

Table 3 reports the Pearson correlation matrix of the variables used in the analyses. Our

dependent variable, material weakness (MW) and a count of material weakness (MW Count)

are negatively associated with CSR measures (Raw CSR5, Raw CSR7, Adj. CSR5, Adj. CSR7)

but Adj. CSR7 is insignificant.6 Larger firms are less likely to report material weakness while

higher leverage leads to more internal control problems. Firms disclosing material weaknesses

are positively correlated with auditor switch (Auditor Turnover), but they are negatively

correlated with auditor tenure (Auditor Tenure) and an indicator variable for an external auditor

with industry specialist (Auditor Special).

[Insert Table 3 here]

4.2. Multiple regression analysis

Panel A of Table 4 presents logit regression results for Equation (1). The first column

in Table 4 shows the regression estimates of total CSR scores on material weakness, an

indicator variable (MW). We find negative and significant results between CSR proxies and

MW in models (1) through (8). These results indicate that firms with high CSR ratings are less

6 Material weakness (MW) and a count of material weakness (MW Count) are positively correlated with CSR

strength scores, but negatively correlated with CSR concern scores. These variables are not included in the

correlation table due to space constraints.

18

likely to report material weaknesses in internal control. We observe a similar result when we

control for external audit characteristics. The third row shows the marginal effects of estimates

on material weakness. Similar to the first column, we find a negative and significant relation

between Adjusted CSR measures and MW, indicating that firms with higher CSR scores are

less likely to report material weakness in internal control.

Table 4 Panel B presents Poisson regression results for Equation (2). We show the

regression estimates of various CSR scores on the number of material weakness (Count MW).

We find a negative and significant relation between CSR and Number MW at the 1%

significance level. These results indicate that CSR firms experience a fewer material weakness

disclosures in internal control. We observe similar results even after we control for external

audit characteristics. Overall, our results indicate that firms with higher CSR scores experience

less material weakness in internal control.7

[Insert Table 4 here]

To examine the endogeneity problem, we run several robustness tests. Table 5 reports

empirical results of propensity score matching analysis. We construct a propensity score

matched sample as a control group. For every firm that reports material weakness over financial

reporting in internal control, we identify a matching firm based on firm size, ROA, the same

2-digit industry and same fiscal year. We re-estimate our research models using 1,534 firm-

year observations consisting of 767 MW observations and 768 matching control samples. In

7 We perform the same analysis using material weaknesses for two consecutive years and find empirical results

similar to those seen in Table 4.

19

Panel A, we provide a mean difference of our four main CSR proxies. For all four CSR

measures (Raw CSR5, Raw CSR7, Adj. CSR5, and Adj. CSR7), we find a significant

difference in means between treated and control groups at the 1% significance level. Panel B

of Table 5 reports the estimated coefficients for Equation (1), which confirm that our finding

is similar to the overall sample analysis reported in Table 4. As firms engage in more CSR

actions, they are less likely to disclose material weakness. Panel C of Table 5 reports that the

coefficients of all CSR measures show the significance at the 1% levels. These results suggest

that firms are likely to report a fewer material weaknesses under SOX Section 404.

[Insert Table 5 here]

We perform an additional analysis by decomposing the total CSR scores into strengths

and concerns. We show the results in Table 6. Panel A presents the logit regression estimates

of the decomposed CSR scores on material weakness. We find a significant and positive

coefficient on the concern scores (Concerns5, Concerns7, and Adj. Concerns7) in models (1)

to (4) and in models (7) and (8). In model (5) and (6), the concern scores are not statistically

significant but strength scores (Adj. Strenght5) are negative and significant. This indicates that

the higher the KLD strength score, the less likely the firms are to report material weakness in

internal control. It also indicates that the higher the KLD concerns score, the more likely the

firms report material weakness in internal control. Panel B presents the Poisson regression

estimates of the decomposed CSR scores on the number of material weakness. We find a

significant and negative coefficient on the strengths measures and a significant and positive

coefficient on the concerns scores except in model (6). Overall, the results indicate that the

higher the KLD strength score, the fewer material weaknesses in internal control the firms

20

report. It also indicates that the higher the KLD concerns score, the more material weaknesses

in internal control the firms report.

[Insert Table 6 here]

Following the literature (e.g., Kim et al., 2012), we construct additional CSR score

measures for each of the five or seven categories (dimensions): community (CSR-Com.),

corporate governance (CSR-Gov.), diversity (CSR-Div.), employee relations (CSR-Emp.),

environment (CSR-Env.), human rights (CSR-Hum.), and product (CSR-Pro.). Then, we

examine the relation between the CSR score of each dimension and material weakness in

internal control. We re-estimate the logit regression of Equation (1) using both the raw and

adjusted scores for each category by measuring total strength minus total concerns. As shown

in Table 7, the coefficients on CSR-Gov., CSR-Emp., and CSR-Hum. are negative and

significant at (p<0.1, <0.01, and <0.05, respectively). The coefficients on CSR-Com., CSR-

Div, CSR-Env., and CSR-Pro. are statistically insignificant. These results indicate that CSR in

corporate governance, employee relations, and human rights have a significant effect in

reducing material weakness in internal control, while CSR in community, diversity,

environment, and product are less likely to be related to internal control effectiveness over

financial reporting. In untabulated results, we find that multiple material weakness disclosure

(Count MW) is associated with the governance, diversity, employee relations, and human rights

aspects of CSR activities.

[Insert Table 7 here]

4.3. Additional robustness tests

21

We conduct several supplemental tests to examine the sensitivity of our results. Most

importantly, we acknowledge that some omitted variables correlated with a firm’s CSR actions

may also affect the firm’s internal control quality. It is challenging to control for the potential

impact of omitted variables and find perfect instruments for solving endogeneity concerns. In

examining the determinants of a firm’s CSR engagement, Harjoto and Jo (2011) consider a

firm’s attempt to measure product quality through advertising spending, CEO characteristics,

industry competition, and governance variables such as management entrenchment measures,

board structure, institutional ownership, and analyst following. We use a product market

competition measure, a Herfindahl--Hirschman index (HHI) based on a firm’s annual sales

using the 2-digit SIC code industry classification, as the instrument for CSR scores in the

analyses. A high HHI value indicates high concentration or less market competition. Finding a

good instrument variable is not easy. To test whether product market competition (HHI) serves

as a good instrument variable in our sample, we check the correlation between product market

competition (HHI) and our CSR measures, and between product market competition (HHI) and

material weakness (MW). The instrument used in the analysis may be an appropriate choice

since the instrument is highly correlated with our CSR measures at the 1% significance levels

and has low and insignificant correlation with the dependent variable (MW) as presented in

Table 3. Table 8 shows that the coefficients of HHI in the first stage are negative and significant

indicating that industry competition positively affects CSR engagements. The results from the

second-stage support our earlier findings that a firm’s CSR engagement is related to internal

control effectiveness. The coefficients of the CSR measures in column (2), (4), (6), and (8) are

negative and significant at the 5% level.

[Insert Table 8 here]

22

The literature finds that board structure is related to internal control weakness

disclosures. The board plays a monitoring role and remediates material weakness (Li et al.,

2007; Goh, 2009). Similarly, Hoitash et al. (2009) develop a composite score to measure board

strength and find that the likelihood of reporting material weakness is lower for firms with

higher board strength. CEO characteristics are also associated with internal control quality. Lin

et al. (2014) find that younger CEOs and longer CEO tenure are associated with weaker internal

control quality, but find insignificant results for CEO gender. We consider board and CEO

characteristics in the analysis and report the results in Table 9.

We consider a natural logarithm of the number of board members (Board Size), a

percent of independent board members (Board Indep.), and percent of female board members

(Female Director) to control for board characteristics, and age of CEO (CEO Age), tenure

period of CEO (CEO Tenure), and a female CEO indicator (Female CEO) to control for CEO

characteristics. We include board and CEO variables but exclude externa auditor variables in

columns (1), (3), (5), and (7). In columns (2), (4), (6), and (8) include all available variables.

Some CSR proxies are not statistically insignificant after we control for board and CEO

characteristics (Raw CSR5 in column (1) and Adj. CSR5 in Column (6), but the overall

coefficients of the CSR proxies are negative and significant. We find that the coefficients of

female directors are positive and significant. The findings on the role of female board members

on internal control quality are mixed. Chen, Eshleman, and Soileau (2016) report that female

board members reduce the likelihood of material weakness disclosures. In opposite Parker, Dao,

Huang, and Yan (2016) argue that females examine internal control problems more thoroughly

and are more likely to report internal control problems. Lin et al, (2014) find an insignificant

influence of female board members on internal control quality. This finding may indicate that

23

CSR firms maintain effective internal controls and are less likely to disclose material

weaknesses over financial reporting.

[Insert Table 9 here]

Further, we restrict our sample to firms that reported material weakness in internal

control, resulting in a sample of 767 observations. In untabulated results, we find a negative

and significant relation between CSR proxies and multiple numbers of material weaknesses

(Count MW), similar to the results shown in Table 4 Panel B. These results indicate that CSR

firms experience fewer material weakness disclosures among the firms that report material

weakness in internal control. These results are not affected when we control for external audit.

Some studies suggest that the KLD’s corporate governance has distinct construct that

is different from the other dimensions and thus eliminate corporate governance when

measuring CSR scores (Kim et al, 2012; Cui, Jo, and Li, 2015). Thus, as a robustness check,

we run Equation (1) and (2) excluding the corporate governance category (CSR-Gov.) and

compute both raw and adjusted scores with the remaining dimensions. The results are not

tabulated for the brevity, but we find that the CSR measures excluding the corporate

governance dimension (Raw CSR6 and Adj. CSR6) still display statistically significant results.

5. Conclusion

Our study seeks to understand the effect of CSR on the strength of internal control over

financial reporting quality. Specifically, we investigate whether ethical and socially responsible

firms apply business practices to ensure financial transparency and accountability for their

24

various stakeholders. Empirically, we examine the impact of a firm’s CSR engagement on

material weakness disclosures under Section 404 of the SOX. Firms with effective governance

firms engage in socially responsible activities maximize stakeholders’ value by resolving

conflicts between managers and investing and non-investing stakeholders (Jo and Harjoto,

2012). However, CSR activities can be value destroying when a frim strategically initiates CSR

activities at the expense of stakeholders and for the private benefit of reputational gain in the

market. Then, overinvestment problemw can occur (Barnea and Rubin, 2010). Our empirical

evidence appears to favor the ethical view. We find that higher CSR activities lead to better

internal control effectiveness over financial reporting. In particular, an increase in CSR reduces

the likelihood of material weakness significantly. The propensity matching analysis and 2SLS

methodology also reveal that our conclusion is unlikely to be confounded by endogeneity.

Combining two crucial areas of the literature-CSR and internal control- our study offers

interesting evidence that contributes to the debate on the costs and benefits of CSR. Our results

should be of particular interest to a broad range of parties including shareholder activists, CSR

activists, and regulators, as well as all public shareholders

25

Reference

Ashbaugh-Skaife, H., D. W. Collins, and W. R. Jr. Kinney, 2007, The discovery and reporting

of internal control deficiencies prior to SOX-mandated audits, Journal of Accounting and

Economics 44, pp. 166-192.

Barnea, A. and A. Rubin, 2010, Corporate social responsibility as a conflict between

shareholders. Journal of Business Ethics 97, pp. 71-86.

Bryan, S., and S. Lilien, 2005, Characteristics of firms with material weaknesses in internal

control: An assessment of Section 404 of Sarbanes-Oxley, Working paper. Wake Forest

University and City University of New York.

Cespa, B. and G. Cestone, 2007, Corporate Social Responsibility and Managerial

Entrenchment. Journal of Economics and Management Strategy 16, pp. 741–771.

Chen, Y., J. D. Eshleman, J. S. Soileau, 2016, Board gender diversity and internal control

weaknesses, Advances in Accounting, Incorporating Advances in International Accounting

33, pp. 11-19.

Cui, J., H. Jo, and Y. Li, 2015, Corporate social responsibility and insider trading, Journal of

Business Ethics 130, pp. 869-887.

Deng, X., J. Kang, and B. S. Low, 2013, Corporate social responsibility and stakeholder value

maximization: Evidence from mergers, Journal of Financial Economics 110, pp. 87-109.

Dhaliwal, D. S., S. Radhakrishnan, A. Tsang, and Y. G. Yang, 2012, Nonfinancial disclosure

and analyst forecast accuracy: International evidence on corporate social responsibility

disclosure, The Accounting Review 87, pp. 721-759.

Donaldson, T., L. E. Preston, 1995, The Stakeholder Theory of the Corporation: Concept,

Evidence, and Implications, Academy of Management Review 20, pp. 701-711.

Donaldson, L., 1999. Making Stakeholder Theory Whole. Academy of Management Review 24,

pp. 237-241.

Donelson, D. C., M. Ege, and J. M. McInnis, 2016, Internal control weaknesses and financial

reporting fraud, Working paper. University of Texas at Austin and Texas A&M University.

Doyle, J., T., W. Ge, S. McVay, 2007a, Determinants of weaknesses in internal control over

financial reporting, Journal of Accounting and Economics 44, pp. 193-223.

Doyle, J., T., W. Ge, S. McVay, 2007b, Accruals quality and internal control over financial

reporting, The Accounting Review 82, pp. 1141-1170.

El Ghoul, S., O. Guedhami, C. C. Y. Kwok, and D. R. Mishra, 2011, Does corporate social

responsibility affect the cost of capital? Journal of Banking and Finance 35, pp. 2388-2406.

Ettredge, M. L., J. Heintz, C. Li, and S. Scholz, 2007, Auditor realignments accompanying

implementation of SOX 404 ICFR reporting requirements, Accounting Horizons 25, pp.

17-39.

Ettredge, M. L., C. Li, and S. Scholz, 2007, Audit fees and auditor dismissals in the Sarbanes-

Oxley era, Accounting Horizons, 21 pp. 371-386.

Feng, M., C. Li, and S. McVay, 2009, Internal control and management guidance, Journal of

Accounting and Economics 48, pp. 190-209.

Freeman, E., 1984, Strategic management: A stakeholder approach. Pitmn, Boston.

Gao, F., L. L. Lisic, I. X. Zhang, 2014, Commitment to social good and insider trading, Journal

of Accounting and Economics 57, pp. 149-175.

Ge, W. and S. McVay, 2005, The disclosure of material weaknesses in internal control after

the Sarbanes-Oxley Act. Accounting Horizons 19, pp. 137-158.

26

Ghosh, A., and D. Moon, 2005, Auditor tenure and perceptions of audit quality, The Accounting

Review 80, 585-612.

Goh, B. W., 2009, Audit committees, board of directors, and remediation of material

weaknesses in internal control, Contemporary Accounting Research 26, pp. 549-579.

Gras-Gil, E., M. P. Manzano, and J. H. Fernandez, 2016, Investigating the Relationship

between Corporate Social Responsibility and Earnings Management: Evidence from Spain,

Business Research Quarterly 51, pp. 1-11.

Gross, A. and G. R. Roberts, 2011, The Impact of Corporate Social Responsibility on the Cost

of Bank Loans, Journal of Banking and Finance 35, pp. 1794-1810.

Hammersley, J., L. Myers, and C. Shakespeare, 2008, Market reactions to the disclosure of

internal control weaknesses and to the characteristics of those weaknesses under Section

302 of the Sarbanes Oxley Act of 2002, Review of Accounting Studies 13, pp. 141-165.

Harjoto, M. A., and H. Jo, 2011, Corporate governance and CSR nexus, Journal of Business

Ethics 100, pp. 45-67.

Hoi, C. K., Q. Wu, and Z. Hao, 2013, Is Corporate Social Responsibility (CSR) Associated

with Tax Avoidance? Evidence from Irresponsible CSR Activities, The Accounting Review

88, pp. 2025-2059.

Hoitash, U., R. Hoitash, and J. C. Bedard, 2009, Corporate governance and internal control

over financial reporting: A comparison of regulatory regimes, The Accounting Review 84,

pp. 839-867.

Jensen, M. C. and W. H. Meckling, 1976, Theory of the firm: Managerial behavior, agency

costs and ownership structure, Journal of Financial Economics 3, pp. 305-360.

Jensen, M. C., 2001, Value maximization, stakeholder theory, and the corporate objective

function, Journal of Applied Corporate Finance 14, pp. 8–21.

Jo, H. and M. Harjoto, 2011, Corporate Governance and Firm Value: The Impact of Corporate

Social Responsibility, Journal of Business Ethics 103, pp. 351-383.

Jo, H. and M. Harjoto, 2012, The causal effect of corporate Governance on corporate Social

Responsibility, Journal of Business Ethics 106, pp. 53-72

Kim, Y., M. S. Park, and B. Wier, 2012, Is Earnings Quality Associated with Corporate Social

Responsibility? The Accounting Review 87, pp. 761-796.

Kreps, D. M., 1990. Corporate Culture and Economic Theory, In Perspectives on Positive

Political Economy edited by J. E. Alt, and K. A. Shepsle. (Cambridge, U.K.: Cambridge

University Press).

Krishnan, G. V., and G. Visvanathan, 2007, Reporting internal control deficiencies in the post-

Sarbanes-Oxley Era: The role of auditors and corporate governance, International Journal

of Auditing 11, pp. 73-90.

Johnson, V., I. K. Khurana, and J. K. Reynolds, 2002, Audit-firm tenure and the quality of

financial reports, Contemporary Accounting Research 19, 637-660.

Jones, T., 1995. Instrumental stakeholder theory: A synthesis of ethics and economics, The

Academy of Management Review 20, pp. 404-437.

Lanis, R. and G. Richardson, 2015, Is corporate social responsibility performance associated

with tax avoidance? Journal of Business Ethics 127, pp. 439-457.

Li, C., J. Lim, and Q. Wang, 2007, Internal and external influences on IT control governance,

International Journal of Accounting Information Systems 8, pp. 225-239.

27

Li, C., L. Sun, M. Ettredge, 2010, Financial executive qualifications, financial executive

turnover, and adverse SOX 404 opinions, Journal of Accounting and Economics 50, pp.

93-110.

Lin, Y., Y. Wang, J. Chiou, and H. Huang, 2014, CEO characteristics and internal control

quality, Corporate governance: An International Review 22, pp. 24-42.

Luo, X. and C. B. Bhattacharya, 2006, Corporate Social Responsibility, Customer Satisfaction,

and Market Value, Journal of Marketing 70, pp. 1-18.

Mahoney, L. S., 2012, Standalone CSR Reports: A Canadian Analysis, Issues in Social &

Environmental Accounting 6, pp. 4-25.

Mackey, A., T. B. Mackey, and J. B. Barney, 2007, Corporate Social Responsibility and Firm

Performance: Investor Preferences and Corporate Strategies, The Academy of Management

Journal 32, pp. 817-835.

McGuire, J. B., A. Sundgren, and T. Schneeweis, 1988, Corporate Social Responsibility and

Firm Financial Performance, The Academy of Management Journal 31, pp. 854-872.

Mishra, S. and D. Suar, 2010, Does corporate social responsibility influence firm performance

of Indian companies? Journal of Business Ethics 95, pp. 571-601.

Orlitzk, M. and J.D. Benjamin, 2001, Corporate social performance and firm risk: A meta-

analytic review, Business and Society 40, pp. 369-396.

Parker, R. J., M. Dao, H. Huang, and Y. Yan, 2016, Disclosing material weakness in internal

controls: Does the gender of audit committee members matter, Asia-Pacific Journal of

Accounting & Economics 30, pp. 1-14.

Public Company Accounting Oversight Board (PCAOB), 2004. An audit of internal control

over financial reporting performed in conjunction with an audit of financial statements.

Auditing Standard No. 2.

Public Company Accounting Oversight Board (PCAOB), 2007. An audit of internal control

over financial reporting. Auditing Standard No. 5.

Raghunandan, K. and D. Rama, 2006, Sox section 404 material weakness disclosures and audit

fees, Auditing: A Journal of Practice & Theory 25, pp. 99-114.

Rice, S. C. and D. P. Weber, 2012, How Effective is internal control reporting under SOX 404?

Determinants of the (non-)disclosure of existing material weaknesses, Journal of

Accounting Research 50, pp. 811-843.

Preuss, L., 2010, Tax Avoidance and Corporate Social Responsibility: you can’t do both or can

you? Corporate Governance: The International Journal of Business in Society 10, pp.365

– 374.

Schütte, A. 2011. Is Corporate Social Responsibility “Hypocritical Window Dressing”?

Forbes, http://www.forbes.com/sites/arjanschutte/2011/08/17/is-corporate-social-

responsibility-hypocritical-window-dressing/#767d595f3873

Sharfman, M., 1996, The Construct validity of the Kinder, Lydenberg, & Domini social

performance ratings data, Journal of Business Ethics 15, pp. 287-296.

Shea, L. J., 2010, Using Consumer Perceived Ethically as a guideline for Corporate Social

Responsibility Strategy: a Commentary Essay, Journal of Business Research 63, pp. 263-

264.

Surroca, J. and J. Tribo, 2008, Managerial Entrenchment and Corporate Social Performance.

Journal of Business Finance and Accounting 35, pp. 748-789.

Verrecchia, R. E., 1983, Discretionary disclosure, Journal of Accounting and Economics 5, pp.

179-194.

28

Zhang, Y., J. Zhou, N. Zhou, 2007, Audit committee quality, auditor independence, and internal

control weaknesse, Journal of Accounting and Public Policy 26, pp. 300-327.

29

Appendix A. Variable definitions

Variable Descriptions

Dependent Variable:

MW An indicator variable equal to 1 if a firm reports material

weaknesses in internal control under SOX Section 404, and 0

otherwise

MW Count

Number of material weaknesses in internal control under SOX

Section 404

Corporate social responsibility:

Raw CSR5 Net score of CSR ratings, measured as total strengths minus

total concerns for 5 dimensions of CSR; community, diversity,

employee relations, environment, and product

Raw CSR7 Net score of CSR ratings, measured as total strengths minus

total concerns for 7 dimensions of CSR; community, corporate

governance, diversity, employee relations, environment,

human rights, and product

Adj. CSR5 Adjusted score of CSR ratings; strengths and concerns of each

of the 5 dimensions (community, diversity, employee

relations, environment, and product) is divided by its

respective number of strengths and concerns and the sum of

adjusted total strength is subtracted by the sum of the adjusted

total concern scores

Adj. CSR7 Adjusted score of CSR ratings; strengths and concerns of each

of the 7 dimensions (community, corporate governance,

diversity, employee relations, environment, human rights, and

product) is divided by its respective number of strengths and

concerns and the sum of adjusted total strength is subtracted

by the sum of the adjusted total concern scores

CSR-Gov. Net score of CSR ratings, measured as total strengths minus

total concerns in corporate governance category

CSR-com. Net score of CSR ratings, measured as total strengths minus

total concerns in community category

CSR-Div. Net score of CSR ratings, measured as total strengths minus

total concerns in diversity category

CSR-Emp. Net score of CSR ratings, measured as total strengths minus

total concerns in employee relations category

CSR-Env. Net score of CSR ratings, measured as total strengths minus

total concerns in environment category

CSR-Hum. Net score of CSR ratings, measured as total strengths minus

total concerns in human rights category

CSR-Pro. Net score of CSR ratings, measured as total strengths minus

total concerns in product category

Strengths5 Total strengths of KLD's 5 dimensions of CSR activities

(community, diversity, employee relations, environment, and

product)

30

Concerns5 Total concerns of KLD's 5 dimensions of CSR activities

(community, diversity, employee relations, environment, and

product)

Strengths7 Total strengths of KLD's 7 dimensions of CSR activities

(community, corporate governance, diversity, employee

relations, environment, human rights, and product)

Adj. Concerns7 Total concerns of KLD's 7 dimensions of CSR activities

(community, corporate governance, diversity, employee

relations, environment, human rights, and product)

Adj. Strengths5 A sum of strengths of 5 dimensions (community, diversity,

employee relations, environment, and product) where each

strength score is divided by its respective number of strengths

Adj. Concerns5 A sum of concerns of 5 dimensions (community, diversity,

employee relations, environment, and product) where each

concern score is divided by its respective number of concerns

Adj. Strengths7 A sum of strengths of 7 dimensions (community, corporate

governance, diversity, employee relations, environment,

human rights, and product)where each strength score is

divided by its respective number of strengths

Adj. Concerns7 A sum of concerns of 7 dimensions (community, corporate

governance, diversity, employee relations, environment,

human rights, and product) where each concern score is

divided by its respective number of concerns

External auditor characteristics:

Big4 An indicator variable equals to 1 if a firm is audited by a Big 4,

firm and 0 otherwise

Auditor Turnover An indicator variable if there is an auditor turnover, and 0

otherwise

Auditor Tenure A natural logarithm of tje number of years an auditor has

audited a firm

Auditor Special A dummy variable equal to 1 if a firm is audited by a specialized

auditor. An auditor is a specialist if it has tje largest share of

clients' total assets in the industry (2-digt SIC code)

Firm characteristics:

Firm Size The log of total assets

ROA Return on assets

Leverage Total debt divided by total assets

Market-to-Book Borrower’s market-to-book ratio of assets

Tangibility Property, plant, and equipment scaled by total assets

31

Table 1. Sample distribution by Year

Panel A: Distribution of material weakness by year

MW

Year No Yes Total

2004 1,044 140 1,184

2005 1,598 173 1,771

2006 1,649 127 1,776

2007 1,672 102 1,774

2008 1,846 48 1,894

2009 1,893 41 1,934

2010 1,946 42 1,988

2011 1,937 43 1,980

2012 1,609 51 1,660

Total 15,194 767 15,961

Panel B: Number of material weakness by year

Year 1 2 3 4 5 > 5 Total

2004 76 23 19 4 6 12 140

2005 91 40 15 8 7 12 173

2006 76 27 6 7 3 8 127

2007 58 22 7 3 7 5 102

2008 27 12 5 0 3 1 48

2009 22 9 2 3 1 4 41

2010 21 13 4 2 1 1 42

2011 32 7 2 1 1 0 43

2012 32 10 5 2 2 0 51

Total 435 163 65 30 31 42 767

32

Table 2. Descriptive statistics

This table presents distributional statistics for variables used in our analysis. Panel A presents 25th

percentile, medians, means, 75th percentile, standard deviations, and number of observations of

dependent variables. Panel B and C provide descriptive statistics of CSR measures and a variety of

firm and external auditor characteristics. Appendix A provides the definition of all variables.

Panel A: Internal control measures

Variable Mean Median P25 P75 SD N

MW 0.048 0 0 0 0.214 15961

MW Count 0.102 0 0 0 0.660 15961

Panel B: CSR measures

Variable Mean Median P25 P75 SD N

Raw CSR5 -0.286 -1 -2 0 2.288 15961

Raw CSR7 -0.612 -1 -2 0 2.491 15961

Adj. CSR5 -0.131 -0.185 -0.367 0 0.419 15961

Adj. CSR7 -0.186 -0.2 -0.5 0 0.498 15961

Strengths5 1.210 0 0 1 2.302 15961

Strengths7 1.369 1 0 2 2.462 15961

Adj. Strengths5 0.190 0 0 0.2 0.383 15961

Adj. Strengths7 0.236 0.111 0 0.268 0.467 15961

Concerns5 1.483 1 0 2 1.489 15961

Concerns7 1.935 2 1 3 1.741 15961

Adj. Concerns5 0.320 0.25 0 0.5 0.331 15961

Adj. Concerns7 0.422 0.367 0.167 0.533 0.401 15961

Panel C: Firm and auditor characteristics

Variable Mean Median P25 P75 SD N

Firm Size 6.990 6.877 5.849 7.979 1.536 15961

ROA 0.032 0.051 0.008 0.097 0.147 15961

Sales Growth 0.147 0.090 -0.002 0.214 0.354 15961

Leverage 0.224 0.184 0.014 0.348 0.218 15961

Market-to-Book 2.939 2.178 1.390 3.580 3.919 15961

Big4 0.885 1 1 1 0.319 15961

Auditor Turnover 0.041 0 0 0 0.198 15961

Auditor Tenure 11.418 9 5 15 7.935 15961

Auditor Special 0.283 0 0 1 0.451 15961

33

Table 3. Correlation

This table reports the Pearson correlation coefficients among variables for the sample. All variable definitions are defined in Appendix A. *, **, *** indicate statistical

significance at the 10%, 5%, and 1% levels, respectively.

Variable (1) (2) (3) (4) (5) (6) (7) (8) (9) (10) (11) (12) (13) (14) (15) (16)

(1) MW 1

(2) MW Count 0.686*** 1

(3) Raw CSR7 -0.023*** -0.024*** 1

(4) Raw CSR5 -0.030*** -0.027*** 0.949*** 1

(5) Adj. CSR7 -0.010 -0.012 0.947*** 0.868*** 1

(6) Adj. CSR5 -0.018** -0.016** 0.907*** 0.941*** 0.925*** 1

(7) Firm Size -0.089*** -0.057*** 0.179*** 0.279*** 0.121*** 0.199*** 1

(8) ROA -0.045*** -0.048*** 0.064*** 0.081*** 0.0499*** 0.066*** 0.237*** 1

(9) Sales Growth 0.017** 0.016** -0.023*** -0.041*** -0.022*** -0.037*** -0.096*** 0.019** 1

(10) Leverage -0.019** -0.002 -0.043*** -0.034*** -0.038*** -0.033*** 0.319*** -0.128*** -0.012 1

(11) Market-to-Book -0.007 -0.004 0.073*** 0.076*** 0.058*** 0.065*** -0.061*** 0.040*** 0.120*** -0.099*** 1

(12) Big4 -0.053*** -0.03*** 0.066*** 0.112*** 0.061*** 0.104*** 0.278*** 0.017** -0.052*** 0.073* 0.024*** 1

(13) Auditor Turnover 0.091*** 0.053*** -0.027*** -0.042*** -0.02** -0.035*** -0.080*** -0.0270** 0.043*** -0.005 -0.004 -0.141*** 1

(14) Auditor Tenure -0.077*** -0.054*** 0.134*** 0.179*** 0.103*** 0.142*** 0.308*** 0.076*** -0.132*** -0.001 -0.024*** 0.231*** -0.234*** 1

(15) Auditor Special -0.022*** -0.008 0.027*** 0.046*** 0.016** 0.029*** 0.143*** 0.008 -0.002 0.025*** 0.015* 0.222*** -0.047*** 0.065*** 1

(16) HHI 0.004 0.006 -0.061*** -0.055*** -0.063*** -0.063*** 0.112*** 0.083*** -0.052*** 0.025*** -0.021*** 0.010 0.001 0.025*** 0.025*** 1

34

Table 4.

Panel A: Corporate social responsibility and internal control weakness

This table reports the results of logistic regression and Poisson regression to examine whether a firm’s CSR activities

are related to material weaknesses under Section 404 of the SOX. The dependent variable is a dummy variable

taking a value of 1 if a firm reports a material weakness and, 0 otherwise in Panel A and is a count of material

weakness disclosures of a firm (MW Count) in Panel B. Raw CSR5 and Raw CSR7 represent raw scores of the 5 or

7 different dimensions of CSR activities, respectively. Adj. CSR5 and Adj. CSR7 are computed by dividing the

strengths and concerns of each of the 5 or 7 dimensions by its respective number of strengths and concerns and

subtracting the sum of adjusted total concern scores from the adjusted total strength scores. Firm Size is a natural

logarithm of total assets. ROA is return on assets. Sales Growth is a change in sales in year t from year t-1. Leverage

is a ratio of total debts to total assets. In this test, we consider five proxies for audit quality. BIG4 is an indicator

variable equals 1 if a firm is audited by a Big 4 audit firm and 0 otherwise. Auditor Turnover is an indicator variable

if there is an auditor turnover and 0 otherwise. Auditor Special is a dummy variable that is equal to 1 if a firm is

audited by a specialized auditor. An auditor is a specialist if it has the largest share of clients' total assets in the

industry (2-digt SIC code). For each independent variable, we report the coefficient estimate in row 1, z-stat in row

2, and marginal effect in italics in row 3.The marginal effect is the percent change in the conditional probability of

a material weakness report of a firm for a 1 % change in a continuous variable holding all other variables at their

means. For the dummy variable, marginal effect is the percent change in the conditional probability of a material

weakness report of a firm as the dummy variable switches from 0 to 1. Standard errors are robust to

heteroscedasticity and clustered at the firm level. *, **, *** indicate statistical significance at the 10%, 5%, and 1%

levels, respectively.

Dependent var. = MW

VARIABLES (1) (2) (3) (4) (5) (6) (7) (8)

Raw CSR5 -0.069*** -0.060**

(-2.639) (-2.286)

-0.002 -0.002

Raw CSR7 -0.088*** -0.083***

(-3.538) (-3.340)

-0.003 -0.003

Adj. CSR5 -0.298** -0.239*

(-2.292) (-1.824)

-0.010 -0.008

Adj. CSR7 -0.373*** -0.344***

(-3.157) (-2.876)

-0.012 -0.011

Firm Size -0.289*** -0.217*** -0.302*** -0.228*** -0.298*** -0.226*** -0.309*** -0.235***

(-6.972) (-5.198) (-7.449) (-5.531) (-7.353) (-5.499) (-7.751) (-5.772)

-0.010 -0.007 -0.010 -0.007 -0.010 -0.007 -0.010 -0.008 ROA -1.271*** -1.326*** -1.255*** -1.312*** -1.264*** -1.320*** -1.251*** -1.308***

(-4.843) (-5.124) (-4.788) (-5.079) (-4.825) (-5.107) (-4.782) (-5.070)

-0.043 -0.043 -0.042 -0.042 -0.043 -0.043 -0.042 -0.042

Sales Growth 0.019 -0.029 0.024 -0.024 0.021 -0.028 0.025 -0.024

(0.178) (-0.274) (0.223) (-0.225) (0.194) (-0.263) (0.228) (-0.225)

0.001 -0.001 0.001 -0.001 0.001 -0.001 0.001 -0.001

Leverage 0.378* 0.313 0.373 0.305 0.392* 0.328 0.388* 0.321

(1.654) (1.361) (1.625) (1.323) (1.721) (1.426) (1.699) (1.396)

0.013 0.010 0.012 0.010 0.013 0.011 0.013 0.010

Market-to-

Book

-0.022** -0.021** -0.022** -0.021** -0.022** -0.022** -0.022** -0.022**

(-2.283) (-2.175) (-2.274) (-2.147) (-2.327) (-2.222) (-2.327) (-2.203)

-0.001 -0.001 -0.001 -0.001 -0.001 -0.001 -0.001 -0.001

35

Big4 -0.291** -0.298** -0.288** -0.290**

(-2.192) (-2.237) (-2.164) (-2.180)

-0.010 -0.011 -0.010 -0.010

Auditor

Turnover

0.802*** 0.805*** 0.801*** 0.805***

(5.964) (5.978) (5.965) (5.987)

0.037 0.037 0.037 0.037

Auditor Tenure -0.023*** -0.022*** -0.023*** -0.023***

(-2.952) (-2.914) (-2.988) (-2.950)

-0.001 -0.001 -0.001 -0.001

Auditor Special -0.036 -0.039 -0.036 -0.038

(-0.338) (-0.368) (-0.339) (-0.363)

-0.001 -0.001 -0.001 -0.001

Year dummy Yes Yes Yes Yes Yes Yes Yes Yes

Ind. dummy Yes Yes Yes Yes Yes Yes Yes Yes

Constant -0.636** -0.664** -0.557* -0.600** -0.600** -0.625** -0.534* -0.577**

(-2.163) (-2.283) (-1.927) (-2.104) (-2.053) (-2.156) (-1.860) (-2.037)

Observations 15,961 15,961 15,961 15,961 15,961 15,961 15,961 15,961

Log likelihood -2830 -2789 -2826 -2784 -2832 -2790 -2829 -2787

Chi2 395.3 533.7 398.9 542.5 395.9 530.7 398 536.9

36

Table 4.

Panel B. Corporate social responsibility and internal control weakness: Number of material weakness

Dependent var. = MW Count

VARIABLES (1) (2) (3) (4) (5) (6) (7) (8)

Raw CSR5 -0.069*** -0.060**

(-2.639) (-2.286)

Raw CSR7 -0.088*** -0.083***

(-3.538) (-3.340)

Adj. CSR5 -0.298** -0.239*

(-2.292) (-1.824)

Adj. CSR7 -0.373*** -0.344***

(-3.157) (-2.876)

Firm Size -0.289*** -0.217*** -0.302*** -0.228*** -0.298*** -0.226*** -0.309*** -0.235***

(-6.972) (-5.198) (-7.449) (-5.531) (-7.353) (-5.499) (-7.751) (-5.772)

ROA -1.271*** -1.326*** -1.255*** -1.312*** -1.264*** -1.320*** -1.251*** -1.308***

(-4.843) (-5.124) (-4.788) (-5.079) (-4.825) (-5.107) (-4.782) (-5.070)

Sales Growth 0.019 -0.029 0.024 -0.024 0.021 -0.028 0.025 -0.024

(0.178) (-0.274) (0.223) (-0.225) (0.194) (-0.263) (0.228) (-0.225)

Leverage 0.378* 0.313 0.373 0.305 0.392* 0.328 0.388* 0.321

(1.654) (1.361) (1.625) (1.323) (1.721) (1.426) (1.699) (1.396)

Market-to-Book -0.022** -0.021** -0.022** -0.021** -0.022** -0.022** -0.022** -0.022**

(-2.283) (-2.175) (-2.274) (-2.147) (-2.327) (-2.222) (-2.327) (-2.203)

Big4 -0.291** -0.298** -0.288** -0.290**

(-2.192) (-2.237) (-2.164) (-2.180)

Auditor Turnover 0.802*** 0.805*** 0.801*** 0.805***

(5.964) (5.978) (5.965) (5.987)

Auditor Tenure -0.023*** -0.022*** -0.023*** -0.023***

(-2.952) (-2.914) (-2.988) (-2.950)

Auditor Special -0.036 -0.039 -0.036 -0.038

(-0.338) (-0.368) (-0.339) (-0.363)

Year dummy Yes Yes Yes Yes Yes Yes Yes Yes

Ind. dummy Yes Yes Yes Yes Yes Yes Yes Yes

Constant -0.636** -0.664** -0.557* -0.600** -0.600** -0.625** -0.534* -0.577**

(-2.163) (-2.283) (-1.927) (-2.104) (-2.053) (-2.156) (-1.860) (-2.037)

Observations 15,961 15,961 15,961 15,961 15,961 15,961 15,961 15,961

Log likelihood -2830 -2789 -2826 -2784 -2832 -2790 -2829 -2787

Chi2 395.3 533.7 398.9 542.5 395.9 530.7 398 536.9

37

Table 5. Corporate social responsibility and internal control weakness: Propensity score matched analysis

This table reports the results of univariate comparison and regressions using a propensity score matching procedure

to examine the effects of a firm’s CSR activities on the likelihood of material weaknesses disclosures under Section

404 of the SOX. The dependent variable is a dummy variable taking a value of 1 if a frim reports a material weakness

and, 0 otherwise in Panel A and is a count of material weakness disclosures of a firm (MW Count) in Panel B. Raw

CSR5 and Raw CSR7 represent raw scores of the 5 or 7 different dimensions of CSR activities, respectively. Adj.

CSR5 and Adj. CSR7 are computed by dividing the strengths and concerns of each of the 5 or 7 dimensions by its

respective number of strengths and concerns and subtracting a sum of the adjusted total concern scores from adjusted

total strength scores. Firm Size is a natural logarithm of total assets. ROA is return on assets. Sales Growth is the

change in sales in year t from year t-1. Leverage is a ratio of total debts to total assets. In this test, we consider five

proxies for audit quality. BIG4 is an indicator variable equal 1 if a firm is audited by a Big 4 audit firm, and 0

otherwise. Auditor Turnover is an indicator variable if there is an auditor turnover and 0 otherwise. Auditor Special

is a dummy variable equal to 1 if a firm is audited by a specialized auditor. An auditor is a specialist if it has the

largest share of clients' total assets in the industry (2-digt SIC code). For each independent variable, we report the

coefficient estimate in row 1, z-stat in row 2, and marginal effect in italics in row 3.The marginal effect is the percent

change in the conditional probability of a material weakness report of a firm for a 1 % change in a continuous

variable holding all other variables at their means. For the dummy variable, marginal effect is the percent change in

the conditional probability of a material weakness report of a firm as the dummy variable switches from 0 to 1.

Standard errors are robust to heteroscedasticity and clustered at the firm level. *, **, *** indicate statistical

significance at the 10%, 5%, and 1% levels, respectively.

Panel A: Univariate comparison of CSR scores between treated and control sample firms

VARIABLES Treated Control Mean Difference T-stat.

Raw CSR5 -0.596 -0.357 -0.239 -2.58***

Raw CSR7 -0.870 -0.536 -0.334 -3.37***

Adj. CSR5 -0.163 -0.114 -0.049 -3.04***

Adj. CSR7 -0.208 -0.142 -0.066 -3.56***

Panel B: Multivariate test: CSR and material weakness

Dependent var. = MW

VARIABLES (1) (2) (3) (4) (5) (6) (7) (8)

Raw CSR5 -0.097*** -0.095***

(-2.676) (-2.583)

-0.024 -0.024

Raw CSR7 -0.113*** -0.115***

(-3.336) (-3.355)

-0.028 -0.029

Adj. CSR5 -0.627*** -0.602***

(-2.948) (-2.792)

-0.157 -0.150

Adj. CSR7 -0.647*** -0.653***

(-3.426) (-3.387)

-0.162 -0.163

Firm Size -0.028 0.032 -0.053 0.010 -0.037 0.021 -0.069 -0.006

(-0.510) (0.549) (-0.983) (0.187) (-0.676) (0.378) (-1.278) (-0.105)

-0.007 0.008 -0.013 0.003 -0.009 0.005 -0.017 -0.001

ROA -0.578 -0.731* -0.552 -0.710* -0.561 -0.713* -0.531 -0.688*

(-1.473) (-1.841) (-1.407) (-1.786) (-1.433) (-1.800) (-1.354) (-1.733)

-0.144 -0.183* -0.138 -0.178 -0.140 -0.178 -0.133 -0.172

Sales Growth -0.126 -0.171 -0.118 -0.165 -0.124 -0.169 -0.118 -0.165

38

(-0.864) (-1.155) (-0.808) (-1.112) (-0.856) (-1.142) (-0.807) (-1.112)

-0.032 -0.043 -0.030 -0.041 -0.031 -0.042 -0.029 -0.041

Leverage 0.356 0.294 0.365 0.298 0.366 0.305 0.390 0.323

(1.095) (0.906) (1.115) (0.913) (1.127) (0.940) (1.193) (0.990)

0.089 0.074 0.091 0.075 0.091 0.076 0.097 0.081

Market-to-Book -0.023 -0.022 -0.023 -0.022 -0.023 -0.022 -0.024 -0.023

(-1.505) (-1.439) (-1.511) (-1.446) (-1.545) (-1.476) (-1.561) (-1.494)

-0.006 -0.005 -0.006 -0.005 -0.006 -0.006 -0.006 -0.006

Big4 -0.191 -0.217 -0.175 -0.200

(-1.024) (-1.160) (-0.938) (-1.073)

-0.048 -0.054 -0.044 -0.050

Auditor Turnover 0.421** 0.419** 0.415** 0.412**

(2.032) (2.012) (2.008) (1.986)

0.104 0.104 0.103 0.102

Auditor Tenure -0.011 -0.012 -0.011 -0.012

(-1.250) (-1.280) (-1.242) (-1.326)

-0.003 -0.003 -0.003 -0.003

Auditor Special -0.147 -0.146 -0.154 -0.154

(-1.038) (-1.028) (-1.088) (-1.087)

-0.037 -0.036 -0.039 -0.039

Year dummy Yes Yes Yes Yes Yes Yes Yes Yes

Ind. dummy Yes Yes Yes Yes Yes Yes Yes Yes

Constant 0.419 0.314 0.566 0.461 0.437 0.331 0.642 0.535

(1.027) (0.746) (1.428) (1.127) (1.080) (0.791) (1.629) (1.312)

Observations 1,534 1,534 1,534 1,534 1,534 1,534 1,534 1,534

Log likelihood -1021 -1014 -1019 -1011 -1020 -1013 -1018 -1010

Chi2 68.22 82.62 72.01 87.88 69.65 83.44 72.43 87.51

39

Panel C: Multivariate test: CSR and number of material weakness

Dependent var. = MW Count

VARIABLES (1) (2) (3) (4) (5) (6) (7) (8)

Raw CSR5 -0.092*** -0.089***

(-3.96) (-3.81)

Raw CSR7 -0.106*** -0.106***

(-4.21) (-4.13)

Adj. CSR5 -0.509*** -0.492***

(-3.62) (-3.47)

Adj. CSR7 -0.545*** -0.542***

(-4.02) (-3.95)

Firm Size 0.027 0.051 0.001 0.027 0.016 0.040 -0.012 0.014

(0.40) (0.83) (0.01) (0.46) (0.24) (0.66) (-0.19) (0.24)

ROA -0.942*** -0.980*** -0.913*** -0.953*** -0.918*** -0.957*** -0.885*** -0.926***

(-2.73) (-2.96) (-2.70) (-2.93) (-2.68) (-2.91) (-2.65) (-2.89)

Sales Growth 0.055 0.033 0.062 0.039 0.056 0.035 0.062 0.039

(0.37) (0.23) (0.42) (0.28) (0.38) (0.24) (0.42) (0.28)

Leverage 0.349 0.320 0.354 0.323 0.360 0.331 0.373 0.341

(1.19) (1.15) (1.24) (1.19) (1.25) (1.21) (1.32) (1.28)

Market-to-Book -0.010 -0.010 -0.010 -0.010 -0.011 -0.010 -0.011 -0.011

(-0.97) (-0.94) (-1.03) (-0.99) (-1.04) (-1.01) (-1.11) (-1.07)

Big4 -0.083 -0.103 -0.071 -0.089

(-0.57) (-0.71) (-0.49) (-0.61)

Auditor Turnover 0.022 0.020 0.016 0.013

(0.16) (0.15) (0.12) (0.10)

Auditor Tenure -0.009 -0.010 -0.010 -0.010

(-0.77) (-0.79) (-0.79) (-0.84)

Auditor Special -0.015 -0.015 -0.021 -0.021

(-0.12) (-0.12) (-0.16) (-0.16)

Year dummy Yes Yes Yes Yes Yes Yes Yes Yes

Ind. dummy Yes Yes Yes Yes Yes Yes Yes Yes

Constant 0.205 0.213 0.361 0.370 0.249 0.254 0.429 0.434

(0.65) (0.69) (1.17) (1.23) (0.81) (0.84) (1.42) (1.47)

Observations 1,534 1,534 1,534 1,534 1,534 1,534 1,534 1,534

Chi2 68.31 84.55 70.41 91.66 66.11 80.71 68.28 87.69

Log likelihood -2493 -2488 -2483 -2478 -2494 -2490 -2486 -2481

40

Table 6.

Panel A. Strengths and concerns of corporate social responsibility and internal control weakness

This table reports the results of logistic regression and Poisson regression to examine whether a firm’s CSR activities are

related to material weaknesses under Section 404 of the SOX. The dependent variable is a dummy variable taking a value

of 1 if a frim reports a material weakness and, 0 otherwise in Panel A and is the count of material weakness disclosures of

a firm (MW Count) in Panel B. Strenght5 and Strength7 represent the sum of the 5 or 7 different dimensions of CSR

strengths scores, respectively and Concerns5 and Concerns7 represent a sum of the 5 or 7 different dimensions of CSR

concerns scores, respectively. Adj. Strengths5, Adj. Strength7, Adj. Concerns5, and Adj. Concerns7 are computed by

adding the strengths and concerns of each of the 5 or 7 dimensions after dividing each score by its respective number of

strengths and concerns. Appendix A provides the definition of all the variables. For each independent variable, we report

the coefficient estimate in row 1, z-stat in row 2, and marginal effect in italics in row 3.The marginal effect is the percent

change in the conditional probability of a material weakness report of a firm for a 1 % change in a continuous variable

holding all other variables at their means. For the dummy variable, marginal effect is the percent change in the conditional

probability of a material weakness report of a firm as the dummy variable switches from 0 to 1. Standard errors are robust

to heteroscedasticity and clustered at the firm level. *, **, *** indicate statistical significance at the 10%, 5%, and 1%

levels, respectively.

Dependent var. = MW

VARIABLES (1) (2) (3) (4) (5) (6) (7) (8)

Strengths5 -0.049* -0.043

(-1.678) (-1.480)

-0.002* -0.001

Concerns5 0.098*** 0.085**

0.003*** 0.003**

(2.936) (2.505)

Strengths7 -0.037 -0.036

(-1.433) (-1.359)

-0.001 -0.001

Concerns7 0.144*** 0.136***

(5.038) (4.700)

0.005*** 0.004***

Adj. Strengths5 -0.394** -0.353*

(-2.035) (-1.810)

-0.013** -0.011*

Adj. Concerns5 0.231 0.157

(1.427) (0.960)

0.008 0.005

Adj. Strengths7 -0.244 -0.237

(-1.605) (-1.531)

-0.008 -0.008

Adj. Concerns7 0.468*** 0.423***

(3.469) (3.089)

0.016*** 0.014***

Firm Size -0.306*** -0.232*** -0.350*** -0.273*** -0.287*** -0.213*** -0.329*** -0.252***

(-8.260) (-5.943) (-9.391) (-6.952) (-7.749) (-5.447) (-8.935) (-6.463)

-0.010*** -0.008*** -0.012*** -0.009*** -0.010*** -0.007*** -0.011*** -0.008***

ROA -1.247*** -1.306*** -1.193*** -1.256*** -1.278*** -1.337*** -1.228*** -1.289***

(-5.008) (-5.227) (-4.803) (-5.034) (-5.130) (-5.345) (-4.939) (-5.164)

-0.042*** -0.042*** -0.040*** -0.040*** -0.043*** -0.043*** -0.041*** -0.042***

Sales Growth 0.021 -0.027 0.028 -0.018 0.020 -0.030 0.026 -0.022

(0.202) (-0.262) (0.269) (-0.175) (0.190) (-0.288) (0.252) (-0.211)

0.001 -0.001 0.001 -0.001 0.001 -0.001 0.001 -0.001

Leverage 0.397** 0.330 0.426** 0.358* 0.380* 0.312 0.414** 0.343*

41

(1.996) (1.635) (2.146) (1.779) (1.906) (1.547) (2.081) (1.702)

0.013** 0.011 0.014** 0.011* 0.013* 0.010 0.014** 0.011*

Market-to-Book -0.022** -0.022** -0.023** -0.022** -0.022** -0.021** -0.023** -0.022**

(-2.343) (-2.246) (-2.435) (-2.323) (-2.303) (-2.206) (-2.397) (-2.282)

-0.001** -0.001** -0.001** -0.001** -0.001** -0.001** -0.001** -0.001**

Big4 -0.284** -0.277** -0.295*** -0.281**

(-2.557) (-2.499) (-2.655) (-2.533)

-0.010** -0.010** -0.011** -0.010**

Auditor

Turnover

0.800*** 0.799*** 0.803*** 0.803***

(6.022) (6.005) (6.055) (6.046)

0.037*** 0.037*** 0.037*** 0.037***

Auditor Tenure -0.023*** -0.023*** -0.023*** -0.023***

(-3.590) (-3.592) (-3.565) (-3.598)

-0.001*** -0.001*** -0.001*** -0.001***

Auditor Special -0.039 -0.048 -0.033 -0.042

(-0.425) (-0.523) (-0.361) (-0.454)

-0.001 -0.002 -0.001 -0.001

Year dummy Yes Yes Yes Yes Yes Yes Yes Yes

Ind. dummy Yes Yes Yes Yes Yes Yes Yes Yes

Constant -0.560** -0.604** -0.343 -0.408 -0.647** -0.678*** -0.458* -0.518**

(-2.189) (-2.339) (-1.356) (-1.600) (-2.532) (-2.629) (-1.838) (-2.064)

Observations 15,961 15,961 15,961 15,961 15,961 15,961 15,961 15,961

Log likelihood -2829 -2788 -2822 -2781 -2832 -2790 -2828 -2787

Chi2 494 576.4 508.1 590.2 489.6 572.8 496.5 579.3

42

Panel B. Strength and weakness of corporate social responsibility and internal control weakness: Number of

material weakness

Dependent var. = MW Count

VARIABLES (1) (2) (3) (4) (5) (6) (7) (8)

Strengths5 -0.114*** -0.107***

(-5.28) (-4.97)

Concerns5 0.102*** 0.089***

(4.68) (4.06)

Strengths7 -0.087*** -0.084***

(-4.62) (-4.44)

Concerns7 0.166*** 0.158***

(9.06) (8.53)

Adj. Strengths5 -0.827*** -0.781***

(-5.65) (-5.32)

Adj. Concerns5 0.211** 0.143

(1.96) (1.32)

Adj. Strengths7 -0.494*** -0.478***

(-4.48) (-4.30)

Adj. Concerns7 0.581*** 0.536***

(6.68) (6.10)

Firm Size -0.213*** -0.150*** -0.274*** -0.209*** -0.193*** -0.130*** -0.259*** -0.193***

(-8.82) (-5.92) (-11.32) (-8.17) (-8.00) (-5.13) (-10.78) (-7.60)

ROA -1.678*** -1.710*** -1.582*** -1.621*** -1.724*** -1.753*** -1.624*** -1.660***

(-11.03) (-11.34) (-10.45) (-10.79) (-11.30) (-11.60) (-10.70) (-11.02)

Sales Growth 0.102 0.064 0.108* 0.073 0.101 0.061 0.108* 0.071

(1.60) (1.01) (1.70) (1.15) (1.59) (0.97) (1.71) (1.13)

Leverage 0.496*** 0.449*** 0.526*** 0.476*** 0.487*** 0.439*** 0.527*** 0.476***

(4.00) (3.59) (4.26) (3.83) (3.92) (3.50) (4.27) (3.82)

Market-to-Book -0.016*** -0.016*** -0.017*** -0.017*** -0.016*** -0.016*** -0.017*** -0.017***

(-2.76) (-2.78) (-2.95) (-2.97) (-2.73) (-2.74) (-2.94) (-2.94)

Big4 -0.251*** -0.242*** -0.263*** -0.242***

(-3.44) (-3.32) (-3.60) (-3.31)

Auditor Turnover 0.528*** 0.522*** 0.534*** 0.529***

(6.10) (6.03) (6.17) (6.11)

Auditor Tenure -0.024*** -0.025*** -0.024*** -0.025***

(-5.76) (-5.82) (-5.72) (-5.85)

Auditor Special 0.049 0.035 0.055 0.041

(0.82) (0.60) (0.93) (0.70)

Year dummy Yes Yes Yes Yes Yes Yes Yes Yes

Ind. dummy Yes Yes Yes Yes Yes Yes Yes Yes

Constant -0.230 -0.229 0.080 0.057 -0.312* -0.299* -0.010 -0.029

(-1.39) (-1.38) (0.49) (0.35) (-1.89) (-1.80) (-0.06) (-0.18)

Observations 15,961 15,961 15,961 15,961 15,961 15,961 15,961 15,961

chi2 1219 1345 1260 1384 1210 1338 1227 1354

43

Table 7. Corporate social responsibility and internal control weakness: By individual CSR dimensions

This table reports the results of logistic regression and Poisson regression to examine whether a firm’s CSR activities

are related to material weaknesses under Section 404 of the SOX. The dependent variable is a dummy variable

taking a value of 1 if a firm reports a material weakness and, 0 otherwise in Panel A and is the count of material

weakness disclosures of a firm (MW Count) in Panel B. Raw CSR scores for each dimension (community,

corporate governance, diversity, employee relations, environment, human rights, and products) is are

computed by subtracting its concern score from its respective strength score. Appendix A provides the definition of

all the variables. For each independent variable, we report the coefficient estimate in row 1, z-stat in row 2, and

marginal effect in italics in row 3.The marginal effect is the percent change in the conditional probability of a

material weakness report of a firm for a 1 % change in a continuous variable holding all other variables at their

means. For a dummy variable, marginal effect is the percentage change in the conditional probability of a material

weakness report of a firm as the dummy variable switches from 0 to 1. Standard errors are robust to

heteroscedasticity and clustered at the firm level. *, **, *** indicate statistical significance at the 10%, 5%, and 1%

levels, respectively Dependent var. = MW

VARIABLES (1) (2) (3) (4) (5) (6) (7)

CSR-Com. -0.102

(-0.713)

-0.003

CSR-Gov. -0.246***

(-3.009)

-0.008

CSR-Div. 0.049

(1.089)

0.002

CSR-Emp. -

0.254***

(-4.777)

-0.008

CSR-Env. -0.095

(-1.311)

-0.003

CSR-Hum. -0.344**

(-2.075)

-0.011

CSR-Pro. -0.148

(-1.365)

-0.005

Firm Size -0.231*** -0.276*** -0.248*** -

0.224***

-0.234*** -0.243*** -0.247***

(-5.584) (-6.780) (-5.817) (-5.493) (-5.754) (-5.972) (-5.997)

-0.008 -0.009 -0.008 -0.007 -0.008 -0.008 -0.008

ROA -1.327*** -1.288*** -1.320*** -

1.286***

-1.329*** -1.317*** -1.324***

(-5.120) (-4.974) (-5.087) (-4.975) (-5.118) (-5.081) (-5.120)

-0.043 -0.041 -0.043 -0.041 -0.043 -0.043 -0.043

Sales Growth -0.030 -0.014 -0.028 -0.030 -0.028 -0.031 -0.025

(-0.279) (-0.131) (-0.265) (-0.283) (-0.267) (-0.289) (-0.238)

-0.001 -0.000 -0.001 -0.001 -0.001 -0.001 -0.001

Leverage 0.346 0.352 0.369 0.304 0.350 0.373 0.349

(1.500) (1.532) (1.596) (1.312) (1.520) (1.619) (1.520)

44

0.011 0.011 0.012 0.010 0.011 0.012 0.011

Market-to-Book -0.022** -0.023** -0.023** -0.022** -0.022** -0.023** -0.023**

(-2.284) (-2.322) (-2.368) (-2.241) (-2.290) (-2.330) (-2.304)

-0.001 -0.001 -0.001 -0.001 -0.001 -0.001 -0.001

Big4 -0.296** -0.323** -0.297** -0.299** -0.295** -0.291** -0.285**

(-2.234) (-2.434) (-2.232) (-2.245) (-2.225) (-2.192) (-2.145)

-0.011 -0.012 -0.011 -0.011 -0.011 -0.011 -0.010

Auditor Turnover 0.800*** 0.808*** 0.798*** 0.798*** 0.800*** 0.803*** 0.800***

(5.957) (5.987) (5.942) (5.907) (5.954) (5.968) (5.959)

0.037 0.037 0.037 0.037 0.037 0.037 0.037

Auditor Tenure -0.023*** -0.024*** -0.024*** -

0.023***

-0.023*** -0.024*** -0.023***

(-3.064) (-3.081) (-3.139) (-2.974) (-3.075) (-3.115) (-3.058)

-0.001 -0.001 -0.001 -0.001 -0.001 -0.001 -0.001

Auditor Special -0.033 -0.038 -0.034 -0.035 -0.035 -0.035 -0.039

(-0.313) (-0.359) (-0.327) (-0.336) (-0.328) (-0.333) (-0.366)

-0.001 -0.001 -0.001 -0.001 -0.001 -0.001 -0.001

Year dummy Yes Yes Yes Yes Yes Yes Yes

Ind. dummy Yes Yes Yes Yes Yes Yes Yes

Constant -0.549* -0.232 -0.423 -0.614** -0.530* -0.489* -0.469*

(-1.925) (-0.843) (-1.430) (-2.191) (-1.895) (-1.753) (-1.690)

Observations 15,961 15,961 15,961 15,961 15,961 15,961 15,961

Log likelihood -2792 -2784 -2791 -2779 -2791 -2791 -2791

Chi2 517.6 531.1 525.4 545.4 521.8 519.4 516.5

45

Table 8. Corporate social responsibility and internal control weakness: Two stage regressions

This table provides the results of two-stage least square (2SLS) regressions of CSR activities on the likelihood of

material weaknesses disclosures under Section 404 of the SOX We use a product market competition measure, the

Herfindahl--Hirschman index (HHI) based a firm’s annual sales using 2-digit SIC code industry classification, as

the instrument for CSR scores in the analyses. The dependent variable is a dummy variable taking a value of 1 if a

firm reports a material weakness and, 0 otherwise. Appendix A provides the definition of all the variables. For each

independent variable, we report the coefficient estimate in row 1, z-stat in row 2, and marginal effect in italics in

row 3.The marginal effect is the percent change in the conditional probability of a material weakness report of a

firm for a 1 % change in a continuous variable holding all other variables at their means. For the dummy variable,

marginal effect is the percentage change in the conditional probability of a material weakness report of a firm as the

dummy variable switches from 0 to 1. Standard errors are robust to heteroscedasticity and clustered at the firm level.

*, **, *** indicate statistical significance at the 10%, 5%, and 1% levels, respectively.

1st Stage 2nd Stage 1st Stage 2nd Stage 1st Stage 2nd Stage 1st Stage 2nd Stage

VARIABLES Raw

CSR5

MW Raw

CSR7

MW Adj.

CSR5

MW Adj.

CSR7

MW

(1) (2) (3) (4) (5) (6) (7) (8)

Raw CSR5 -0.153**

(-2.047)

Raw CSR7 -0.150**

(-2.125)

Adj. CSR5 -0.805**

(-1.994)

Adj. CSR7 -0.750**

(-2.069)

Firm Size 0.453*** -0.032 0.324*** -0.053* 0.057*** -0.053* 0.042*** -0.066**

(33.888) (-0.776) (21.565) (-1.663) (22.750) (-1.690) (13.970) (-2.552)

ROA -0.153 -0.311*** 0.043 -0.279*** 0.008 -0.280*** 0.031 -0.259**

(-1.241) (-2.909) (0.308) (-2.597) (0.339) (-2.609) (1.112) (-2.389)

Sales Growth -0.103** 0.005 -0.060 0.012 -0.024*** 0.001 -0.018 0.006

(-2.106) (0.114) (-1.085) (0.277) (-2.594) (0.014) (-1.642) (0.141)

Leverage -1.292*** -0.179 -1.108*** -0.147 -0.179*** -0.129 -0.165*** -0.108

(-15.131) (-1.384) (-11.560) (-1.263) (-11.159) (-1.150) (-8.478) (-1.044)

Market-to-

Book

0.049*** 0.000 0.049*** 0.000 0.008*** -0.001 0.008*** -0.001

(11.233) (0.066) (9.909) (0.025) (9.105) (-0.156) (7.613) (-0.216)

Big4 0.117** -0.027 0.000 -0.044 0.049*** -0.006 0.027** -0.024

(2.022) (-0.519) (0.007) (-0.876) (4.497) (-0.101) (2.068) (-0.462)

Auditor

Turnover

0.054 0.439*** 0.095 0.441*** 0.008 0.434*** 0.021 0.438***

(0.607) (6.394) (0.952) (6.431) (0.457) (6.271) (1.027) (6.323)

Auditor Tenure 0.025*** -0.009** 0.024*** -0.009** 0.004*** -0.009*** 0.004*** -0.009***

(10.509) (-2.377) (9.111) (-2.441) (8.452) (-2.698) (7.203) (-2.673)

Auditor Special -0.014 -0.017 -0.014 -0.017 -0.009 -0.022 -0.009 -0.021

(-0.360) (-0.422) (-0.320) (-0.423) (-1.255) (-0.553) (-0.990) (-0.534)

HHI -1.690*** -1.742*** -0.309*** -0.330***

(-11.446) (-10.512) (-11.128) (-9.821)

Constant -3.474*** -1.299*** -2.833*** -1.181*** -0.556*** -1.218*** -0.495*** -1.130***

(-38.608) (-5.355) (-28.048) (-6.456) (-32.888) (-5.863) (-24.159) (-7.117)

Observations 15,961 15,961 15,961 15,961 15,961 15,961 15,961 15,961

Chi2 283.2 283.2 292.2 292.2 286.8 286.8 299.5 299.5

46

Table 9. Corporate social responsibility and internal control weakness: Characteristics of the board of

directors and CEO

This table reports the results of a logistic regression to examine whether a firm’s CSR activities are related to material

weaknesses under Section 404 of the SOX including board and CEO characteristics in the analyses. The dependent

variable (MW) is a dummy variable taking a value of 1 if a firm reports a material weakness and, 0 otherwise. The

Appendix A provides the definition of all variables. A natural logarithm of a number of board members (Board Size),

a percent of independent board members (Board Indep.), and percent of female board members (Female Director)

are included to control for board characteristics, and age of CEO (CEO Age), tenure period of CEO (CEO Tenure),

and a female CEO indicator (Female CEO) are used to control for CEO characteristics. For each independent

variable, we report the coefficient estimate in row 1, z-stat in row 2, and marginal effect in italics in row3.The

marginal effect is the percent change in the conditional probability of a material weakness report of a firm for a 1 %

change in a continuous variable holding all other variables at their means. For the dummy variable, marginal effect

is the percentage change in the conditional probability of a material weakness report of a as the dummy variable

switches from 0 to 1. Standard errors are robust to heteroscedasticity and clustered at the firm level. *, **, ***

indicate statistical significance at the 10%, 5%, and 1% levels, respectively.

Dependent var. = MW

VARIABLES (1) (2) (3) (4) (5) (6) (7) (8)

Raw CSR5 -0.078* -0.071

(-1.773) (-1.597)

-0.001 -0.001

Raw CSR7 -0.118*** -0.114***

(-2.862) (-2.743)

-0.002 -0.002

Adj. CSR5 -0.457* -0.397

(-1.792) (-1.545)

-0.008 -0.007

Adj. CSR7 -0.578*** -0.544**

(-2.590) (-2.428)

-0.010 -0.009

Firm Size -0.328*** -0.282*** -0.357*** -0.310*** -0.342*** -0.294*** -0.374*** -0.325***

(-4.148) (-3.515) (-4.476) (-3.825) (-4.334) (-3.678) (-4.635) (-3.971)

-0.006 -0.005 -0.006 -0.005 -0.006 -0.005 -0.007 -0.006

ROA -3.933*** -3.960*** -3.902*** -3.933*** -3.933*** -3.965*** -3.908*** -3.949***

(-5.332) (-5.261) (-5.255) (-5.186) (-5.332) (-5.269) (-5.273) (-5.219)

-0.072 -0.070 -0.070 -0.068 -0.072 -0.070 -0.070 -0.069

Sales Growth 0.047 -0.004 0.054 0.007 0.055 0.004 0.062 0.016

(0.138) (-0.013) (0.157) (0.021) (0.161) (0.012) (0.180) (0.046)

0.001 -0.000 0.001 0.000 0.001 0.000 0.001 0.000

Leverage -0.483 -0.513 -0.516 -0.552 -0.471 -0.498 -0.486 -0.518

(-0.916) (-0.961) (-0.979) (-1.034) (-0.894) (-0.935) (-0.922) (-0.972)

-0.009 -0.009 -0.009 -0.009 -0.009 -0.009 -0.009 -0.009

Market-to-

Book

-0.098*** -0.101*** -0.098*** -0.101*** -0.097*** -0.101*** -0.097*** -0.101***

(-3.491) (-3.571) (-3.484) (-3.554) (-3.488) (-3.569) (-3.499) (-3.565)

-0.002 -0.002 -0.002 -0.002 -0.002 -0.002 -0.002 -0.002

Big4 -0.351 -0.354 -0.348 -0.353

(-1.179) (-1.188) (-1.168) (-1.186)

-0.007 -0.007 -0.007 -0.007

Auditor

Turnover

0.801*** 0.793*** 0.796*** 0.788***

(2.635) (2.608) (2.616) (2.591)

0.021 0.020 0.021* 0.020

47

Auditor Tenure -0.017 -0.017 -0.017 -0.017

(-1.538) (-1.551) (-1.530) (-1.544)

-0.000 -0.000 -0.000 -0.000

Audit Special -0.195 -0.192 -0.197 -0.196

(-1.087) (-1.069) (-1.100) (-1.092)

-0.003 -0.003 -0.003 -0.003

Board Size 0.061 0.125 0.082 0.150 0.069 0.131 0.085 0.154

(0.149) (0.305) (0.202) (0.367) (0.169) (0.319) (0.210) (0.376)

0.001 0.002 0.001 0.003 0.001 0.002 0.002 0.003

Board Indep. -0.001 -0.000 -0.002 -0.001 -0.001 -0.000 -0.002 -0.001

(-0.214) (-0.048) (-0.311) (-0.135) (-0.219) (-0.052) (-0.322) (-0.146)

-0.000 -0.000 -0.000 -0.000 -0.000 -0.000 -0.000 -0.000

Female

Director

0.023*** 0.024*** 0.025*** 0.027*** 0.023*** 0.024*** 0.023*** 0.025***

(2.599) (2.762) (2.862) (3.052) (2.585) (2.730) (2.719) (2.900)

-0.000 -0.000 -0.000 -0.000 -0.000 -0.000 -0.000 -0.000

CEO Age -0.028** -0.027** -0.029** -0.028** -0.028** -0.027** -0.029** -0.028**

(-2.402) (-2.305) (-2.449) (-2.340) (-2.408) (-2.310) (-2.448) (-2.342)

-0.001 -0.000 -0.001 -0.000 -0.001 -0.000 -0.001 -0.000

CEO Tenure 0.011 0.010 0.012 0.011 0.011 0.010 0.012 0.011

(1.070) (0.905) (1.190) (1.027) (1.072) (0.906) (1.178) (1.014)

0.000 0.000 0.000 0.000 0.000 0.000 0.000 0.000

Female CEO 0.237 0.216 0.253 0.232 0.226 0.206 0.234 0.214

(0.898) (0.812) (0.955) (0.869) (0.858) (0.772) (0.887) (0.804)

0.005 0.004 0.005 0.004 0.005 0.004 0.005 0.004

Year dummy Yes Yes Yes Yes Yes Yes Yes Yes

Ind. Dummy Yes Yes Yes Yes Yes Yes Yes Yes

Constant 1.801* 1.779* 1.942* 1.897* 1.861* 1.837* 2.038* 1.987*

(1.689) (1.650) (1.824) (1.764) (1.751) (1.708) (1.916) (1.850)

Observations 5,427 5,427 5,427 5,427 5,427 5,427 5,427 5,427

Log likelihood -718.8 -709.5 -716.2 -706.9 -718.8 -709.6 -717 -707.8

Chi2 242.5 261.1 247.7 266.3 242.5 260.9 246 264.5


Recommended