Corporate Transformational Leadership's Effect on Financial Performance Eyal Eckhaus Ariel University Transformational leadership (TL) has been described as a preferred leadership style, however, its frequently used measurement tool has been often criticized. Furthermore, only few empirical studies have examined the relationship between TL and organization’s financial performance. Using a unique approach of text mining to measure and identify TL, this is the first study to show a statistical significant relationship between TL and stock price, while providing evidence that TL may change over time and be manifested with a different rate. INTRODUCTION Leadership has always been one of the most keenly-observed business-related phenomena (Burns, 1978, p. 2), and has been studied over the years using different approaches. As it became evident that leaders do not possess identical traits or attributes, the study of leadership began to focus on the behavior of leaders (Peters, 1997). One of the most common concepts used to distinguish leadership styles is that of transformational-transactional leadership, which was first introduced in the 1970’s (Bass, 1985, 1990, 1996; Bass & Avolio, 1994a, 1994b; Burns, 1978; Downton, 1973). The transformational leader was defined as one who serves as a role model for followers, demonstrates an ability to motivate, inspire, and stimulate followers to be creative and innovative, and who shows genuine concern for each follower (Bass & Avolio, 1994a; Dvir & Shamir, 2003; Garcia- Morales, Matias-Reche, & Hurtado-Torres, 2008; Stoker, Grutterink, & Kolk, 2012; Warrick, 2011). The transformational leaders challenge the way followers think, to enable them to be more creative in their problem-solving endeavors (Burns, 1978). In today’s business environment, organizations need to be able to adapt quickly to change, in order to survive (Andreescu & Mircea, 2009; McKnight, 2013). Given that change is depicted in terms of process and content, transformational leadership (TL) is better suited to address these aspects, and hence it is emphasized more in the current literature (Burke & Litwin, 1992). However, some studies critic TL because of the lack of clear conceptual definition and the dimensions that form TL (Van Knippenberg & Sitkin, 2013). Furthermore, the most frequently used measurement tools, specifically the Multifactor Leadership Questionnaire (MLQ; e.g. (Bass & Avolio, 1995), has been criticized against its poor dimensionality and that it fails to achieve empirical distinctiveness from other aspects of leadership (Bycio, Hackett, & Allen, 1995; Tepper & Percy, 1994; Tracey & Hinkin, 1998; Yammarino & Dubinsky, 1994), and that the MLQ’s measurement includes subjective perceptions and evaluations of leadership (Van Knippenberg & Sitkin, 2013), therefore “there is no basis for the continued use of the MLQ in leadership research” (page 44). This study addresses the latter critic by identifying TL using a unique approach of language data mining construct, which provides an objective measure of TL, instead of the traditional questionnaires. 90 Journal of Leadership, Accountability and Ethics Vol. 13(1) 2016
Transcript
Corporate Transformational Leadership's Effect on Financial Performance
Eyal Eckhaus Ariel University
Transformational leadership (TL) has been described as a preferred leadership style, however, its frequently used measurement tool has been often criticized. Furthermore, only few empirical studies have examined the relationship between TL and organization’s financial performance. Using a unique approach of text mining to measure and identify TL, this is the first study to show a statistical significant relationship between TL and stock price, while providing evidence that TL may change over time and be manifested with a different rate. INTRODUCTION
Leadership has always been one of the most keenly-observed business-related phenomena (Burns, 1978, p. 2), and has been studied over the years using different approaches. As it became evident that leaders do not possess identical traits or attributes, the study of leadership began to focus on the behavior of leaders (Peters, 1997). One of the most common concepts used to distinguish leadership styles is that of transformational-transactional leadership, which was first introduced in the 1970’s (Bass, 1985, 1990, 1996; Bass & Avolio, 1994a, 1994b; Burns, 1978; Downton, 1973).
The transformational leader was defined as one who serves as a role model for followers, demonstrates an ability to motivate, inspire, and stimulate followers to be creative and innovative, and who shows genuine concern for each follower (Bass & Avolio, 1994a; Dvir & Shamir, 2003; Garcia-Morales, Matias-Reche, & Hurtado-Torres, 2008; Stoker, Grutterink, & Kolk, 2012; Warrick, 2011). The transformational leaders challenge the way followers think, to enable them to be more creative in their problem-solving endeavors (Burns, 1978). In today’s business environment, organizations need to be able to adapt quickly to change, in order to survive (Andreescu & Mircea, 2009; McKnight, 2013). Given that change is depicted in terms of process and content, transformational leadership (TL) is better suited to address these aspects, and hence it is emphasized more in the current literature (Burke & Litwin, 1992).
However, some studies critic TL because of the lack of clear conceptual definition and the dimensions that form TL (Van Knippenberg & Sitkin, 2013). Furthermore, the most frequently used measurement tools, specifically the Multifactor Leadership Questionnaire (MLQ; e.g. (Bass & Avolio, 1995), has been criticized against its poor dimensionality and that it fails to achieve empirical distinctiveness from other aspects of leadership (Bycio, Hackett, & Allen, 1995; Tepper & Percy, 1994; Tracey & Hinkin, 1998; Yammarino & Dubinsky, 1994), and that the MLQ’s measurement includes subjective perceptions and evaluations of leadership (Van Knippenberg & Sitkin, 2013), therefore “there is no basis for the continued use of the MLQ in leadership research” (page 44). This study addresses the latter critic by identifying TL using a unique approach of language data mining construct, which provides an objective measure of TL, instead of the traditional questionnaires.
90 Journal of Leadership, Accountability and Ethics Vol. 13(1) 2016
Among the characteristics of TL leaders, Charisma is a key and dominant component (Bass, 1985, 1990; House, 1977; Yukl, 1989), and at times scholars use the terms charismatic leadership and transformational leadership interchangeably (Bass, 1985; Behling & McFillen, 1996; Shamir, 1991). However, there are very few empirical studies that examine the relationship between TL and organizational performance. Flynn & Staw (2004) proved statistically that the stock of companies headed by charismatic leaders were appreciated more than the stock of comparable companies, even after differences in corporate performance were controlled. Hancott (2005) measured the rate of TL in the 100 largest public companies in Canada using the MLQ questionnaire. He found no relationship between TL score and organizational performance measured by stock price change. This can be due to the fact that as questionnaires may measure TL leadership style existence, they are subjective and thus may have not provided an accurate TL rating for investigating a statistical relationship with stock price. Moreover, if the rate of TL may change over time, assessing its relationship for an entire time period without examining sub periods may be the cause for no direct relationship between TL rating and stock change. Conversely, attributed charisma did show a statistically significant correlation to stock price change when tenure was the dependent variable for the subset of CEOs with tenure greater than or equal to 5 years.
This study extends Hancott (2005)’s study in examining the relationship between TL rating and stock performance, and demonstrate that TL relates to the organization’s financial performance, measured by the stock change. The study adds to the literature on TL by providing evidence that TL may change over time and be manifested at a different rate, while providing a new framework for measuring the rate of TL manifestation.
Instead of using the criticized MLQ tool to assess TL, this study assesses TL intensity by identifying actual textual expressions of TL. Both online and offline textual expressions have been explored in studies to predict financial performance. Das and Chen (2007) focused on capturing the emotive aspect in the text rather than on the actual content, and found a relationship with stock values. In their research, they used a voting mechanism in conjunction with additional classifiers such as a Support Vector Machine (SVM), to improve accuracy. Tetlock, Saar-Tsechansky, and Macskassy (2008) examined whether language could be used to predict an individual firm's accounting earnings and stock returns, and found that negative words in a firm's news stories did forecast earnings. Davis et al. (2006) examined the relationships between earnings, returns, and qualitative aspects of language and found that when the reports published in earnings press releases described the firm's expected future performance using optimistic or pessimistic language, the market responded accordingly. Feng (2006) examined stock market efficiency with respect to the language in the texts of annual reports and found that incorporating the words risk and uncertainty in firms' annual reports predicted low annual earnings and stock returns. Schumaker and Chen (2009) examined the role of language in financial news articles by referring to three different textual representations, Bag of Words, Noun Phrases, and Named Entities, and whether these could predict discrete stock prices twenty minutes after an article's release. Using a SVM, they showed that their model had a statistically significant impact on predicting future stock prices, as compared to linear regression. Sehgal and Song (2007) described a neural network system that scans financial message boards and extracts sentiments expressed by individual authors. The system then learned the correlation between the sentiments and stock values, in order to make future predictions about stock values. They found that stock performance and its recent web sentiments were also closely correlated. Chua, Milosavljevic et al. (2009) presented a sentiment prediction engine for classifying investor sentiment, i.e., whether to buy, sell or hold stock positions, based on messages posted on Internet stock forums. They drew their language classifications from related areas of sentiment-classification research, in which sentiment or opinion analysis was applied to the study of political blogs and product reviews. As email is the most common and comparatively the most efficient means of exchanging information in today's world (Khan, Mizan, Hasan, & Sprague, 2014), the current study used email data mining to explore TL expressions. For this purpose the Enron Corp. email corpus was used.
The Enron corpus is known as an excellent corpus for research because it contains modern conversational language (Lindsey, Veksler, Grintsvayg, & Gray, 2007); indeed, it has been used extensively for research involving data mining, text analysis, and natural language processing (Wilson &
Journal of Leadership, Accountability and Ethics Vol. 13(1) 2016 91
Banzhaf, 2009). Doherty (2014) used text mining in a subset of Enron's email corpus, in an attempt to predict stock prices, but to no avail. Doherty examined 125,000 emails of 160 Enron executives, testing the prediction capacity of email negative sentiment using a Naive Bayes classifier trained on a corpus of movie review sentiments. No relationship was found between aggregate email sentiment and either aggregate email volume or stock price movements.
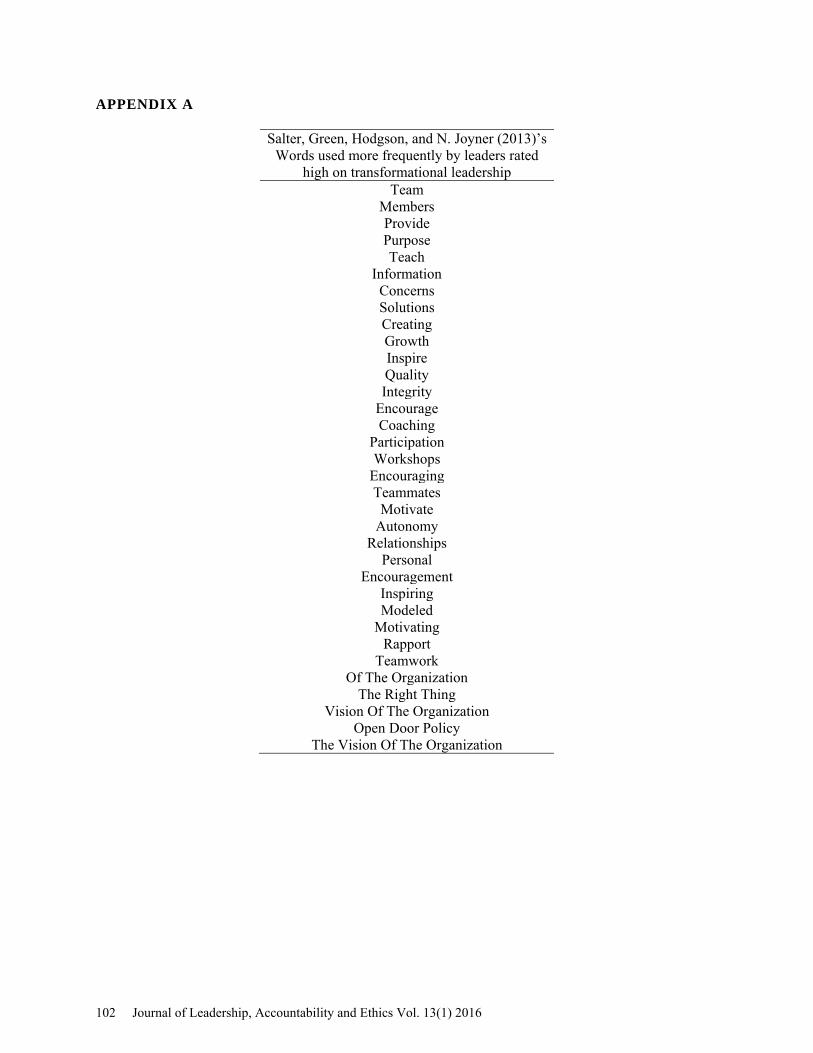
For the purpose of exploring textual TL representations, the current study relied on the study by Salter, Green, Hodgson, and N. Joyner (2013), which statistically identified a list of words used with significant frequency by leaders who rated high on TL (Appendix A). A model is then developed to predict a stock price estimate, based on the transformational expressions found in the Enron corpus.
Enron was formed in 1985 and within 15 years it became one of the biggest companies in revenue in the U.S., by buying electricity from generators and selling it to consumers (Palus, Bródka, & Kazienko, 2011). One of the strongest traits of TL is the ability to focus attention on followers needs (Washington, 2013); that Enron did so was acknowledged when it was featured among Fortune's "100 best companies to work for in America" (Petra & Loukatos, 2009). Furthermore, TL can influence organizational creativity and innovation both directly and indirectly (Hu, Gu, & Chen, 2013), and Enron was named by Fortune magazine as "America's most innovative company" from 1996 to 2000 (Petra & Loukatos, 2009). Therefore, it is safe to assume that TL was manifested in this company to a fairly conspicuous degree. However, many researchers have critiqued Enron’s leadership, claiming there is much evidence that Enron’s leaders aimed at creating an aura of charisma around themselves, engaging in dramatic forms of self-promotion (Tourish & Vatcha, 2005). On 22 October 2001, the share price of Enron decreased to $20.65, down by $5.40 in one day, after the announcement made by the Securities and Exchange Commission (SEC) that it was investigating several suspicious deals struck by Enron, characterizing them as “some of the most opaque transactions with insiders ever seen” (Norris, 2001). In May 2002, in an unprecedented action, the Federal Energy Regulatory Commission (FERC) publicly released a corpus of actual emails from 158 employees - including those involving top executives, such as Enron CEOs, Kenneth Lay and Jeffrey Skilling. The FERC took this unusual step in order to improve the public understanding of the various reasons for its investigation of Enron. Since then, some emails specific to certain individuals have been removed for privacy and legal reasons (Diesner, Frantz, & Carley, 2005). The false income statements from Enron's CEOs (Brewer, 2007) suggest low levels of corporate transparency, which in turn is associated with a greater impact of investors' sentiment-related effects on stock prices (Firth, Wang, & Wong, 2013). This strengthens the likelihood of finding a relationship between Enron managers’ sentiments and stock prices.
Fitzgerald and Schutte (2010) found that an intervention aimed at increasing self-efficacy can increase TL. Self-efficacy is the belief that one can successfully pursue a set of behaviors in order to bring about a efficient outcome. Hence, it may be assumed that the announcement of the SEC’s investigation led to job uncertainty among Enron's senior management, undoubtedly providing sufficient motivation and impetus for them to start honing their self-efficacy, and thus also serving as a vehicle for increasing TL. Thus, it was hypothesized that subsequent to the SEC’s investigation announcement there would be a sharp rise in the manifestation of transformational leadership expressions. Hence, it was decided to count transformational expressions in emails sent from 22 October 2001 onwards, for investigating the relationship of TL and stock performance in this specific period. Conversely, the corruption and fraudulent actions led by some Enron seniors stand against TL values, thus TL may not be fully employed and show in consequence a lower relationship strength. Therefore, instead of examining the entire period as a whole, it will be divided into two periods in which the TL rate will be measured and examined against the stock price, with the following hypothesizes:
H1. From 22 October 2001 onwards, there is a positive relationship between TL rating and stock price performance. H2. The relationship between TL rating and stock price performance before 22 October 2001is lower than the period after 22 October 2001
92 Journal of Leadership, Accountability and Ethics Vol. 13(1) 2016
For the purpose of developing the model for forecasting stock price as a response to TL expressions, the study examined not only the closing price, but also the high and low range, since it is has been shown that the linear difference between high and low share prices, known as the range, can be predicted and used to forecast share prices (Caporin, Ranaldo, & Santucci de Magistris, 2013). Given that the public news announcements can affect the highs and lows of share prices (Ibid), in this research scenario, it was expected that the SEC's announcement would have an effect on the high, low, and closing price, as well as on the price range of stocks.
METHODOLOGY
This study proposes a mechanism for estimating stock price based on TL expressions. This is demonstrated using the Enron email corpus. Similarly to a variety of studies that explored the Enron email corpus ( e.g., Uddin, Hamra, & Hossain, (2013); Ying & Wu, (2011)), the study used Shetty and Adibi’s (2004) SQL-based processed database of Enron corpus. Shetty and Adibi (2004) cleaned the database, by removing a large number of duplicate emails, computer generated folders, junk data, invalid email addresses, and blank messages, and imported all email messages into a relational database, to enable query analysis using SQL, which is a relational database language that facilitates data mining by taking advantage of the regular structure of data stored in tables (Özcan, Chamberlin, Kulkarni, & Michels, 2006). Next, the personnel occupation status of Enron employees were refined, using the data provided by Creamer et al. (2009). Creamer et al. (2009) classified a subset of Enron employees into four occupational categories: senior managers, middle managers, traders, and employees. However, the importance of the traders’ group is not unambiguous, as the function of some traders may be even more important than that of middle managers. To determine a clear boundary, the employees’ occupational statuses were divided into two distinctive groups: senior managers and all the rest.
The most common method for text analysis using natural language processing techniques is ‘Bag-of-Words’ (BOW) (Razavi, Matwin, De Koninck, & Amini, 2014), in which documents are represented as a collection of words, regardless of grammar and word order (Cheng, Zheng, Savova, & Erickson, 2010). The goal of the study was to determine the impact of transformational leadership expressions. Hence, in the next step, the data set of senior managers' emails was explored, by counting the number of times words from the transformational leadership word list compiled by Salter et al. (2013) were mentioned in all emails sent by managers in Enron's senior management group. Next, all emails were aggregated and grouped by dates, so that the daily sum of distinctive TL expressions could be compared to the daily stock price of Enron. All emails sent by Enron senior managers were investigated. This data set included 39 senior managers. From 22 October 2001 to 25 Mar 2002, in only 105 trading days, these senior managers sent a total of 23935 emails. RESULTS
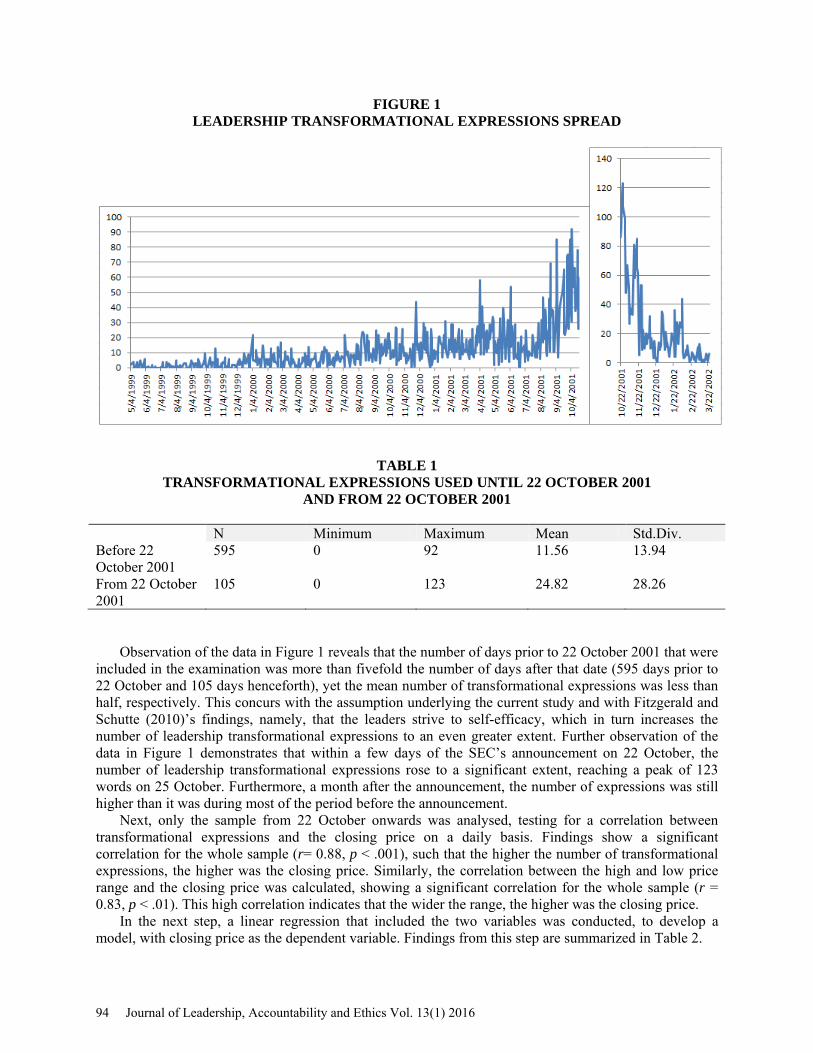
First, a t-test was performed, to examine the difference in the amount of transformational expressions used by the senior managers between the two time periods: before 22 October 2001 and from that date forward. The t-test showed a significant difference between the two time periods (t(113) = -4.7 , p < 0.001), demonstrating that in the time period from 22 October 2001 onwards the mean number of transformational expressions was higher (M = 24.82, SD = 28.26) than the mean for the time period prior to 22 October 2001 (M= 11.56, SD = 13.94). Figure 1 charts the spread of TL expressions over the dates. The matching descriptive statistics are displayed in Table 1.
Journal of Leadership, Accountability and Ethics Vol. 13(1) 2016 93
TRANSFORMATIONAL EXPRESSIONS USED UNTIL 22 OCTOBER 2001 AND FROM 22 OCTOBER 2001
N Minimum Maximum Mean Std.Div. Before 22 October 2001
595 0 92 11.56 13.94
From 22 October 2001
105 0 123 24.82 28.26
Observation of the data in Figure 1 reveals that the number of days prior to 22 October 2001 that were included in the examination was more than fivefold the number of days after that date (595 days prior to 22 October and 105 days henceforth), yet the mean number of transformational expressions was less than half, respectively. This concurs with the assumption underlying the current study and with Fitzgerald and Schutte (2010)’s findings, namely, that the leaders strive to self-efficacy, which in turn increases the number of leadership transformational expressions to an even greater extent. Further observation of the data in Figure 1 demonstrates that within a few days of the SEC’s announcement on 22 October, the number of leadership transformational expressions rose to a significant extent, reaching a peak of 123 words on 25 October. Furthermore, a month after the announcement, the number of expressions was still higher than it was during most of the period before the announcement.
Next, only the sample from 22 October onwards was analysed, testing for a correlation between transformational expressions and the closing price on a daily basis. Findings show a significant correlation for the whole sample (r= 0.88, p < .001), such that the higher the number of transformational expressions, the higher was the closing price. Similarly, the correlation between the high and low price range and the closing price was calculated, showing a significant correlation for the whole sample (r = 0.83, p < .01). This high correlation indicates that the wider the range, the higher was the closing price.
In the next step, a linear regression that included the two variables was conducted, to develop a model, with closing price as the dependent variable. Findings from this step are summarized in Table 2.
94 Journal of Leadership, Accountability and Ethics Vol. 13(1) 2016
TABLE 2 THE VARIABLES USED IN THE REGRESSION
Variable name Notation Details TL expressions TLE Number of appearances of distinctive
words from High-Transformational expressions list
High and low price range Delta The linear difference between high and low prices
Closing price Close The closing price
The regression equation obtained is as follows:
close = 0.103 * TLE + 2.139 * Delta (1)
This equation is characterized by a coefficient of determination (R2) of 0.851, and it includes all of the independent variables. The descriptive statistics are presented in Table 3. From this regression we observe that TLE positively affects the closing price. Also the finding that Delta positively affected the closing price, i.e., that the closing price rose as the range between low and high price increased, agrees with findings presented in the literature. The range of high and low prices shares common patterns with --and is a function of the same stochastic process governing-- stock price evolution (Caporin et al., 2013).
The regression results are summarized in Table 4. The data shown in Table 4 indicate that all of the variables are highly significant, as the significance levels of both TLE and Delta approached zero (p = 0). Furthermore, also the coefficient of determination had a high significance level of p = 0. Among the independent variables, TLE had the largest β coefficient, the coefficient that would be obtained if the outcome and predictor variables were all transformed into standard scores, also called z-scores. This implies that, in terms of standard scores, the TLE had the strongest effect on the closing price, whereby one standard deviation increase in TLE would lead to a 0.583 standard deviation increase in the predicted closing price.
TABLE 3 DESCRIPTIVE STATISTICS OF THE INDEPENDENT VARIABLES
N Minimum Maximum Mean Std. Deviation TLE 105 0 123 24.82 28.26 Delta 105 .008 4.73 .54946 .95420
***significant at p < .001 Next, findings show that TLE correlated significantly with Delta (Pearson (105) = 714, p < .001). To
identify which of these two variables is the most important in terms of affecting the closing price (close), two simple linear regressions were performed, where close was the dependent variable and one of the
Journal of Leadership, Accountability and Ethics Vol. 13(1) 2016 95
other variables, TLE, or Delta was the independent variable. While it is not surprising to find a significant regression between Delta and close, given that the literature specifies that in an efficient financial market, prices fully reflect available information (Fama, 1970; Jarrow & Larsson, 2012), the regressions with TLE showed a larger significant coefficient of determination than did the regression with Delta. This implies that the transformational leadership expression is the most important variable in explaining the closing price. Therefore, to avoid co-linearity, Delta was extracted from regression (1) and the analysis was concluded with a linear regression in which the only independent variable was TLE. The regression equation thus is as follows:
close = -0.846 +0.154 *TLE, (2)
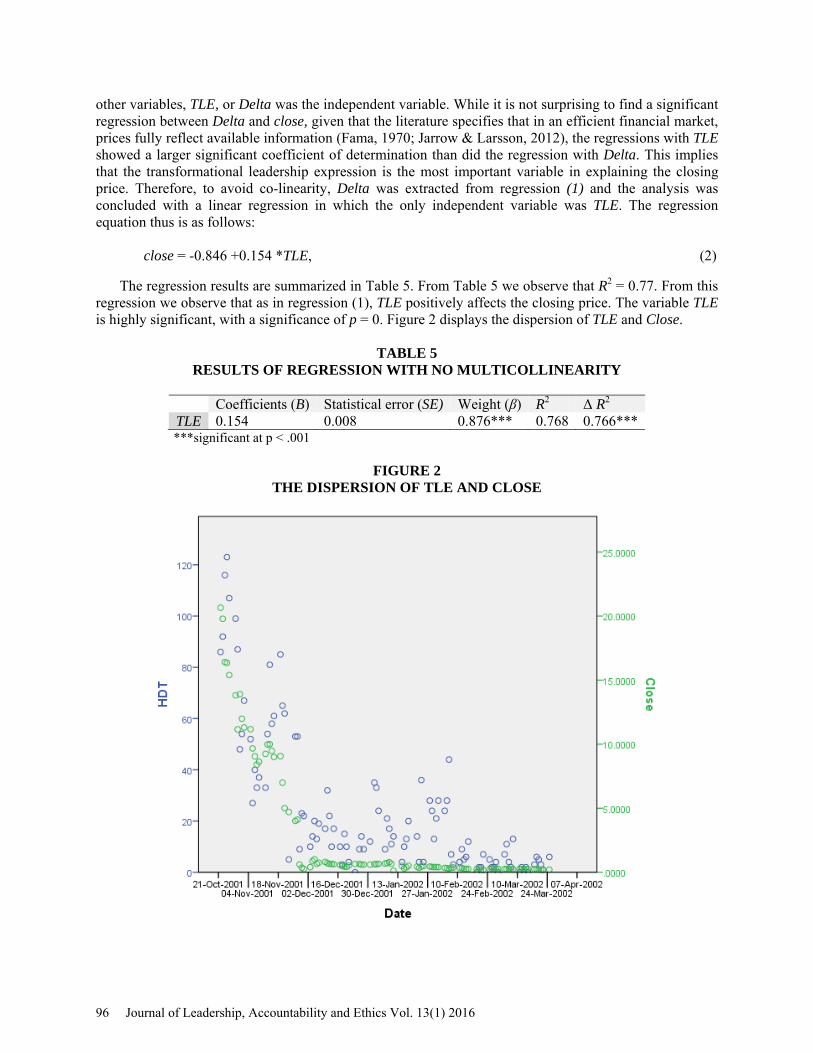
The regression results are summarized in Table 5. From Table 5 we observe that R2 = 0.77. From this regression we observe that as in regression (1), TLE positively affects the closing price. The variable TLE is highly significant, with a significance of p = 0. Figure 2 displays the dispersion of TLE and Close.
TABLE 5
RESULTS OF REGRESSION WITH NO MULTICOLLINEARITY
Coefficients (B) Statistical error (SE) Weight (β) R2 Δ R2 TLE 0.154 0.008 0.876*** 0.768 0.766*** ***significant at p < .001
FIGURE 2
THE DISPERSION OF TLE AND CLOSE
96 Journal of Leadership, Accountability and Ethics Vol. 13(1) 2016
These results suggest that when TL is employed and fully expressed, it may serve a valuable key to predict the stock price. The first hypothesis (H1) is thus significantly accepted. The SEC’s investigation announcement served as an exterior intervention that increased the senior managers’ need to show a behavior aimed to bring good outcomes, which increased the transformational expression, as described by Fitzgerald and Schutte (2010). However, it follows that when TL is used but not fully employed, it would not yield similar effective results for understanding price. To examine the second hypothesis, we constructed another regression, with TLE as the independent variable and Close as the dependent variable, but this time with the sample before 22 October 2001 (Table 6).
TABLE 6 RESULTS OF REGRESSION FOR THE PERIOD BEFORE 22 OCTOBER 2001
Coefficients (B) Statistical error (SE B) Weight (β) R2 Δ R2 HDT -0.395 0.048 -0.32*** 0.102 0.1*** ***significant at p < .001
From Table 6 we observe that the following linear regression:
close = 67.710 -0.395 *HDT, (3)
This regression does show a significance of p = 0, but as expected, with R2 = 0.1, which is more than
seven times lower than the R2 of the regression constructed for the sample for the period from 22 October 2001 onwards, as displayed in Table 5. The second hypothesis is therefore significantly accepted. Furthermore, the negative coefficient of HDT indicates that the lower the number of transformational expressions, the higher the closing price, which provides even further and stronger proof of the attitude that transformation was manifested in the senior managers’ expressions in response to the SEC announcement. In other words, as long as the company could maintain the facade of financial success, the TMT refrained from exhibiting TL behaviors, among them the pursuit of a goal that is beneficial to the organization as a whole (Odom & Green, 2003). However, with the announcement of the SEC, a dramatic change was in order: they needed to externalize positive qualities, a strategy that was manifested in the significant increase in the number of transformational leadership expressions.
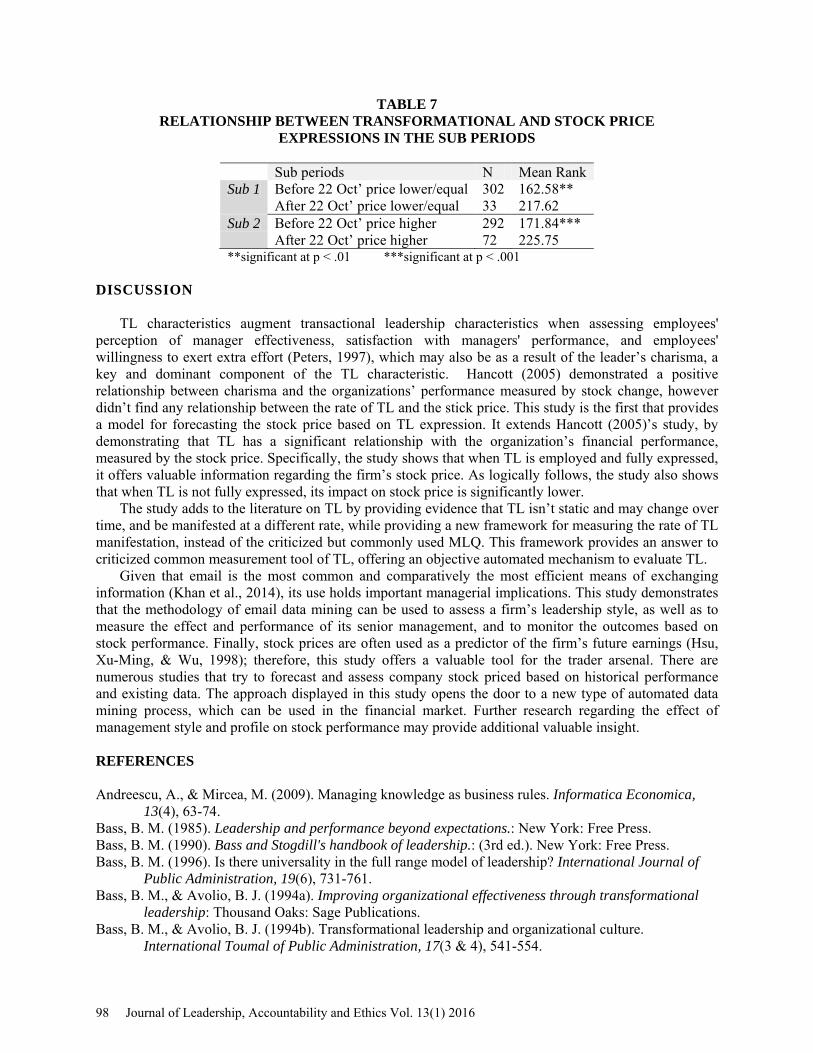
Finally, in order to reinforce the findings, the two time periods before and after 22 October 2001 were devised each into two sub periods; the first sub period includes the days in which the stock’s closing price was higher than the day before, and the second sub period includes the days in which the stock’s closing price was equal or less then the day before. Kruskal-Wallis test for comparing outcomes among more than two independent groups was then performed to examine the difference in transformational expressions compared to the closing price, between the first two sub periods and the second sub periods (Table 6). The Kruskal-Wallis test showed significant difference between the first sub periods (χ2= 9.634, P<.01), and also between the two second sub periods (χ2= 15.21, P<.001). From Table 7 We observe that for both sub periods, the mean rank is higher after 22 Oct’ even though the number of days are lower than before 22 Oct’, which strengthen the claim that transformational expressions, with their effect on stock price, where higher after the SEC’s announcement.
Journal of Leadership, Accountability and Ethics Vol. 13(1) 2016 97
TABLE 7 RELATIONSHIP BETWEEN TRANSFORMATIONAL AND STOCK PRICE
EXPRESSIONS IN THE SUB PERIODS
Sub periods N Mean Rank Sub 1 Before 22 Oct’ price lower/equal
After 22 Oct’ price lower/equal 302 33
162.58** 217.62
Sub 2 Before 22 Oct’ price higher After 22 Oct’ price higher
292 72
171.84*** 225.75
**significant at p < .01 ***significant at p < .001
DISCUSSION TL characteristics augment transactional leadership characteristics when assessing employees'
perception of manager effectiveness, satisfaction with managers' performance, and employees' willingness to exert extra effort (Peters, 1997), which may also be as a result of the leader’s charisma, a key and dominant component of the TL characteristic. Hancott (2005) demonstrated a positive relationship between charisma and the organizations’ performance measured by stock change, however didn’t find any relationship between the rate of TL and the stick price. This study is the first that provides a model for forecasting the stock price based on TL expression. It extends Hancott (2005)’s study, by demonstrating that TL has a significant relationship with the organization’s financial performance, measured by the stock price. Specifically, the study shows that when TL is employed and fully expressed, it offers valuable information regarding the firm’s stock price. As logically follows, the study also shows that when TL is not fully expressed, its impact on stock price is significantly lower.
The study adds to the literature on TL by providing evidence that TL isn’t static and may change over time, and be manifested at a different rate, while providing a new framework for measuring the rate of TL manifestation, instead of the criticized but commonly used MLQ. This framework provides an answer to criticized common measurement tool of TL, offering an objective automated mechanism to evaluate TL.
Given that email is the most common and comparatively the most efficient means of exchanging information (Khan et al., 2014), its use holds important managerial implications. This study demonstrates that the methodology of email data mining can be used to assess a firm’s leadership style, as well as to measure the effect and performance of its senior management, and to monitor the outcomes based on stock performance. Finally, stock prices are often used as a predictor of the firm’s future earnings (Hsu, Xu-Ming, & Wu, 1998); therefore, this study offers a valuable tool for the trader arsenal. There are numerous studies that try to forecast and assess company stock priced based on historical performance and existing data. The approach displayed in this study opens the door to a new type of automated data mining process, which can be used in the financial market. Further research regarding the effect of management style and profile on stock performance may provide additional valuable insight. REFERENCES Andreescu, A., & Mircea, M. (2009). Managing knowledge as business rules. Informatica Economica,
13(4), 63-74. Bass, B. M. (1985). Leadership and performance beyond expectations.: New York: Free Press. Bass, B. M. (1990). Bass and Stogdill's handbook of leadership.: (3rd ed.). New York: Free Press. Bass, B. M. (1996). Is there universality in the full range model of leadership? International Journal of
Public Administration, 19(6), 731-761. Bass, B. M., & Avolio, B. J. (1994a). Improving organizational effectiveness through transformational
leadership: Thousand Oaks: Sage Publications. Bass, B. M., & Avolio, B. J. (1994b). Transformational leadership and organizational culture.
International Toumal of Public Administration, 17(3 & 4), 541-554.
98 Journal of Leadership, Accountability and Ethics Vol. 13(1) 2016
Bass, B. M., & Avolio, B. J. (1995). Manual for the multifactor leadership questionnaire: rater form (5X short), Palo Alto, CA: Mind Garden.
Behling, O., & McFillen, J. M. (1996). A syncretical model of charismatic/transformational leadership. Group & Organization Management, 21(2), 163.
Brewer, L. (2007). A causal model of organizational performance and change. The Journal for Quality and Participation, 30(1), 26-28,48.
Burke, W. W., & Litwin, G. H. (1992). A causal model of organizational performance and change. Journal of Management, 18(3), 523.
Burns, J. M. (1978). Leadership: New York: H arper & Row. Bycio, P., Hackett, R. D., & Allen, J. S. (1995). Further assessments of Bass's (1985) conceptualization of
transactional and transformational leadership. Journal of Applied Psychology, 80, 468-478. Caporin, M., Ranaldo, A., & Santucci de Magistris, P. (2013). On the predictability of stock prices: A
case for high and low prices. Journal of Banking & Finance, 37(12), 5132-5146. Cheng, L. T. E., Zheng, J., Savova, G. K., & Erickson, B. J. (2010). Discerning tumor status from
unstructured MRI reports--completeness of information in existing reports and utility of automated natural language processing. Journal of Digital Imaging, 23(2), 119-132. doi: http://dx.doi.org/10.1007/s10278-009-9215-7
Chua, C., Milosavljevic, M., & Curran, R. J. (2009). A sentiment detection engine for internet stock message boards. Paper presented at the Proceedings of the Australasian language technology association workshop.
Creamer, G., Ryan, R., Shlomo, H., & Salvatore, J. S. (2009). Segmentation and automated social hierarchy detection through email network analysis. In. In Z. Haizheng, S. Myra, M. Bamshad, C. L. Giles, M. Andrew, N. Olfa, S. Jaideep, & Y. John (Eds.), Advances in web mining and web usage analysis (pp. 40-58): Springer-Verlag.
Das, S. R., & Chen, M. Y. (2007). Yahoo! For Amazon: Sentiment extraction from small talk on the web. Management Science, 53(9), 1375-1388.
Davis, A. K., Piger, J. M., & Sedor, L. M. (2006). Beyond the numbers: an analysis of optimistic and pessimistic language in earnings press releases. Working paper, Federal Reserve Bank of St. Louis.
Diesner, J., Frantz, T. L., & Carley, K. M. (2005). Text mining the enron email corpus for stock price prediction, national college of ireland. Computational and Mathematical Organization Theory, 11(3), 201-228.
Doherty, C. (2014). Text Mining the Enron Email Corpus for Stock Price Prediction. (Diploma thesis), National College of Ireland.
Downton, J. V. (1973). Rebel leadership: commitment and charisma in the revolutionary process: New York: The Free Press.
Dvir, T., & Shamir, B. (2003). Follower developmental characteristics as predicting transformational leadership: a longitudinal field study. The Leadership Quarterly, 14(3), 327-344.
Fama, E. F. (1970). Do stock market investors understand the risk sentiment of corporate annual reports? The Journal of Finance, 25(2), 383-417. doi: 10.1111/j.1540-6261.1970.tb00518.x
Feng, L. (2006). Do Stock Market Investors Understand the Risk Sentiment of Corporate Annual Reports? Working paper, University of Michigan.
Firth, M., Wang, K. P., & Wong, S. M. L. (2013). Corporate transparency and the impact of investor sentiment on stock prices. Management Science, Forthcoming. Available at SSRN: http://ssrn.com/abstract=2442521.
Fitzgerald, S., & Schutte, N. S. (2010). Increasing transformational leadership through enhancing self-efficacy. The Journal of Management Development, 29(5), 495-505.
Flynn, F. J., & Staw, B. M. (2004). Lend me your wallets: the effect of charismatic leadership on external support for an organization. Strategic Management Journal, 25(4), 309-309+.
Garcia-Morales, V. J., Matias-Reche, F., & Hurtado-Torres, N. (2008). Influence of transformational leadership on organizational innovation and performance depending on the level of organizational
Journal of Leadership, Accountability and Ethics Vol. 13(1) 2016 99
learning in the pharmaceutical sector. Journal of Organizational Change Management, 21(2), 188-212.
Hancott, D. E. (2005). The relationship between transformational leadership and organizational performance in the largest public companies in Canada. (3159704 Ph.D.), Capella University, Ann Arbor.
House, R. (1977). in Hunt, J.G. and Larson, L.L. (Eds), Leadership: The Cutting Edge, Southern Illinois University Press, Carbondale, IL.
Hsu, J., Xu-Ming, W., & Wu, C. (1998). The role of earnings information in corporate dividend decisions. Management Science, 44(12), S173-S191.
Hu, H., Gu, Q., & Chen, J. (2013). How and when does transformational leadership affect organizational creativity and innovation? Nankai Business Review International, 4(2), 147-166.
Jarrow, R. A., & Larsson, M. (2012). The meaning of market efficiency. Mathematical Finance, 22(1), 1-30.
Khan, R., Mizan, M., Hasan, R., & Sprague, A. (2014). Hot zone identification: Analyzing effects of data sampling on spam clustering. The Journal of Digital Forensics, Security and Law : JDFSL, 9(1), 67-82.
Lindsey, R., Veksler, V. D., Grintsvayg, A., & Gray, W. D. (2007). Be wary of what your computer reads: The effects of corpus selection on measuring semantic relatedness. Paper presented at the 8th International Conference of Cognitive Modeling, ICCM 2007, Ann Arobor, MI.
McKnight, L. L. (2013). Transformational leadership in the context of punctuated change. Journal of Leadership, Accountability and Ethics, 10(2), 103-112.
Norris, F. (2001). Where did the value go at Enron? New York Times, 23 Oct 2001. Odom, L., & Green, M. T. (2003). Law and the ethics of transformational leadership. Leadership &
Organization Development Journal, 24(1/2), 62-69. Özcan, F., Chamberlin, D., Kulkarni, K., & Michels, J. E. (2006). Integration of SQL and XQuery in IBM
DB2. IBM Systems Journal, 45(2), 245-270. Palus, S., Bródka, P., & Kazienko, P. (2011). Evaluation of organization structure based on email
interactions. International Journal of Knowledge Society Research, 2(1), 1-13. Peters, T. J. (1997). Transactional and transformational leadership: Predictors of employee satisfaction,
commitment, and productivity. (9825395 Ph.D.), Dissertation, Marquette University, Ann Arbor. ProQuest Dissertations & Theses Global database.
Petra, S. T., & Loukatos, G. (2009). The Sarbanes-Oxley Act of 2002: a five-year retrospective. Corporate Governance, 9(2), 120-132.
Razavi, A. H., Matwin, S., De Koninck, J., & Amini, R. R. (2014). Dream sentiment analysis using second order soft co-occurrences (SOSCO) and time course representations. Journal of Intelligent Information Systems, 42(3), 393-413.
Salter, C., Green, M. T., Hodgson, M. N., & Joyner, N. (2013). The language of transformational leaders: Addressing the needs of followers. The Journal of American Academy of Business, 19(1), 60-68.
Schumaker, R. P., & Chen, H. (2009). Textual analysis of stock market prediction using breaking financial news: The AZFin text system. ACM Trans. Inf. Syst., 27(2), 1-19. doi: 10.1145/1462198.1462204
Sehgal, V., & Song, C. (2007). SOPS: Stock prediction using web sentiment. Paper presented at the Proceedings of the Seventh IEEE International Conference on Data Mining Workshops.
Shamir, B. (1991). The charismatic relationship: Alternative explanations and predictions. The Leadership Quarterly, 2(2), 81-104.
Shetty, J., & Adibi, J. (2004). The Enron email dataset database schema and brief statistical report. Information Sciences Institute Technical Report, University of Southern California.
Stoker, J. I., Grutterink, H., & Kolk, N. J. (2012). Do transformational CEOs always make the difference? The role of TMT feedback seeking behavior. The Leadership Quarterly, 23(3), 582-592.
Tepper, B. T., & Percy, P. M. (1994). Structural validity of the multifactor leadership questionnaire. Educational and Psychological Measurement, 54, 734-744.
100 Journal of Leadership, Accountability and Ethics Vol. 13(1) 2016
Tetlock, P. C., Saar-Tsechansky, M., & Macskassy, S. (2008). More than words: Quantifying language to measure firms' fundamental. The Journal of Finance, 63(3), 1437.
Tourish, D., & Vatcha, N. (2005). Charismatic leadership and corporate cultism at enron: the elimination of dissent, the promotion of conformity and organizational collapse. Leadership (London), 1(4), 455-480.
Tracey, J. B., & Hinkin, T. R. (1998). Transformational Leadership or Effective Managerial Practices? Group and Organization Management, 23(3), 220-236.
Uddin, S., Hamra, J., & Hossain, L. (2013). Exploring communication networks to understand organizational crisis using exponential random graph models. Computational and Mathematical Organization Theory, 19(1), 25-41.
Van Knippenberg, D., & Sitkin, S. B. (2013). A Critical Assessment of Charismati - Transformational Leadership Research: Back to the Drawing Board? The Academy of Management Annals, 7(1), 1-60.
Warrick, D. D. (2011). The urgent need for skilled transformational leaders: integrating transformational leadership and organization development. Journal of Leadership, Accountability and Ethics, 8(5), 11-26.
Washington, N. L. (2013). Transformational leadership and its effect on followers from leader perspectives: An analysis of multiple leaders across organizations. (3537384 Ph.D.), Benedictine University, Ann Arbor. ProQuest Dissertations & Theses Global database.
Wilson, G., & Banzhaf, W. (2009). Discovery of email communication networks from the Enron corpus with a genetic algorithm using social network analysis. Paper presented at the Evolutionary Computation, 2009. CEC '09. IEEE Congress on.
Yammarino, F. J., & Dubinsky, A. J. (1994). Transformational leadership theory: using levels of analysis to determine boundary conditions. Personnel Psychology, 47, 787-811.
Ying, X., & Wu, X. (2011). On link privacy in randomizing social networks. Knowledge and Information Systems, 28(3), 645-663.
Yukl, G. A. (1989). Leadership in organizations (2nd ed.): Englewood Cliffs, NJ: Prentice-Hall.
Journal of Leadership, Accountability and Ethics Vol. 13(1) 2016 101
APPENDIX A
Salter, Green, Hodgson, and N. Joyner (2013)’s Words used more frequently by leaders rated
high on transformational leadership Team
Members Provide Purpose Teach
Information Concerns Solutions Creating Growth Inspire Quality Integrity
Encourage Coaching
Participation Workshops
Encouraging Teammates Motivate
Autonomy Relationships
Personal Encouragement
Inspiring Modeled
Motivating Rapport
Teamwork Of The Organization
The Right Thing Vision Of The Organization
Open Door Policy The Vision Of The Organization
102 Journal of Leadership, Accountability and Ethics Vol. 13(1) 2016