37
Venture Capital Insights ® – 4Q14 Corporate VC participation and valuations February 2015
Venture Capital Insights® – 4Q14
Corporate VC participation and valuations
February 2015
Page 1 Venture Capital Insights® – 4Q14
► Bryan Pearce, Global Leader, Entrepreneur Of The YearTM and Global Venture Capital Advisory Group, EY
► Jeff Grabow, US, Venture Capital Leader, EY ► Sandra Feldner Vandergriff, Venture Capital Advisory Group, EY ► Shanta Kumari, EY Knowledge, EY ► Vidhi Gupta, EY Knowledge, EY ► Prof. George Foster, Graduate School of Business, Stanford University ► Dr. Martin Haemmig, Adjunct Professor, Globalization of Venture Capital, CeTIM and
former Senior Advisor on Venture Capital, Stanford University (SPRIE)
► Prof. Steven Kaplan, Graduate School of Business, University of Chicago
Insights development team
* All data contained in this is sourced to Dow Jones VentureSource unless otherwise noted.
Page 2 Venture Capital Insights® – 4Q14
This edition of Venture Capital Insights analyzes corporate venture capital participation and pre-money valuations from 1997 through 2014 period. The presentation also provides an overview of IPO and M&A companies with corporate investor participation since 1997 and active corporate investor analysis since 2008.
Venture Capital Insights
Content overview: 1 Participation in financing rounds and pre-money valuation
2 IPO and M&A exits companies with corporate investor
3 Number of deals per year by corporate investor

Page 3 Venture Capital Insights® – 4Q14
Section 1: Participation in financing rounds and pre-money valuation Analysis by geography and round class
Page 4 Venture Capital Insights® – 4Q14
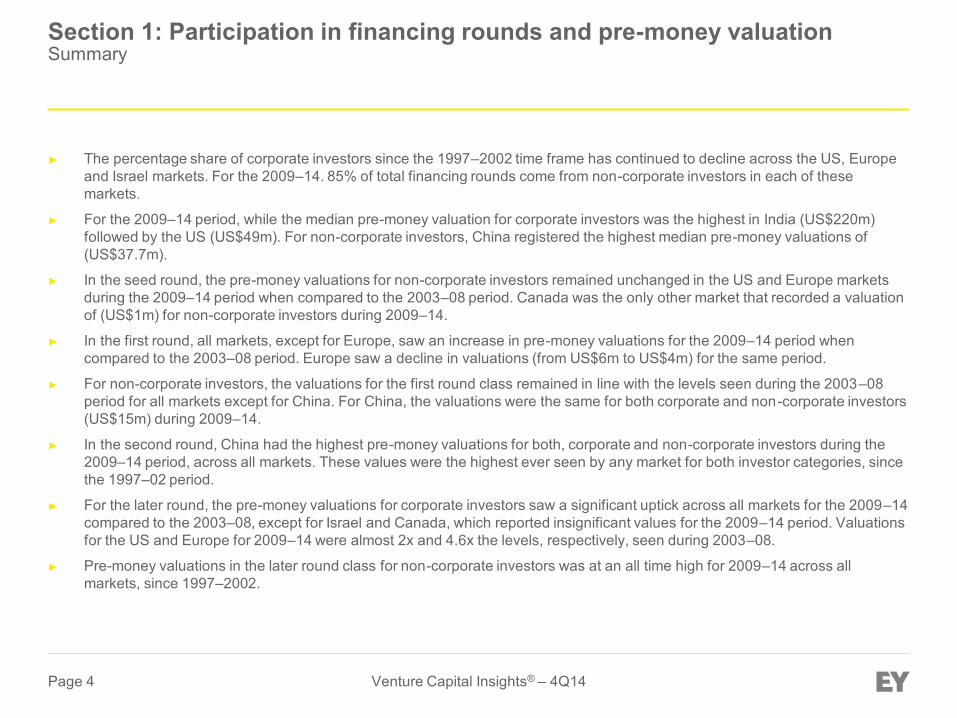
► The percentage share of corporate investors since the 1997–2002 time frame has continued to decline across the US, Europe and Israel markets. For the 2009–14. 85% of total financing rounds come from non-corporate investors in each of these markets.
► For the 2009–14 period, while the median pre-money valuation for corporate investors was the highest in India (US$220m) followed by the US (US$49m). For non-corporate investors, China registered the highest median pre-money valuations of (US$37.7m).
► In the seed round, the pre-money valuations for non-corporate investors remained unchanged in the US and Europe markets during the 2009–14 period when compared to the 2003–08 period. Canada was the only other market that recorded a valuation of (US$1m) for non-corporate investors during 2009–14.
► In the first round, all markets, except for Europe, saw an increase in pre-money valuations for the 2009–14 period when compared to the 2003–08 period. Europe saw a decline in valuations (from US$6m to US$4m) for the same period.
► For non-corporate investors, the valuations for the first round class remained in line with the levels seen during the 2003–08 period for all markets except for China. For China, the valuations were the same for both corporate and non-corporate investors (US$15m) during 2009–14.
► In the second round, China had the highest pre-money valuations for both, corporate and non-corporate investors during the 2009–14 period, across all markets. These values were the highest ever seen by any market for both investor categories, since the 1997–02 period.
► For the later round, the pre-money valuations for corporate investors saw a significant uptick across all markets for the 2009–14 compared to the 2003–08, except for Israel and Canada, which reported insignificant values for the 2009–14 period. Valuations for the US and Europe for 2009–14 were almost 2x and 4.6x the levels, respectively, seen during 2003–08.
► Pre-money valuations in the later round class for non-corporate investors was at an all time high for 2009–14 across all markets, since 1997–2002.
Section 1: Participation in financing rounds and pre-money valuation Summary
Page 5 Venture Capital Insights® – 4Q14
24% 17% 14%
76% 83% 86%
1997-2002 2003-08 2009-1414% 14% 11%
86% 86% 89%
1997-2002 2003-08 2009-14
NS NS 13%
87%
1997-2002 2003-08 2009-14
11% NS NS
89%
1997-2002 2003-08 2009-14
NS 10% NS
90%
1997-2002 2003-08 2009-14
Europe US
India Canada
China
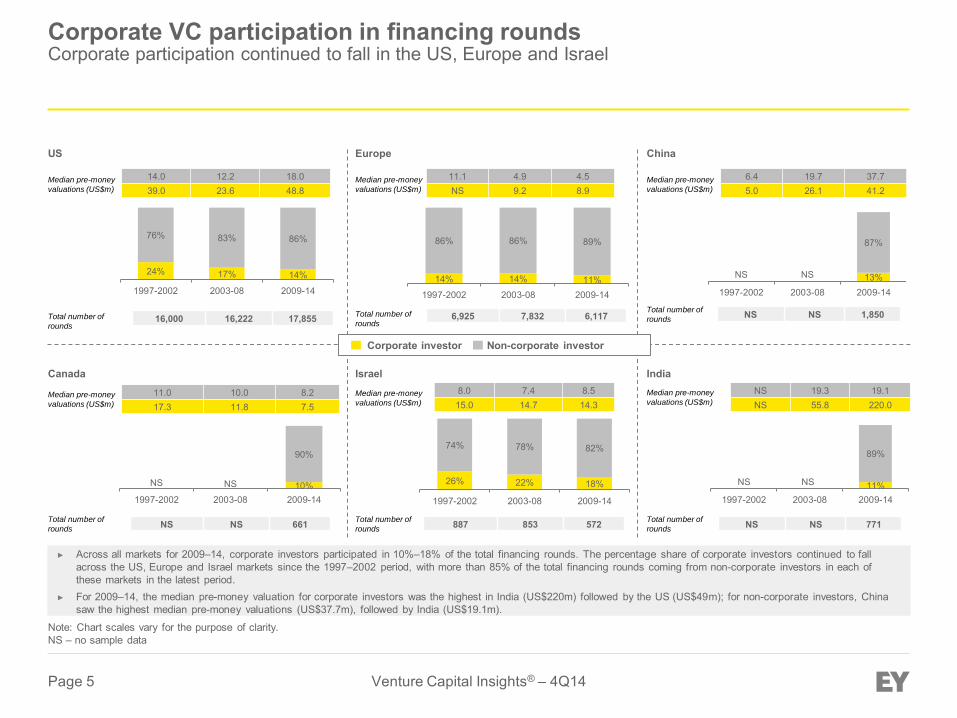
► Across all markets for 2009–14, corporate investors participated in 10%–18% of the total financing rounds. The percentage share of corporate investors continued to fall across the US, Europe and Israel markets since the 1997–2002 period, with more than 85% of the total financing rounds coming from non-corporate investors in each of these markets in the latest period.
► For 2009–14, the median pre-money valuation for corporate investors was the highest in India (US$220m) followed by the US (US$49m); for non-corporate investors, China saw the highest median pre-money valuations (US$37.7m), followed by India (US$19.1m).
Median pre-money
valuations (US$m)
14.0 12.2 18.0 39.0 23.6 48.8
11.1 4.9 4.5 NS 9.2 8.9
NS 19.3 19.1 NS 55.8 220.0
6.4 19.7 37.7 5.0 26.1 41.2
11.0 10.0 8.2 17.3 11.8 7.5
Median pre-money
valuations (US$m)
Median pre-money
valuations (US$m) Median pre-money
valuations (US$m)
Note: Chart scales vary for the purpose of clarity. NS – no sample data
26% 22% 18%
74% 78% 82%
1997-2002 2003-08 2009-14
Israel 8.0 7.4 8.5 15.0 14.7 14.3
Median pre-money
valuations (US$m)
Total number of
rounds 6,925 7,832 6,117 Total number of
rounds 16,000 16,222 17,855
Total number of
rounds NS NS 1,850
Total number of
rounds 887 853 572 Total number of
rounds NS NS 661 Total number of
rounds NS NS 771
Median pre-money
valuations (US$m)
Corporate VC participation in financing rounds Corporate participation continued to fall in the US, Europe and Israel
Corporate investor Non-corporate investor
Page 6 Venture Capital Insights® – 4Q14
$4
$2
$4
NS NS NS
$4
$2 $2 $3
$2
$3
1997-2002
2003-2008
2009-2014
2012 2013 2014
$3
$1 $1 $1
NS NS
$1 $1 $1 $1
$1 $1
1997-2002 2003-08 2009-14 2012 2013 2014
NS NS
$4
NS NS NS
$2 $3
NS
$2 $2
$3
1997-2002 2003-08 2009-14 2012 2013 2014
$4
NS NS
$4
$1
NS
1997-2002 2003-08 2009-14
NS NS NS NS NS
$1
1997-2002 2003-08 2009-14 1997-2002 2003-08 2009-14
Pre-money valuations by seed round (US$m)
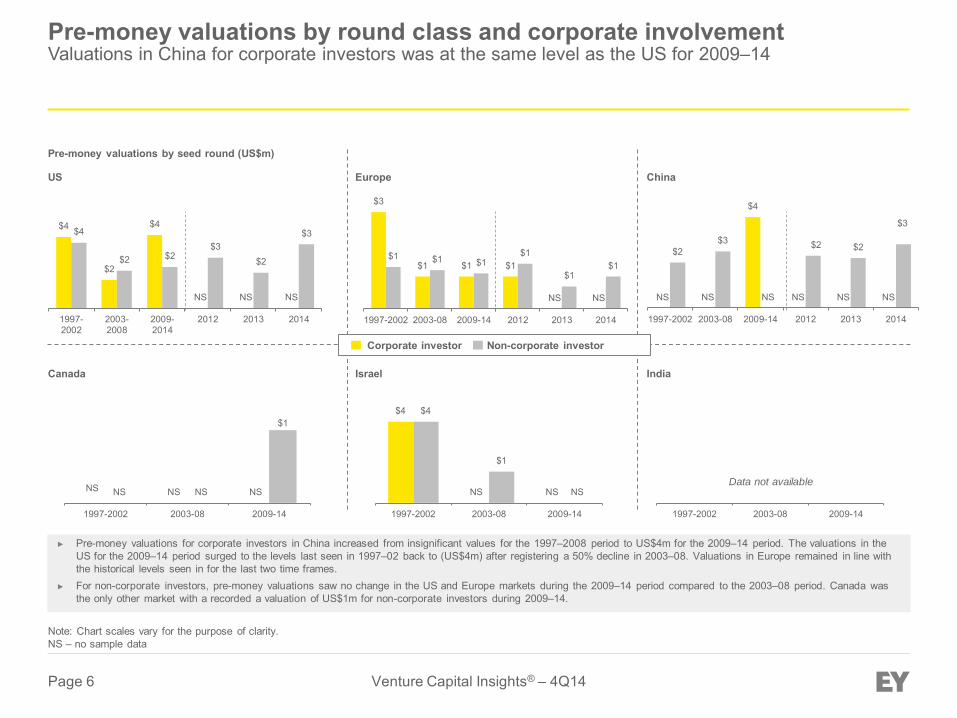
► Pre-money valuations for corporate investors in China increased from insignificant values for the 1997–2008 period to US$4m for the 2009–14 period. The valuations in the US for the 2009–14 period surged to the levels last seen in 1997–02 back to (US$4m) after registering a 50% decline in 2003–08. Valuations in Europe remained in line with the historical levels seen in for the last two time frames.
► For non-corporate investors, pre-money valuations saw no change in the US and Europe markets during the 2009–14 period compared to the 2003–08 period. Canada was the only other market with a recorded a valuation of US$1m for non-corporate investors during 2009–14.
Data not available
Note: Chart scales vary for the purpose of clarity. NS – no sample data
Pre-money valuations by round class and corporate involvement Valuations in China for corporate investors was at the same level as the US for 2009–14
Corporate investor Non-corporate investor
Europe US
India Canada
China
Israel
Page 7 Venture Capital Insights® – 4Q14
$9 $10 $12
$7
$5 $4
1997- 2002 2003- 2008 2009- 2014
NS
$10
NS
$9
$6 $5
1997- 2002 2003- 2008 2009- 2014
NS NS NS NS
$9 $8
1997- 2002 2003- 2008 2009- 2014
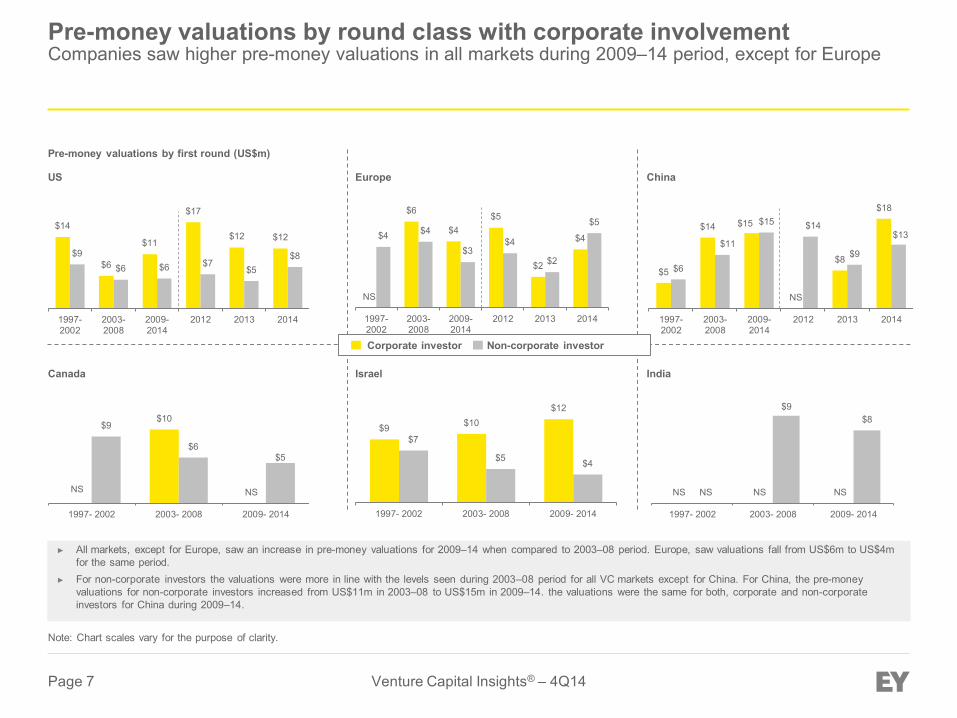
► All markets, except for Europe, saw an increase in pre-money valuations for 2009–14 when compared to 2003–08 period. Europe, saw valuations fall from US$6m to US$4mfor the same period.
► For non-corporate investors the valuations were more in line with the levels seen during 2003–08 period for all VC markets except for China. For China, the pre-money valuations for non-corporate investors increased from US$11m in 2003–08 to US$15m in 2009–14. the valuations were the same for both, corporate and non-corporate investors for China during 2009–14.
Note: Chart scales vary for the purpose of clarity.
Pre-money valuations by first round (US$m)
$14
$6
$11
$17
$12 $12
$9 $6 $6 $7
$5 $8
1997-2002
2003-2008
2009-2014
2012 2013 2014
NS
$6
$4 $5
$2
$4 $4 $4
$3 $4
$2
$5
1997-2002
2003-2008
2009-2014
2012 2013 2014
$5
$14 $15
NS
$8
$18
$6
$11
$15 $14
$9
$13
1997-2002
2003-2008
2009-2014
2012 2013 2014
Pre-money valuations by round class with corporate involvement Companies saw higher pre-money valuations in all markets during 2009–14 period, except for Europe
Corporate investor Non-corporate investor
Europe US
India Canada
China
Israel
Page 8 Venture Capital Insights® – 4Q14
$27
$15
NS
$15
$9 $12
1997-2002 2003-08 2009-14
NS
$18
NS NS
$9
$14
1997-002 2003-08 2009-14
NS
$18
NS NS
$36
NS
1997-2002 2003-08 2009-14
$37
$16
$32 $34
$75
$44
$21 $15 $18
$22 $22 $22
1997-2002 2003-08 2009-14 2012 2013 2014
$16
$8
$12
NS NS NS
$11
$6
$9 $11
$9
$14
1997-2002 2003-08 2009-14 2012 2013 2014
NS
$22
$45
NS
$22
$95
$33 $24
$55
$33 $31
$63
1997-2002 2003-08 2009-14 2012 2013 2014
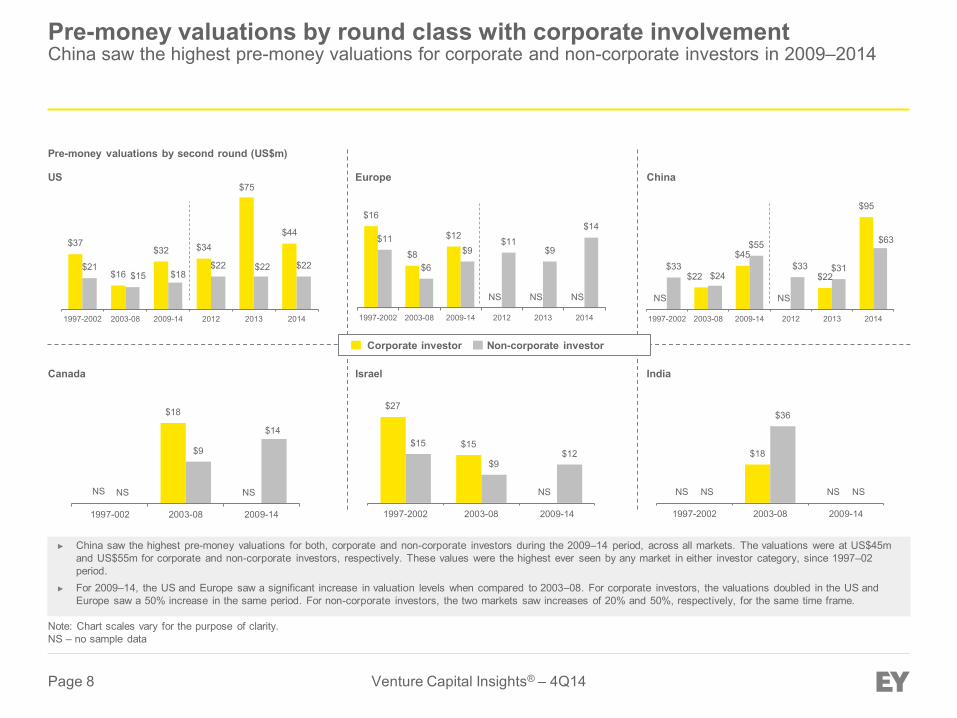
► China saw the highest pre-money valuations for both, corporate and non-corporate investors during the 2009–14 period, across all markets. The valuations were at US$45mand US$55m for corporate and non-corporate investors, respectively. These values were the highest ever seen by any market in either investor category, since 1997–02period.
► For 2009–14, the US and Europe saw a significant increase in valuation levels when compared to 2003–08. For corporate investors, the valuations doubled in the US andEurope saw a 50% increase in the same period. For non-corporate investors, the two markets saw increases of 20% and 50%, respectively, for the same time frame.
Note: Chart scales vary for the purpose of clarity. NS – no sample data
Pre-money valuations by second round (US$m)
Pre-money valuations by round class with corporate involvement China saw the highest pre-money valuations for corporate and non-corporate investors in 2009–2014
Corporate investor Non-corporate investor
Europe US
India Canada
China
Israel
Page 9 Venture Capital Insights® – 4Q14
$32
$19
NS
$19 $16
$63
1997-2002 2003-08 2009-14
NS NS NS NS
$26
$44
1997-2002 2003-08 2009-14
NS NS
$600
NS $26 $56
1997-2002 2003-08 2009-14
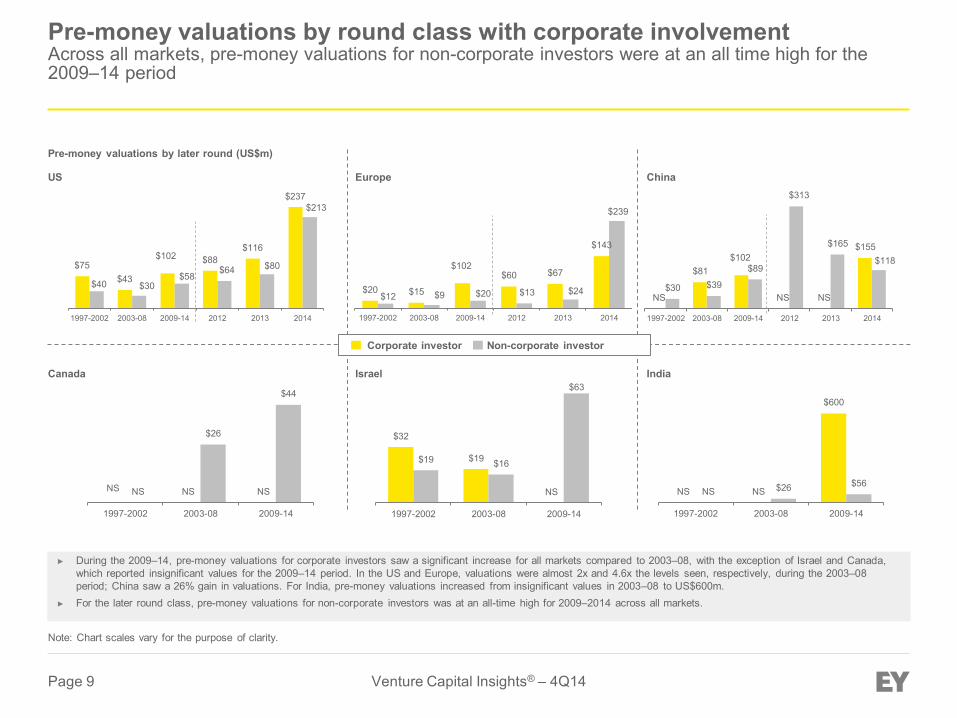
► During the 2009–14, pre-money valuations for corporate investors saw a significant increase for all markets compared to 2003–08, with the exception of Israel and Canada, which reported insignificant values for the 2009–14 period. In the US and Europe, valuations were almost 2x and 4.6x the levels seen, respectively, during the 2003–08 period; China saw a 26% gain in valuations. For India, pre-money valuations increased from insignificant values in 2003–08 to US$600m.
► For the later round class, pre-money valuations for non-corporate investors was at an all-time high for 2009–2014 across all markets.
Note: Chart scales vary for the purpose of clarity.
Pre-money valuations by later round (US$m)
$75 $43
$102 $88 $116
$237
$40 $30 $58
$64 $80
$213
1997-2002 2003-08 2009-14 2012 2013 2014
NS
$81 $102
NS NS
$155
$30 $39
$89
$313
$165
$118
1997-2002 2003-08 2009-14 2012 2013 2014
$20 $15
$102 $60 $67
$143
$12 $9 $20 $13 $24
$239
1997-2002 2003-08 2009-14 2012 2013 2014
Corporate investor Non-corporate investor
Europe US
India Canada
China
Israel
Pre-money valuations by round class with corporate involvement Across all markets, pre-money valuations for non-corporate investors were at an all time high for the 2009–14 period
Page 10 Venture Capital Insights® – 4Q14
Section 2: IPO and M&A exits companies with corporate investor Analysis by median exit ratio, geography and sector
Page 11 Venture Capital Insights® – 4Q14
► In the US, close to 50 % of IPO companies had corporate investor participation during the 2009-14 period – the proportion ofIPO companies with corporate investments increased from 41% in 1997-2002 to 48% in 2009-14, despite a decrease in thetotal number of IPO companies.
► Across all industry sectors, the healthcare sector saw the highest number of IPO companies with corporate participation during2009-14.
► For the US and Europe, IPO median exit ratios in 2009-14 for corporate investors were more in line with levels seen in 2003-8,although much lower than 1997-2002 levels.
► In China, the IPO median exit ratio was the highest at 44.5 for non-corporate investors
► M&A median exit ratio was much higher for non-corporate investors than corporate investors since 1997–2002, across allmarkets. For China and India – the ratio for the two investor categories was nearly the same for 2009–14.
► The number of M&A companies with corporate participation reached its highest level during the 2003–08 period, in the US,Europe and Israel. The number of M&A companies with corporate participation declined in 2009–14 across these threemarkets, when compared to 2003–08.
► Globally, the US continues to dominate all markets, with the highest number of companies with corporate participationexiting via M&A. A strong M&A environment in the US continues to support corporate investor confidence compared to allother markets.
► In the US, during 2009–14, the information technology (IT) sector continued to see a strong M&A activity with corporateparticipation. In Europe, the number of M&A companies with corporate participation decreased across all industries during2009–2014 as compared to the 2003–08 period, except in the consumer goods, consumer services and energy and utilitiessectors.
► The number of companies acquired by an existing investor continued to decline in the US during the 2009–14 period. Europesaw the number of companies declining from 48 to 35 during this period, although higher than the volume seen during the1997–2002 period.
Section 2: IPO and M&A companies with corporate investor Summary
Page 12 Venture Capital Insights® – 4Q14
41% 47% 48%
59% 53% 52%
1997-2002 2003-08 2009-14
Note: Chart scales vary for the purpose of clarity.
17% 21% 25%
83% 79% 75%
1997-2002 2003-08 2009-148% 9%
100% 92% 91%
1997-2002 2003-08 2009-14
17% 6%
38%
83% 94%
63%
1997-2002 2003-08 2009-14
15%
58% 47%
85%
42% 53%
1997-2002 2003-08 2009-14
23%
100% 100% 77%
1997-2002 2003-08 2009-14
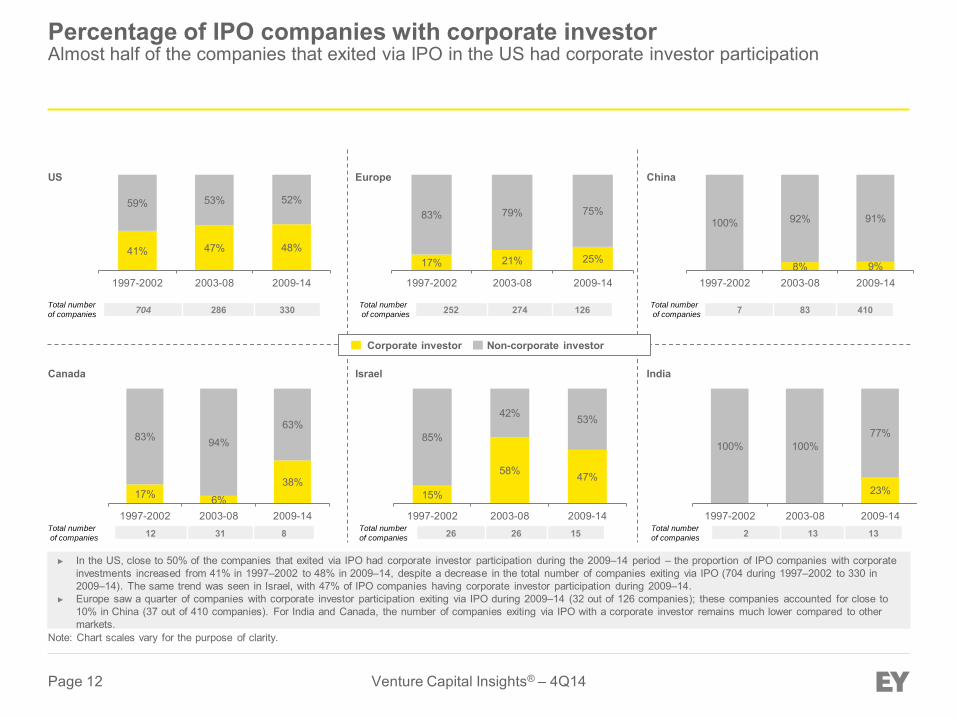
► In the US, close to 50% of the companies that exited via IPO had corporate investor participation during the 2009–14 period – the proportion of IPO companies with corporateinvestments increased from 41% in 1997–2002 to 48% in 2009–14, despite a decrease in the total number of companies exiting via IPO (704 during 1997–2002 to 330 in2009–14). The same trend was seen in Israel, with 47% of IPO companies having corporate investor participation during 2009–14.
► Europe saw a quarter of companies with corporate investor participation exiting via IPO during 2009–14 (32 out of 126 companies); these companies accounted for close to 10% in China (37 out of 410 companies). For India and Canada, the number of companies exiting via IPO with a corporate investor remains much lower compared to othermarkets.
Total number
of companies 252 274 126 Total number
of companies 704 286 330 Total number
of companies 7 83 410
Total number
of companies 26 26 15 Total number
of companies 12 31 8 Total number
of companies 2 13 13
Percentage of IPO companies with corporate investor Almost half of the companies that exited via IPO in the US had corporate investor participation
Corporate investor Non-corporate investor
Europe US
India Canada
China
Israel
Page 13 Venture Capital Insights® – 4Q14
45% 43% 35%
55% 57% 65%
1997-02 2003-08 2009-14
50% 60% 100%
50% 40%
1997-02 2003-08 2009-14
39% 40% 38%
61% 60% 62%
1997-2002 2003-08 2009-14
40% 25%
100% 60% 75%
1997-02 2003-08 2009-14
44% 43% 52%
56% 57% 48%
1997-2002 2003-08 2009-14
57% 63% 100%
43% 38%
1997-2002 2003-08 2009-14
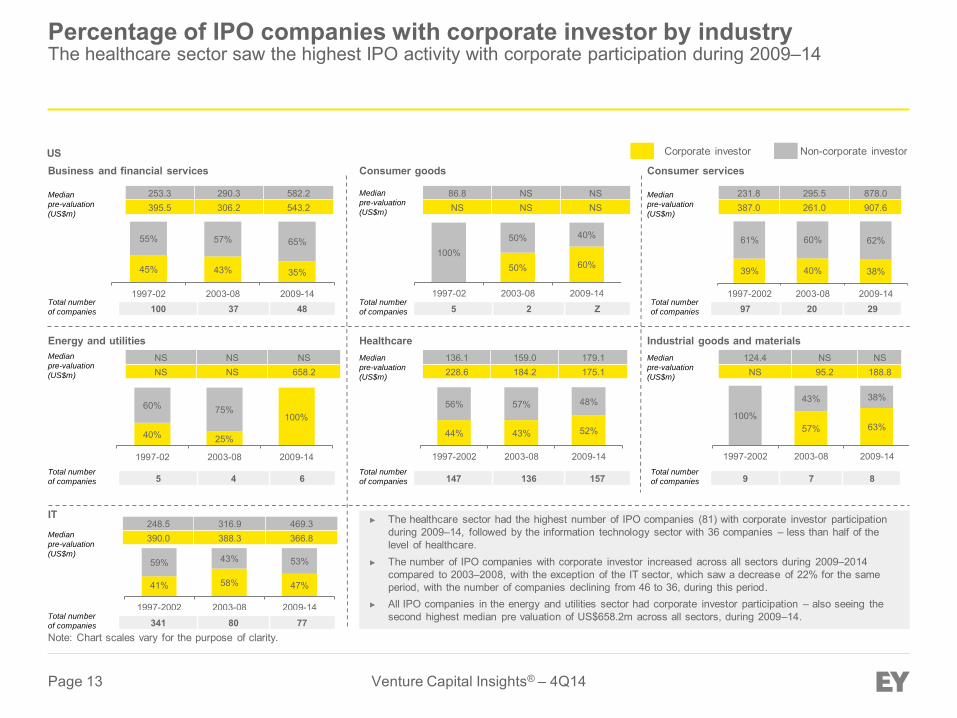
► The healthcare sector had the highest number of IPO companies (81) with corporate investor participationduring 2009–14, followed by the information technology sector with 36 companies – less than half of the level of healthcare.
► The number of IPO companies with corporate investor increased across all sectors during 2009–2014compared to 2003–2008, with the exception of the IT sector, which saw a decrease of 22% for the same period, with the number of companies declining from 46 to 36, during this period.
► All IPO companies in the energy and utilities sector had corporate investor participation – also seeing the second highest median pre valuation of US$658.2m across all sectors, during 2009–14.
253.3 290.3 582.2 395.5 306.2 543.2
86.8 NS NS NS NS NS
231.8 295.5 878.0 387.0 261.0 907.6
136.1 159.0 179.1 228.6 184.2 175.1
NS NS NS NS NS 658.2
124.4 NS NS NS 95.2 188.8
US
41% 58% 47%
59% 43% 53%
1997-2002 2003-08 2009-14
248.5 316.9 469.3 390.0 388.3 366.8
Note: Chart scales vary for the purpose of clarity.
100 37 48 5 2 Z 97 20 29
5 4 6 147 136 157 9 7 8
Corporate investor Non-corporate investor
Consumer goods Consumer services Business and financial services
Healthcare Industrial goods and materials Energy and utilities
Median
pre-valuation
(US$m)
IT
Median
pre-valuation
(US$m)
Median
pre-valuation
(US$m)
Median
pre-valuation
(US$m)
Median
pre-valuation
(US$m)
Median
pre-valuation
(US$m)
Median
pre-valuation
(US$m)
Total number
of companies
Total number
of companies
Total number
of companies
Total number
of companies
Total number
of companies
Total number
of companies
Total number
of companies 341 80 77
Percentage of IPO companies with corporate investor by industry The healthcare sector saw the highest IPO activity with corporate participation during 2009–14
Page 14 Venture Capital Insights® – 4Q14
10% 10% 14%
90% 90% 86%
1997-2002 2003-08 2009-14
0%
100% 100%
1997-2002 2003-08 2009-14
30% 17% 6%
70% 83% 94%
1997- 2002 2003- 2008 2009- 2014
18% 43%
100% 82% 57%
1997-2002 2003-08 2009-147% 29% 25%
93% 71% 75%
1997-2002 2003-08 2009-148% 13%
100% 92% 88%
1997-2002 2003-08 2009-14
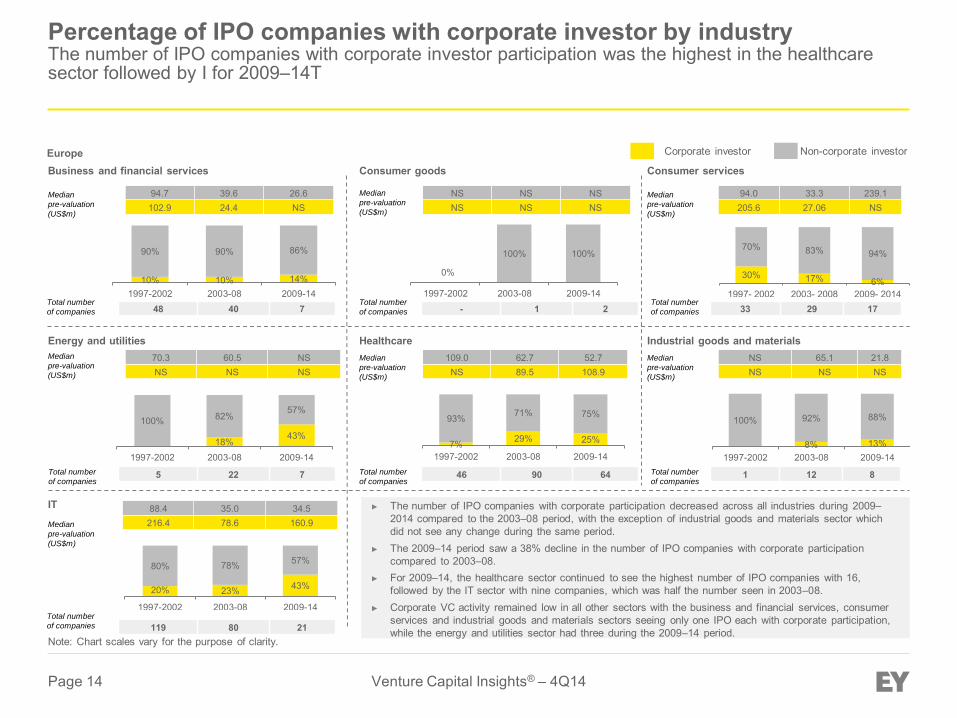
► The number of IPO companies with corporate participation decreased across all industries during 2009–2014 compared to the 2003–08 period, with the exception of industrial goods and materials sector which did not see any change during the same period.
► The 2009–14 period saw a 38% decline in the number of IPO companies with corporate participation compared to 2003–08.
► For 2009–14, the healthcare sector continued to see the highest number of IPO companies with 16, followed by the IT sector with nine companies, which was half the number seen in 2003–08.
► Corporate VC activity remained low in all other sectors with the business and financial services, consumer services and industrial goods and materials sectors seeing only one IPO each with corporate participation, while the energy and utilities sector had three during the 2009–14 period.
94.7 39.6 26.6 102.9 24.4 NS
NS NS NS NS NS NS
94.0 33.3 239.1 205.6 27.06 NS
109.0 62.7 52.7 NS 89.5 108.9
70.3 60.5 NS NS NS NS
NS 65.1 21.8 NS NS NS
20% 23% 43%
80% 78% 57%
1997-2002 2003-08 2009-14
88.4 35.0 34.5 216.4 78.6 160.9
Note: Chart scales vary for the purpose of clarity.
48 40 7 - 1 2 33 29 17
5 22 7 46 90 64 1 12 8
119 80 21
Corporate investor Non-corporate investor
Consumer goods Consumer services Business and financial services
Healthcare Industrial goods and materials Energy and utilities
Median
pre-valuation
(US$m)
IT
Median
pre-valuation
(US$m)
Median
pre-valuation
(US$m)
Median
pre-valuation
(US$m)
Median
pre-valuation
(US$m)
Median
pre-valuation
(US$m)
Median
pre-valuation
(US$m)
Total number
of companies
Total number
of companies
Total number
of companies
Total number
of companies
Total number
of companies
Total number
of companies
Total number
of companies
Europe
Percentage of IPO companies with corporate investor by industry The number of IPO companies with corporate investor participation was the highest in the healthcare sector followed by I for 2009–14T
Page 15 Venture Capital Insights® – 4Q14
7.9
3.6 2.6
10.8
4.0 5.2
1997-2002 2003-08 2009-14
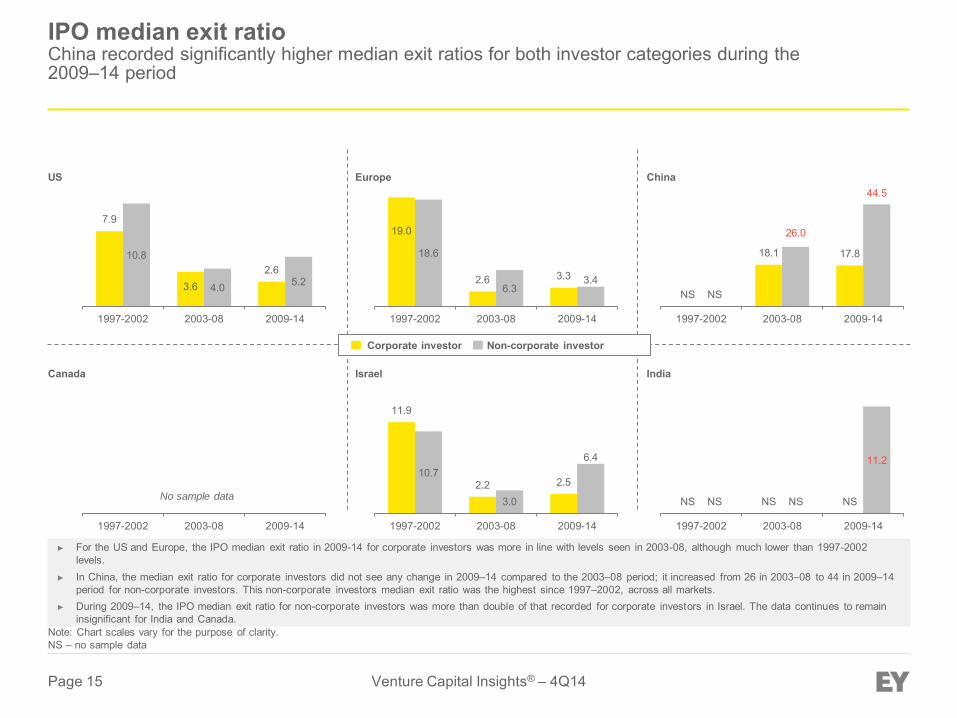
► For the US and Europe, the IPO median exit ratio in 2009-14 for corporate investors was more in line with levels seen in 2003-08, although much lower than 1997-2002levels.
► In China, the median exit ratio for corporate investors did not see any change in 2009–14 compared to the 2003–08 period; it increased from 26 in 2003–08 to 44 in 2009–14period for non-corporate investors. This non-corporate investors median exit ratio was the highest since 1997–2002, across all markets.
► During 2009–14, the IPO median exit ratio for non-corporate investors was more than double of that recorded for corporate investors in Israel. The data continues to remaininsignificant for India and Canada.
19.0
2.6 3.3
18.6
6.3 3.4
1997-2002 2003-08 2009-14
NS
18.1 17.8
NS
26.0
44.5
1997-2002 2003-08 2009-14
1997-2002 2003-08 2009-14
11.9
2.2 2.5 10.7
3.0
6.4
1997-2002 2003-08 2009-14
NS NS NS NS NS
11.2
1997-2002 2003-08 2009-14
No sample data
IPO median exit ratio China recorded significantly higher median exit ratios for both investor categories during the 2009–14 period
Corporate investor Non-corporate investor
Europe US
India Canada
China
Israel
Note: Chart scales vary for the purpose of clarity. NS – no sample data
Page 16 Venture Capital Insights® – 4Q14
27% 33% 24%
73% 67% 76%
1997-2002 2003-08 2009-14
15% 17% 18%
85% 83% 82%
1997-2002 2003-08 2009-14
33% 44% 36%
67% 56% 64%
1997-2002 2003-08 2009-14
Europe US
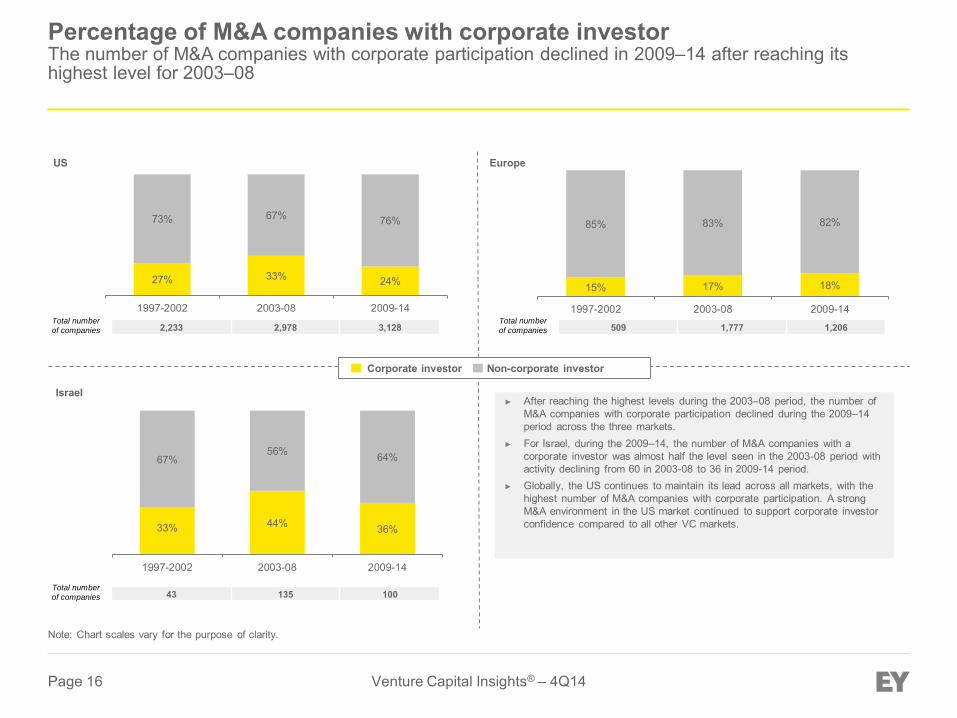
Israel ► After reaching the highest levels during the 2003–08 period, the number of
M&A companies with corporate participation declined during the 2009–14period across the three markets.
► For Israel, during the 2009–14, the number of M&A companies with a corporate investor was almost half the level seen in the 2003-08 period withactivity declining from 60 in 2003-08 to 36 in 2009-14 period.
► Globally, the US continues to maintain its lead across all markets, with the highest number of M&A companies with corporate participation. A strongM&A environment in the US market continued to support corporate investorconfidence compared to all other VC markets.
Note: Chart scales vary for the purpose of clarity.
Total number
of companies 2,233 2,978 3,128 Total number
of companies 509 1,777 1,206
Total number
of companies 43 135 100
Corporate investor Non-corporate investor
Percentage of M&A companies with corporate investor The number of M&A companies with corporate participation declined in 2009–14 after reaching its highest level for 2003–08
Page 17 Venture Capital Insights® – 4Q14
12% 12% 12%
81% 69% 73%
7% 18% 14%
1997- 2002 2003- 2008 2009- 2014
US – corporate investor
Note: Chart scales vary for the purpose of clarity.
Total number
of companies 599 976 756
1% 3% 13% 11%
96% 61% 69%
1% 25% 20%
1997-2002 2003-08 2009-14Total number
of companies 76 296 220
Europe – corporate investor
1% 1% 1% 13% 13% 14%
70% 62% 70%
15% 24% 14%
1997-2002 2003-08 2009-14Total number
of companies 1,634 2,002 2,372
1% 6% 7% 7%
89% 60% 69%
5% 32% 23%
1997-2002 2003-08 2009-14Total number
of companies 433 1,481 986
US – non–corporate investor
Europe – non–corporate investor
Startup Product development Generating revenue Profitable
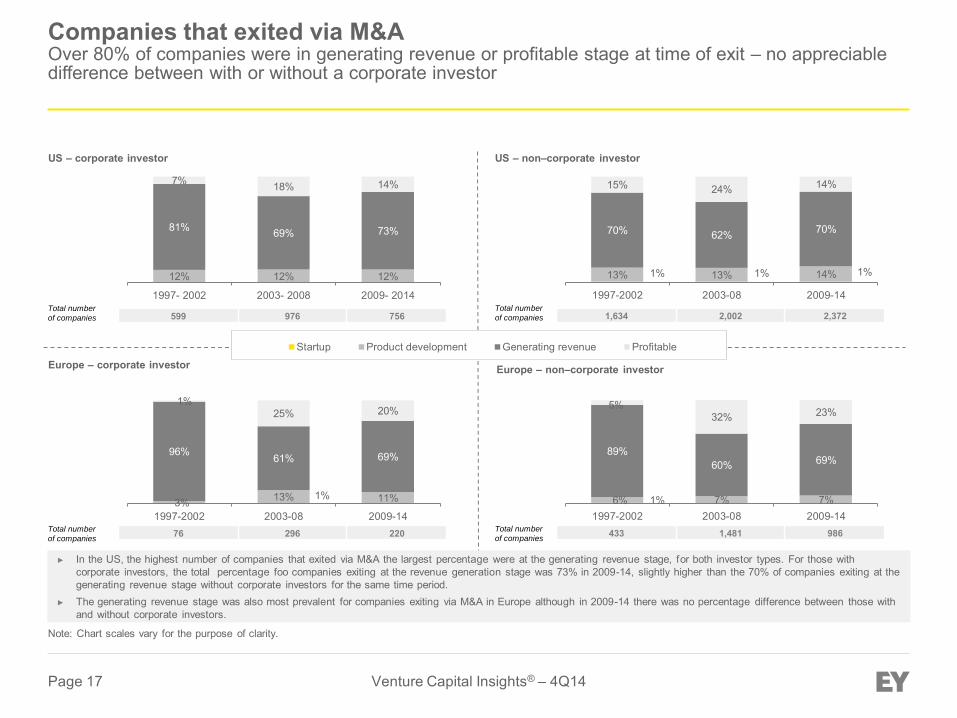
► In the US, the highest number of companies that exited via M&A the largest percentage were at the generating revenue stage, for both investor types. For those withcorporate investors, the total percentage foo companies exiting at the revenue generation stage was 73% in 2009-14, slightly higher than the 70% of companies exiting at the generating revenue stage without corporate investors for the same time period.
► The generating revenue stage was also most prevalent for companies exiting via M&A in Europe although in 2009-14 there was no percentage difference between those withand without corporate investors.
Companies that exited via M&A Over 80% of companies were in generating revenue or profitable stage at time of exit – no appreciable difference between with or without a corporate investor
Page 18 Venture Capital Insights® – 4Q14
24% 29% 19%
76% 71% 81%
1997-2002 2003-08 2009-14
16% 17%
100% 84% 83%
1997-2002 2003-08 2009-14
33 25 16
67 75 84
1997-2002 2003-08 2009-14
33% 35%
100% 67% 65%
1997-2002 2003-08 2009-14
22% 33% 26%
78% 67% 74%
1997-2002 2003-08 2009-148% 9%
29%
92% 91% 71%
1997-2002 2003-08 2009-14
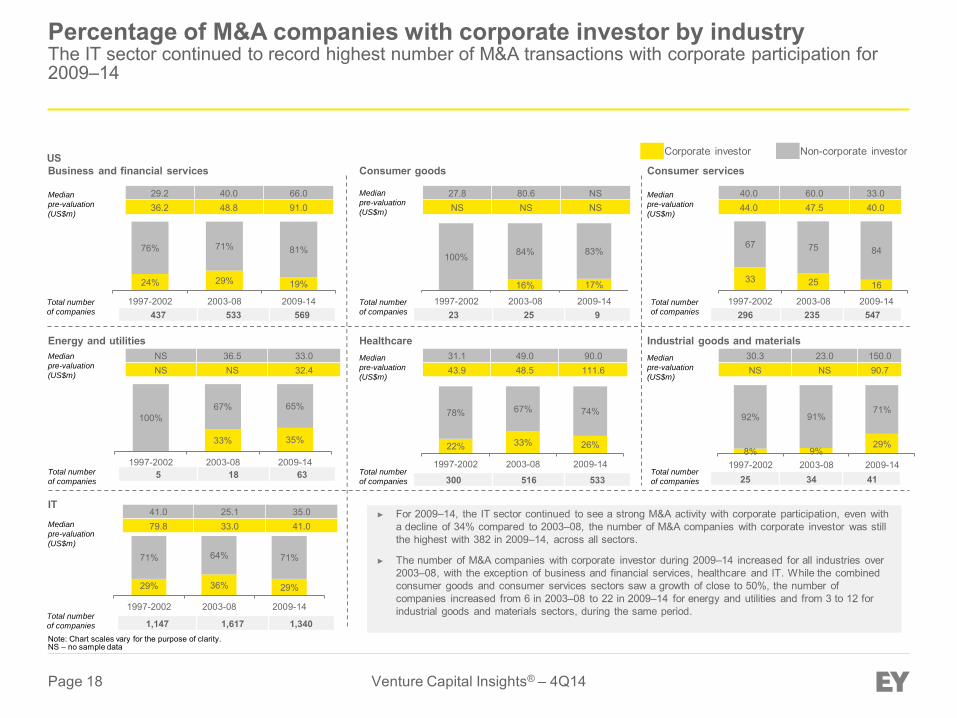
► For 2009–14, the IT sector continued to see a strong M&A activity with corporate participation, even witha decline of 34% compared to 2003–08, the number of M&A companies with corporate investor was stillthe highest with 382 in 2009–14, across all sectors.
► The number of M&A companies with corporate investor during 2009–14 increased for all industries over2003–08, with the exception of business and financial services, healthcare and IT. While the combinedconsumer goods and consumer services sectors saw a growth of close to 50%, the number ofcompanies increased from 6 in 2003–08 to 22 in 2009–14 for energy and utilities and from 3 to 12 forindustrial goods and materials sectors, during the same period.
29.2 40.0 66.0 36.2 48.8 91.0
27.8 80.6 NS NS NS NS
40.0 60.0 33.0 44.0 47.5 40.0
31.1 49.0 90.0 43.9 48.5 111.6
NS 36.5 33.0 NS NS 32.4
30.3 23.0 150.0 NS NS 90.7
US
29% 36% 29%
71% 64% 71%
1997-2002 2003-08 2009-14
41.0 25.1 35.0 79.8 33.0 41.0
Note: Chart scales vary for the purpose of clarity. NS – no sample data
437 533 569 23 25 9 296 235 547
5 18 63 300 516 533 25 34 41
1,147 1,617 1,340
Corporate investor Non-corporate investor
Consumer goods Consumer services Business and financial services
Healthcare Industrial goods and materials Energy and utilities
Median
pre-valuation
(US$m)
IT
Median
pre-valuation
(US$m)
Median
pre-valuation
(US$m)
Median
pre-valuation
(US$m)
Median
pre-valuation
(US$m)
Median
pre-valuation
(US$m)
Median
pre-valuation
(US$m)
Total number
of companies
Total number
of companies
Total number
of companies
Total number
of companies
Total number
of companies
Total number
of companies
Total number
of companies
Percentage of M&A companies with corporate investor by industry The IT sector continued to record highest number of M&A transactions with corporate participation for 2009–14
Page 19 Venture Capital Insights® – 4Q14
12% 11% 17%
88% 89% 83%
1997-02 2003-08 2009-145% 14%
100% 95% 86%
1997-2002 2003-08 2009-14
16% 15% 18%
84% 85% 82%
1997-2002 2003-08 2009-14
15% 32%
100% 85% 68%
1997-2002 2003-08 2009-14
13% 19% 20%
87% 81% 80%
1997-2002 2003-08 2009-1413% 11% 10%
88% 89% 90%
1997-2002 2003-08 2009-14
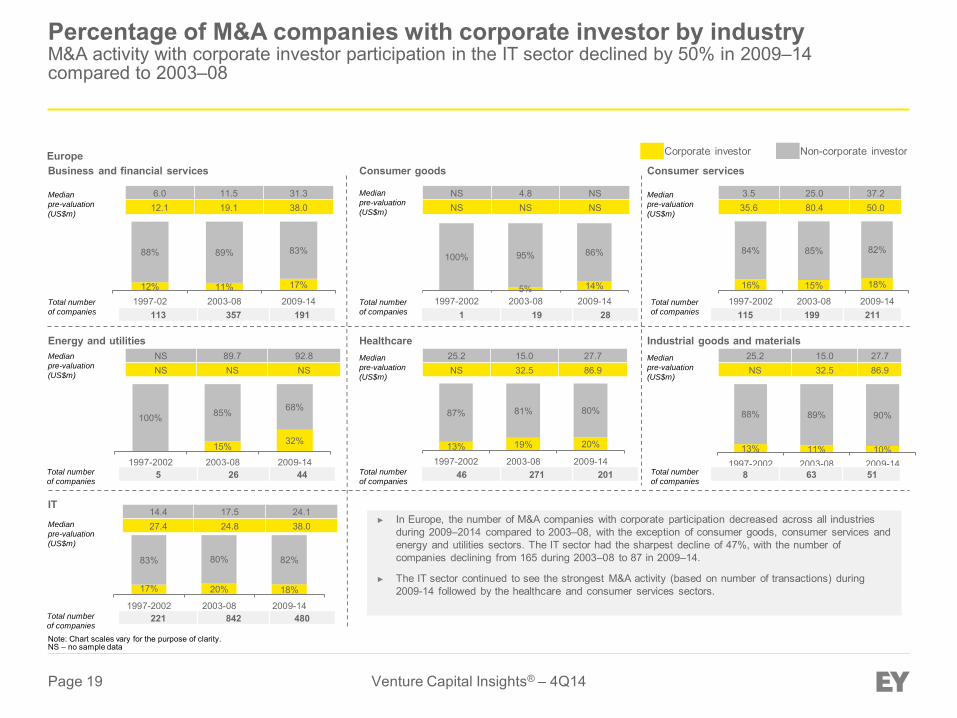
► In Europe, the number of M&A companies with corporate participation decreased across all industriesduring 2009–2014 compared to 2003–08, with the exception of consumer goods, consumer services andenergy and utilities sectors. The IT sector had the sharpest decline of 47%, with the number ofcompanies declining from 165 during 2003–08 to 87 in 2009–14.
► The IT sector continued to see the strongest M&A activity (based on number of transactions) during2009-14 followed by the healthcare and consumer services sectors.
6.0 11.5 31.3 12.1 19.1 38.0
NS 4.8 NS NS NS NS
3.5 25.0 37.2 35.6 80.4 50.0
25.2 15.0 27.7 NS 32.5 86.9
NS 89.7 92.8 NS NS NS
25.2 15.0 27.7 NS 32.5 86.9
Europe
17% 20% 18%
83% 80% 82%
1997-2002 2003-08 2009-14
14.4 17.5 24.1 27.4 24.8 38.0
113 357 191 1 19 28 115 199 211
5 26 44 46 271 201 8 63 51
221 842 480
Corporate investor Non-corporate investor
Consumer goods Consumer services Business and financial services
Healthcare Industrial goods and materials Energy and utilities
Median
pre-valuation
(US$m)
IT
Median
pre-valuation
(US$m)
Median
pre-valuation
(US$m)
Median
pre-valuation
(US$m)
Median
pre-valuation
(US$m)
Median
pre-valuation
(US$m)
Median
pre-valuation
(US$m)
Total number
of companies
Total number
of companies
Total number
of companies
Total number
of companies
Total number
of companies
Total number
of companies
Total number
of companies
Note: Chart scales vary for the purpose of clarity. NS – no sample data
Percentage of M&A companies with corporate investor by industry M&A activity with corporate investor participation in the IT sector declined by 50% in 2009–14 compared to 2003–08
Page 20 Venture Capital Insights® – 4Q14
3 1
2 5
2 4
1997-2002 2003-08 2009-14
US
Note: Chart scales vary for the purpose of clarity. NS – No sample data
Europe China
Canada Israel India
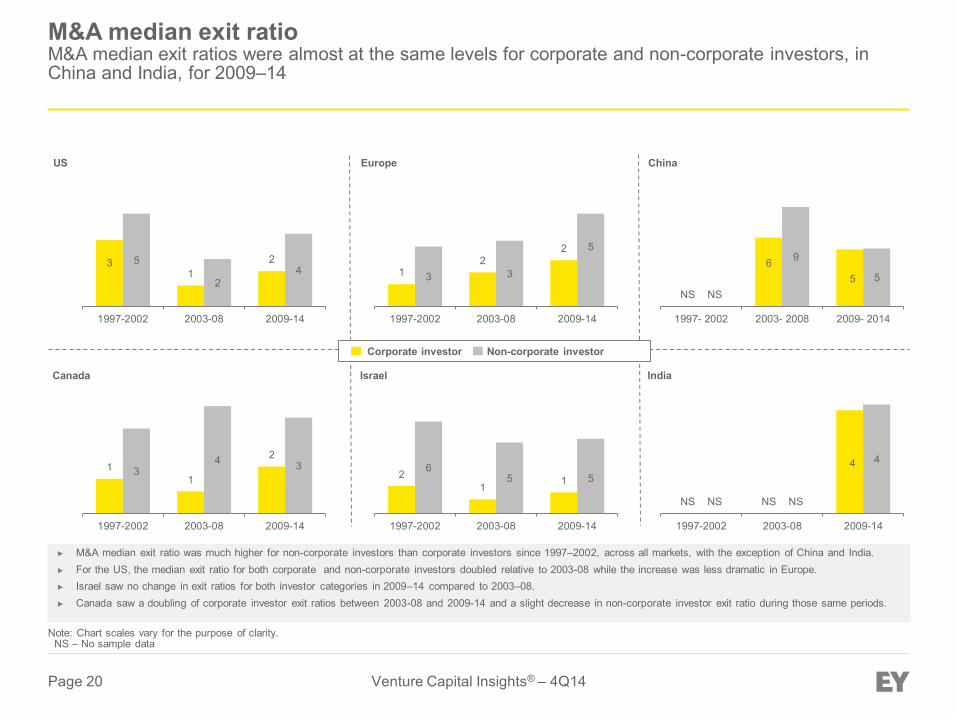
► M&A median exit ratio was much higher for non-corporate investors than corporate investors since 1997–2002, across all markets, with the exception of China and India.► For the US, the median exit ratio for both corporate and non-corporate investors doubled relative to 2003-08 while the increase was less dramatic in Europe.► Israel saw no change in exit ratios for both investor categories in 2009–14 compared to 2003–08.► Canada saw a doubling of corporate investor exit ratios between 2003-08 and 2009-14 and a slight decrease in non-corporate investor exit ratio during those same periods.
1 2
2
3 3
5
1997-2002 2003-08 2009-14
NS
6 5
NS
9
5
1997- 2002 2003- 2008 2009- 2014
1 1
2 3
4 3
1997-2002 2003-08 2009-14
2 1 1
6 5 5
1997-2002 2003-08 2009-14
NS NS
4
NS NS
4
1997-2002 2003-08 2009-14
Corporate investor Non-corporate investor
M&A median exit ratio M&A median exit ratios were almost at the same levels for corporate and non-corporate investors, in China and India, for 2009–14
Page 21 Venture Capital Insights® – 4Q14
Acquired
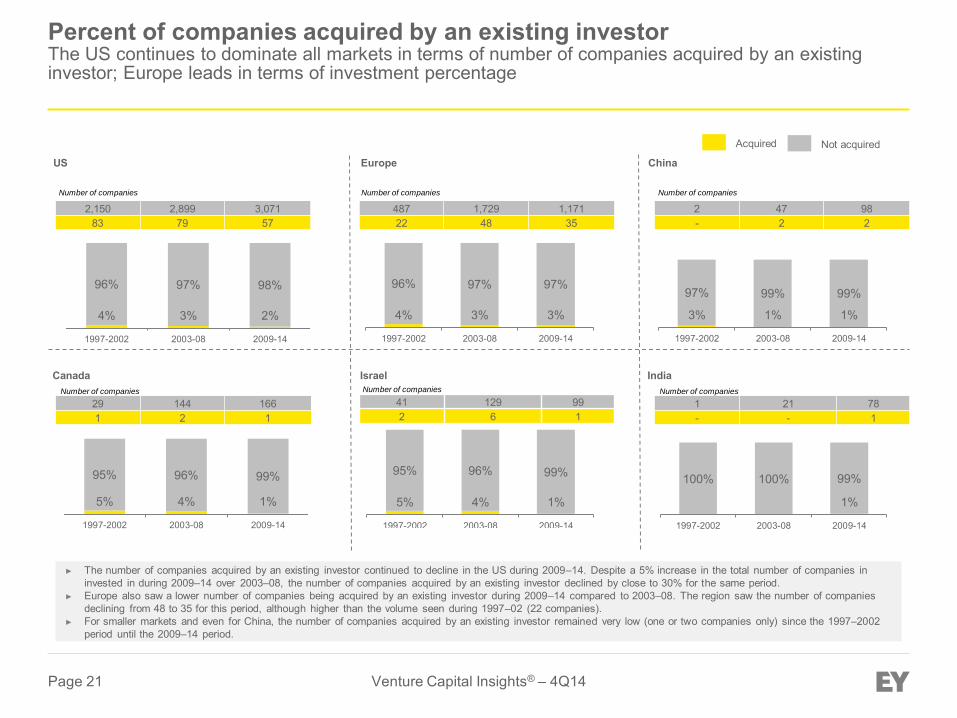
► The number of companies acquired by an existing investor continued to decline in the US during 2009–14. Despite a 5% increase in the total number of companies in invested in during 2009–14 over 2003–08, the number of companies acquired by an existing investor declined by close to 30% for the same period.
► Europe also saw a lower number of companies being acquired by an existing investor during 2009–14 compared to 2003–08. The region saw the number of companies declining from 48 to 35 for this period, although higher than the volume seen during 1997–02 (22 companies).
► For smaller markets and even for China, the number of companies acquired by an existing investor remained very low (one or two companies only) since the 1997–2002 period until the 2009–14 period.
Not acquired
4% 3% 2%
96% 97% 98%
1997-2002 2003-08 2009-14
4% 3% 3%
96% 97% 97%
1997-2002 2003-08 2009-14
5% 4% 1%
95% 96% 99%
1997-2002 2003-08 2009-14
2,150 2,899 3,071 83 79 57
487 1,729 1,171 22 48 35
41 129 99 2 6 1
5% 4% 1%
95% 96% 99%
1997-2002 2003-08 2009-14
3% 1% 1%
97% 99% 99%
1997-2002 2003-08 2009-14
1%
100% 100% 99%
1997-2002 2003-08 2009-14
29 144 166 1 2 1
2 47 98 - 2 2
1 21 78 - - 1
Number of companies Number of companies
Number of companies Number of companies
Number of companies
Number of companies
Percent of companies acquired by an existing investor The US continues to dominate all markets in terms of number of companies acquired by an existing investor; Europe leads in terms of investment percentage
US Europe China
Canada Israel India
Page 22 Venture Capital Insights® – 4Q14
Section 3: Number of deals per year by corporate investor Analysis by geography and sector
Page 23 Venture Capital Insights® – 4Q14
► During 2014, the healthcare, IT and business and financial services sectors were the most active in the US, with the highestnumber of corporate VC funds completing four or more deals.
► Despite a decline in the total number of corporate VC funds in the consumer services sector in the US, the number of fundsmaking four or more deals did not see much change during this period, with five funds in 2013 compared to four in 2014.
► In Europe, during 2014, corporate VC funds continued to invest in a lower number of deals, across all industry sectors. Theproportion of corporate VC funds making four or more deals a year increased by 8% for the IT sector in 2014 compared to nonein 2013.
► In 2014 in China, the business and financial services sector saw corporate VC funds making four or more deals for the first t imein 2014. One out of nine funds made four or more deals in this sector during the year. The consumer services and IT sector sawsix and two corporate VC funds making four or more deals, respectively.
► For Israel, the IT sector was the only sector that has corporate VC funds making four or more deals a year, it also saw only onefund making four or more deals over the past six years.
► In Canada, the corporate VC funds continued to invest in a lower number of deals each year and only invest in one tothree deals.
► Corporate VC funds were more active in the Indian market. in 2014, two corporate VC funds did four or more deals; in 2013,there were three funds which invested in four or more deals. The total number of funds has increased from 9 in 2013 to 14 in2014.
Section 3: Number of deals per year by corporate investor Summary
Page 24 Venture Capital Insights® – 4Q14
98% 97% 93%
89% 93% 92% 89%
2% 3% 7%
11% 7% 8% 11%
2008 2009 2010 2011 2012 2013 2014
Consumer goods Business and financial services Consumer services 42 30 45 44 42 61 45
100% 100% 100% 100% 100% 100% 100%
2008 2009 2010 2011 2012 2013 2014
12 9 8 5 6 7 5
94% 92% 94% 86% 90% 91% 91%
6% 8% 6% 14% 10% 9% 9%
2008 2009 2010 2011 2012 2013 2014
36 24 35 35 42 54 47
90%
100% 97% 97%
100% 100% 100%
10% 3% 3%
2008 2009 2010 2011 2012 2013 2014
Healthcare Energy and utilities Industrial goods and materials 21 15 29 30 17 12 13
88% 91% 85% 92% 84% 87% 79%
12% 9% 15% 8% 16% 13% 21%
2008 2009 2010 2011 2012 2013 2014
57 57 53 65 57 61 61
100% 100% 100% 100% 100% 100% 92%
8%
2008 2009 2010 2011 2012 2013 2014
10 14 17 16 20 16 13
IT
92% 92% 90% 87%
91% 89% 92%
8% 8% 10% 13%
9% 11% 8%
2008 2009 2010 2011 2012 2013 2014
98 72 72 78 80 84 73
# funds: 4 or more deals in year # funds: 1–3 deals in year
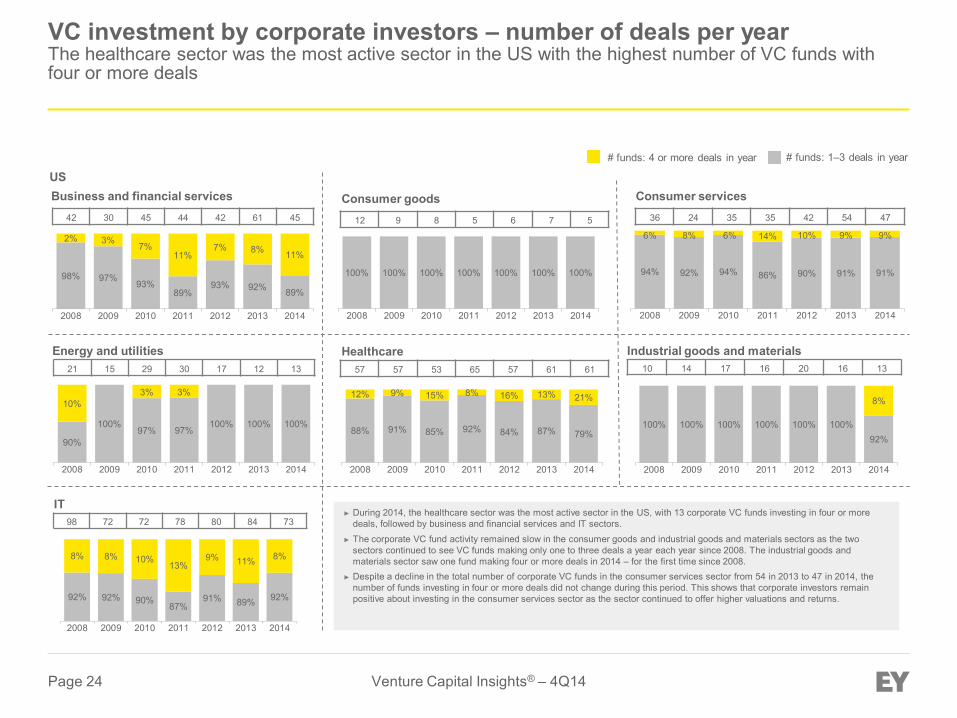
► During 2014, the healthcare sector was the most active sector in the US, with 13 corporate VC funds investing in four or more deals, followed by business and financial services and IT sectors.
► The corporate VC fund activity remained slow in the consumer goods and industrial goods and materials sectors as the two sectors continued to see VC funds making only one to three deals a year each year since 2008. The industrial goods and materials sector saw one fund making four or more deals in 2014 – for the first time since 2008.
► Despite a decline in the total number of corporate VC funds in the consumer services sector from 54 in 2013 to 47 in 2014, the number of funds investing in four or more deals did not change during this period. This shows that corporate investors remain positive about investing in the consumer services sector as the sector continued to offer higher valuations and returns.
US
VC investment by corporate investors – number of deals per year The healthcare sector was the most active sector in the US with the highest number of VC funds with four or more deals
Page 25 Venture Capital Insights® – 4Q14
100% 100% 100%
95%
100% 100% 100%
5%
2008 2009 2010 2011 2012 2013 2014
Consumer goods Business and financial services Consumer services 10 10 9 19 18 19 26
100% 100% 100% 100% 100% 100% 100%
2008 2009 2010 2011 2012 2013 2014
3 5 1 1 2 2 3
89% 93% 83% 87% 83% 79% 78%
11% 7% 17% 13% 17% 21% 22%
2008 2009 2010 2011 2012 2013 2014
18 14 12 15 18 19 18
96% 100%
94% 100%
89%
100% 100%
4% 6% 11%
2008 2009 2010 2011 2012 2013 2014
Healthcare Energy and utilities Industrial goods and materials 25 19 18 7 9 11 5
98% 100% 100% 100% 97%
92% 94%
3% 3% 8% 6%
2008 2009 2010 2011 2012 2013 2014
40 25 32 27 29 24 16
100% 100% 100% 100% 100% 100% 100%
2008 2009 2010 2011 2012 2013 2014
12 12 8 7 2 7 3
IT
95% 94% 98%
94% 92%
100%
92%
5% 6% 2%
6% 8% 8%
2008 2009 2010 2011 2012 2013 2014
41 36 43 31 25 16 13 ► During 2014, corporate VC funds continued to invest in a lower number of deals, across all industry sectors except for slight
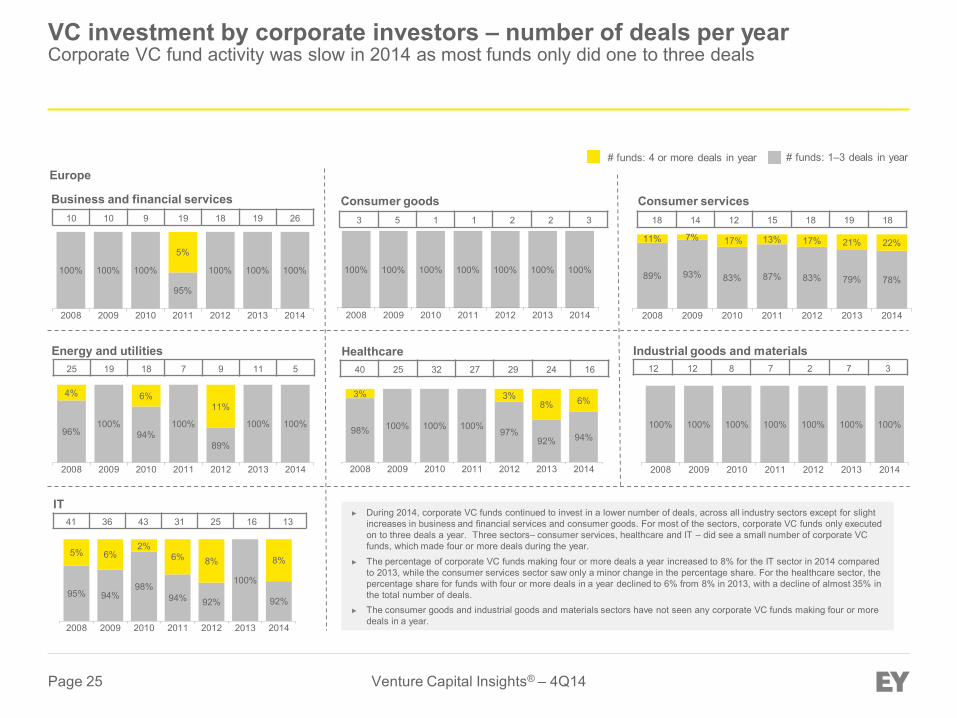
increases in business and financial services and consumer goods. For most of the sectors, corporate VC funds only executed on to three deals a year. Three sectors– consumer services, healthcare and IT – did see a small number of corporate VC funds, which made four or more deals during the year.
► The percentage of corporate VC funds making four or more deals a year increased to 8% for the IT sector in 2014 compared to 2013, while the consumer services sector saw only a minor change in the percentage share. For the healthcare sector, the percentage share for funds with four or more deals in a year declined to 6% from 8% in 2013, with a decline of almost 35% in the total number of deals.
► The consumer goods and industrial goods and materials sectors have not seen any corporate VC funds making four or more deals in a year.
Europe # funds: 4 or more deals in year # funds: 1–3 deals in year
VC investment by corporate investors – number of deals per year Corporate VC fund activity was slow in 2014 as most funds only did one to three deals
Page 26 Venture Capital Insights® – 4Q14
100% 100% 100% 100% 100% 100%
89%
11%
2008 2009 2010 2011 2012 2013 2014
Business and financial services Consumer services
2 3 1 6 4 7 9
88% 100% 100% 90% 100% 100%
54%
13% 10% 46%
2008 2009 2010 2011 2012 2013 2014
8 11 12 20 11 14 13
100% 100%
0% 0% 0% 0% 0%
2008 2009 2010 2011 2012 2013 2014
Healthcare
Energy and utilities
Industrial goods and materials
2 0 1 0 0 0 0
100% 100% 100% 100% 100% 100%
0%
2008 2009 2010 2011 2012 2013 2014
2 3 0 3 1 1 1
100% 100% 100% 100%
0% 0% 0%
2008 2009 2010 2011 2012 2013 2014
1 2 2 1 0 0 0
IT
100% 100% 80% 92% 100% 100% 85%
20% 8% 15%
2008 2009 2010 2011 2012 2013 2014
5 7 5 12 7 12 13
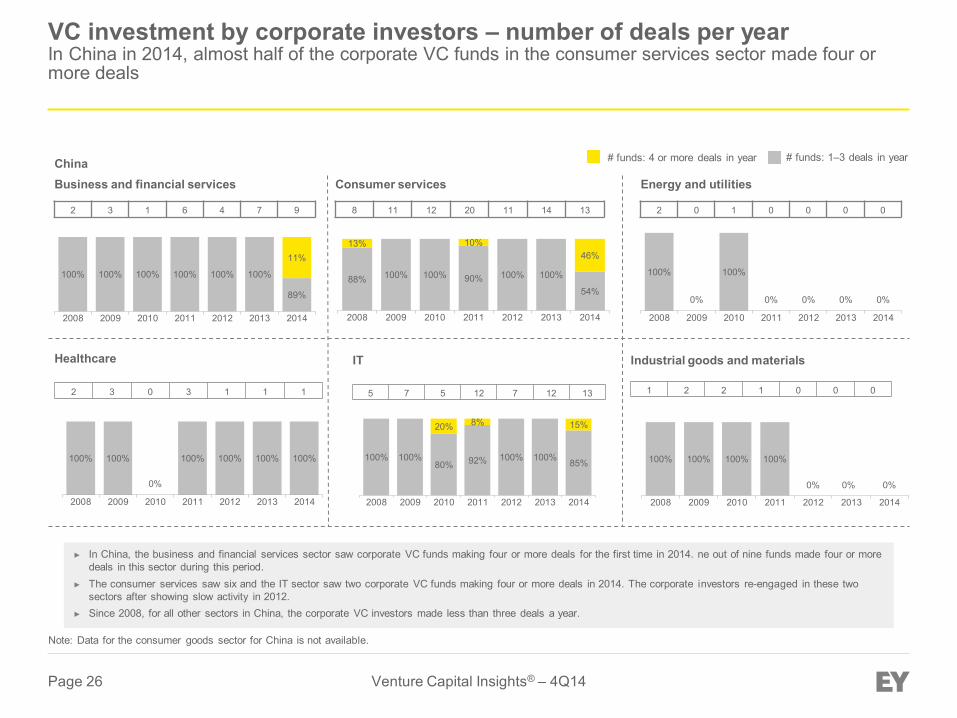
► In China, the business and financial services sector saw corporate VC funds making four or more deals for the first time in 2014. ne out of nine funds made four or more deals in this sector during this period.
► The consumer services saw six and the IT sector saw two corporate VC funds making four or more deals in 2014. The corporate investors re-engaged in these two sectors after showing slow activity in 2012.
► Since 2008, for all other sectors in China, the corporate VC investors made less than three deals a year.
China
Note: Data for the consumer goods sector for China is not available.
# funds: 4 or more deals in year # funds: 1–3 deals in year
VC investment by corporate investors – number of deals per year In China in 2014, almost half of the corporate VC funds in the consumer services sector made four or more deals
Page 27 Venture Capital Insights® – 4Q14
100%
0% 0% 0%
100% 100% 100%
2008 2009 2010 2011 2012 2013 2014
Business and financial services Consumer services
2 0 0 0 1 5 5
0%
100% 100%
0%
100% 100% 100%
2008 2009 2010 2011 2012 2013 2014
0 1 2 0 3 3 5
100%
0%
100% 100%
0%
100% 100%
2008 2009 2010 2011 2012 2013 2014
Healthcare
Energy and utilities
Industrial goods and materials
3 0 2 2 0 2 1
100% 100% 100% 100% 100% 100% 100%
2008 2009 2010 2011 2012 2013 2014
7 6 3 5 9 7 5
100% 100%
0%
100%
0% 0%
100%
2008 2009 2010 2011 2012 2013 2014
2 1 0 1 0 0 1
IT
100% 100% 100% 100% 100% 100%
90%
10%
2008 2009 2010 2011 2012 2013 2014
7 5 5 7 9 8 10
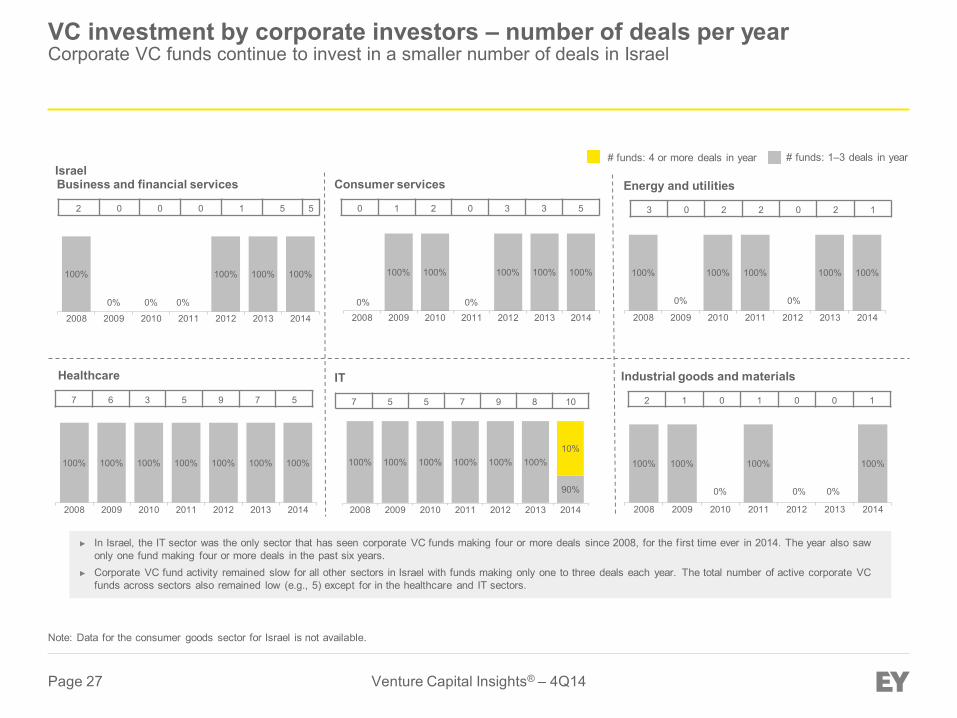
► In Israel, the IT sector was the only sector that has seen corporate VC funds making four or more deals since 2008, for the f irst time ever in 2014. The year also saw only one fund making four or more deals in the past six years.
► Corporate VC fund activity remained slow for all other sectors in Israel with funds making only one to three deals each year. The total number of active corporate VC funds across sectors also remained low (e.g., 5) except for in the healthcare and IT sectors.
Israel
Note: Data for the consumer goods sector for Israel is not available.
# funds: 4 or more deals in year # funds: 1–3 deals in year
VC investment by corporate investors – number of deals per year Corporate VC funds continue to invest in a smaller number of deals in Israel
Page 28 Venture Capital Insights® – 4Q14
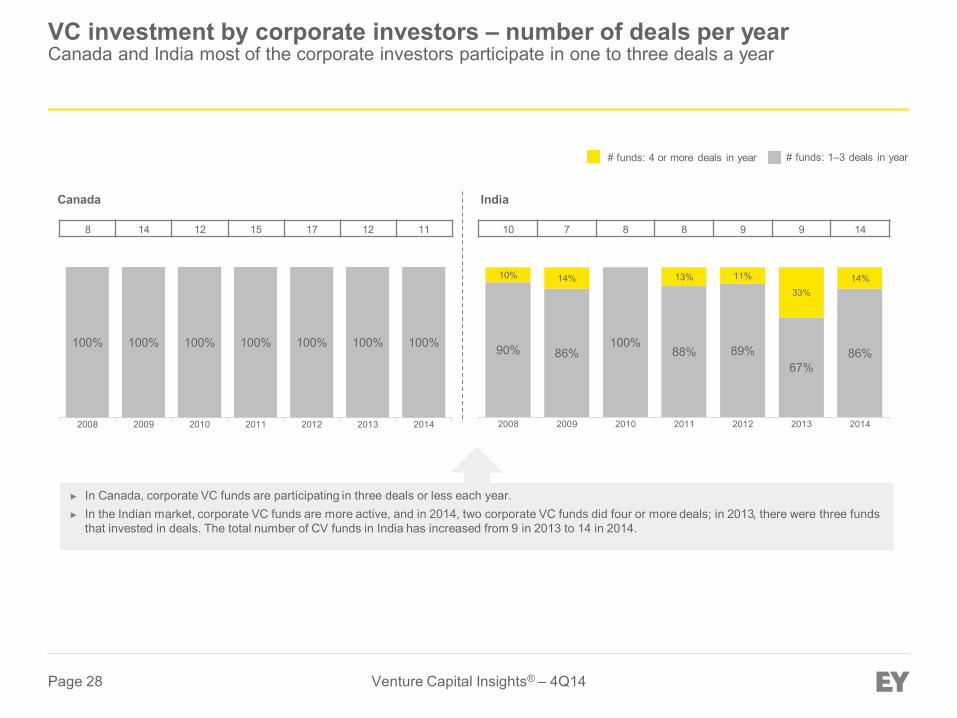
► In Canada, corporate VC funds are participating in three deals or less each year.► In the Indian market, corporate VC funds are more active, and in 2014, two corporate VC funds did four or more deals; in 2013, there were three funds
that invested in deals. The total number of CV funds in India has increased from 9 in 2013 to 14 in 2014.
90% 86% 100%
88% 89% 67%
86%
10% 14% 13% 11%
33% 14%
2008 2009 2010 2011 2012 2013 2014
10 7 8 8 9 9 14
India
100% 100% 100% 100% 100% 100% 100%
2008 2009 2010 2011 2012 2013 2014
8 14 12 15 17 12 11
Canada
# funds: 4 or more deals in year # funds: 1–3 deals in year
VC investment by corporate investors – number of deals per year Canada and India most of the corporate investors participate in one to three deals a year
Page 29 Venture Capital Insights® – 4Q14
Appendix
Page 30 Venture Capital Insights® – 4Q14
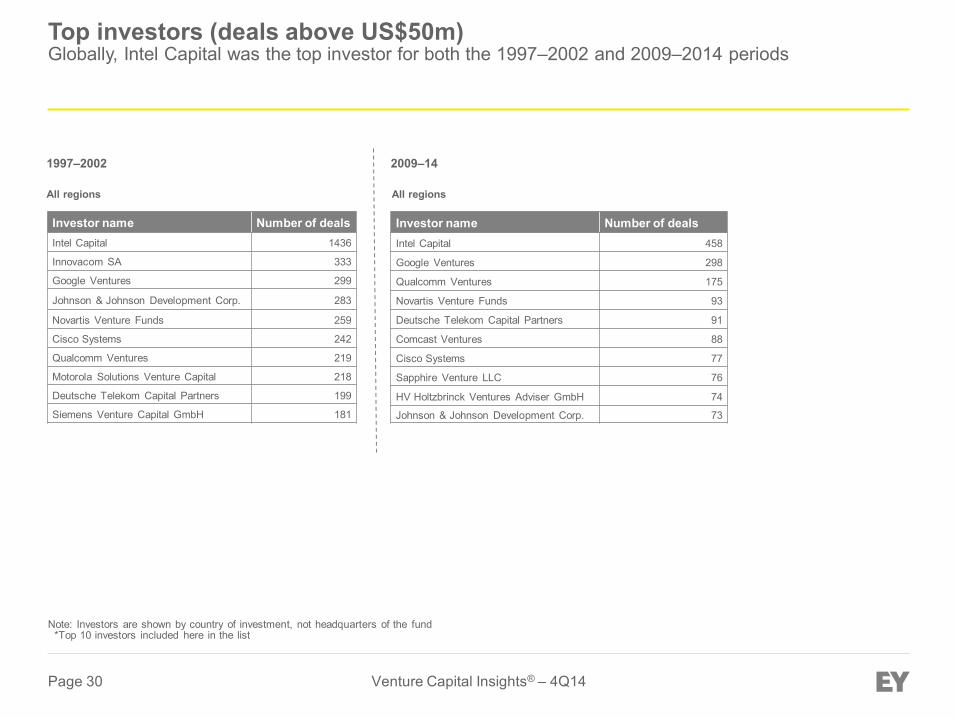
All regions
Investor name Number of deals Intel Capital 1436
Innovacom SA 333
Google Ventures 299
Johnson & Johnson Development Corp. 283
Novartis Venture Funds 259
Cisco Systems 242
Qualcomm Ventures 219
Motorola Solutions Venture Capital 218
Deutsche Telekom Capital Partners 199
Siemens Venture Capital GmbH 181
All regions
Investor name Number of deals Intel Capital 458
Google Ventures 298
Qualcomm Ventures 175
Novartis Venture Funds 93
Deutsche Telekom Capital Partners 91
Comcast Ventures 88
Cisco Systems 77
Sapphire Venture LLC 76
HV Holtzbrinck Ventures Adviser GmbH 74
Johnson & Johnson Development Corp. 73
1997–2002 2009–14
Note: Investors are shown by country of investment, not headquarters of the fund *Top 10 investors included here in the list
Top investors (deals above US$50m) Globally, Intel Capital was the top investor for both the 1997–2002 and 2009–2014 periods
Page 31 Venture Capital Insights® – 4Q14
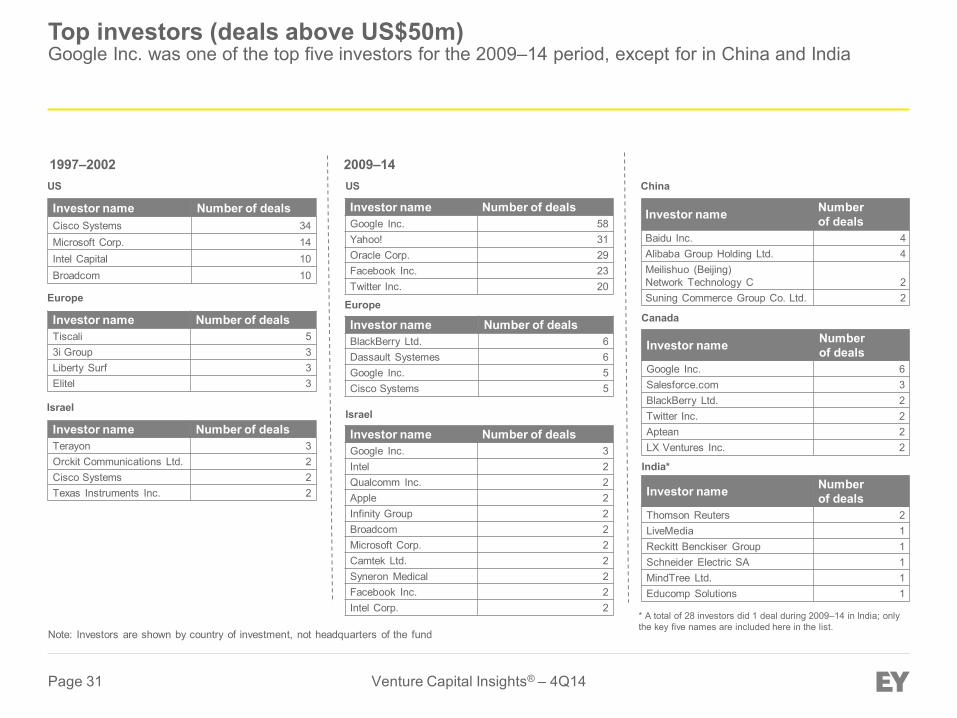
US
Investor name Number of deals Cisco Systems 34 Microsoft Corp. 14 Intel Capital 10 Broadcom 10
Europe
Investor name Number of deals Tiscali 5 3i Group 3 Liberty Surf 3 Elitel 3
US
Investor name Number of deals Google Inc. 58 Yahoo! 31 Oracle Corp. 29 Facebook Inc. 23 Twitter Inc. 20
Europe Canada
1997–2002 2009–14 China
Investor name Number of deals
Baidu Inc. 4 Alibaba Group Holding Ltd. 4 Meilishuo (Beijing) Network Technology C 2 Suning Commerce Group Co. Ltd. 2
Investor name Number of deals BlackBerry Ltd. 6 Dassault Systemes 6 Google Inc. 5 Cisco Systems 5
Investor name Number of deals
Google Inc. 6 Salesforce.com 3 BlackBerry Ltd. 2 Twitter Inc. 2 Aptean 2 LX Ventures Inc. 2
Israel
India*
Investor name Number of deals Google Inc. 3 Intel 2 Qualcomm Inc. 2 Apple 2 Infinity Group 2 Broadcom 2 Microsoft Corp. 2 Camtek Ltd. 2 Syneron Medical 2 Facebook Inc. 2 Intel Corp. 2
Investor name Number of deals
Thomson Reuters 2 LiveMedia 1 Reckitt Benckiser Group 1 Schneider Electric SA 1 MindTree Ltd. 1 Educomp Solutions 1
Israel
Investor name Number of deals Terayon 3 Orckit Communications Ltd. 2 Cisco Systems 2 Texas Instruments Inc. 2
* A total of 28 investors did 1 deal during 2009–14 in India; only the key five names are included here in the list.
Note: Investors are shown by country of investment, not headquarters of the fund
Top investors (deals above US$50m) Google Inc. was one of the top five investors for the 2009–14 period, except for in China and India
Page 32 Venture Capital Insights® – 4Q14
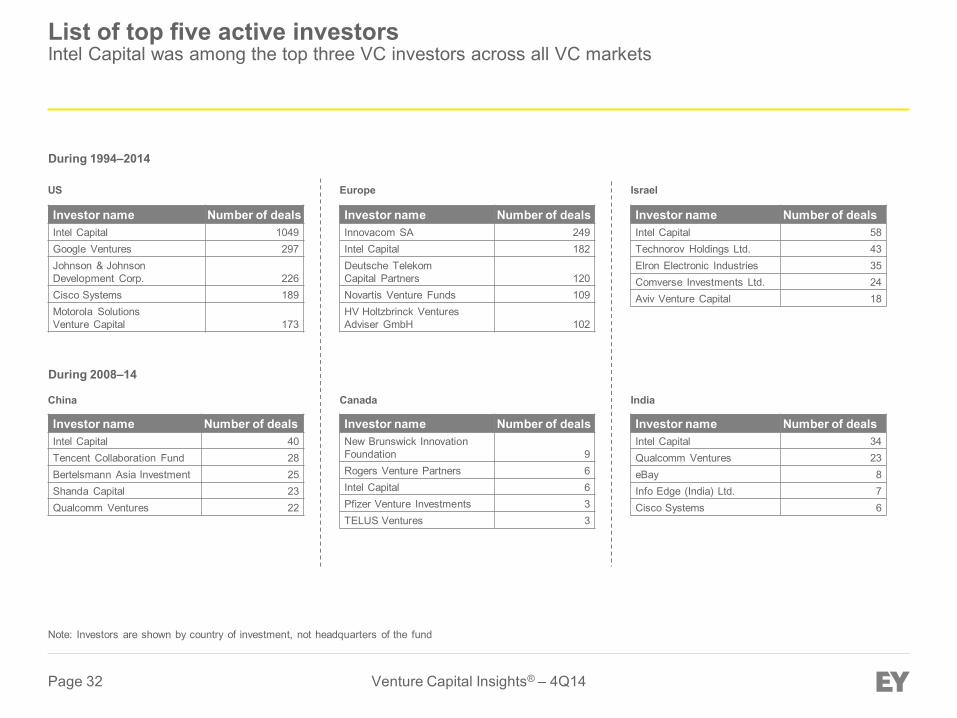
List of top five active investors Intel Capital was among the top three VC investors across all VC markets
US
Investor name Number of deals Intel Capital 1049 Google Ventures 297 Johnson & Johnson Development Corp. 226 Cisco Systems 189 Motorola Solutions Venture Capital 173
Investor name Number of deals Innovacom SA 249 Intel Capital 182 Deutsche Telekom Capital Partners 120 Novartis Venture Funds 109 HV Holtzbrinck Ventures Adviser GmbH 102
Europe
China India
During 1994–2014
During 2008–14
Israel
Investor name Number of deals Intel Capital 40 Tencent Collaboration Fund 28 Bertelsmann Asia Investment 25 Shanda Capital 23 Qualcomm Ventures 22
Investor name Number of deals Intel Capital 34 Qualcomm Ventures 23 eBay 8 Info Edge (India) Ltd. 7 Cisco Systems 6
Canada
Investor name Number of deals New Brunswick Innovation Foundation 9 Rogers Venture Partners 6 Intel Capital 6 Pfizer Venture Investments 3 TELUS Ventures 3
Investor name Number of deals Intel Capital 58 Technorov Holdings Ltd. 43 Elron Electronic Industries 35 Comverse Investments Ltd. 24 Aviv Venture Capital 18
Note: Investors are shown by country of investment, not headquarters of the fund
Page 33 Venture Capital Insights® – 4Q14
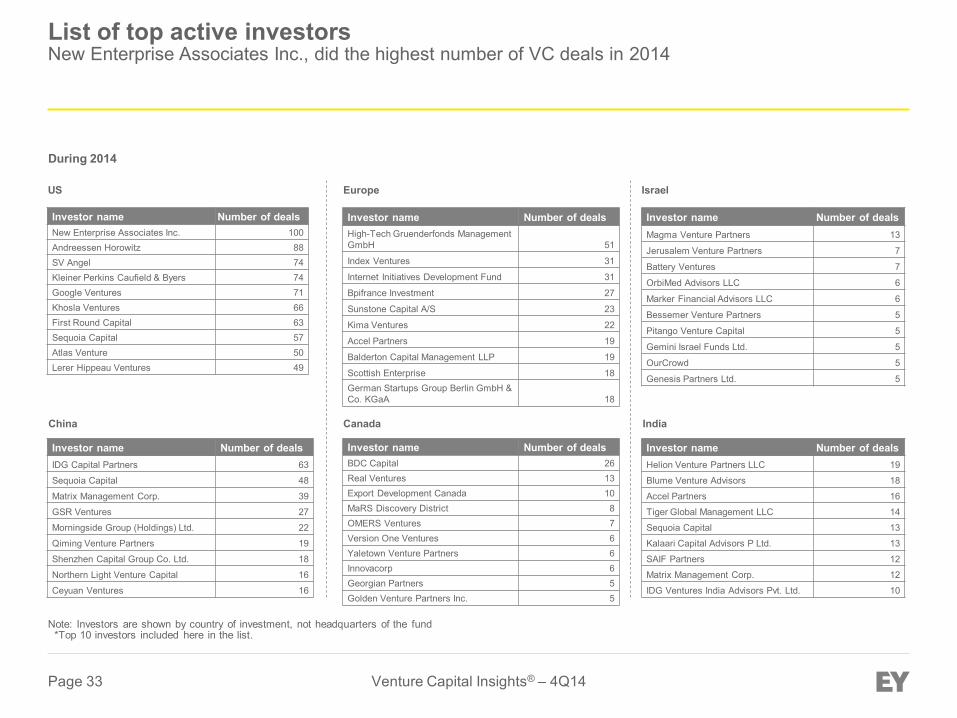
List of top active investors New Enterprise Associates Inc., did the highest number of VC deals in 2014
US
Investor name Number of deals New Enterprise Associates Inc. 100 Andreessen Horowitz 88 SV Angel 74 Kleiner Perkins Caufield & Byers 74 Google Ventures 71 Khosla Ventures 66 First Round Capital 63 Sequoia Capital 57 Atlas Venture 50 Lerer Hippeau Ventures 49
Investor name Number of deals High-Tech Gruenderfonds Management GmbH 51
Index Ventures 31
Internet Initiatives Development Fund 31
Bpifrance Investment 27
Sunstone Capital A/S 23
Kima Ventures 22
Accel Partners 19
Balderton Capital Management LLP 19
Scottish Enterprise 18 German Startups Group Berlin GmbH & Co. KGaA 18
Europe
China India
During 2014
Israel
Investor name Number of deals IDG Capital Partners 63
Sequoia Capital 48
Matrix Management Corp. 39
GSR Ventures 27
Morningside Group (Holdings) Ltd. 22
Qiming Venture Partners 19
Shenzhen Capital Group Co. Ltd. 18
Northern Light Venture Capital 16
Ceyuan Ventures 16
Investor name Number of deals Helion Venture Partners LLC 19
Blume Venture Advisors 18
Accel Partners 16
Tiger Global Management LLC 14
Sequoia Capital 13
Kalaari Capital Advisors P Ltd. 13
SAIF Partners 12
Matrix Management Corp. 12
IDG Ventures India Advisors Pvt. Ltd. 10
Canada
Investor name Number of deals BDC Capital 26 Real Ventures 13 Export Development Canada 10 MaRS Discovery District 8 OMERS Ventures 7 Version One Ventures 6 Yaletown Venture Partners 6 Innovacorp 6 Georgian Partners 5 Golden Venture Partners Inc. 5
Investor name Number of deals Magma Venture Partners 13
Jerusalem Venture Partners 7
Battery Ventures 7
OrbiMed Advisors LLC 6
Marker Financial Advisors LLC 6
Bessemer Venture Partners 5
Pitango Venture Capital 5
Gemini Israel Funds Ltd. 5
OurCrowd 5
Genesis Partners Ltd. 5
Note: Investors are shown by country of investment, not headquarters of the fund *Top 10 investors included here in the list.
Page 34 Venture Capital Insights® – 4Q14
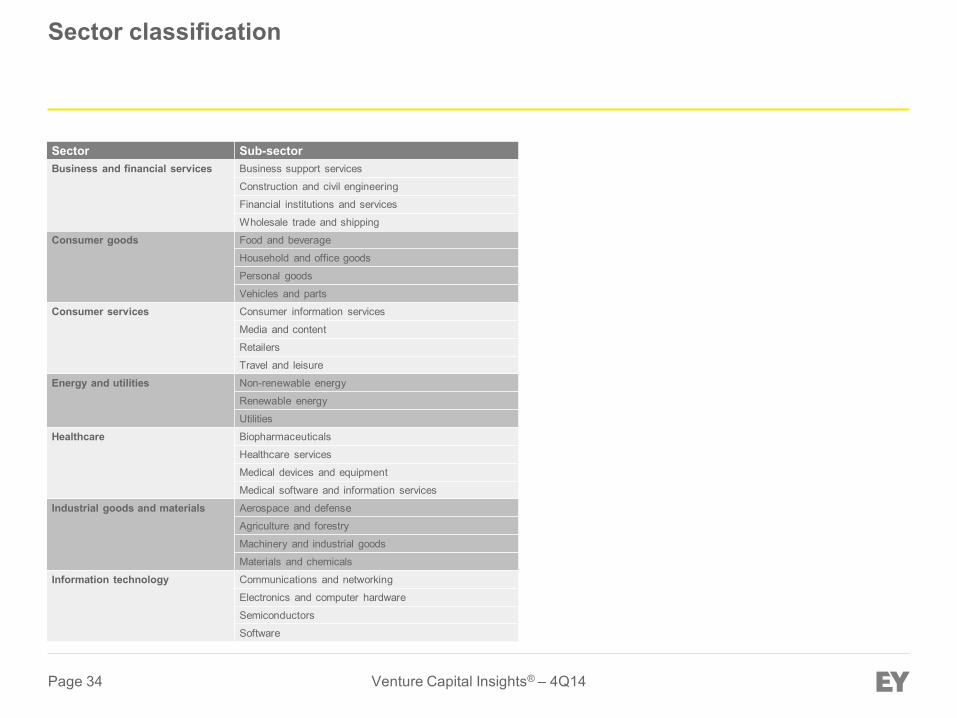
Sector classification
Sector Sub-sector Business and financial services Business support services
Construction and civil engineering
Financial institutions and services
Wholesale trade and shipping
Consumer goods Food and beverage
Household and office goods
Personal goods
Vehicles and parts
Consumer services Consumer information services
Media and content
Retailers
Travel and leisure
Energy and utilities Non-renewable energy
Renewable energy
Utilities
Healthcare Biopharmaceuticals
Healthcare services
Medical devices and equipment
Medical software and information services
Industrial goods and materials Aerospace and defense
Agriculture and forestry
Machinery and industrial goods
Materials and chemicals
Information technology Communications and networking
Electronics and computer hardware
Semiconductors
Software
Page 35 Venture Capital Insights® – 4Q14
EY’s global venture capital advisory group leadership network
Operations Sandra Feldner Vandergriff +1 213 977 3253 [email protected]
EMEIA Demet Ozdemir +90 212 408 5405 [email protected]
Asia-Pacific Mike Anghie +61 8 9429 2324 [email protected]
Greater China Lawrence Lau +862 1222 82816 [email protected]
France and Luxembourg Franck Sebag +33 1 46 93 73 76 [email protected]
Global Leader Bryan Pearce +1 617 585 0499 [email protected]
Global Vice Chair Global SGM Leader Maria Pinelli +44 20 7980 0960 [email protected]
Japan Toshikazu Nakazawa +81 3 3503 1557 [email protected]
Israel Oren Bar-On +97 2 3568 7102 [email protected]
US Leader Jeff Grabow +1 408 947 5607 [email protected]
Mexico Juan R. Ramirez +52 55 5283 1341 [email protected]
United Kingdom Ian Oliver +44 20 1189 281197 [email protected]
India Mayank Rastogi +91 22 6192 0850 [email protected]
Markets Miki Carlton +1 415 984 7061 [email protected]

All data contained in this is sourced to Dow Jones VentureSource unless otherwise noted.
EY | Assurance | Tax | Transactions | Advisory About EY EY is a global leader in assurance, tax, transaction and advisory services. The insights and quality services we deliver help build trust and confidence in the capital markets and in economies the world over. We develop outstanding leaders who team to deliver on our promises to all of our stakeholders. In so doing, we play a critical role in building a better working world for our people, for our clients and for our communities. EY refers to the global organization, and may refer to one or more, of the member firms of Ernst & Young Global Limited, each of which is a separate legal entity. Ernst & Young Global Limited, a UK company limited by guarantee, does not provide services to clients. For more information about our organization, please visit ey.com. About EY’s Strategic Growth Markets Network EY’s worldwide Strategic Growth Markets Network is dedicated to serving the changing needs of high-growth companies. For more than 30 years, we’ve helped many of the world’s most dynamic and ambitious companies grow into market leaders. Whether working with international, mid-cap companies or early stage, venture-backed businesses, our professionals draw upon their extensive experience, insight and global resources to help your business succeed. ey.com/sgm © 2015 EYGM Limited. All Rights Reserved. EYG no: CY0884 1503-1423445 ED None This material has been prepared for general informational purposes only and is not intended to be relied upon as accounting, tax, or other professional advice. Please refer to your advisors for specific advice.
ey.com


