42
[Type text] Corporates in growth mode despite global headwinds Global Market Perspective | Q1 2016

[Type text]
Corporates in growth mode
despite global headwinds
Global Market Perspective | Q1 2016
COPYRIGHT © JONES LANG LASALLE IP, INC. 2016. All Rights Reserved 2
Global Market Perspective, First Quarter 2016
Global Market Perspective
Contents
Corporates in Growth Mode Despite Global Headwinds ............................................................................................... 3
Global Economy ................................................................................................................................................................ 6
Real Estate Capital Markets ............................................................................................................................................. 8
Investment Volumes ............................................................................................................................................................ 8
Capital Values and Yields ................................................................................................................................................. 13
Corporate Occupiers ...................................................................................................................................................... 14
Global Real Estate Health Monitor ................................................................................................................................. 16
Office Markets ................................................................................................................................................................. 17
Office Demand Dynamics ................................................................................................................................................. 17
Office Supply Trends ......................................................................................................................................................... 20
Office Rental Trends ......................................................................................................................................................... 24
Retail Markets .................................................................................................................................................................. 27
Industrial Warehousing Markets .................................................................................................................................... 29
Hotel Markets ................................................................................................................................................................... 30
Residential Markets ........................................................................................................................................................ 34
Key Investment Transactions in Q4 2015 ..................................................................................................................... 36
Illustrative Office Occupational Transactions in Q4 2015 ........................................................................................... 40

Global Market Perspective, First Quarter 2016
COPYRIGHT © JONES LANG LASALLE IP, INC. 2016. All Rights Reserved 3
Corporates in Growth Mode Despite Global Headwinds
The occupational markets take the driving seat
JLL’s Global Market Perspective has chronicled the journey of the world’s dominant real estate markets since the
depths of the Great Recession in 2008, a journey that has been led throughout by strengthening investment markets as
a huge weight of money targets real estate assets. But, as we move into 2016, the dynamics have started to shift, with
the occupational markets now registering greater momentum. Market fundamentals are improving across all major
global regions and property sectors, and recent leasing activity has surprised on the upside. Geopolitical and economic
headwinds will weigh on business activity over the coming months, but for now, corporate occupiers remain in growth
mode which, combined with tightening supply, will support rental value growth during 2016 in most major markets.
Global Investment and Leasing Markets
Year-on-year change. Leasing volumes relate to offices
Source: JLL, February 2016
Investor activity slows in final quarter of 2015 as headwinds stiffen
Meanwhile, the pace of investment into commercial properties globally slowed slightly in the final quarter of 2015,
alongside other asset classes. Full-year 2015 transaction volumes, at US$704 billion, were just shy of 2014 levels, but
the strength of the U.S. dollar has underplayed the true level of market activity. At fixed exchange rates, full-year
volumes would be US$765 billion, 8% ahead of 2014 and a new record, surpassing the previous peak of US$758 billion
in 2007.
As we move into 2016, investor sentiment seems to be more cautious, with a combination of global economic and
political uncertainty, six years of consistent transactional growth, a turning credit cycle and record-high pricing in many
core markets making decisions more challenging. However, there is certainly no sign of investors pulling back in any
drastic way and yields continue to compress to new lows; rather we should expect growth from these levels to be more
measured. It should be remembered that globally we are at near peak levels and it is only currency fluctuations holding
the market back. With this backdrop we forecast 2016 volumes to be broadly in line with 2015 at between US$720-730
billion, with any potential upside (0%-5%) coming from the deployment of the significant capital from numerous sources
still to be allocated to the sector.
Investment Leasing
2015
2016
2014
0-5% +5%
-1% +8%
+21% +1%

COPYRIGHT © JONES LANG LASALLE IP, INC. 2016. All Rights Reserved 4
Global Market Perspective, First Quarter 2016
Direct Commercial Real Estate Investment, 2006-2015
Source: JLL, February 2016
Office leasing volumes exceed expectations
Global office leasing volumes in the final quarter of 2015 were 14% higher year-on-year and, as a result, full-year
volumes exceeded expectations, registering 8% growth on 2014 levels. The Asia Pacific region has seen a strong
rebound, with its full-year 2015 leasing volumes 19% higher. Leasing activity has also been notably robust in Europe,
posting 13% growth in 2015. Meanwhile, the U.S. has maintained its robust leasing activity, with nearly half of volumes
comprising expansion demand.
Demand for offices has been healthiest in innovation-oriented economies such as Boston, Berlin and Bangalore – but
is also extending to a more diversified range of cities. Despite the much documented slowdown in the China economy,
leasing activity has been remarkably buoyant in Shanghai and Beijing. India (and notably Delhi) has also posted high
levels of activity.
Notwithstanding the geopolitical concerns, there will continue to be progress towards expansion demand during 2016 as
tenants move away from cost containment, consolidation and renewals. As a consequence, global office leasing
volumes are projected to be around 5% higher than 2015, with Asia Pacific recording the strongest uplift over the year.
Tightening office supply supporting rental growth
Another 20 basis points were shaved off the global office vacancy rate in Q4, which stood at 12.1% at the end of 2015.
A further fall is in prospect during 2016, particularly in the U.S. and Europe. With a modest increase in new deliveries
expected in 2016 and 2017, the global vacancy rate is projected to settle at around 12% during the next two years.
Rental growth on prime office assets accelerated during the second half of 2015 as supply tightened and demand
strengthened. Growth of 3.7% was recorded for the full-year (across 26 major markets), matching the levels of 2014.
Further rental uplifts of 3%-4% across major markets are anticipated for 2016, with Boston and Tokyo vying for the top
positions.
0
100
200
300
400
500
600
700
800
Americas EMEA Asia Pacific Global
US
$ bi
llion
s
2006 2007 2008 2009 2010 2011 2012 2013 2014 2015 2016 (F)
xx%
~5%
~0%
5-10%
0-5%
Projected Change, 2015-2016

Global Market Perspective, First Quarter 2016
COPYRIGHT © JONES LANG LASALLE IP, INC. 2016. All Rights Reserved 5
Global Office Demand – Gross Leasing Trends, 2012-2016
24 markets in Europe; 44 markets in the U.S; select markets in Asia Pacific Source: JLL, February 2016
Consumer optimism boosts retail sales
Improved consumer confidence and healthy retail sales are fuelling optimism in the U.S., Europe and selectively in Asia
Pacific. Several U.S. markets, primarily gateway cities, are now witnessing conditions typical of a peaking market as
rents see assertive growth and vacancy continues to compress. Meanwhile, UK regional markets and Berlin
experienced the strongest rental growth over the year’s final quarter in Europe, while increases were also recorded in the
recovery markets of Italy and Spain. In Asia Pacific the demand picture remains varied, with the acceleration in retail
spending in Australia contributing to leasing demand, although rental growth has been limited in most regional markets
over the quarter.
Technology and realignment of logistics networks heightens demand
The ongoing robust growth in online sales and the wider impact of technology trends are driving the need for realignment
of supply chain networks and boosting global warehousing demand. In the U.S., absorption is still outpacing new supply
with continued velocity likely across nearly every market in 2016. Similarly, sustained strong occupier demand in Europe
resulted in record take-up volumes in 2015. In Asia Pacific, third-party logistics companies and e-commerce retailers are
bolstering rental levels in China and Tokyo.
Robust growth in global hotel investment
2015 marked the second-highest year on record for hotel transactions globally, with trades topping US$86 billion and
posting 50% growth on 2014. With 2015 surpassing all expectations in terms of the amount of capital flowing into the
hotel sector, we expect transaction volumes in 2016 to reach US$70 billion, marking the second-highest level of the
cycle.
Unprecedented vitality in U.S. rental apartments
Rental apartments are still outperforming in the U.S., with rental growth accelerating to its highest pace this cycle and all
major markets registering positive absorption. Institutional investment volumes continue to grow in Europe, with
Germany achieving a record year for transaction volumes and the UK market expected to gather speed through 2016.
Sales activity has continued to decline in Dubai, although falls in prices have been modest. In Asia, an accommodative
policy stance, including a cut in interest rates, has provided support for high-end sales volumes in China.
35
36
37
38
39
40
41
42
2012 2013 2014 2015 2016
mill
ions
sq
m
Pro
ject
ion

COPYRIGHT © JONES LANG LASALLE IP, INC. 2016. All Rights Reserved 6
Global Market Perspective, First Quarter 2016
Global Economy
Global headwinds return in early 2016
Despite fairly upbeat expectations 12 months ago, 2015 marked a continuation of a relatively disappointing global growth
trend stretching back from 2011 rather than the anticipated lift-off. There were brighter spots, as lower oil prices helped
to revive domestic demand in many of the developed economies. But the outlook deteriorated through 2015, largely
because of worsening prospects in the key emerging markets and the start of 2016 has been a time of heightened
anxiety as plunging equity prices signalled a lurch into bear market territory for the first time since the financial crisis.
China worries have been one of the primary causes as poor sentiment figures and sharp declines on its stock markets
rekindled concerns about the pace of economic slowdown. Despite this, China was the only one of our major markets to
see a forecast upgrade since the last quarter. However, this was in part due to stronger-than-expected demand in late
2015, and unease remains about negative spillovers to emerging markets from the world’s second largest economy.
Even so, these have yet to impact in India, where growth is forecast to stay above 7%, driving Asian activity for a
second consecutive year.
Meanwhile, the developed economies received another fillip in the New Year, as geopolitical rumblings sent oil prices
tumbling below US$30pb. This positive shock to incomes and inflation has been particularly helpful for the recovery in
Europe, where growth reached a four-year high last year. Recent downgrades to the outlook for the Eurozone are
modest and a consequence of the weaker external environment. Although the UK continues to perform well, concerns
about momentum have grown and reflect softer post-election data, Brexit uncertainties and worries about the underlying
balance of recovery.
Elsewhere, U.S. growth expectations have been edged down slightly following less buoyant data in late 2015, even as
the Fed announced its first interest rate rise in almost a decade. Nevertheless, the U.S. remains the most dynamic of
the larger developed economies, with GDP set to rise by 2.6% this year. By contrast, Japan’s economy still disappoints.
After 0.7% growth during 2015, this year’s forecast has been sharply downgraded to 1.2% as sluggish domestic demand
in Japan continues to undermine prospects.
GDP Projections for 2016 in Major Economies – Recent Movements
Australia China France Germany India Japan UK U.S.
October 2015 2.8 5.9 1.7 2.2 7.5 1.8 2.6 2.8
January (Latest) 2.7 6.3 1.5 2.2 7.4 1.2 2.4 2.6
Change (bps) -10 +40 -20 0 -10 -60 -20 -20 Source: Oxford Economics, January 2016
Fed signals the upturn in the global cycle, but few will follow in 2016
The decision to raise the U.S. Federal Funds rates by 25 basis points on 16 December ended months of feverish
speculation. This was a historic move, arriving nine years after the previous hike and ending an unprecedented period
of stable rates globally. Early market reaction was favourable after clear signalling by the authorities. The decision was
based on the confidence about the robustness of the economic recovery and concerns that the tightening of labour
markets will threaten inflation further out.
It appears that the Fed’s move will mark a temporary divergence in Central Bank policy. This difference in part reflects
varying speeds of economic recovery and inflation rates. Of the other major Central Banks, none look set to follow in the
short term. Japan is expected to maintain its zero rate stance for the foreseeable future, while the ECB recently
Global Market Perspective, First Quarter 2016
COPYRIGHT © JONES LANG LASALLE IP, INC. 2016. All Rights Reserved 7
extended its special liquidity programme and is unlikely to consider rate rises much before 2017. Even the Bank of
England has back-pedalled on previously bullish rate talk. With subdued domestic inflation, the market expectation is
now that the UK will not tighten before the end of 2016, at the earliest.
Global demand lift-off in 2016
As noted earlier, the global economy has been stuck in a low-growth rut almost since the turn of the decade and 2015
was no exception. The building contribution from the advanced economies over recent years brought hope that growth
would accelerate (albeit slowly), but this has been thwarted by the reversal in emerging market fortunes. The latest
forecasts now show a steadily improving profile for world growth over the next two years, as demand in both emerging
and developed economies picks up, though short-term risks will persist especially in the developing world.
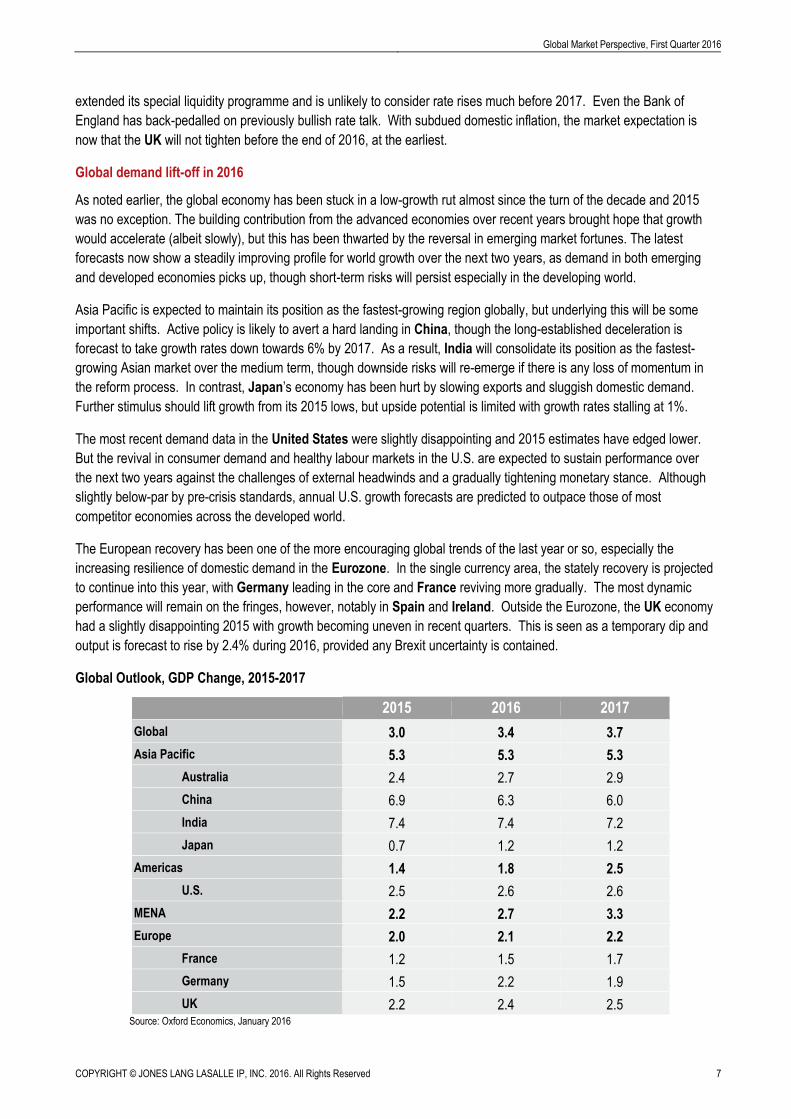
Asia Pacific is expected to maintain its position as the fastest-growing region globally, but underlying this will be some
important shifts. Active policy is likely to avert a hard landing in China, though the long-established deceleration is
forecast to take growth rates down towards 6% by 2017. As a result, India will consolidate its position as the fastest-
growing Asian market over the medium term, though downside risks will re-emerge if there is any loss of momentum in
the reform process. In contrast, Japan’s economy has been hurt by slowing exports and sluggish domestic demand.
Further stimulus should lift growth from its 2015 lows, but upside potential is limited with growth rates stalling at 1%.
The most recent demand data in the United States were slightly disappointing and 2015 estimates have edged lower.
But the revival in consumer demand and healthy labour markets in the U.S. are expected to sustain performance over
the next two years against the challenges of external headwinds and a gradually tightening monetary stance. Although
slightly below-par by pre-crisis standards, annual U.S. growth forecasts are predicted to outpace those of most
competitor economies across the developed world.
The European recovery has been one of the more encouraging global trends of the last year or so, especially the
increasing resilience of domestic demand in the Eurozone. In the single currency area, the stately recovery is projected
to continue into this year, with Germany leading in the core and France reviving more gradually. The most dynamic
performance will remain on the fringes, however, notably in Spain and Ireland. Outside the Eurozone, the UK economy
had a slightly disappointing 2015 with growth becoming uneven in recent quarters. This is seen as a temporary dip and
output is forecast to rise by 2.4% during 2016, provided any Brexit uncertainty is contained.
Global Outlook, GDP Change, 2015-2017
2015 2016 2017
Global 3.0 3.4 3.7
Asia Pacific 5.3 5.3 5.3
Australia 2.4 2.7 2.9
China 6.9 6.3 6.0
India 7.4 7.4 7.2
Japan 0.7 1.2 1.2
Americas 1.4 1.8 2.5
U.S. 2.5 2.6 2.6
MENA 2.2 2.7 3.3
Europe 2.0 2.1 2.2
France 1.2 1.5 1.7
Germany 1.5 2.2 1.9
UK 2.2 2.4 2.5 Source: Oxford Economics, January 2016
COPYRIGHT © JONES LANG LASALLE IP, INC. 2016. All Rights Reserved 8
Global Market Perspective, First Quarter 2016
Real Estate Capital Markets
Investment Volumes
Final quarter disappoints as headwinds stiffen into 2016
Alongside other asset classes in the final quarter of 2015, the pace of investment into commercial properties globally
slowed slightly compared to a year ago. There has also been a noticeable shift in investor sentiment, particularly for
fully-priced core assets, where the number of genuine buyers has dwindled. Transactional activity in the fourth quarter
was US$209 billion, 8% lower than the record final quarter of 2014. However, full-year volumes have only been
marginally affected, with 2015 totalling US$704 billion, just 1% below 2014. The strength of the U.S. dollar continues to
underplay the true level of market activity; with fixed exchange rates, full-year volumes would be US$765 billion, 8%
ahead of 2014 and a new record, surpassing the previous peak of US$758 billion in 2007.
Real estate remains a force as the Fed awakens
Despite a pullback in the global numbers, the Americas region as a whole set a new transactional record in 2015,
although some momentum was lost in the final quarter where US$85 billion was transacted, 9% below a year ago. This
brought full-year activity to US$314 billion, 4% above 2014 and ahead of the 2007 previous peak of US$304 billion. All
of the outperformance came from the U.S. where activity was 9% ahead of 2014 at US$294 billion, itself a new record.
Elsewhere, the volatile nature of commodity-driven and emerging market economies was demonstrated with volumes
lower in each and every other market we track, Canada being the best of the rest with volumes 21% lower.
European outperformance united, despite growing list of problems to diverge performance
While in U.S. dollar terms European volumes were 4% lower in 2015 at US$267 billion, in local currency they were much
more buoyant with 14% growth over 2014 levels. The final quarter of the year once again proved to be pivotal; volumes
stood 12% higher than Q4 2014, setting a new record of €81 billion, with Germany and the Nordics being the standout
markets.
Greater China real estate markets seem to welcome the volatility
Asia Pacific full-year volumes were 6% lower than 2014 at US$124 billion with the final quarter 19% down on a year ago.
However, it was a mixed picture across the region with weaker currencies in Japan and Australia playing a part.
Despite increased capital market and political volatility, China, Hong Kong and Taiwan bounced back strongly from
2014 with volumes up 47%, 66% and 18% respectively.
Risks look to be on the downside as the New Year starts
The final quarter of 2015 was characterised by a slight moderation in investment activity globally, albeit from the record
highs of Q4 2014. As we move into 2016, investor sentiment seems to be more cautious with a combination of
economic and political uncertainty, six years of consistent transactional growth, a turning credit cycle and record-high
pricing in many core markets making decisions more challenging. However, there is certainly no sign of investors pulling
back; rather we should anticipate growth from these levels to be more measured. With this backdrop, we expect 2016
global volumes to be broadly in line with 2015 at between US$720-730 billion, with any potential upside (0%-5%) coming
from the deployment of the significant capital from numerous sources still to be allocated to the sector.

Global Market Perspective, First Quarter 2016
COPYRIGHT © JONES LANG LASALLE IP, INC. 2016. All Rights Reserved 9
Direct Commercial Real Estate Investment – Regional Volumes, 2014-2015
Source: JLL, February 2016
Direct Commercial Real Estate Investment – Largest Markets, 2014-2015
Source: JLL, February 2016
REGIONS IN FOCUS
New record volumes for Americas in 2015
The Americas set a new high-water mark in total transaction volumes in 2015. Total volumes in the fourth quarter
reached US$85 billion, up 12% on the third quarter, although down 9% from the frenetic pace of the fourth quarter of
2014. Indeed, the forward growth in deal activity decelerated over the course of the year as investors digested the
tremendous uplift in volumes and pricing to-date this cycle. Still, the Americas did soar to a new annual record
transaction volume of US$314 billion for 2015, an increase of 4% over 2014 and above the historical record-high
reached in 2007. Given the continuing momentum in the asset class, and sustained strong and diverse investor
demand, we forecast that total volumes will grow by 5%-10% in the Americas region overall in 2016.
US$ Billions Q3 15 Q4 15
% change
Q3 15-Q4 15 Q4 14
% change
Q4 14-Q4 15 2014 2015
% change
2014-2015
Americas 76 85 12% 94 -9% 302 314 4%
EMEA 65 89 38% 91 -2% 278 267 -4%
Asia Pacific 32 36 11% 44 -19% 131 124 -6%
TOTAL 173 209 21% 228 -8% 711 704 -1%
TOTAL Fixed FX 188 223 19% 228 -2% 711 765 8%
US$ Billions Q3 15 Q4 15
% change
Q3 15-Q4 15 Q4 14
% change
Q4 14-Q4 15 2014 2015
% change
2014-2015
U.S. 70.6 77.8 10% 85.4 -9% 269.1 293.7 9%
UK 20.8 27.7 33% 34.0 -19% 106.9 95.3 -11%
Germany 14.6 17.4 19% 16.5 5% 46.3 52.7 14%
France 9.0 10.7 19% 11.4 -6% 33.1 27.9 -16%
China 7.3 10.5 44% 7.0 49% 19.2 28.3 47%
Australia 7.8 6.2 -21% 7.9 -22% 26.8 21.1 -21%
Japan 8.9 5.8 -35% 14.8 -61% 43.4 34.0 -22%
Canada 4.4 5.0 14% 6.7 -26% 19.0 15.1 -21%
Hong Kong 2.7 4.5 67% 2.2 106% 7.2 12.0 66%
Norway 0.7 4.4 562% 2.3 88% 6.2 9.5 54%
Italy 1.7 3.6 104% 3.2 12% 7.0 9.2 31%
Netherlands 1.4 3.5 142% 2.9 21% 9.5 8.1 -14%
Sweden 3.0 3.4 15% 4.6 -26% 13.9 11.1 -20%
Spain 2.9 2.9 3% 3.0 -2% 9.7 10.6 9%
South Korea 1.8 2.3 25% 4.9 -53% 10.8 8.0 -26%
Taiwan 0.4 2.2 420% 0.9 150% 3.2 3.8 18%
Poland 1.0 2.2 118% 1.6 42% 4.3 4.2 -2%
Austria 0.3 2.0 638% 1.0 105% 3.6 2.5 -31%
Switzerland 0.5 1.9 240% 1.0 83% 3.1 4.3 38%
Singapore 1.3 1.9 41% 1.2 55% 8.1 7.0 -13%
Finland 0.9 1.8 103% 0.9 113% 2.9 4.5 53%
Belgium 1.8 1.6 -16% 1.5 1% 4.1 5.3 27%
Ireland 1.3 1.4 8% 1.6 -11% 5.4 4.5 -17%
New Zealand 0.6 1.1 91% 1.9 -39% 4.5 2.7 -39%
Mexico 0.4 1.1 191% 0.8 42% 7.5 2.4 -68%
Brazil 0.6 1.1 90% 0.8 32% 5.7 2.5 -55%
COPYRIGHT © JONES LANG LASALLE IP, INC. 2016. All Rights Reserved 10
Global Market Perspective, First Quarter 2016
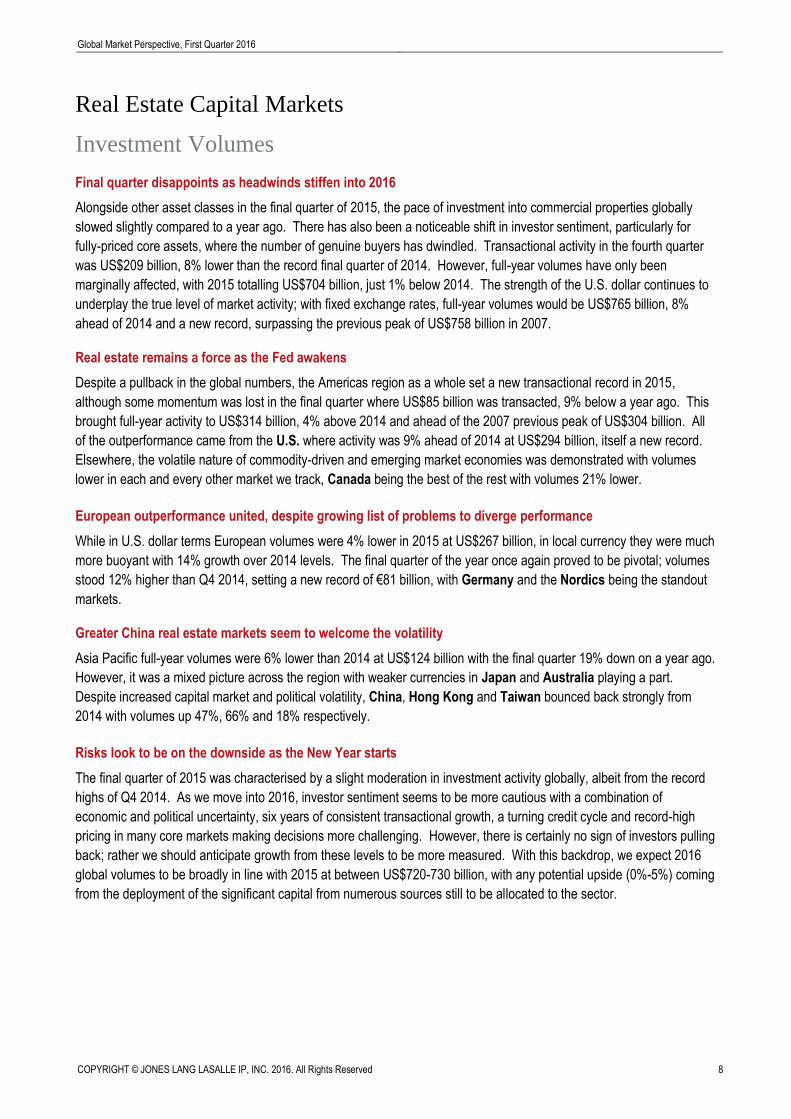
U.S. cities dominate top investment destinations
Following the record transaction volumes registered in the Americas, the top global investment destinations for 2015
were dominated by U.S. cities. New York had its strongest year on record, overtaking London to take the premier
position with full-year volumes of US$53 billion, up 20% on 2014. U.S. secondary markets also generated significant
interest, with Seattle, Atlanta and Phoenix all recording sharp growth in investment activity. Demand for prime assets
in the ‘Super Cities’ continued to be substantial, with London and Paris rounding out the leading three global
destinations with volumes of US$39 billion and US$20 billion respectively.
Direct Commercial Real Estate Investment, Top 20 Cities, 2015
Source: JLL, February 2016
Investment momentum in EMEA during 2015 slow in Q4 in U.S. dollar terms, though volumes up in euros
EMEA investment volumes reached US$267 billion in 2015, a 4% drop on 2014 in U.S. dollar terms. Q4 2015 volumes
came in at US$89 billion, which represented a 2% year-on-year fall on Q4 2014. The dollar numbers mask a significant
gain in local currency terms, however, with volumes for 2015 a full 14% higher in euro terms. The continued pressure on
the euro has had the combined effect of pushing investors out of riskier assets and pushing out the interest rate cycle in
Europe and the UK. In this context, safe-haven asset classes such as real estate have remained in strong demand,
though with yields for prime assets either at or around the previous cycle’s lows, the market is becoming increasingly
selective in terms of asset allocation.
Germany outperforms as UK and France lag in Q4
Among the top three European markets, there was quite a significant divergence in performance between the UK,
France and Germany over the course of 2015. The German market was particularly strong, with 14% year-on-year
growth in U.S. dollar terms with Q4 volumes at US$17.4 billion. By contrast, the UK saw a marked drop in the final
quarter of the year relative to 2014, down 19% in dollar terms, which pulled full-year volumes down by 11% against
2014. France also had a comparatively weak final quarter with volumes at US$10.7 billion, which resulted in a full-year
16% fall from 2014’s total.
0 5 10 15 20 25 30 35 40 45 50 55
Berlin
Toronto
Phoenix
Singapore
Sydney
Dallas
Atlanta
San Jose
San Francisco
Seattle
Hong Kong
Washington, DC
Boston
Shanghai
Chicago
Tokyo
Los Angeles
Paris
London
New York
Americas
EMEA
Asia Pacific
US$ billions
Global Market Perspective, First Quarter 2016
COPYRIGHT © JONES LANG LASALLE IP, INC. 2016. All Rights Reserved 11
Gains for Nordics and Southern Europe, while Benelux flat
The momentum that slipped in the Nordic region during Q3 2015 returned with force in the final quarter with
US$10.1 billion of investment transactions. This reflects a quarter-on-quarter pick up of 83% across the region, largely
due to a 562% increase in Norway. Meanwhile, investment in Southern Europe was up 18% in U.S. dollar terms for
2015, with US$20.1 billion of investment over the year (the key growth markets being Portugal and Italy). In the
Benelux countries, volumes in dollar terms were lower for the full year by 3%, although the region saw a pickup in euro
terms of 16% with €13.1 billion of investment.
Asia Pacific full-year 2015 investment volumes continue to climb in local currency terms
Investment volumes across Asia Pacific’s commercial real estate markets finished the full-year 2015 slightly down (by
6% year-on-year) at US$124 billion. This is largely in line with our revised full-year estimate of US$125 billion, which
took into consideration the strength of the U.S. dollar. In local currency terms, investment volumes continue to climb as
the weight of capital allocated to investing in real estate within the region remains high. Cross-border investors
maintained their activity on both sides of the ledger in Q4 2015, accounting for 39% of total investment volumes.
Although the year has started with renewed volatility in the global financial markets, we are confident that investment
volumes across Asia Pacific will remain stable this year as more institutional investors look towards multi-asset portfolios
in light of subdued performance across traditional asset classes such as equities and fixed income. Hence, we forecast
growth of 5% year-on-year to US$130 billion in 2016. The start of U.S. interest rate normalisation could see assets trade,
with cyclical investors taking profits and long-term income-seeking investors taking new positions as yield spreads over
benchmark rates continue to be attractive in some markets.
Foreign investor interest remains high in Australia and Japan
Investment volumes in Australia reached US$6.2 billion in the final quarter of 2015, down 22% year-on-year. Full-year
volumes fell 21%, on the back of a record 2014 and weakness in the Australian dollar. Cross-border purchasers were
active throughout Q4 2015, accounting for 54% of deals by volume. In Japan, J-REITs transaction volumes for Q4 were
much lower than the first three quarters, with the weak finish pushing full-year 2015 volumes down 22% year-on-year to
US$34 billion. We anticipate that international investor demand will buoy transaction volumes in 2016, supported by a
competitive exchange rate, the low cost of borrowing and a good yield spread.
China closed a record 2015 year with US$28 billion worth of deals
Despite the macro headlines, transaction volumes in China closed the year robustly, reaching US$10.5 billion in Q4, up
49% year-on-year. Although equities and the renminbi were under pressure, the real estate investment market
rebounded strongly, driven by domestic corporates and financial institutions as well as foreign PERE funds. Looking
ahead, we do not foresee any shortage of fund availability as domestic players should remain active.
Hong Kong and Singapore end year strongly, while India falls on lack of availability of quality assets
Hong Kong’s investment activity in Q4 2015 doubled on a year-on-year basis to US$4.5 billion, with full-year volumes
up 66% to US$12 billion, led by Chinese investors looking to invest offshore. Singapore also ended 2015 on a strong
note with investment volumes in Q4 up 55% year-on-year at US$1.9 billion, although full-year volumes were down 13%
to US$7 billion amid weak real estate fundamentals. Elsewhere, India’s transaction volumes fell 81% year-on-year to
only US$0.2 billion due to a lack of quality assets available.

COPYRIGHT © JONES LANG LASALLE IP, INC. 2016. All Rights Reserved 12
Global Market Perspective, First Quarter 2016
Direct Commercial Real Estate Investment – Quarterly Trends, 2007-2015
Source: JLL, February 2016
Prime Office Yield Shift, 2014-2015
Source: JLL, February 2016
0
30
60
90
120
150
180
210
240Q
107
Q20
7
Q30
7
Q40
7
Q10
8
Q20
8
Q30
8
Q40
8
Q10
9
Q20
9
Q30
9
Q40
9
Q11
0
Q21
0
Q31
0
Q41
0
Q11
1
Q21
1
Q31
1
Q41
1
Q11
2
Q21
2
Q31
2
Q41
2
Q11
3
Q21
3
Q31
3
Q41
3
Q11
4
Q21
4
Q31
4
Q41
4
Q11
5
Q21
5
Q31
5
Q41
5
Americas EMEA Asia Pacific Rolling Four-Quarter Average
US
$ bi
llion
s
205
107110100
113
7369666666
100
118120
159
204
190
119
91
110100
163
41 4335
108
124
146
211
143
166174
228
154
168173
209
-100 -50 0 50
TokyoSydney
SingaporeShanghai
SeoulMumbai
Hong KongBeijing
Mexico CitySao Paulo
Washington DCToronto
San FranciscoNew York
Los AngelesChicagoBoston
StockholmParis
MoscowMilan
MadridLondon
FrankfurtBrussels
Q3 2015 - Q4 2015
Q4 2014 - Q3 2015
Basis point change
Am
eric
asE
uro
pe
Asi
a P
acif
ic

Global Market Perspective, First Quarter 2016
COPYRIGHT © JONES LANG LASALLE IP, INC. 2016. All Rights Reserved 13
Capital Values and Yields
Further yield compression
Robust demand for core assets compressed yields yet further during Q4 2015. The mean prime office yield (across 21
major office markets) stood at 4.83% in the fourth quarter, a fall of 200 basis points since mid-2009. Sydney and
Brussels registered 15-25 basis points’ compression during Q4, while Tokyo’s yields came in another 10 basis points to
stand at a low of 3.0%. With more solid market fundamentals and high levels of unplaced capital, prime yields could
tighten further during 2016, although our projections indicate a broadly flat trend in yields during 2016.
Capital appreciation expected to slow in 2016
Capital value appreciation on prime assets (across 26 markets) stood at 8.5% in 2015, broadly matching the levels of
2014. Strongest year-on-year growth was recorded in Madrid, Stockholm, Sydney and Tokyo.
Annual capital appreciation is expected to slow to about 4% in 2016, driven primarily by income growth. Star capital
value performers in 2016 are likely to be the Boston, Madrid, Brussels, Tokyo and Shanghai office markets.
Prime Office Yields, 2007-2015
*Across 21 Major Office Markets
Source: JLL, February 2016
-30
-10
10
30
50
70
Q12007
Q22007
Q32007
Q42007
Q12008
Q22008
Q32008
Q42008
Q12009
Q22009
Q32009
Q42009
Q12010
Q22010
Q32010
Q42010
Q12011
Q22011
Q32011
Q42011
Q12012
Q22012
Q32012
Q42012
Q12013
Q22013
Q32013
Q42013
Q12014
Q22014
Q32014
Q42014
Q12015
Q22015
Q32015
Q42015
Yield Compression (bps)
4.8
5.2
5.6
6.0
6.4
6.8
7.2
Mean Prime Office Yields*
5.44%
4.83%
%
bps
6.83%
COPYRIGHT © JONES LANG LASALLE IP, INC. 2016. All Rights Reserved 14
Global Market Perspective, First Quarter 2016
Corporate Occupiers
Occupier expansion despite geopolitical concerns
In the context of the increased financial market volatility and rising geopolitical risks that have marked the start of 2016,
recent surveys have highlighted executives’ concerns over the geopolitical instability and security issues – this will
continue to weigh heavily on corporates over the coming months. Nonetheless, at least for now, corporate occupiers
remain in growth mode across the majority of global markets. JLL’s corporate sentiment surveys reveal little sign of any
slowing in the robust and broad-based growth of occupier leasing activity.
‘Access to talent’ driving location strategy
‘Access to talent’ is increasingly driving corporate real estate and location strategy, with corporate occupiers becoming
far more forensic in their analysis of talent clusters. In the U.S., many companies are making greater efforts to align
location strategy with the future talent requirements of their businesses, with downtown and urban submarkets the most
desired locations as companies pursue millennial talent and renewed corporate energy.
In Asia Pacific, where proximity is often key to employee retention, tech companies are more and more occupying
traditional CBD premises which were formerly occupied by the financial community. Well-connected locations that are
close to amenities and talent are also seeing competition for space intensifying more rapidly in Europe, as portfolio
optimisation continues unabated and companies seek to better align location strategies with talent clusters. High-quality
space options remain constrained in many markets, and this increased pressure on availability is driving occupier
mobility, which is likely to become more widespread over 2016.
M&A resulting in portfolio disruption
Mergers and acquisitions continue to cause churn and change in corporate portfolios. With cross-border M&A activity at
record levels in 2015, a growing number of companies are seeing disruption of their real estate portfolios. With
divestments also at record highs, expansionary activity will continue to be matched with restructuring and disposals.
Technology reshaping real estate
Technology and the future of work are further factors reshaping occupier demand for real estate. The ubiquity of digital
technology is having a profound impact on real estate, with the weighting of tech and media companies and disruptive
digital industries dramatically increasing across global office markets. In the U.S., tech companies accounted for 20% of
all office leasing in 2015, more than all government, insurance and consulting firms combined. The expansion of tech
and digital industry companies is also occurring rapidly in Asia Pacific, with major U.S. entities finding their Asian
equivalents such as Flipkart (India’s Amazon) to be even more aggressive.
Flexible working solutions expanding rapidly
Digitisation and emerging technologies are also paving the way for more flexible working solutions, with corporate
adoption of co-working, an increased focus on user experience and productivity dominating workplace discussions. Co-
working is now the fastest-growing segment of the leasing market in many U.S. cities; in 2005 there was only one co-
working space nationally, while today there are over 3,000. This trend is exemplified by companies such as WeWork,
which was founded in 2010 and now has 61 locations in 18 cities. Co-working companies are now appearing in other
regions and are looking for significant space in the key cities; however, rapid growth in this space is leading some to
question its sustainability. More broadly, digitisation and emerging technology is poised to impact building design and
function, CRE strategy and ultimately real estate requirements.
Global Market Perspective, First Quarter 2016
COPYRIGHT © JONES LANG LASALLE IP, INC. 2016. All Rights Reserved 15
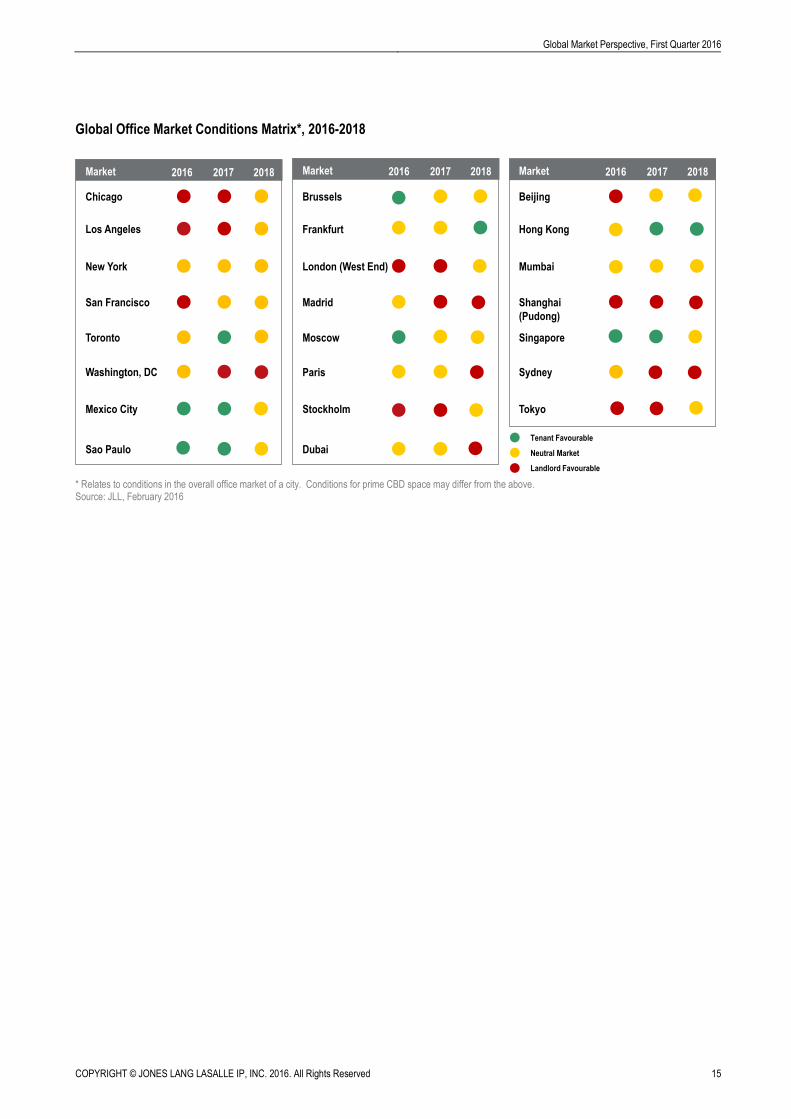
Global Office Market Conditions Matrix*, 2016-2018
* Relates to conditions in the overall office market of a city. Conditions for prime CBD space may differ from the above. Source: JLL, February 2016
MARKET
Brussels Beijing
Frankfurt Hong Kong
London (West End) Mumbai
Madrid Shanghai
(Pudong)
Moscow Singapore
Paris Sydney
Stockholm
Dubai
Market 2016 2017 2018 Market 2016 2017 2018
Tokyo
Neutral Market
Landlord Favourable
Tenant Favourable
Market
Chicago
Los Angeles
New York
San Francisco
Toronto
Washington, DC
Mexico City
Sao Paulo
2016 2017 2018

COPYRIGHT © JONES LANG LASALLE IP, INC. 2016. All Rights Reserved 16
Global Market Perspective, First Quarter 2016
Global Real Estate Health Monitor
Economy Real Estate Investment Markets Real Estate Occupier Markets
Metro
Area
GDP
OECD
Leading
Indicator
City
Investment
Volumes
Capital
Value
Change
Prime
Yield Yield Gap
Rental
Change
Net
Absorption
Vacancy
Rate
Supply
Pipeline
Beijing 7.1% -0.1 44% 3.7% 6.3% 351 3.7% 2.8% 2.7% 13.3%
Boston 2.9% -0.2 -13% 13.0% 3.8% 153 7.4% 1.8% 13.8% 3.2%
Chicago 2.6% -0.2 5% 8.3% 4.6% 153 3.7% 1.5% 15.0% 1.3%
Dubai 4.1% na 24% 15.4% 7.5% na 15.4% na 19.1% 8.3%
Frankfurt 2.2% -0.1 -6% 7.3% 4.4% 372 1.4% 0.2% 9.1% 2.1%
Hong Kong 2.5% na 66% 5.5% 3.1% 155 13.3% 3.3% 2.9% 4.4%
London 3.4% -0.2 -12% 11.8% 3.5% 154 4.3% 2.3% 3.4% 5.8%
Los Angeles 2.6% -0.2 8% 14.4% 4.2% 153 9.2% 1.4% 15.5% 1.0%
Madrid 3.2% 0 76% 25.7% 4.3% 247 6.9% 2.7% 10.6% 1.3%
Mexico City 3.4% -0.2 -92% -2.7% 7.5% 123 0.0% 8.0% 13.0% 18.0%
Milan 1.6% 0 258% 8.9% 4.5% 290 2.1% 0.9% 13.4% 2.4%
Moscow -1.5% -0.1 -4% -15.3% 10.5% 76 -11.1% 4.2% 16.9% 9.0%
Mumbai 7.4% 0.1 143% -0.7% 9.9% 197 -2.4% 7.0% 19.7% 14.4%
New York 2.8% -0.2 20% 9.1% 3.3% 153 2.9% 0.0% 9.6% 1.1%
Paris 1.7% 0.1 -10% 11.5% 3.3% 227 -3.4% -0.6% 7.4% 4.2%
San Francisco
3.0% -0.2 -25% 11.0% 3.4% 153 7.8% 2.9% 8.2% 3.9%
Sao Paulo -3.3% 0.1 -77% -7.8% 9.8% 260 -5.4% 5.1% 23.6% 13.6%
Seoul 2.8% 0 -20% 3.4% 4.6% 254 -1.0% 0.3% 11.0% 3.2%
Shanghai 6.1% -0.1 79% 12.9% 5.7% 351 9.4% 17.9% 9.5% 38.1%
Singapore 2.5% na -13% -4.4% 3.9% 128 -10.5% 1.8% 5.0% 11.4%
Stockholm 3.4% 0 -31% 22.8% 4.0% 301 15.6% 3.1% 7.1% 1.5%
Sydney 2.7% -0.1 -31% 19.9% 5.5% 254 13.0% 2.3% 8.4% 3.7%
Tokyo 2.0% -0.1 -48% 18.4% 3.0% 275 7.6% 4.9% 2.0% 9.2%
Toronto 2.8% 0 -9% 12.7% 4.7% 331 3.8% 0.0% 9.7% 2.3%
Washington DC
2.7% -0.2 -7% 8.5% 4.1% 153 3.4% 0.4% 17.0% 1.5%
Real estate data as at end Q4 2015
Definitions and Sources
Metro Area GDP: Change in Real GDP. Metropolitan Area Projection, 2016. Source: Oxford Economics
OECD Leading Indicator: Composite Leading Indicator. Change in Index. Latest Month. Source: OECD
City Investment Volumes: Direct Commercial Real Estate Volumes. Metro Area Data. Rolling Annual Change. Source: JLL
Capital Value Change: Notional Prime Office Capital Values. Year-on-Year Change. Latest Quarter. Source: JLL
Prime Yield: Indicative Yield on Prime/Grade-A Offices. Latest Quarter. Source: JLL
Yield Gap: Basis Points that Prime Office Yields are above or below 10-year Government Bond Yields. Latest Quarter. Source: JLL, Datastream
Rental Change: Prime Office Rents. Year-on-Year Change. Latest Quarter. Source: JLL
Net Absorption: Annual Net Absorption as % of Occupied Office Stock. Rolling Annual. Source: JLL
Vacancy Rate: Metro Area Office Vacancy Rate. Latest Quarter. Source: JLL
Supply Pipeline: Metro Area Office Completions (2016-2017) as % of Existing Stock. Source: JLL
Global Market Perspective, First Quarter 2016
COPYRIGHT © JONES LANG LASALLE IP, INC. 2016. All Rights Reserved 17
Office Markets
Office Demand Dynamics
Robust office market fundamentals
Office market fundamentals have continued to improve across all three global regions, with buoyant leasing activity and
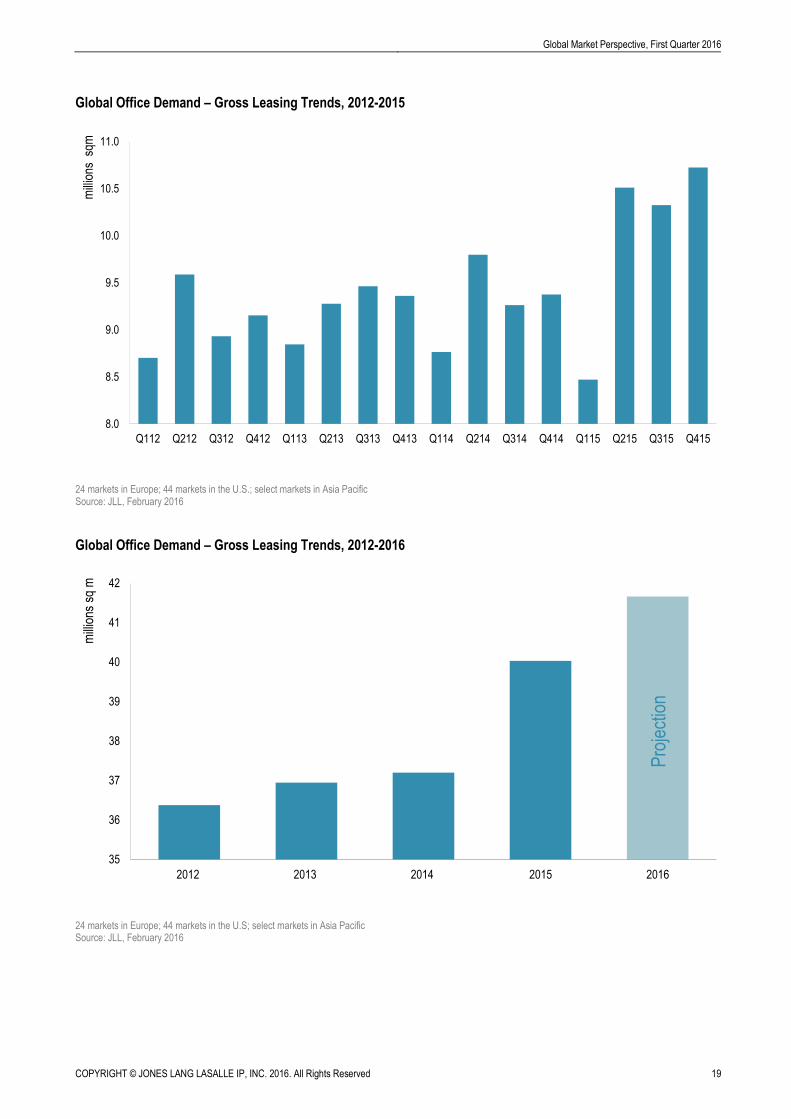
tightening supply supporting solid rental growth. Global leasing volumes in the final quarter of 2015 were 14% higher
year-on-year and, as a result, full-year volumes exceeded expectations, registering 8% growth on 2014 levels. The Asia
Pacific region has seen a strong rebound, with its full-year volumes 19% higher. Leasing activity has also been
remarkably vigorous in Europe, posting 13% growth in 2015. Meanwhile, the U.S. has maintained its robust leasing
activity, with nearly half of volumes comprising expansion demand. Technology, banking and financial services and
outsourcing are the key drivers of demand.
Momentum builds into 2016
Despite global economic headwinds, there will continue to be progress towards expansion demand as tenants move
away from cost containment, consolidation and renewals. As a consequence, 2016 global office leasing volumes are
projected to be around 5% higher than 2015, with Asia Pacific likely to record the greatest uplift.
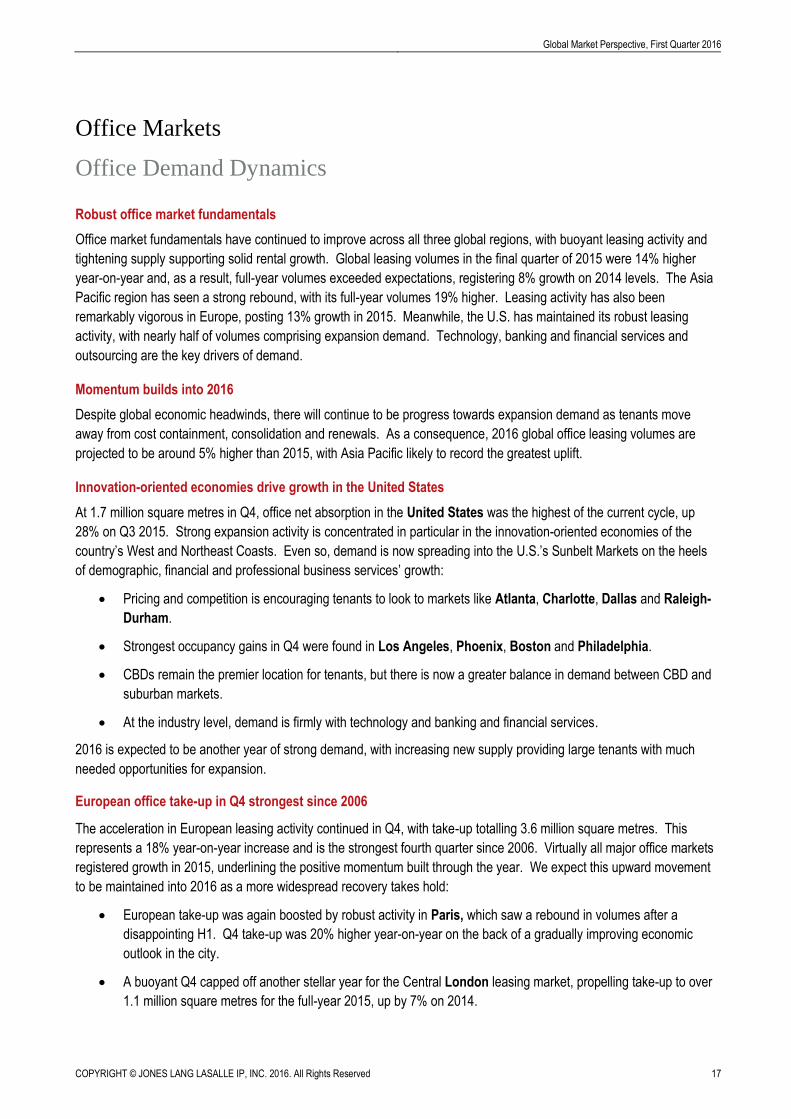
Innovation-oriented economies drive growth in the United States
At 1.7 million square metres in Q4, office net absorption in the United States was the highest of the current cycle, up
28% on Q3 2015. Strong expansion activity is concentrated in particular in the innovation-oriented economies of the
country’s West and Northeast Coasts. Even so, demand is now spreading into the U.S.’s Sunbelt Markets on the heels
of demographic, financial and professional business services’ growth:
Pricing and competition is encouraging tenants to look to markets like Atlanta, Charlotte, Dallas and Raleigh-
Durham.
Strongest occupancy gains in Q4 were found in Los Angeles, Phoenix, Boston and Philadelphia.
CBDs remain the premier location for tenants, but there is now a greater balance in demand between CBD and
suburban markets.
At the industry level, demand is firmly with technology and banking and financial services.
2016 is expected to be another year of strong demand, with increasing new supply providing large tenants with much
needed opportunities for expansion.
European office take-up in Q4 strongest since 2006
The acceleration in European leasing activity continued in Q4, with take-up totalling 3.6 million square metres. This
represents a 18% year-on-year increase and is the strongest fourth quarter since 2006. Virtually all major office markets
registered growth in 2015, underlining the positive momentum built through the year. We expect this upward movement
to be maintained into 2016 as a more widespread recovery takes hold:
European take-up was again boosted by robust activity in Paris, which saw a rebound in volumes after a
disappointing H1. Q4 take-up was 20% higher year-on-year on the back of a gradually improving economic
outlook in the city.
A buoyant Q4 capped off another stellar year for the Central London leasing market, propelling take-up to over
1.1 million square metres for the full-year 2015, up by 7% on 2014.
COPYRIGHT © JONES LANG LASALLE IP, INC. 2016. All Rights Reserved 18
Global Market Perspective, First Quarter 2016
Meanwhile, the office markets in Germany show no signs of slowing, with the combined take-up for the five
largest markets up 20% year-on-year in Q4. Berlin continues to be the front runner with full-year volumes up
43% on the previous record level of 2014. Leasing volumes across Germany are likely to stay robust in 2016.
In Southern Europe, sentiment also remained positive. Q4 2015 take-up in Madrid was up 42% year-on-year
and in Milan final quarter office leasing volumes were the strongest on record.
Other noteworthy performances in Q4 in terms of leasing volumes included Stockholm (+64% year-on-year)
and Amsterdam (+38%).
In cities such as London, Dublin, Berlin and Munich we have seen that constraints in the most sought-after locations
are forcing occupiers to widen their search to high-quality space in well-connected areas. This has caused demand to
spill over into secondary areas (often supporting rental growth in these submarkets). This increased occupier mobility is
likely to become more widespread across Western Europe during 2016.
Leasing activity continues to recover in Asia Pacific
Overall leasing activity in the fourth quarter improved strongly year-on-year in Asia Pacific on both a gross and net basis,
with technology, domestic financial firms and offshoring activity continuing to be key sources of demand. Net absorption
in Q4 across the region was up 38% year-on-year:
Vigorous demand has been recorded in India (particularly Delhi) and China (all Tier I markets). The Chinese
and Indian cities accounted for around two-thirds of Q4 net absorption in the region. Despite a slowing
economy, the Shanghai and Beijing leasing markets have been remarkably resilient with leasing volume
growth during 2015 of 48% as their service sectors expanded.
Manila was also very active, particularly driven by offshoring activity.
In Australia, leasing surged by a hefty 104%, led by the largest markets - Sydney and Melbourne.
Slow economic activity and weak commodity prices have impacted Southeast Asian markets.
Singapore, Kuala Lumpur and Seoul saw negative net absorption in Q4 2015.
Asia Pacific office leasing volumes in 2016 are forecast to increase by around 15% on 2015 levels, with similar demand
drivers as last year.
Tenant-friendly markets in Latin America
Office fundamentals are weaker throughout most major markets in Latin America:
Tenant demand is depressed in Sao Paulo, although leasing activity is likely to rise over the next few quarters
as demand for space is induced by the wide array of options and incentives available in an oversupplied
market.
Mexico City’s office market, on the other hand, has experienced more consistent and robust demand from
tenants. However, market leverage is expected to increasingly fall into the hands of tenants in 2016 as the
supply pipeline surges.
Demand stable in MENA markets
Cairo and Jeddah have been the strongest performing office markets in MENA over 2015, with Cairo continuing to
witness a movement of tenants from the central city to new suburban locations. The office markets in Dubai and Abu
Dhabi have kept relatively stable and are experiencing sustained demand for high-quality space.
Global Market Perspective, First Quarter 2016
COPYRIGHT © JONES LANG LASALLE IP, INC. 2016. All Rights Reserved 19
Global Office Demand – Gross Leasing Trends, 2012-2015
24 markets in Europe; 44 markets in the U.S.; select markets in Asia Pacific Source: JLL, February 2016
Global Office Demand – Gross Leasing Trends, 2012-2016
24 markets in Europe; 44 markets in the U.S; select markets in Asia Pacific Source: JLL, February 2016
8.0
8.5
9.0
9.5
10.0
10.5
11.0
Q112 Q212 Q312 Q412 Q113 Q213 Q313 Q413 Q114 Q214 Q314 Q414 Q115 Q215 Q315 Q415
mill
ions
sqm
35
36
37
38
39
40
41
42
2012 2013 2014 2015 2016
mill
ions
sq
m
Pro
ject
ion
COPYRIGHT © JONES LANG LASALLE IP, INC. 2016. All Rights Reserved 20
Global Market Perspective, First Quarter 2016
Office Supply Trends
Office Construction
Office supply pipeline under control
14.0 million square metres of new office space was delivered globally (across 93 major markets) during 2015, the
highest level since 2009 and representing a 29% increase on 2014. The market has nonetheless successfully absorbed
this additional new space and global vacancy rates have continued to decline.
New office deliveries during 2016-2018 are likely to range between 15-16 million square metres per year, well below the
previous development peaks of 2001 and 2009. At this stage, there is little sign that this will result in a surge in available
space in the world’s dominant office markets.
Robust fundamentals are encouraging developer activity in the U.S.
Development volumes in the U.S. fell to 8.2 million square metres during Q4, but the underlying trend in construction is
still upward. This trend will continue into 2016 as improving fundamentals in secondary and tertiary markets encourage
developers to move forward. 2016 will see the U.S. receive 5.2 million square metres of new supply, but nearly half of
this space is already pre-leased.
Limited speculative construction in Europe, with the exception of London
In Europe the final quarter of the year witnessed the largest amount of office completions in 2015, with 1.7 million square
metres of new office space added to the market, accounting for 39% of the annual total. Nevertheless, most office
markets experienced a further tightening of space, with the majority recording a decrease in vacancy.
The lack of quality space is unlikely to be resolved in the immediate future with a limited speculative pipeline reported in
most markets. London is one of the few European cities seeing a significant development response in the short term,
with high levels of speculative space under construction. In Warsaw and Prague, significant development volumes will
sustain the existing high vacancy levels.
Healthy office supply additions in Asia. Pre-leases ease impact of new completions
Asia Pacific stock additions were up 65% in 2015 to 5.6 million square metres. The lion’s share of completions was in
India and China, while strong pre-commitment rates mitigated the impact of new supply on vacancy in markets such as
Tokyo and Manila. Regional completions are expected to peak in 2016 at 6.8 million square metres, up 21% on 2015
levels.

Global Market Perspective, First Quarter 2016
COPYRIGHT © JONES LANG LASALLE IP, INC. 2016. All Rights Reserved 21
Global Office Completions, 2000-2018
24 markets in Europe; 25 markets in Asia Pacific; 44 markets in the U.S. Asia relates to Grade A only. Source: JLL, February 2016
Office Supply Pipeline – Major Markets, 2016-2017
Covers all office sub-markets in each city. Tokyo – CBD - 5 kus Source: JLL, February 2016
0
5
10
15
20
2000 2001 2002 2003 2004 2005 2006 2007 2008 2009 2010 2011 2012 2013 2014 2015 2016(F)
2017(F)
2018(F)
U.S. Europe Asia Pacific
mill
ions
sq
m
Average
0 5 10 15 20 25 30 35 40
Los AngelesNew York
MadridChicago
Washington DCStockholm
FrankfurtToronto
MilanSeoul
BostonBrusselsSydney
San FranciscoParis
Hong KongLondon
DubaiMoscow
TokyoSingapore
BeijingSao Paulo
MumbaiMexico City
Shanghai
Completions as % of existing stock
2016 2017
COPYRIGHT © JONES LANG LASALLE IP, INC. 2016. All Rights Reserved 22
Global Market Perspective, First Quarter 2016
Office Vacancy
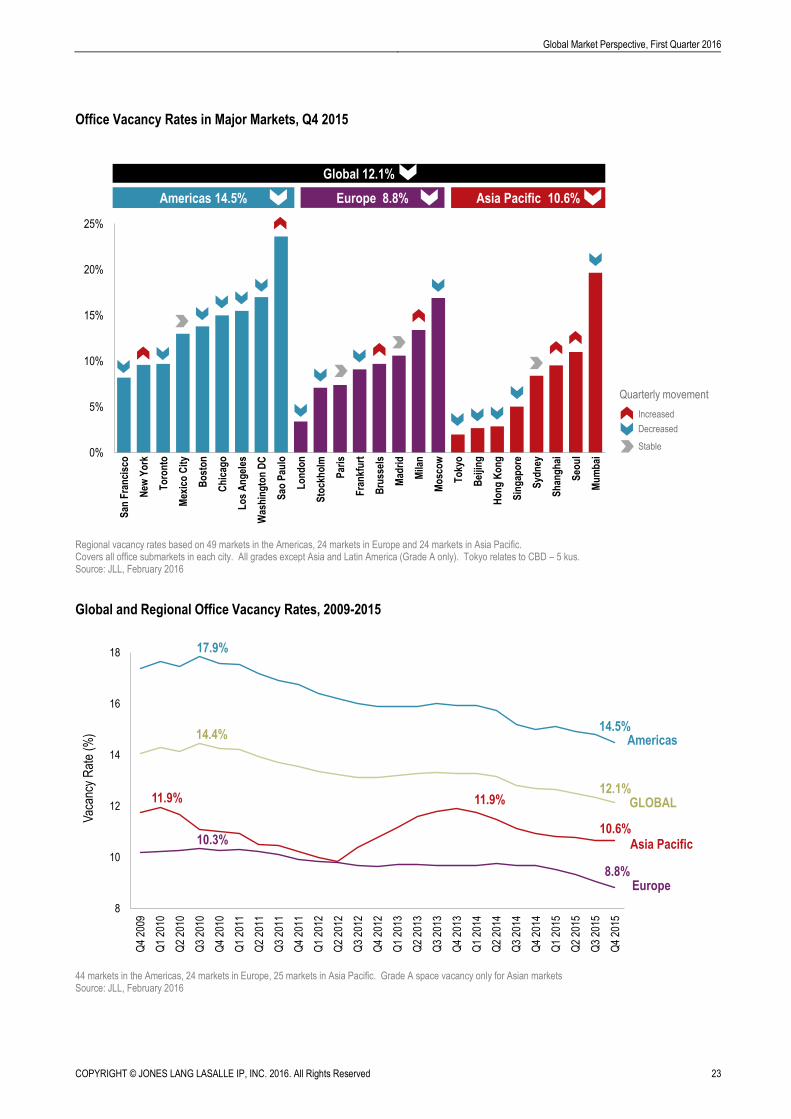
Global vacancy rates continue to trend downwards
Another 20 basis points were shaved off the global office vacancy rate (across 98 markets) in Q4 2015, which stood at
12.1% at the end of the year. This marks a quickening in the downward trend in vacancy rates since Q3 2010 (when it
was at a peak rate of 14.4%). A further fall is in prospect during 2016, notably in the U.S. and potentially in Europe.
With a modest increase in new office deliveries anticipated in 2016 and 2017, the global vacancy rate is projected to
settle at around 12% during the next two years.
U.S. office vacancy rate at lowest for eight years
Vacancy in the U.S. has declined to 14.7%, its lowest level for eight years and despite 4.1 million square metres of new
supply delivered across the country in 2015. The vacancy rate is inching towards the pre-recession low of 13.8%.
Lowest vacancies are found in urban locales in cities such as New York, San Francisco and Portland.
Surprise drop in European vacancy
The European office vacancy rate dropped by 30 basis points in Q4 2015 to 8.8%, the lowest since Q1 2009. The 90
basis points drop in 2015 was stronger than anticipated at the start of the year. The bounce in leasing activity had a
particularly hefty impact on vacancy in Western Europe markets including Dublin, Dusseldorf and Stockholm.
Furthermore, supply tightened well below the long-term averages in some of the best-performing European office
markets, including London (to 3.4%), Berlin (to 6.3%) and Munich (to 5.3%). European office vacancy is expected to
edge down further in 2016 on the back of strengthening occupier markets and a lack of new completions.
Asia Pacific vacancy edging down
Despite relatively high levels of new completions in Asia Pacific, improving absorption helped the regional vacancy rate
to edge down further to 10.6% in Q4. But, with a further modest increase in new completions in 2016, the rate could
move back up above 11% during 2016. Nonetheless, vacancy rates are low in many of the region’s major markets, with
Hong Kong Central’s rate of 1.2% at its lowest since the Global Financial Crisis. At the other extreme, Delhi’s current
vacancy rate is 31.9%, followed by Perth at 23.5%.
Global Market Perspective, First Quarter 2016
COPYRIGHT © JONES LANG LASALLE IP, INC. 2016. All Rights Reserved 23
Office Vacancy Rates in Major Markets, Q4 2015
Regional vacancy rates based on 49 markets in the Americas, 24 markets in Europe and 24 markets in Asia Pacific. Covers all office submarkets in each city. All grades except Asia and Latin America (Grade A only). Tokyo relates to CBD – 5 kus. Source: JLL, February 2016
Global and Regional Office Vacancy Rates, 2009-2015
44 markets in the Americas, 24 markets in Europe, 25 markets in Asia Pacific. Grade A space vacancy only for Asian markets Source: JLL, February 2016
0%
5%
10%
15%
20%
25%
San
Fra
nci
sco
New
Yo
rk
To
ron
to
Mex
ico
Cit
y
Bo
sto
n
Ch
icag
o
Lo
s A
ng
eles
Was
hin
gto
n D
C
Sao
Pau
lo
Lo
nd
on
Sto
ckh
olm
Par
is
Fra
nkf
urt
Bru
ssel
s
Mad
rid
Mila
n
Mo
sco
w
To
kyo
Bei
jing
Ho
ng
Ko
ng
Sin
gap
ore
Syd
ney
Sh
ang
hai
Seo
ul
Mu
mb
ai
Europe 8.8% Asia Pacific 10.6%Americas 14.5%
Quarterly movement
Increased
Decreased
Stable
Global 12.1%
8
10
12
14
16
18
Q4
2009
Q1
2010
Q2
2010
Q3
2010
Q4
2010
Q1
2011
Q2
2011
Q3
2011
Q4
2011
Q1
2012
Q2
2012
Q3
2012
Q4
2012
Q1
2013
Q2
2013
Q3
2013
Q4
2013
Q1
2014
Q2
2014
Q3
2014
Q4
2014
Q1
2015
Q2
2015
Q3
2015
Q4
2015
Vac
ancy
Rat
e (%
)
Americas
Asia Pacific
Europe
GLOBAL
17.9%
14.5%14.4%
12.1%11.9%
10.6%
11.9%
10.3%
8.8%
COPYRIGHT © JONES LANG LASALLE IP, INC. 2016. All Rights Reserved 24
Global Market Perspective, First Quarter 2016
Office Rental Trends
Rental growth moves at a steady pace
Rental growth on prime office assets accelerated during the second half of 2015 as supply tightened and demand
strengthened. Growth of 3.7% was recorded for the full-year (across 26 major markets), matching the levels of 2014.
The star performer among the major markets during 2015 was Stockholm, where a sharp fall in vacancy rate and near
record take-up levels pushed rents up by 15.6%. In Asia Pacific, Hong Kong (+13.3%), Sydney (+13.0%) and
Shanghai (+9.4%) posted strong rental performance, while the U.S. West Coast markets of Los Angeles (+9.2%) and
San Francisco (+7.8%) outperformed in the Americas. By contrast, Moscow (-11.1%), Singapore (-10.5%) and Sao
Paulo (-5.4%) registered a decline in prime rents during 2015.
U.S. markets to dominate top slots in 2016
Further rental growth of 3%-4% is in prospect for 2016 across the major global office markets. The gateway U.S
markets are likely to dominate the top positions in 2016, with Boston, Los Angeles, San Francisco, Chicago and New
York all expected to exceed 5% growth. Robust prime rental growth is also in prospect in Tokyo, Sydney, Hong Kong
and Shanghai, while Madrid and London are projected to be the standout markets in Europe.
Landlord confidence builds in the U.S.
In the U.S., asking rents increased by 2.2% during Q4 2015. This represents the largest quarterly gain of the current
cycle, with further growth anticipated for the next two years as new quality space sets higher rental benchmarks.
Sustained tenant demand will give landlords of existing buildings leverage to raise rents further and create a more
challenging negotiating environment for tenants.
Continued growth in Europe
The European Office Rent Index rose by 0.8% during Q4 2015, but the increase was dragged down by the weak
performance of Moscow and Paris, two of Europe’s largest markets. Excluding Moscow (where currency volatility
continues to impact on rents), Europe recorded rental growth of 2.7% in 2015, well above the 10-year average rise of
1.7%. Elsewhere across Europe, sentiment is largely positive. In Spain, Barcelona (+2.6%) and Madrid (+2.8%)
registered their fifth and seventh consecutive quarters of rental uplifts respectively. Meanwhile in Germany, Berlin and
Hamburg experienced a strong Q4, fuelled by record levels of take-up.
Rental growth of 2%-3% a year is projected for prime European offices in both 2016 and 2017. There is some upside
potential, in the case of a more pronounced and widespread demand-side recovery. We foresee rental growth in
London outperforming the European average in the year ahead, but growth rates are expected to ease from their recent
levels.
Rental growth accelerates across Asia Pacific
Following a lacklustre Q3, average net effective rental growth across Asia Pacific accelerated to 1.3% in Q4 2015.
Growth for the full-year averaged 3.7%, led by Hong Kong (+13.3%). The strongest quarterly uplift was seen in Sydney
(+5.4%), followed by Bangalore (+3.8%) on the back of robust tenant demand. Improved business sentiment also
contributed to rental growth gathering pace in Tokyo (+2.8%). Across the region, single-digit rental growth is generally
predicted for 2016, led by Sydney and Tokyo. Singapore and a few Australian cities may see further declines due to
muted tenant demand and/or upcoming supply.

Global Market Perspective, First Quarter 2016
COPYRIGHT © JONES LANG LASALLE IP, INC. 2016. All Rights Reserved 25
Prime Offices – Rental Change, Q4 2014-Q4 2015
Based on rents for Grade A space in CBD or equivalent. In local currency. Source: JLL, February 2016
Prime Offices – Rental Change, 2010-2016
Prime office rental growth: unweighted average of 25 major markets. * 2015 forecast excludes Moscow Source: JLL, February 2016
-15 -10 -5 0 5 10 15 20
Moscow
Singapore
Sao Paulo
Paris
Mumbai
Seoul
Mexico City
Brussels
Frankfurt
Milan
New York
Washington DC
Beijing
Chicago
Toronto
London
Madrid
Boston
Tokyo
San Francisco
Los Angeles
Shanghai
Sydney
Hong Kong
Dubai
Stockholm
% change
Americas
EMEA
Asia Pacific
0
1
2
3
4
5
6
7
8
9
10
2010 2011 2012 2013 2014 2015 2016
8.6%
7.7%
1.6%
0.7%
Ren
tal c
hang
e (y
-o-y
%)
3-4%3.7% 3.7%
COPYRIGHT © JONES LANG LASALLE IP, INC. 2016. All Rights Reserved 26
Global Market Perspective, First Quarter 2016
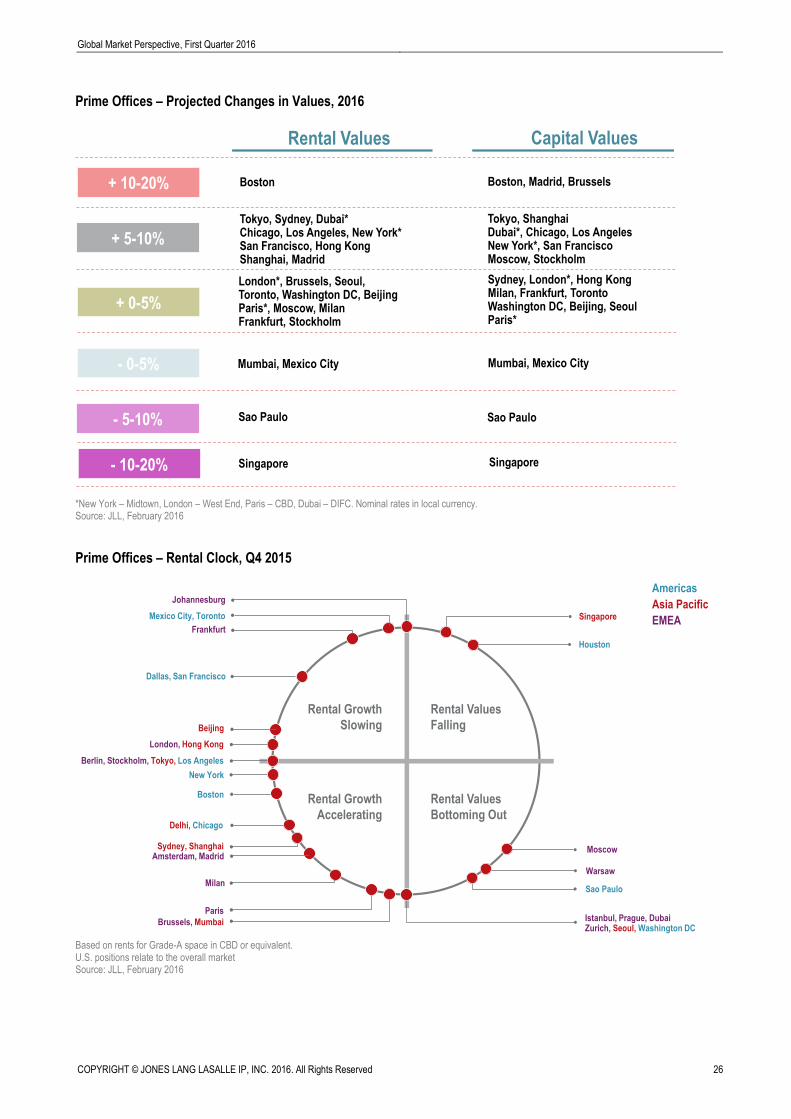
Prime Offices – Projected Changes in Values, 2016
*New York – Midtown, London – West End, Paris – CBD, Dubai – DIFC. Nominal rates in local currency. Source: JLL, February 2016
Prime Offices – Rental Clock, Q4 2015
Based on rents for Grade-A space in CBD or equivalent. U.S. positions relate to the overall market Source: JLL, February 2016
+ 10-20%
+ 5-10%
+ 0-5%
- 0-5%
- 5-10%
Tokyo, Sydney, Dubai*Chicago, Los Angeles, New York* San Francisco, Hong KongShanghai, Madrid
Capital ValuesRental Values
London*, Brussels, Seoul, Toronto, Washington DC, Beijing Paris*, Moscow, MilanFrankfurt, Stockholm
Boston, Madrid, Brussels
Tokyo, ShanghaiDubai*, Chicago, Los AngelesNew York*, San FranciscoMoscow, Stockholm
Sydney, London*, Hong KongMilan, Frankfurt, TorontoWashington DC, Beijing, SeoulParis*
Mumbai, Mexico City
- 10-20%
Sao Paulo Sao Paulo
Mumbai, Mexico City
Singapore Singapore
Boston
Rental Values
Bottoming Out
Rental Growth
Slowing
Rental Values
Falling
Rental Growth
Accelerating
Americas
Asia Pacific
EMEA
Moscow
Berlin, Stockholm, Tokyo, Los Angeles
ParisIstanbul, Prague, DubaiZurich, Seoul, Washington DC
Sao Paulo
Sydney, Shanghai
Boston
Amsterdam, Madrid
Frankfurt
Mexico City, Toronto
Houston
Dallas, San Francisco
Milan
Warsaw
Johannesburg
Singapore
Brussels, Mumbai
Delhi, Chicago
London, Hong Kong
Beijing
New York

Global Market Perspective, First Quarter 2016
COPYRIGHT © JONES LANG LASALLE IP, INC. 2016. All Rights Reserved 27
Retail Markets
U.S. retail market gradually tightening despite surging e-commerce
The U.S. vacancy rate inched down to 5.6% in the fourth quarter of 2015. Demand has comfortably exceeded supply in
three of the past four quarters, resulting in sustained vacancy compression. Rents increased 0.5% quarter-on-quarter
and grew 1.6% year-on-year. Among U.S. shopping centre types, power centres are still experiencing the tightest
overall market conditions, with total vacancy of 4.5%. Several standout markets like Miami, New York, Houston,
Dallas, Fort Lauderdale, Boston and San Francisco are now witnessing conditions typical of a peaking market, as
rents see assertive growth and vacancy continues to compress.
Consumer confidence remains robust in Europe
Improved consumer confidence is still evident across Europe with the Eurozone showing signs of economic recovery.
Increasing employment opportunities, improved real wage growth, lower fuel and energy prices, and low interest rates
are driving disposable income growth. Europe’s retail sales are forecast to grow by 2.0% in 2016, with demand led by
the UK, Turkey, Spain, Sweden, CEE markets and the Baltics.
UK regional cities show strongest rental growth in Europe
UK regional cities - Edinburgh (+9.1% quarter-on-quarter), Birmingham (+5.4%) and Manchester (+5.3%) - and Berlin
(+6.7%) recorded the strongest rental growth during Q4, driven by vigorous retailer demand. Increases were also
registered in the recovery markets of Milan (+7.5%) and Barcelona (+2.0%). Prime high street rents maintained their
stability in most major European cities. Dublin, Rome, London, Leeds, Munich and Dusseldorf are expected to see
the healthiest prime rental growth in 2016.
Varied demand picture in Asia; limited rental growth in most markets
Retailer demand for space in China continues to be supported by fast fashion retailers and F&B. Demand from luxury
retailers remained weak during the fourth quarter, despite a cut in Chinese import duties for luxury goods. In Hong
Kong, declining tourist arrivals from China kept the downward pressure on retail sales. In Tokyo, there was solid
demand from affordable luxury apparel brands for space in prime retail areas. Challenging market conditions persisted
in Singapore with subdued retailer demand and weak consumer sentiment. Market conditions in India were generally
stable, with F&B and apparel still the most active retailer categories. The acceleration in discretionary retail spending
growth is positive for Australia’s specialty store leasing demand but rents stayed largely unchanged outside of the CBD
and bulky goods sub-sectors.
Average rental growth edged up across the Asia Pacific region in Q4, but further declines were recorded in Singapore
and Hong Kong’s high street shops. Over the short term, we see limited scope for much rental growth in most markets,
and Hong Kong is likely to witness the biggest decline in rents for high street space.
Rental growth slowing in Dubai
While retail spending levels have maintained their upward momentum, the level of growth has slowed in the UAE as
tourist spending has been hit by the strength of the U.S. dollar. Following robust rental growth over the past two years,
retail rents in Dubai are now stabilising as the balance of power shifts in favour of brand owners. With significant
additions to the retail supply continuing in Dubai, rental uplifts over the next year are likely to be primarily in the form of
turnover rentals, which will work in the favour of the best-performing malls.
COPYRIGHT © JONES LANG LASALLE IP, INC. 2016. All Rights Reserved 28
Global Market Perspective, First Quarter 2016
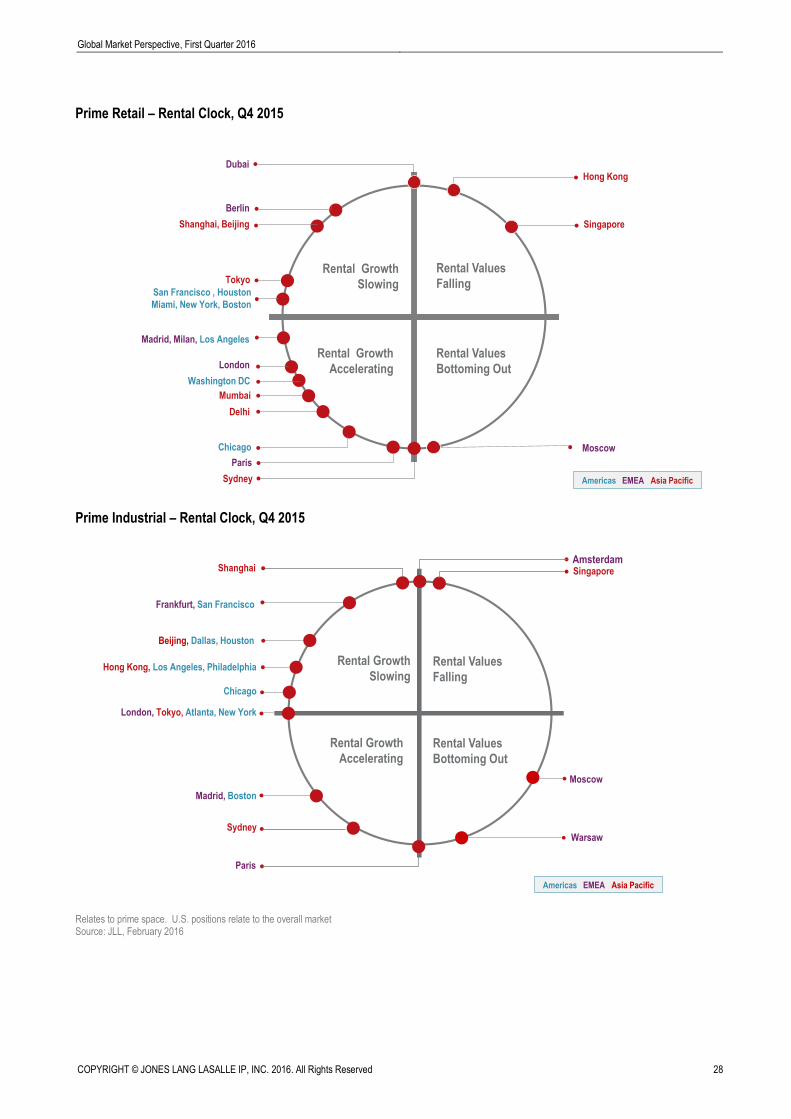
Prime Retail – Rental Clock, Q4 2015
Prime Industrial – Rental Clock, Q4 2015
Relates to prime space. U.S. positions relate to the overall market Source: JLL, February 2016
Rental Growth
Slowing
Rental Values
Falling
Rental Growth
Accelerating
Rental Values
Bottoming Out
Americas EMEA Asia Pacific
Delhi
Mumbai
Hong Kong
Madrid, Milan, Los Angeles
Dubai
Shanghai, Beijing
Berlin
Sydney
MoscowChicago
Singapore
Tokyo
Washington DC
San Francisco , Houston
Miami, New York, Boston
Paris
London
Rental Growth
SlowingRental Values
Falling
Rental Values
Bottoming Out
Warsaw
Americas EMEA Asia Pacific
Rental Growth
Accelerating
Paris
Madrid, Boston
Frankfurt, San Francisco
London, Tokyo, Atlanta, New York
Hong Kong, Los Angeles, Philadelphia
Amsterdam
Beijing, Dallas, Houston
Shanghai
Sydney
Chicago
Moscow
Singapore

Global Market Perspective, First Quarter 2016
COPYRIGHT © JONES LANG LASALLE IP, INC. 2016. All Rights Reserved 29
Industrial Warehousing Markets
U.S. continues its stellar performance
The industrial market in the U.S. is enjoying a remarkable stretch of good health. There have been 23 straight quarters
of positive net absorption with market fundamentals remaining strong throughout 2015. Active tenant requirements
(potential absorption) exceeded underway speculative construction by a factor of over two-to-one by year-end, and
absorption is forecast to stay positive in 2016 with continued velocity across nearly every U.S. market.
U.S. rental growth accelerated in 2015
The average asking warehouse rental rate in the U.S. was up 5.5% year-on-year in 2015. Ten markets now have sub-
5.0% vacancies with a handful under 3.0%. These include a few West Coast markets such as Los Angeles (2.2%),
which had an annual warehouse rental increase of 9.5% in 2015. Countrywide, rental growth will drive value in 2016;
even with an increase in new construction, we forecast overall rental growth will be 4.5%. Some U.S. markets – where
vacancies are especially tight – will post double-digit gains.
Industrial solid across North America
Apart from oil-related weak markets in Alberta, the industrial market in Canada is performing well with the national
vacancy rate declining 50 basis points to just 3.6% during the fourth quarter. Strength is most pronounced across the
Greater Toronto area, while Vancouver is also experiencing solid growth. The industrial sector in Mexico is witnessing
significant investment related to the automotive manufacturing industry, with Toyota among the latest major players to
announce a new plant (in Guanajuato). Total industrial vacancy across the country was stable in Q4 2015 at 6.1%.
Continued occupier demand and city logistics expected to define 2016 in Europe
The ongoing vigorous growth in online sales and the wider impact of technology trends (including the digitisation of retail,
‘Big Data’ and the ‘Internet of Things’) are driving occupier demand for logistics across Europe. In 2015, take-up
volumes were estimated at over 16 million square metres, a new record. We anticipate similar levels to be sustained in
the current year.
Sturdy occupier demand supported growth in the development pipeline through 2015 and levels of new supply are
anticipated to be similarly strong this year. Finding suitable land and obtaining planning permission for big box logistics
will, however, become more challenging across a growing number of markets in Europe. The still scarce levels of
modern supply may pose a downside risk to overall occupier activity in the year ahead.
Nevertheless, developers will continue to benefit from supply chain alignment. This is driving consolidation into large
units and pushing logistics facilities ever closer to parcel hubs to service online sales. We expect 2016 to be the year
when logistics starts to move into large cities. This trend is being driven by ever quicker options for online purchases -
with one-hour delivery being the new frontier for many retailers. This is putting huge pressure on the ‘last mile’ and is
leading to demand for a network of small inner-city units to increase flexibility.
Demand from third-party logistics companies and e-commerce firms support warehouse rents in Asia Pacific
Generally healthy leasing activity was observed in Asia Pacific in Q4, propelled mainly by third-party logistics (3PLs) and
e-commerce companies, especially in China and Tokyo. Leasing demand in Hong Kong was lacklustre, with activity
largely driven by 3PLs’ cost-saving relocation requirements. In Singapore, robust relocation and renewal demand for
business park space stemmed from research and IT firms. Competitive development markets continue to limit rental
growth in Australian markets.
Across the Asia Pacific region, rents were mainly flat, with the highest quarterly rental growth of 1.1% in Beijing. A flat
to moderate uplift in rents is projected for most markets over the short term on the back of generally subdued export and
retail sales growth.
COPYRIGHT © JONES LANG LASALLE IP, INC. 2016. All Rights Reserved 30
Global Market Perspective, First Quarter 2016
Hotel Markets
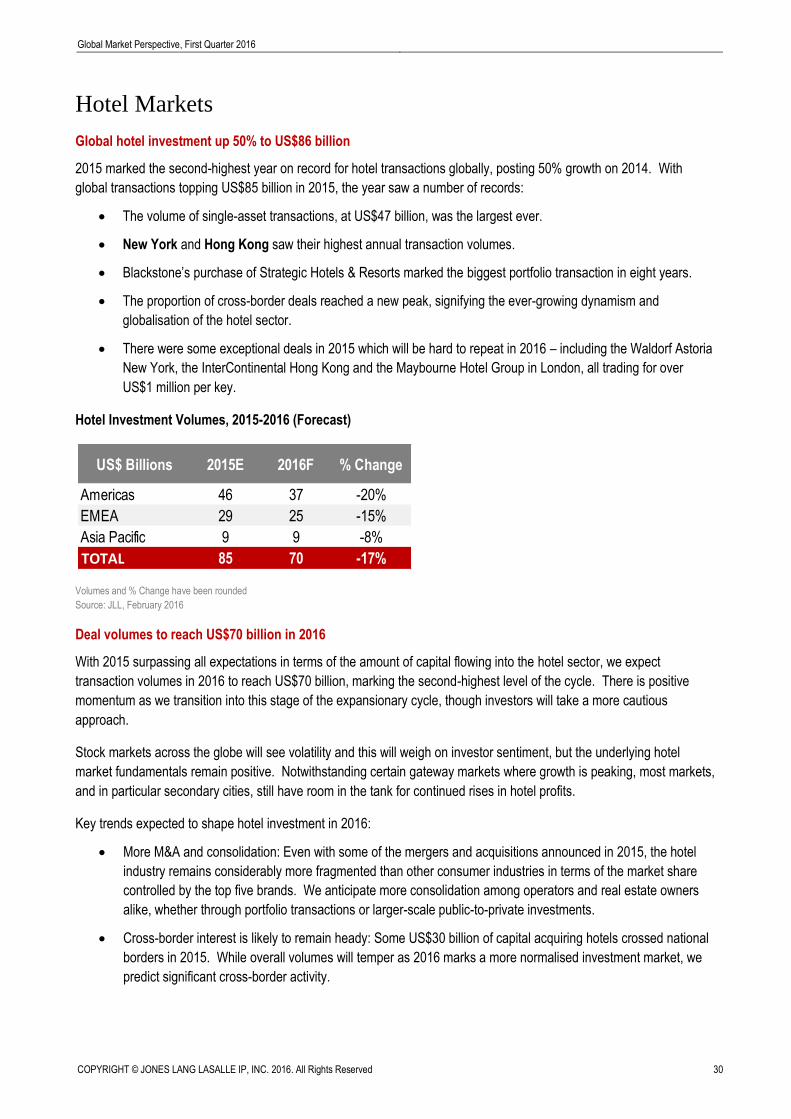
Global hotel investment up 50% to US$86 billion
2015 marked the second-highest year on record for hotel transactions globally, posting 50% growth on 2014. With
global transactions topping US$85 billion in 2015, the year saw a number of records:
The volume of single-asset transactions, at US$47 billion, was the largest ever.
New York and Hong Kong saw their highest annual transaction volumes.
Blackstone’s purchase of Strategic Hotels & Resorts marked the biggest portfolio transaction in eight years.
The proportion of cross-border deals reached a new peak, signifying the ever-growing dynamism and
globalisation of the hotel sector.
There were some exceptional deals in 2015 which will be hard to repeat in 2016 – including the Waldorf Astoria
New York, the InterContinental Hong Kong and the Maybourne Hotel Group in London, all trading for over
US$1 million per key.
Hotel Investment Volumes, 2015-2016 (Forecast)
Volumes and % Change have been rounded
Source: JLL, February 2016
Deal volumes to reach US$70 billion in 2016
With 2015 surpassing all expectations in terms of the amount of capital flowing into the hotel sector, we expect
transaction volumes in 2016 to reach US$70 billion, marking the second-highest level of the cycle. There is positive
momentum as we transition into this stage of the expansionary cycle, though investors will take a more cautious
approach.
Stock markets across the globe will see volatility and this will weigh on investor sentiment, but the underlying hotel
market fundamentals remain positive. Notwithstanding certain gateway markets where growth is peaking, most markets,
and in particular secondary cities, still have room in the tank for continued rises in hotel profits.
Key trends expected to shape hotel investment in 2016:
More M&A and consolidation: Even with some of the mergers and acquisitions announced in 2015, the hotel
industry remains considerably more fragmented than other consumer industries in terms of the market share
controlled by the top five brands. We anticipate more consolidation among operators and real estate owners
alike, whether through portfolio transactions or larger-scale public-to-private investments.
Cross-border interest is likely to remain heady: Some US$30 billion of capital acquiring hotels crossed national
borders in 2015. While overall volumes will temper as 2016 marks a more normalised investment market, we
predict significant cross-border activity.
US$ Billions 2015E 2016F % Change
Americas 46 37 -20%
EMEA 29 25 -15%
Asia Pacific 9 9 -8%
TOTAL 85 70 -17%
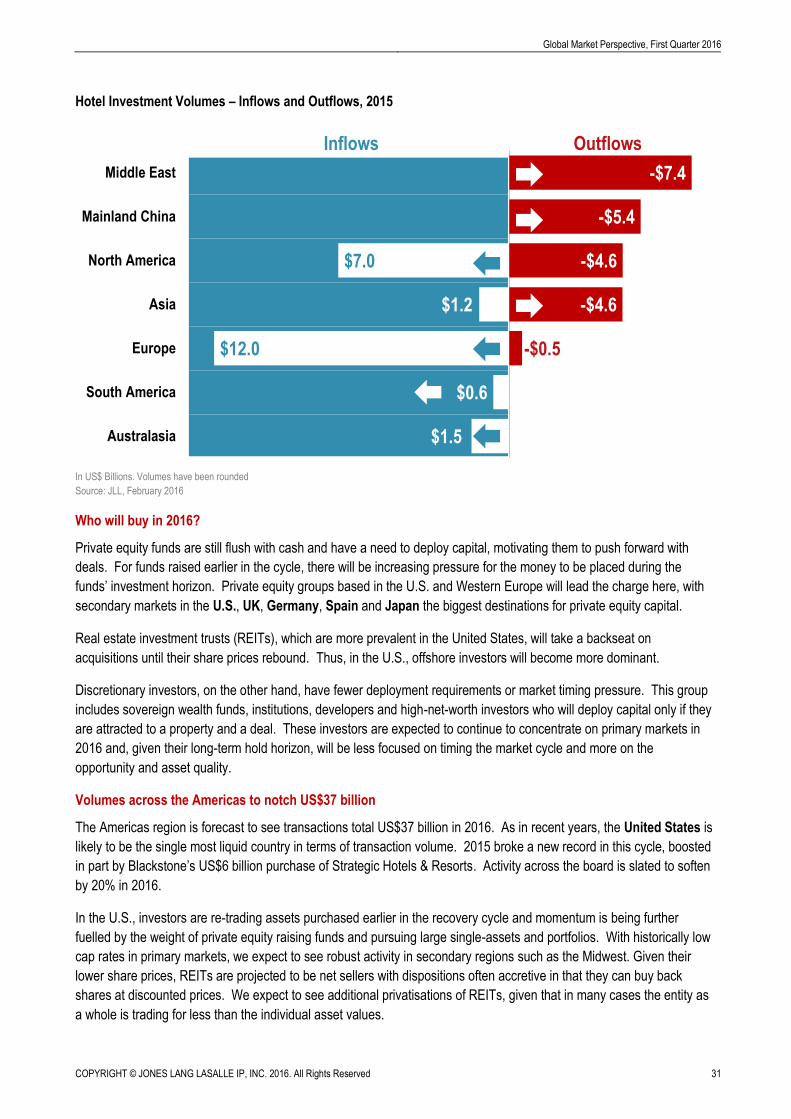
Global Market Perspective, First Quarter 2016
COPYRIGHT © JONES LANG LASALLE IP, INC. 2016. All Rights Reserved 31
Hotel Investment Volumes – Inflows and Outflows, 2015
In US$ Billions. Volumes have been rounded
Source: JLL, February 2016
Who will buy in 2016?
Private equity funds are still flush with cash and have a need to deploy capital, motivating them to push forward with
deals. For funds raised earlier in the cycle, there will be increasing pressure for the money to be placed during the
funds’ investment horizon. Private equity groups based in the U.S. and Western Europe will lead the charge here, with
secondary markets in the U.S., UK, Germany, Spain and Japan the biggest destinations for private equity capital.
Real estate investment trusts (REITs), which are more prevalent in the United States, will take a backseat on
acquisitions until their share prices rebound. Thus, in the U.S., offshore investors will become more dominant.
Discretionary investors, on the other hand, have fewer deployment requirements or market timing pressure. This group
includes sovereign wealth funds, institutions, developers and high-net-worth investors who will deploy capital only if they
are attracted to a property and a deal. These investors are expected to continue to concentrate on primary markets in
2016 and, given their long-term hold horizon, will be less focused on timing the market cycle and more on the
opportunity and asset quality.
Volumes across the Americas to notch US$37 billion
The Americas region is forecast to see transactions total US$37 billion in 2016. As in recent years, the United States is
likely to be the single most liquid country in terms of transaction volume. 2015 broke a new record in this cycle, boosted
in part by Blackstone’s US$6 billion purchase of Strategic Hotels & Resorts. Activity across the board is slated to soften
by 20% in 2016.
In the U.S., investors are re-trading assets purchased earlier in the recovery cycle and momentum is being further
fuelled by the weight of private equity raising funds and pursuing large single-assets and portfolios. With historically low
cap rates in primary markets, we expect to see robust activity in secondary regions such as the Midwest. Given their
lower share prices, REITs are projected to be net sellers with dispositions often accretive in that they can buy back
shares at discounted prices. We expect to see additional privatisations of REITs, given that in many cases the entity as
a whole is trading for less than the individual asset values.
-$0.5
-$4.6
-$4.6
-$5.4
-$7.4
$1.5
$0.6
$12.0
$1.2
$7.0
Australasia
South America
Europe
Asia
North America
Mainland China
Middle East
Inflows Outflows

COPYRIGHT © JONES LANG LASALLE IP, INC. 2016. All Rights Reserved 32
Global Market Perspective, First Quarter 2016
With REITs less active buyers, offshore investors stand to become the second-largest buyer type after private equity.
The ownership composition of hotels remains fragmented and there is an opportunity for fewer larger owners to own
more stock. We expect the industry to head into a cycle where hotels will transact more like office buildings, with
investors trading in and out on a consistent basis. Given the healthy macroeconomic environment in the U.S., capital will
continue to flow and we see a normalised asset trading environment ahead.
The year for single-asset transactions in Europe’s secondary markets
The Europe, Middle East and Africa (EMEA) region will continue its stride with a projected US$25 billion in hotel deals in
2016, down 15% on last year. Sales activity will be driven by single-asset transactions, with an increasing share taking
place in secondary markets. 2015 saw a remarkable volume of portfolio deals and these are set to return to more
normalised levels in 2016. Given the culling of portfolios and prime single-asset properties coming to market this year,
we anticipate that single-asset transactions will increase by 35%. The relatively weaker euro vs. the U.S. dollar will help
inbound tourism, notwithstanding some reticence given recent terrorist acts.
In order to find yield, investors will look beyond the mainstay markets with provincial UK, secondary German cities,
Spain (both the major cities and resort markets), Italy and Portugal receiving more attention. At the same time, lenders
will be increasingly busy across non-gateway cities.
On the buy-side, private equity and sovereign wealth funds will remain active, while mainland Chinese investors will
continue to purchase hotels. Sellers will include investment funds and private equity investors who made early-cycle
buys. Europe is forecast to maintain its position as the largest destination for offshore capital in 2016, as it receives
further inflows from U.S.-based private equity funds, Middle Eastern investors and capital from Asia.
In the Middle East, the outlook for hotel operating fundamentals is still tepid, in part given the economic weakness in big
tourism source markets such as Russia. At the same time, with governments’ support for development, the hotel
pipeline is staying robust.
Japan and Australia to be the standouts in Asia Pacific
On the back of one of the most robust years for Asia Pacific in terms of transactions, the region is forecast to see
volumes of US$8.5 billion in 2016, a 5%-10% decline on 2015. Japan saw its highest level of transactions ever in 2015
and there remains a strong bench of domestic investors as well as interest from U.S. private equity funds. In addition,
early trends are emerging of Chinese investors evaluating purchases in secondary Japanese locations.
Mainland China has started to witness hotel deals in excess of US$1 billion annually and this level is likely to continue, if
not increase, in 2016 due to government policy. Australia will remain active as well, though given the large number of
prime single assets having traded to long-term holders of late, the amount of product on the market will be smaller.
The tightly-held hotel stock in Singapore leads to deals being few and far between. Investors will take more of a wait-
and-see approach for Hong Kong, which experienced its strongest year ever in 2015, with hotel performance largely
having peaked. Pockets of liquidity will be seen across Southeast Asia and the Indian Ocean.
The landscape of India’s hotel sector is changing – from being development-driven to becoming more transaction-
based. A noticeable improvement in hotel operating performance is providing the impetus for acquisition and
consolidation in some markets.

Global Market Perspective, First Quarter 2016
COPYRIGHT © JONES LANG LASALLE IP, INC. 2016. All Rights Reserved 33
Wildcards
While pockets of volatility are challenging some investors – for example, the impact of low oil prices on Middle East
economies; volatility in equity markets; a prolonged slowdown in China; and economic malaise in emerging markets
such as Brazil and Russia – there will be plenty of ways to profit from property over the next 12 months.
A number of factors could impact our hotel transaction projections. On the upside, a stronger-than-expected push from
capital exporters in China and the Middle East would put an upward pressure on deal flow. Meanwhile, the U.S. has
just introduced a measure easing a 35-year-old tax on foreign investment into U.S. real estate, potentially opening the
door to greater purchases by overseas investors. Any large corporate-level real estate mergers and public-to-private
acquisitions – of which a few are expected – would also create a spike in volumes.
On the downside, terrorism, political conflict, natural disaster, a pandemic or other demand shocks have the potential to
impact travel and tourism. While fears about terrorism are not derailing travel globally, certain markets will see
pressures. Even Paris has not been immune to a slowdown in visitor arrivals but, based on the precedent in other cities
which have faced attacks, the travel disruption is hoped to be short-term.

COPYRIGHT © JONES LANG LASALLE IP, INC. 2016. All Rights Reserved 34
Global Market Perspective, First Quarter 2016
Residential Markets
Unprecedented vitality in U.S. rental apartments
Rental growth for apartments in the United States remained strong throughout tracked markets in 2015. Nationally,
rents have accelerated to 4.3% growth year-on-year, representing the fastest rate of increase this cycle and the largest
advance since the second quarter of 2008. Thirteen markets have seen rental growth in excess of 5% year-on-year,
with Western and Southeast regional markets seeing the greatest uplifts in rents, led by San Francisco’s 10.1% gain.
Yearly absorption on a national level continues to be unchanged at 1.6%, with all major markets demonstrating positive
absorption.
Markets have taken the influx of new development in their stride so far, due in part to the ever-expanding millennial
demographic, as well as the ongoing structural decline in homeownership rates. Nevertheless, select leading
development markets are beginning to dip into a concerning realm from a leasing perspective, notably in Boston and
Washington DC, as well as Austin, Minneapolis and Raleigh-Durham. While some of these markets are
experiencing the highest absorption rates at present in the U.S., they have simultaneously seen delivery levels outpace
them.
UK investment market expected to accelerate in 2016
UK average price growth will finish 2015 up around 7%, ahead of expectations. London average price growth will be
similar, although there is a large disparity between ‘Prime’ locations, which are now modestly falling, and outer London
locations, which remain among the most robust growth areas in the UK. Throughout 2015, policy changes adversely
affected demand for high-value property and that market will spend much of 2016 absorbing those changes before
recovering towards the end of the year.
Institutional investment deal volumes continue to grow. While forward-funding for ‘Build to Rent’ is still the most common
route to market, there are now assets that have been delivered under this emerging model that represent the first
buildings in this new asset class. JLL estimates that 2015 UK investment market volumes will be close to £2 billion,
which remains behind European residential investment market peers, but they are forecast to increase as more schemes
come to fruition in both London and increasingly in UK regional cities during 2016.
Germany achieves record transaction volumes
The residential investment market in Germany achieved record volumes in 2015, with more than €5 billion traded in the
final quarter alone. Over the year as a whole, €25 billion and almost 360,000 apartments changed hands. Almost half of
the total transaction volume was generated by four mega-deals with more than 15,000 apartments per transaction.
20% of national sales (measured in terms of turnover) of residential properties and portfolios took place in the Greater
Berlin area. This was followed at some distance behind by Hamburg (€880m) and Frankfurt (€780m). On the buy-
side, the transaction market is still dominated by domestic players, with foreign investors accounting for only 15% of
direct investments. The trend towards higher-yielding residential products, particularly new-build projects, micro-
apartments and student residences, will be sustained over the coming year and a transaction volume similar to 2015
levels remains achievable.
Robust investor demand in Sweden in Q4
The Swedish residential investment market continued to perform well in 2015, accounting for approximately one third of
total real estate investment volumes at €4.1 billion, slightly below 2014’s total of €4.4 billion. Nearly half of all activity
came in the final quarter, with €1.7 billion worth of deals completed. Looking ahead to 2016 we anticipate continued
high demand and healthy investment deal volumes in the residential sector.

Global Market Perspective, First Quarter 2016
COPYRIGHT © JONES LANG LASALLE IP, INC. 2016. All Rights Reserved 35
Demand stable in Portugal
The residential market in Portugal is stable, with good demand for house purchases in Lisbon and Porto. Foreign
investment, generally through the Golden Visa programme, had slowed over the past year but appeared to resume its
long-term trend in Q4 2015.
Dubai sales activity declines
There has been a continued decline in the volume of residential sales in Dubai as investors become more cautious.
Data from the Dubai Land Department shows a significant (36%) decline in the volume of activity (compared to 2014
levels). The increased maturity of the market is reflected in a much more modest fall in average sale prices, which
decreased by 13% for apartments and 11% for villas during 2015. Rentals in Dubai have held up more strongly than
sale prices, but average rents fell by around 3% over the past year, the first decline since 2010.
Rate cut supports sales in China; most other Asia Pacific markets less active
Policy restrictions remained in place in various markets across Asia. An accommodative credit policy stance (e.g.
interest rate cut) provided support for high-end sales volumes in China’s Tier I markets. Meanwhile, sales transactions
in the high-end market in Hong Kong during October and November were at multi-year lows, while new launches
received mixed responses from buyers. Subdued sales activity was also evident in Singapore with fewer new launches.
At the same time, leasing activity weakened in key markets including Hong Kong and Singapore. Most markets across
the region continued to see stable or small increases in rents and prices, a trend that is expected to continue over the
near term.

COPYRIGHT © JONES LANG LASALLE IP, INC. 2016. All Rights Reserved 36
Global Market Perspective, First Quarter 2016
Key Investment Transactions in Q4 2015
Europe, Middle East and Africa
Country City Property Sector
Sales price
US$m Comments
France Various Corridor Portfolio
Industrial 215
AEW Europe has acquired the portfolio from GLL Real Estate Partners. It will be placed in its Logistis fund and comprises eight high-quality, multi-tenanted logistics assets totalling 280,000 sq m, situated in prime logistics locations around Lille, Le Havre, Paris and Lyon.
Germany Various Victoria Portfolio Retail 250 Patrizia has acquired the retail portfolio from LaSalle Investment Management. It consists of 21 assets totalling over 180,000 sq m.
Germany Various Leonardo Hotels Portfolio
Hotels 435 Israel-based Fattal European Hotels Fund LP has sold an 18-hotel multi-branded portfolio in 12 German cities to Swedish hotel chain Pandox AB.
Ireland Various The National Portfolio
Retail 195
Davidson Kempner has acquired the retail portfolio from Bank of Ireland. The retail parks comprise more than 1.1 million sq ft of space and include Nutgrove Retail Park in Rathfarnham, Letterkenny Retail Park in Donegal, Sligo Retail Park, Tullamore Retail Park in Co Offaly and Deerpark Shopping Park in Killarney.
Italy Milan MG 22 Office 80 Investire SGR has sold the CBD office building to Coima SGR. It is located in the via Melchiorre Gioia 22 and has a total gross area of approximately 40,000 sq m.
Multiple Various K&K Hotels Portfolio
Hotels 317 The Austrian-based Koller family has sold its hotel portfolio to a JV involving US-based Highgate Hotels and Goldman Sachs. The sale included 10 hotels with 1,200 rooms in some of Europe's most sought-after cities.
Norway Oslo Oslo City Mixed 585 DNB has sold the combined shopping centre and office building with a total floor space of 82,250 sq m to a consortium consisting of Entra and Steen & Strom.
Poland Various Silesian Retail Portfolio
Retail 242
Rockcastle Global Real Estate has acquired the 106,700 sq m retail portfolio from BlackRock’s Real Estate division for €220.8 million. It comprises two shopping centres in Southern Poland: Karolinka in Opole and Pogoria in Dąbrowa Gornicza. Both centres are leased to leading international and national brands; in addition to Auchan, these include H&M, LPP Group, Inditex Group, Decathlon, Rossmann, OBI and Leroy Merlin.
UK London 55 Bishopsgate Office 285
Schroders has acquired the CPPIB development in the City of London. The 1992-built 55 Bishopsgate is majority let to Aon Benfield, which occupies 87,539 sq ft in the building. Other tenants include Brit Insurance, AMC Group and Folio UK, with the ground floor retail space let to Paperchase.
UK Various LRG Portfolio Hotels 1,470
American private equity firm Apollo Global Management has purchased a portfolio of 19 Holiday Inn and 3 Crowne Plaza hotels in the UK with a total of almost 6,000 rooms. The portfolio of hotels includes the 906-room Holiday Inn Kensington Forum and the Holiday Inn Heathrow.
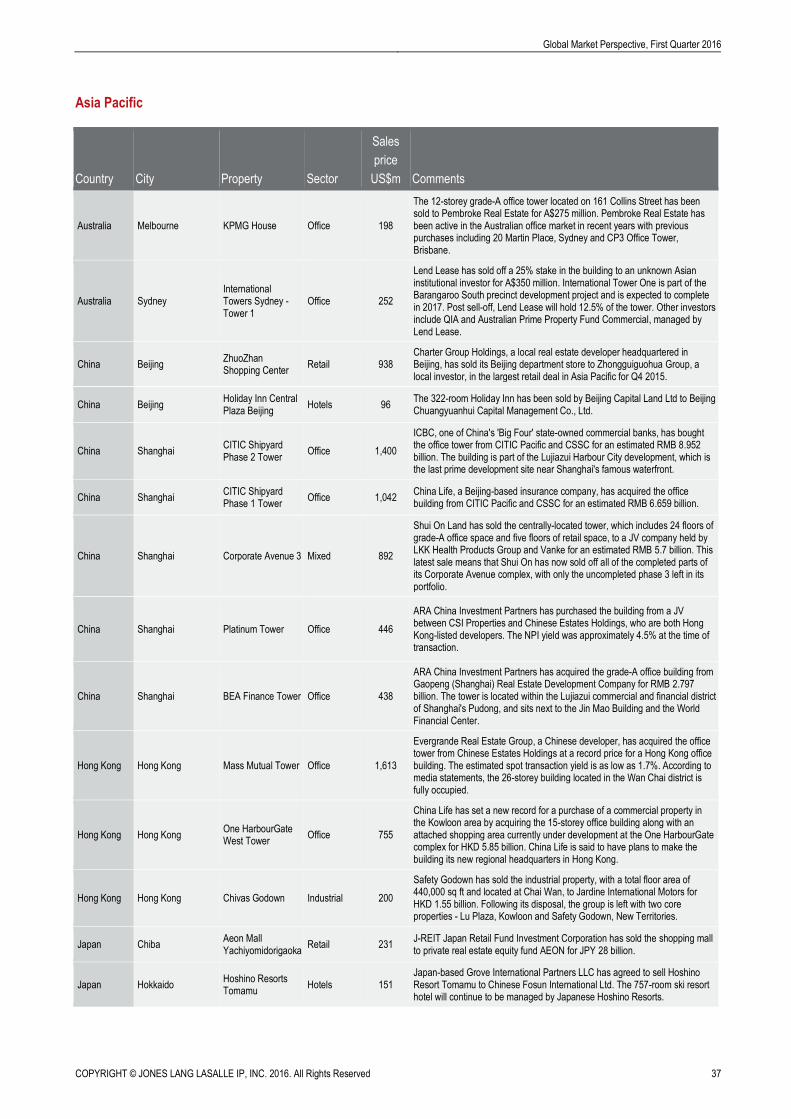
Global Market Perspective, First Quarter 2016
COPYRIGHT © JONES LANG LASALLE IP, INC. 2016. All Rights Reserved 37
Asia Pacific
Country City Property Sector
Sales
price
US$m Comments
Australia Melbourne KPMG House Office 198
The 12-storey grade-A office tower located on 161 Collins Street has been sold to Pembroke Real Estate for A$275 million. Pembroke Real Estate has been active in the Australian office market in recent years with previous purchases including 20 Martin Place, Sydney and CP3 Office Tower, Brisbane.
Australia Sydney International Towers Sydney - Tower 1
Office 252
Lend Lease has sold off a 25% stake in the building to an unknown Asian institutional investor for A$350 million. International Tower One is part of the Barangaroo South precinct development project and is expected to complete in 2017. Post sell-off, Lend Lease will hold 12.5% of the tower. Other investors include QIA and Australian Prime Property Fund Commercial, managed by Lend Lease.
China Beijing ZhuoZhan Shopping Center
Retail 938 Charter Group Holdings, a local real estate developer headquartered in Beijing, has sold its Beijing department store to Zhongguiguohua Group, a local investor, in the largest retail deal in Asia Pacific for Q4 2015.
China Beijing Holiday Inn Central Plaza Beijing
Hotels 96 The 322-room Holiday Inn has been sold by Beijing Capital Land Ltd to Beijing Chuangyuanhui Capital Management Co., Ltd.
China Shanghai CITIC Shipyard Phase 2 Tower
Office 1,400
ICBC, one of China's 'Big Four' state-owned commercial banks, has bought the office tower from CITIC Pacific and CSSC for an estimated RMB 8.952 billion. The building is part of the Lujiazui Harbour City development, which is the last prime development site near Shanghai's famous waterfront.
China Shanghai CITIC Shipyard Phase 1 Tower
Office 1,042 China Life, a Beijing-based insurance company, has acquired the office building from CITIC Pacific and CSSC for an estimated RMB 6.659 billion.
China Shanghai Corporate Avenue 3 Mixed 892
Shui On Land has sold the centrally-located tower, which includes 24 floors of grade-A office space and five floors of retail space, to a JV company held by LKK Health Products Group and Vanke for an estimated RMB 5.7 billion. This latest sale means that Shui On has now sold off all of the completed parts of its Corporate Avenue complex, with only the uncompleted phase 3 left in its portfolio.
China Shanghai Platinum Tower Office 446
ARA China Investment Partners has purchased the building from a JV between CSI Properties and Chinese Estates Holdings, who are both Hong Kong-listed developers. The NPI yield was approximately 4.5% at the time of transaction.
China Shanghai BEA Finance Tower Office 438
ARA China Investment Partners has acquired the grade-A office building from Gaopeng (Shanghai) Real Estate Development Company for RMB 2.797 billion. The tower is located within the Lujiazui commercial and financial district of Shanghai's Pudong, and sits next to the Jin Mao Building and the World Financial Center.
Hong Kong Hong Kong Mass Mutual Tower Office 1,613
Evergrande Real Estate Group, a Chinese developer, has acquired the office tower from Chinese Estates Holdings at a record price for a Hong Kong office building. The estimated spot transaction yield is as low as 1.7%. According to media statements, the 26-storey building located in the Wan Chai district is fully occupied.
Hong Kong Hong Kong One HarbourGate West Tower
Office 755
China Life has set a new record for a purchase of a commercial property in the Kowloon area by acquiring the 15-storey office building along with an attached shopping area currently under development at the One HarbourGate complex for HKD 5.85 billion. China Life is said to have plans to make the building its new regional headquarters in Hong Kong.
Hong Kong Hong Kong Chivas Godown Industrial 200
Safety Godown has sold the industrial property, with a total floor area of 440,000 sq ft and located at Chai Wan, to Jardine International Motors for HKD 1.55 billion. Following its disposal, the group is left with two core properties - Lu Plaza, Kowloon and Safety Godown, New Territories.
Japan Chiba Aeon Mall Yachiyomidorigaoka
Retail 231 J-REIT Japan Retail Fund Investment Corporation has sold the shopping mall to private real estate equity fund AEON for JPY 28 billion.
Japan Hokkaido Hoshino Resorts Tomamu
Hotels 151 Japan-based Grove International Partners LLC has agreed to sell Hoshino Resort Tomamu to Chinese Fosun International Ltd. The 757-room ski resort hotel will continue to be managed by Japanese Hoshino Resorts.
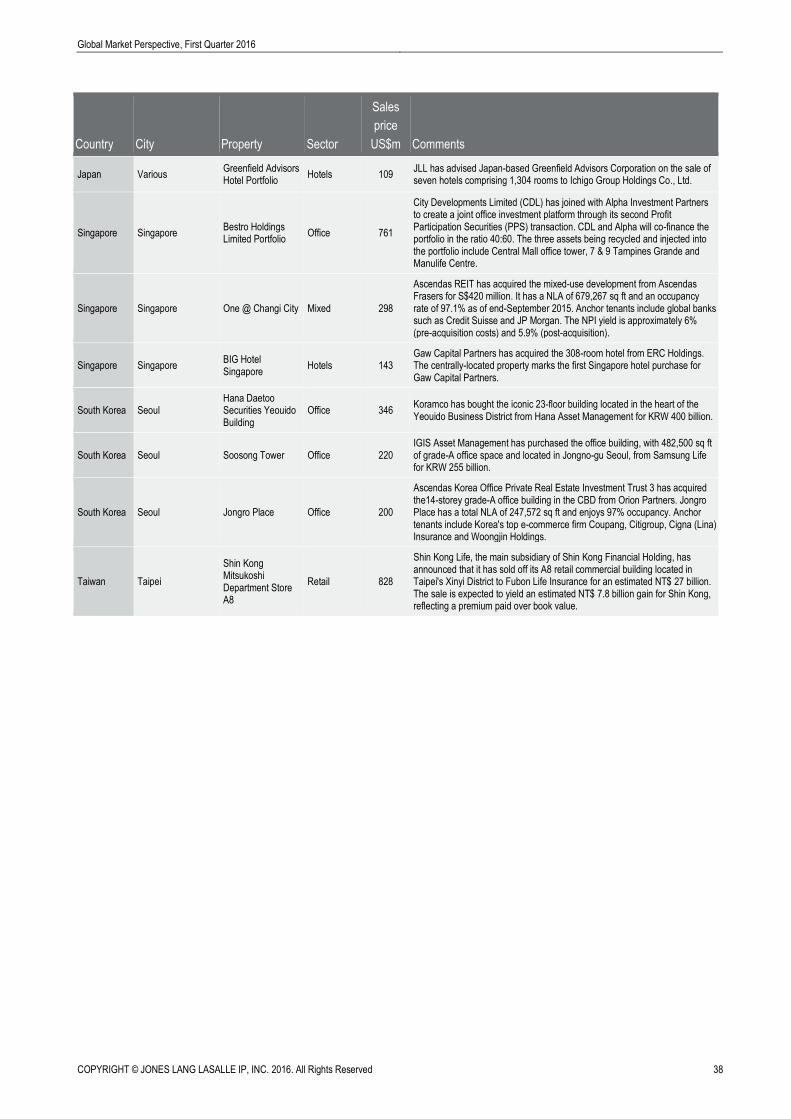
COPYRIGHT © JONES LANG LASALLE IP, INC. 2016. All Rights Reserved 38
Global Market Perspective, First Quarter 2016
Country City Property Sector
Sales
price
US$m Comments
Japan Various Greenfield Advisors Hotel Portfolio
Hotels 109 JLL has advised Japan-based Greenfield Advisors Corporation on the sale of seven hotels comprising 1,304 rooms to Ichigo Group Holdings Co., Ltd.
Singapore Singapore Bestro Holdings Limited Portfolio
Office 761
City Developments Limited (CDL) has joined with Alpha Investment Partners to create a joint office investment platform through its second Profit Participation Securities (PPS) transaction. CDL and Alpha will co-finance the portfolio in the ratio 40:60. The three assets being recycled and injected into the portfolio include Central Mall office tower, 7 & 9 Tampines Grande and Manulife Centre.
Singapore Singapore One @ Changi City Mixed 298
Ascendas REIT has acquired the mixed-use development from Ascendas Frasers for S$420 million. It has a NLA of 679,267 sq ft and an occupancy rate of 97.1% as of end-September 2015. Anchor tenants include global banks such as Credit Suisse and JP Morgan. The NPI yield is approximately 6% (pre-acquisition costs) and 5.9% (post-acquisition).
Singapore Singapore BIG Hotel Singapore
Hotels 143 Gaw Capital Partners has acquired the 308-room hotel from ERC Holdings. The centrally-located property marks the first Singapore hotel purchase for Gaw Capital Partners.
South Korea Seoul Hana Daetoo Securities Yeouido Building
Office 346 Koramco has bought the iconic 23-floor building located in the heart of the Yeouido Business District from Hana Asset Management for KRW 400 billion.
South Korea Seoul Soosong Tower Office 220 IGIS Asset Management has purchased the office building, with 482,500 sq ft of grade-A office space and located in Jongno-gu Seoul, from Samsung Life for KRW 255 billion.
South Korea Seoul Jongro Place Office 200
Ascendas Korea Office Private Real Estate Investment Trust 3 has acquired the14-storey grade-A office building in the CBD from Orion Partners. Jongro Place has a total NLA of 247,572 sq ft and enjoys 97% occupancy. Anchor tenants include Korea's top e-commerce firm Coupang, Citigroup, Cigna (Lina) Insurance and Woongjin Holdings.
Taiwan Taipei
Shin Kong Mitsukoshi Department Store A8
Retail 828
Shin Kong Life, the main subsidiary of Shin Kong Financial Holding, has announced that it has sold off its A8 retail commercial building located in Taipei's Xinyi District to Fubon Life Insurance for an estimated NT$ 27 billion. The sale is expected to yield an estimated NT$ 7.8 billion gain for Shin Kong, reflecting a premium paid over book value.
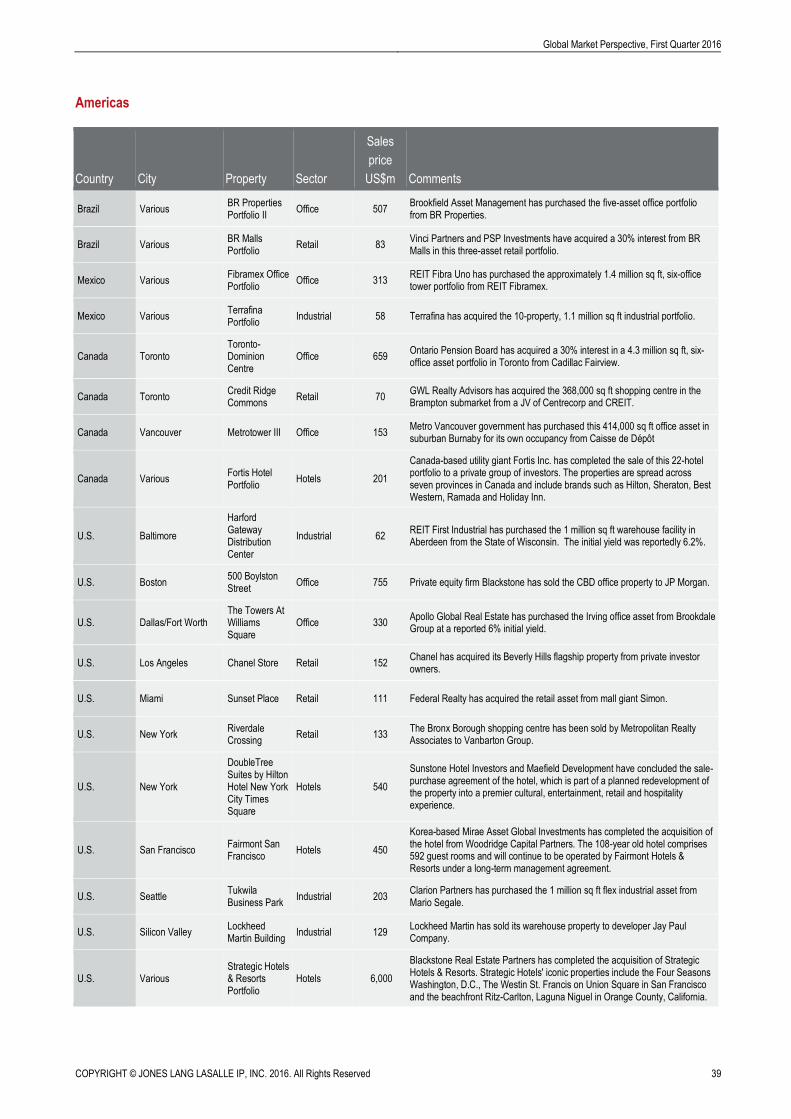
Global Market Perspective, First Quarter 2016
COPYRIGHT © JONES LANG LASALLE IP, INC. 2016. All Rights Reserved 39
Americas
Country City Property Sector
Sales
price
US$m Comments
Brazil Various BR Properties Portfolio II
Office 507 Brookfield Asset Management has purchased the five-asset office portfolio from BR Properties.
Brazil Various BR Malls Portfolio
Retail 83 Vinci Partners and PSP Investments have acquired a 30% interest from BR Malls in this three-asset retail portfolio.
Mexico Various Fibramex Office Portfolio
Office 313 REIT Fibra Uno has purchased the approximately 1.4 million sq ft, six-office tower portfolio from REIT Fibramex.
Mexico Various Terrafina Portfolio
Industrial 58 Terrafina has acquired the 10-property, 1.1 million sq ft industrial portfolio.
Canada Toronto Toronto-Dominion Centre
Office 659 Ontario Pension Board has acquired a 30% interest in a 4.3 million sq ft, six- office asset portfolio in Toronto from Cadillac Fairview.
Canada Toronto Credit Ridge Commons
Retail 70 GWL Realty Advisors has acquired the 368,000 sq ft shopping centre in the Brampton submarket from a JV of Centrecorp and CREIT.
Canada Vancouver Metrotower III Office 153 Metro Vancouver government has purchased this 414,000 sq ft office asset in suburban Burnaby for its own occupancy from Caisse de Dépôt
Canada Various Fortis Hotel Portfolio
Hotels 201
Canada-based utility giant Fortis Inc. has completed the sale of this 22-hotel portfolio to a private group of investors. The properties are spread across seven provinces in Canada and include brands such as Hilton, Sheraton, Best Western, Ramada and Holiday Inn.
U.S. Baltimore
Harford Gateway Distribution Center
Industrial 62 REIT First Industrial has purchased the 1 million sq ft warehouse facility in Aberdeen from the State of Wisconsin. The initial yield was reportedly 6.2%.
U.S. Boston 500 Boylston Street
Office 755 Private equity firm Blackstone has sold the CBD office property to JP Morgan.
U.S. Dallas/Fort Worth The Towers At Williams Square
Office 330 Apollo Global Real Estate has purchased the Irving office asset from Brookdale Group at a reported 6% initial yield.
U.S. Los Angeles Chanel Store Retail 152 Chanel has acquired its Beverly Hills flagship property from private investor owners.
U.S. Miami Sunset Place Retail 111 Federal Realty has acquired the retail asset from mall giant Simon.
U.S. New York Riverdale Crossing
Retail 133 The Bronx Borough shopping centre has been sold by Metropolitan Realty Associates to Vanbarton Group.
U.S. New York
DoubleTree Suites by Hilton Hotel New York City Times Square
Hotels 540
Sunstone Hotel Investors and Maefield Development have concluded the sale-purchase agreement of the hotel, which is part of a planned redevelopment of the property into a premier cultural, entertainment, retail and hospitality experience.
U.S. San Francisco Fairmont San Francisco
Hotels 450
Korea-based Mirae Asset Global Investments has completed the acquisition of the hotel from Woodridge Capital Partners. The 108-year old hotel comprises 592 guest rooms and will continue to be operated by Fairmont Hotels & Resorts under a long-term management agreement.
U.S. Seattle Tukwila Business Park
Industrial 203 Clarion Partners has purchased the 1 million sq ft flex industrial asset from Mario Segale.
U.S. Silicon Valley Lockheed Martin Building
Industrial 129 Lockheed Martin has sold its warehouse property to developer Jay Paul Company.
U.S. Various Strategic Hotels & Resorts Portfolio
Hotels 6,000
Blackstone Real Estate Partners has completed the acquisition of Strategic Hotels & Resorts. Strategic Hotels' iconic properties include the Four Seasons Washington, D.C., The Westin St. Francis on Union Square in San Francisco and the beachfront Ritz-Carlton, Laguna Niguel in Orange County, California.
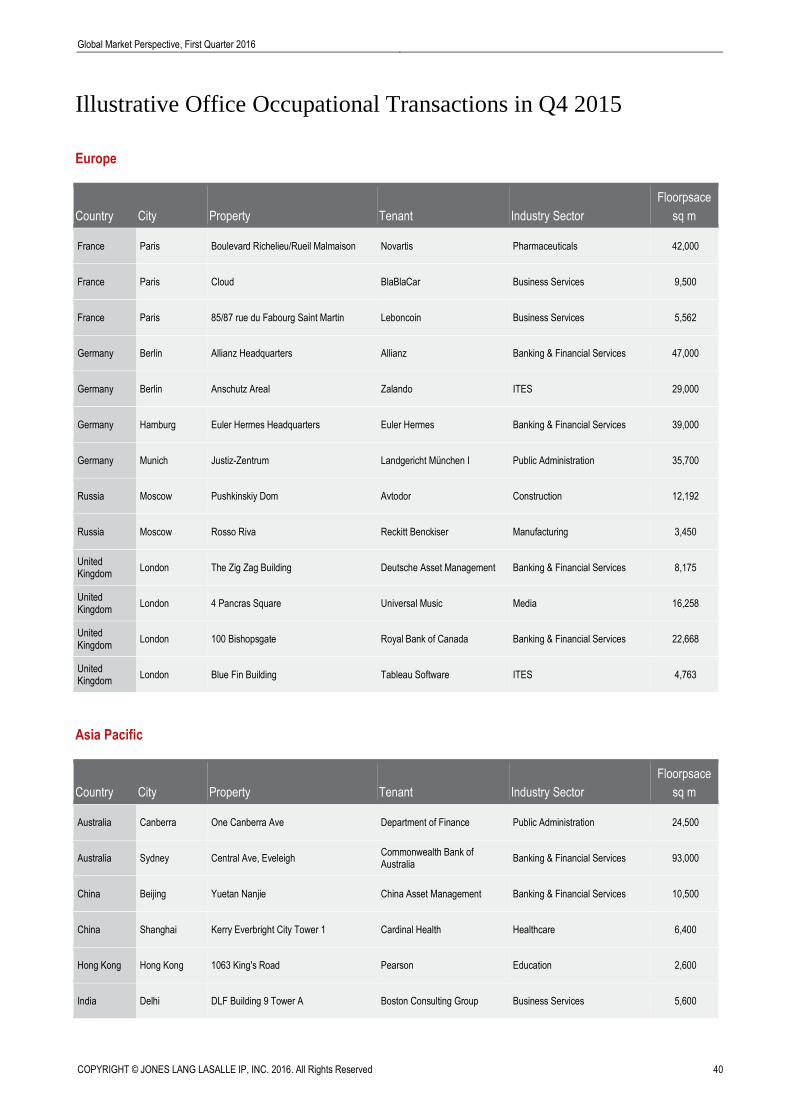
COPYRIGHT © JONES LANG LASALLE IP, INC. 2016. All Rights Reserved 40
Global Market Perspective, First Quarter 2016
Illustrative Office Occupational Transactions in Q4 2015
Europe
Country City Property Tenant Industry Sector
Floorpsace
sq m
France Paris Boulevard Richelieu/Rueil Malmaison Novartis Pharmaceuticals 42,000
France Paris Cloud BlaBlaCar Business Services 9,500
France Paris 85/87 rue du Fabourg Saint Martin Leboncoin Business Services 5,562
Germany Berlin Allianz Headquarters Allianz Banking & Financial Services 47,000
Germany Berlin Anschutz Areal Zalando ITES 29,000
Germany Hamburg Euler Hermes Headquarters Euler Hermes Banking & Financial Services 39,000
Germany Munich Justiz-Zentrum Landgericht München I Public Administration 35,700
Russia Moscow Pushkinskiy Dom Avtodor Construction 12,192
Russia Moscow Rosso Riva Reckitt Benckiser Manufacturing 3,450
United Kingdom
London The Zig Zag Building Deutsche Asset Management Banking & Financial Services 8,175
United Kingdom
London 4 Pancras Square Universal Music Media 16,258
United Kingdom
London 100 Bishopsgate Royal Bank of Canada Banking & Financial Services 22,668
United Kingdom
London Blue Fin Building Tableau Software ITES 4,763
Asia Pacific
Country City Property Tenant Industry Sector
Floorpsace
sq m
Australia Canberra One Canberra Ave Department of Finance Public Administration 24,500
Australia Sydney Central Ave, Eveleigh Commonwealth Bank of Australia
Banking & Financial Services 93,000
China Beijing Yuetan Nanjie China Asset Management Banking & Financial Services 10,500
China Shanghai Kerry Everbright City Tower 1 Cardinal Health Healthcare 6,400
Hong Kong Hong Kong 1063 King's Road Pearson Education 2,600
India Delhi DLF Building 9 Tower A Boston Consulting Group Business Services 5,600

Global Market Perspective, First Quarter 2016
COPYRIGHT © JONES LANG LASALLE IP, INC. 2016. All Rights Reserved 41
Country City Property Tenant Industry Sector
Floorpsace
sq m
India Mumbai Kalpataru Inspire Lupin Pharmaceuticals 7,200
Japan Tokyo Shiodome City Center Metal One Mitsui Bussan Resource & Structural Steel Corporation
Trading Company 3,700
Malaysia Kuala Lumpur Nu Tower 2 Convergys ITES 5,000
South Korea Seoul FKI Tower Pantos Logistics Logistics 5,681
Americas
Country City Property Tenant Industry Sector
Floorpsace
sq m
Brazil São Paulo Torre Matarazzo Banco do Brasil Banking & Financial Services 26,680
Brazil São Paulo Torre Morumbi - Ala A BB Mapfre Banking & Financial Services 23,378
Brazil São Paulo Teoemp SulAmérica Banking & Financial Services 12,350
Canada Montreal 5 Place Ville Marie Business Development Bank of Canada
Banking & Financial Services 16,072
Canada Toronto Hewlett-Packard Building Hewlett-Packard ITES 22,877
Canada Toronto 45 Parliament Street Equinix ITES 20,903
Mexico Mexico City Torre Diana AT&T Telecommunications 18,968
Mexico Mexico City Torre Diana Deloitte Business Services 8,189
U.S. Boston 529 Main Street Boston Medical Group Healthcare 15,961
U.S. Chicago 151 N. Franklin Street CNA Banking & Financial Services 25,548
U.S. Denver 16 Chestnut Place DaVita Healthcare 24,649
U.S. New Jersey 1 Hess Plaza New Jersey Turnpike Authority Public Administration 19,045
U.S. New York 1633 Broadway Morgan Stanley Banking & Financial Services 24,232
U.S. New York 10 Hudson Yards Boston Consulting Group Business Services 17,959
U.S. Raleigh-Durham 2200 W. Main Street Duke University Education 17,466
U.S. Seattle-Bellevue 1001 4th Avenue Safeco Banking & Financial Services 46,452
U.S. Silicon Valley 210-230 W. Tasman Avenue Silver Spring Networks ITES 17,630

COPYRIGHT © JONES LANG LASALLE IP, INC. 2016. All Rights Reserved 42
Global Market Perspective, First Quarter 2016
Country City Property Tenant Industry Sector
Floorpsace
sq m
U.S. Washington DC 175 N Street NE U.S. Department of Justice Public Administration 77,946
COPYRIGHT © JONES LANG LASALLE IP, INC. 2016.
This report has been prepared solely for information purposes and does not necessarily purport to be a complete analysis of the topics discussed, which are inherently unpredictable. It has been based on sources we believe to be reliable, but we have not independently verified those sources and we do not guarantee that the information in the report is accurate or complete. Any views expressed in the report reflect our judgment at this date and are subject to change without notice. Statements that are forward-looking involve known and unknown risks and uncertainties that may cause future realities to be materially different from those implied by such forward-looking statements. Advice we give to clients in particular situations may differ from
the views expressed in this report. No investment or other business decisions should be made based solely on the views expressed in this report


