US Army Corps of Engineers Hydrologic Engineering Center Corps Water Management System (CWMS) – Capabilities and Implementation Status May 2002 Approved for Public Release. Distribution Unlimited. TP-161
Transcript
US Army Corps of Engineers Hydrologic Engineering Center
Corps Water Management System (CWMS) – Capabilities and Implementation Status May 2002 Approved for Public Release. Distribution Unlimited. TP-161
Standard Form 298 (Rev. 8/98) Prescribed by ANSI Std. Z39-18
REPORT DOCUMENTATION PAGE Form Approved OMB No. 0704-0188
The public reporting burden for this collection of information is estimated to average 1 hour per response, including the time for reviewing instructions, searching existing data sources, gathering and maintaining the data needed, and completing and reviewing the collection of information. Send comments regarding this burden estimate or any other aspect of this collection of information, including suggestions for reducing this burden, to the Department of Defense, Executive Services and Communications Directorate (0704-0188). Respondents should be aware that notwithstanding any other provision of law, no person shall be subject to any penalty for failing to comply with a collection of information if it does not display a currently valid OMB control number. PLEASE DO NOT RETURN YOUR FORM TO THE ABOVE ORGANIZATION. 1. REPORT DATE (DD-MM-YYYY) May 2002
2. REPORT TYPE Technical Paper
3. DATES COVERED (From - To)
5a. CONTRACT NUMBER
5b. GRANT NUMBER
4. TITLE AND SUBTITLE Corps Water Management System (CWMS) – Capabilities and Implementation Status
5c. PROGRAM ELEMENT NUMBER
5d. PROJECT NUMBER 5e. TASK NUMBER
6. AUTHOR(S) Darryl W. Davis
5F. WORK UNIT NUMBER
7. PERFORMING ORGANIZATION NAME(S) AND ADDRESS(ES) US Army Corps of Engineers Institute for Water Resources Hydrologic Engineering Center (HEC) 609 Second Street Davis, CA 95616-4687
12. DISTRIBUTION / AVAILABILITY STATEMENT Approved for public release; distribution is unlimited. 13. SUPPLEMENTARY NOTES Presented at ASCE-EWRI Conference, Roanoke, VA, 22 May 2002. 14. ABSTRACT This paper provides an overview of the Corps Water Management System (CWMS) which is an automated information system that supports the U.S. Army Corps of Engineers water control management mission of regulating river flow by more that 700 reservoir and water control structures. CWMS is a nationwide integrated system of hardware and software that enables Corps offices to acquire and manage real-time hydromet and system status data, perform forecasting and decision-support analysis, and provide for user access to virtually any data and information in the system. 15. SUBJECT TERMS Corps Water Management System, CWMS, capabilities, implementation, water control management 16. SECURITY CLASSIFICATION OF: 19a. NAME OF RESPONSIBLE PERSON a. REPORT U
b. ABSTRACT U
c. THIS PAGE U
17. LIMITATION OF ABSTRACT UU
18. NUMBER OF PAGES 18 19b. TELEPHONE NUMBER
Corps Water Management System (CWMS) – Capabilities and Implementation Status
May 2002 US Army Corps of Engineers Institute for Water Resources Hydrologic Engineering Center 609 Second Street Davis, CA 95616 (530) 756-1104 (530) 756-8250 FAX www.hec.usace.army.mil TP-161
Papers in this series have resulted from technical activities of the Hydrologic Engineering Center. Versions of some of these have been published in technical journals or in conference proceedings. The purpose of this series is to make the information available for use in the Center's training program and for distribution with the Corps of Engineers. The findings in this report are not to be construed as an official Department of the Army position unless so designated by other authorized documents. The contents of this report are not to be used for advertising, publication, or promotional purposes. Citation of trade names does not constitute an official endorsement or approval of the use of such commercial products.
Corps Water Management System - Capabilities and Implementation Status
Darryl W. Davis
Abstract
The Corps Water Management System (CWMS) is the automated information system that supports the U.S. Army Corps of Engineers (Corps) water control management mission of regulating river flow by more than 700 reservoir and water control structures. CWMS is a nationwide integrated system of hardware and software that enables Corps offices to acquire and manage real-time hydromet and system status data, perform forecasting and decision-support analysis, and provide for user access to virtually any data and information in the system. The prior system, known as the Water Control Data System (WCDS) has been in service since the late 1970's.. Advances in computer and related hardkare and software provided the opportunity to upgrade the system and improve execution of the water management mission. The new modernized CWMS includes replacing computer hardware, creation of a corporate water control management database system, and upgrading and development of new modeling and decision support software. The project to modernize CWMS software and database system began in 1997 and has now progressed from software development and testing phase to the deployment phase. Corps-wide deployment began in the summer of 2001 and will be completed in December 2002, progressing region by region within the U.S. CWMS software is comprised of the following components: data acquisition and validation; database; data dissemination; forecasting and decision support modeling; and control and visualization interface.
Background
As part of its Civil Works mission, the US Army Corps of Engineers plans, designs, constructs and operates a variety of water resource projects. Projects include, for example, multi-purpose storage reservoirs, navigation dams and locks, and levee and bypass systems with closure and diversion structures. Corps Emergency Operations often include re-enforcing or temporarily raising levees, sandbagging efforts, and evacuation during flooding. The Corps Water Management System (CWMS) is used to acquire real-time data on watershed conditions, develop forecasts of project inflows and uncontrolled flows below projects, determine project releases, and evaluate impacts of alternative release scenarios.. CWMS provides critical information to Corps water managers to make informed decisions under a variety of routine and emergency conditions. Corps' water managers work in close coordination with other Federal (i.e. National Weather Service, US Bureau of Reclamation, Federal Emergency Management Agency), state, and local water and emergency management organizations, to carry out their missions and
' Director, Hydrologic Engineering Center, US Army Corps of Engineers, 609 Second Street, Davis, CA 95616; phone (530) 756-1 104; [email protected] Presented at ASCE-EWRI Conference, Roanoke, VA, May 22,2002.
responsibilities. Water management information is also provided to the media and the public. CWMS was modernized to incorporate state-of-the-art hydrologic modeling techniques,
real-time data processing, decision-support tools and network-based information dissemination. The system is now being deployed in each Corps field office with water control management responsibilities - about thirty-five offices. The system was modernized under the rigorous management purview of the Army's Life Cycle Management of Information Systems (LCMIS) process and is now an official Army Automated Information System (AIS)..
CWMS Overview
CWMS encompasses steps in the water control management process starting from the receipt of hydromet and watershed data and project status data, through the modeling of system response and decision support analysis, ending with the dissemination of data and decision results. The incoming real-time data include river stage, reservoir elevation, gage precipitation, WSR-88D spatial precipitation, quantitative precipitation forecasts (QPF) and other hydro-meteorological parameters. These data are used to derive the hydrologic response throughout a watershed area, including short-term future reservoir inflows and local uncontrolled downstream flows. The reservoir operation model flows are then processed to provide proposed releases to meet reservoir and downstream operation goals. Then, based on the total expected flows in the river system, river profiles are computed, inundated areas mapped, and flood impacts analyzed. CWMS allows evaluation of any number of' operation alternatives before a final forecast scenario and release decision are adopted. For example, various alternative hture precipitation amounts may be considered, hydrologic response may be altered, reservoir release rules may be investigated, and alternative bridge obstruction, levee integrity, or other river conditions may be evaluated. When an operation decision is made the results, along with supporting hydromet, watershed, and project status and release data may be disseminated to others via web technology.
The system emphasizes visualization of information in time and space. The primary CWMS user interface is map based to provide clear spatial reference for watershed and modeling information. Corpsview, a Corps developed spatial visualization tool based on commercially available GIs software, provides a direct user interface to GIs products and associated spatial attribute information. The system is 'live' 2417, continuously providing support during routine high and low flow periods, and during emergencies. CWMS is self-monitoring providing automated status information on components and processes, and alerting to service needs.
CWMS Components
Figure 1 shows the major components of the CWMS (counter cloclwise from upper left): Data Acquisition (DA), Database (DB), Modeling (MOD), Control and Visualization Interface (CAVI), Data Dissemination (DD).. These components have been developed in network client- server architecture, permitting each component of the system to be hosted on one or more separate hardware platforms. The current server side equipment is Sun Solaris machine(s) and the client (CAVI) side can be fielded on Windows 2000 or Sun Solaris.. The major portions of the products are written in Java, with Fortran, and C++ used for certain of the model computations.. The CWMS components shown would typically be installed in a local area subnet within each of'the thirty-five Corps field offices.
, Dissemina-
Data-
Control and Visualization
Interface
Figure 1. CWMS schematic and components.
Data Acquisition. The Data Acquisition (DA) component is responsible for ingesting data from any of the supported data sources. Currently, the primary data streams processed in the Corps are GOES Data Collection Platform (DCP) and National Weather Service SHEF. These and other formatted data may be processed as it is received via FTP or other file transfers, or via point-to-point network socket connections.. Either type data is written directly to permanent storage and is then operated upon by the data acquisition software. Two levels of data screening may be performed.. "On-the-fly" screening uses only simple magnitude and range checks. The second level of screening can perform tests that consider the rate-of-change of variables, comparison with neighboring stations, and other statistical tests. The DA component is also responsible for the derivation of secondary parameters. Typical derivations include: reservoir pool elevation to reservoir storage, river stage to flow, and accumulative precipitation to incremental precipitation.. All data is stored in the database during its processing by the DA components. The data acquisition display is user configurable to depict data status via color bars positioned on a background map. These bars are time-scaled and reflect the data quality assigned during screening (e.g.. green - OK, yellow - questionable, red - rejected). Graphic/tabular editing screens are available to correct data with quality problems.
Database. The Database (DB) component provides permanent data storage for the system. It is responsible for the management of all data received from the data streams and all data generated as derive and modeling operations are performed. The record database is an Oracle relational database designed for standard application in all Corps water management CWMS installations. The Database Interface (DBI) controls all data written to or read from the database. The DBI
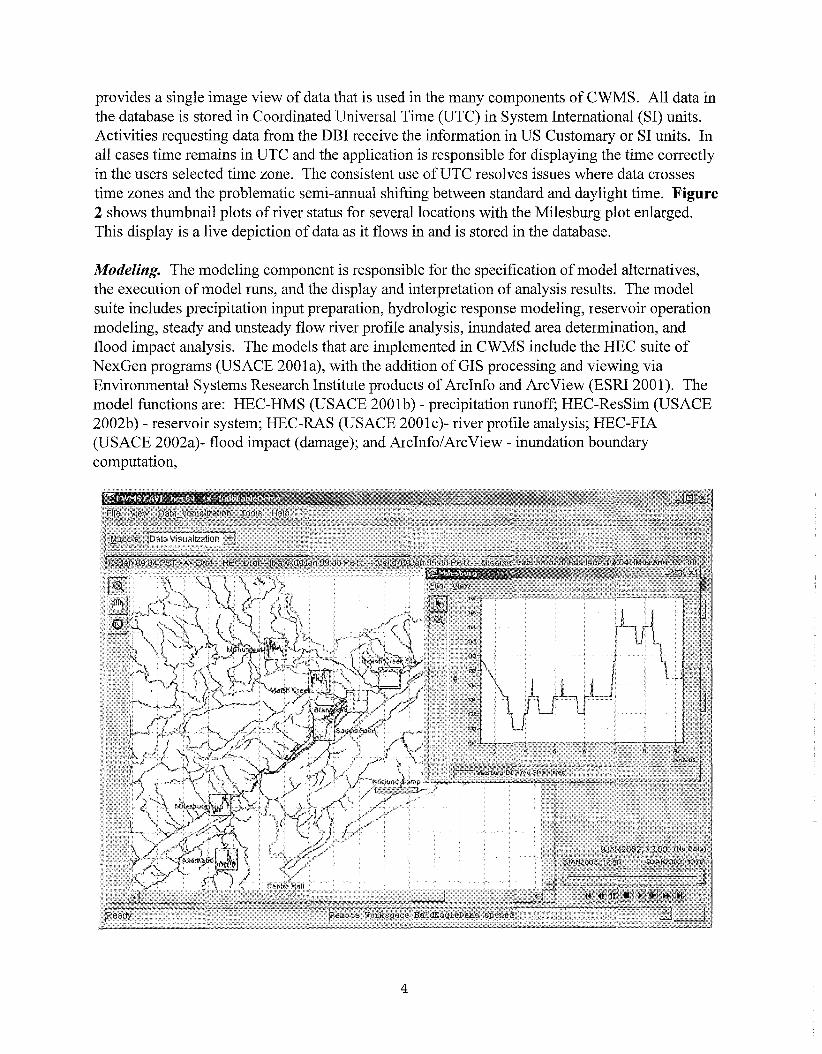
provides a single image view of data that is used in the many components of CWMS. All data in the database is stored in Coordinated Universal Time (UTC) in System International (SI) units. Activities requesting data from the DBI receive the information in US Customary or SI units. In all cases time remains in UTC and the application is responsible for displaying the time correctly in the users selected time zone.. The consistent use of UTC resolves issues where data crosses time zones and the problematic semi-annual shifting between standard and daylight time. Figure 2 shows thumbnail plots of river status for several locations with the Milesburg plot enlarged. This display is a live depiction of data as it flows in and is stored in the database.
Modeling. The modeling component is responsible for the specification of model alternatives, the execution of model runs, and the display and interpretation of' analysis results. The model suite includes precipitation input preparation, hydrologic response modeling, reservoir operation modeling, steady and unsteady flow river profile analysis, inundated area determination, and flood impact analysis. The models that are implemented in CWMS include the HEC suite of NexGen programs (USACE 2001a), with the addition of GIs processing and viewing via Environmental Systems Research Institute products of ArcInfo and ArcView (ESRI 2001). The model functions are: HEC-HMS (USACE 2001b) - precipitation runoff; HEC-ResSim (USACE 2002b) - reservoir system; HEC-RAS (USACE 2001~)- river profile analysis; HEC-FIA (USACE 2002a)- flood impact (damage); and ArcInfoIArcView - inundation boundary computation,
Figure 2. Live thumbnail plots from database. and GIs information viewing. Access for set up, seamless model execution as an integrated suite, and viewing is via the CAVI. The integration schema permits other supplementary models (than those presently implemented) to be substituted or added so that they would function in a similar transparent and seamless manner.
Figure 3 shows the models as integrated in CWMS, and Figure 4 is the CAVI dialogue for specifying a forecast alternative.. At a user specified forecast time, data pertinent to a watershed area is extracted from the database and placed in a modeling sub-database. This sub- database is then the source and destination for all model runs and all the alternatives that are evaluated.. At completion of the analysis the final operation alternative results are posted back to the Oracle database for dissemination. The sub-database, the related model parameters, and specific model output and log files can be saved to off-line storage to serve as a complete record of the analysis performed to support the decision process.. Figure 6 (included later) is an example of the model interface for the test watershed in Bald Eagle Creek, Pennsylvania. The depiction is a zoomed window displaying the model layer for reservoir analysis. Other model layers of watershed basinslflow, flood impact, and stage can be displayed separately or as multiple overlays depending on user preference.
Hydrologic modeling. The hydrologic response of the watershed is modeled using spatially distributed precipitation. HEC-HMS accepts gridded precipitation from both radar and point precipitation gage sources.. Digital Elevation Model (DEM) data is used to develop model basin boundaries and parameters. Runoff excess from each grid cell is determined and is routed using the Modified Clark procedure to provide runoff at the sub-basin outlet. Sub-basin hydrographs are then routed down through the channel network to develop flow into reservoirs, and local flow at downstream locations.. The HMS model is set up and calibrated for a base forecast condition outside of the CWMS environment and inserted into the CWMS system - a one time (or occasional) set up.. Within C W S , selected model adjustments are permitted in the forecast mode, for example, general wetness condition (loss rates) by watershed region, and this capability is operated via the CAVI,. Figure 5 depicts the HEC-HMS model layout.
Reservoir modeling. The analysis of reservoir operations is performed using HEC- ResSim. This newly developed reservoir simulation program determines project releases based on a set of user supplied operation rules. A reservoir model is defined over a stream alignment,
Figure 5. Typical HEC-HMS model schematic and results.
which shows the river network underlying the system model. Model objects representing reservoirs and channel reaches, are drawn by selecting an object tool from the tool list and locating the upstream and downstream ends ofthe object on the stream alignment.. Operational data are defined and stored separately for each reservoir. Each reservoir "owns" one or more sets of data that define the operational storage zones and associated release rules. Rules can be defined to control individual outlets within the outlet works or groups of outlets. Rules are also available to control operation for downstream goals or constraints.
This rule-based approach allows good flexibility in describing desired behavior for individual reservoirs operating for multiple local and downstream goals, as well as when reservoirs must operate as a system. The reservoir model uses inflows generated from the hydrologic model runs.. Initial pool elevation, its corresponding reservoir storage and known project releases must be available to properly initialize the model. In cases where different rules lead to a conflict in determining releases, a rule priority is used to resolve the conflict. The determined releases are then combined with local uncontrolled flows from the hydrologic model to provide total flows throughout the watershed. Figure 6 depicts the reservoir layer in the model interface of the CAVI. Note that the display panel with an anay of display choices is activated by selecting the control point of' interest on the stream alignment shown in the reservoir layer.
River Profile modeling. The total river flow for each of the alternatives is used to determine the water surface profiles before, through, and downstream of the reservoirs. The HEC-RAS model is capable of generating both steady and unsteady flow profiles. Each of these
determinations is based on a stream model that includes in-line structures and cross-section
Figure 6. HEC-ResSim reservoir layer and sample display.
geometry. Geo-spatial tools may be used to assist in generating ihe necessary cross-sections from triangular irregular network (TIN) files. Because this operation can be performed with spatially registered cross-sections, the resulting water surface profiles can be used to map inundated areas. Figure 7 shows output displays from the river profile analysis with HEC-RAS. The inset is a quasi- 3D representation of the stream; this display can be animated to show the
rise and fall of the profile during passage of a forecast flood event. Flood Impact Analysis. Based on the information available from the preceding model
steps the impacts of'flows and stages may be evaluated. This evaluation is based on relationships between flow andlor stage and various evaluation functions, such as damage, arealproperties impacted, and emergency response table,. The damage functions may reflect urban, suburban, and agricultural conditions.. Impacts are evaluated for any number of impact areas as defined by the user. Impact results may be aggregated by county, state, congressional district, or other desired spatial entity. The relationships used for computing impact analysis in real-time are separately prepared in a one time, or occasional, set up step. A number of GIs-based and other utilities are available to assist in function development. Figure 8 is the CAVI display for the flood impact layer of the model interface. Selecting the impact area of interest brings up a number of displays and tabulations for selection by the user.
Data Dissemination. Internet Web and other automated technology is used to provide information from the CWMS to interested parties. Data received from the data acquisition
components, derived data, and final project operation data are available for dissemination to
Bald Eagle Cr for the WCDS Project Plan: Unsteady with Bridges and Dam
WS 19Feb19990200
t
Main Channel Distance (n)
* P
Figure 7. River profile example displays.
Figure 8. Flood impact layer of model interface. other Corps offices, cooperating Federal, state and local agencies, and other public and private interests.. A close working relationship exists between the Corps of Engineers and the National Weather Service (NWS). Information that the Corps of Engineers disseminates is solely associated with its mission to operate water projects, and to perform emergency flood fight activities. Public dissemination of flood alerts, flood warnings, and other weather information is the responsibility of'the NWS. Figure 9 is a depiction of a sample Web-accessible display automatically generated via selecting a 'posting' option from the CAVI.
Deployment and Implementation
CWMS is an official Army AIS that has progressed through the various LCMIS milestones, recently achieving Milestone Decision I11 (approval to deploy) in August 2001. Deployment of the system began in July 2001 and is proceeding systematically across the Nation Corps region by Corps region. Deployment will be concluded in December 2002. For each Corps office with water control management responsibilities (about thirty-five offices), deployment consists of installing and testing the CWMS server, client, database, and Commercial (COTS) software; activating the live data feeds and processing; installing and activating the Oracle database;
configuring, preparing data, and calibrating the forecasting and decision support models; creating
Figure 9. Sample Web posting of forecast results. proper administration and security processes for the system, and achieving on-site user training and operation. Successful deployment results in fully operational CWMS for at least one meaningful watershed within the office's geographic area. Full implementation, that is extension of the coverage to the office's remaining geographic area and water control projects, is expected to occur over the 3 to 5 years following deployment. At the time of preparation of this paper, deployment had been accomplished for approximately half of the Corps offices.
Acknowledgments
Planning, design, development, testing, and deployment of CWMS has been a model of teamwork among HEC staff and the extended community of other participants across the Corps and in the private sector. HEC is the responsible 'materiel developer' under the HQUSACE program manager; Corps field office teams developed the system requirements; HEC staff led the software development with assistance by a private contractor; selected field offices served as test sites throughout the development process; and a senior water management group provided oversight. Principal HEC staff with leadership roles in CWMS development include, besides the author: Art Pabst - Technical Director; Dan Barcellos - database system; Bill Charley - CAVI and models team leader; Carl Franke - data acquisition and data dissemination; Matt McPherson - data validatiodtransformation; Tom Evans - runoff forecasting and deployment coordinator; Gary Brunner - river profile modeling; Joan Klipsch - reservoir system modeling; and Penni Baker - flood impact modeling. The GIs-related activities team member is Tim Pangburn, USACE Remote Sensing and GIs Center.. John DeGeorge and his team at RMA Associates, Fairfield, CA contributed substantially to software development for the DBI, flood impact and reservoir models, and overall system integration.
References
ESRI (2001).. ArcInfo and Arcview, Geographic Information Systems, copyrighted products of Environmental Systems Research Institute, Redlands, CA.
USACE (2002a).. HEC-FIA, Flood Impact Analysis User's Manual - Version 1 ..0, Hydrologic Engineering Center, Davis, CA..
USACE (2002b). HEC-ResSim, Reservoir System Simulation System User's Manual - Version 1 .O, Hydrologic Engineering Center, Davis, CA.
USACE (2001 a). FY 2000 Annual Report, Hydrologic Engineering Center, Davis, CA.
USACE (2001 b).. HEC-HMS, Hydrologic Modeling System User's Manual - Version 2.1 Hydrologic Engineering Center, Davis, CA.
USACE (200 1 c) . HEC-RAS, River Analysis System User's Manual - Version 3 .O, Hydrologic Engineering Center, Davis, CA.
Technical Paper Series TP-1 Use of Interrelated Records to Simulate Streamflow TP-2 Optimization Techniques for Hydrologic
Engineering TP-3 Methods of Determination of Safe Yield and
Compensation Water from Storage Reservoirs TP-4 Functional Evaluation of a Water Resources System TP-5 Streamflow Synthesis for Ungaged Rivers TP-6 Simulation of Daily Streamflow TP-7 Pilot Study for Storage Requirements for Low Flow
Augmentation TP-8 Worth of Streamflow Data for Project Design - A
Pilot Study TP-9 Economic Evaluation of Reservoir System
Accomplishments TP-10 Hydrologic Simulation in Water-Yield Analysis TP-11 Survey of Programs for Water Surface Profiles TP-12 Hypothetical Flood Computation for a Stream
System TP-13 Maximum Utilization of Scarce Data in Hydrologic
Design TP-14 Techniques for Evaluating Long-Tem Reservoir
Yields TP-15 Hydrostatistics - Principles of Application TP-16 A Hydrologic Water Resource System Modeling
Techniques TP-17 Hydrologic Engineering Techniques for Regional
Water Resources Planning TP-18 Estimating Monthly Streamflows Within a Region TP-19 Suspended Sediment Discharge in Streams TP-20 Computer Determination of Flow Through Bridges TP-21 An Approach to Reservoir Temperature Analysis TP-22 A Finite Difference Methods of Analyzing Liquid
Flow in Variably Saturated Porous Media TP-23 Uses of Simulation in River Basin Planning TP-24 Hydroelectric Power Analysis in Reservoir Systems TP-25 Status of Water Resource System Analysis TP-26 System Relationships for Panama Canal Water
Supply TP-27 System Analysis of the Panama Canal Water
Supply TP-28 Digital Simulation of an Existing Water Resources
System TP-29 Computer Application in Continuing Education TP-30 Drought Severity and Water Supply Dependability TP-31 Development of System Operation Rules for an
Existing System by Simulation TP-32 Alternative Approaches to Water Resources System
Simulation TP-33 System Simulation of Integrated Use of
Hydroelectric and Thermal Power Generation TP-34 Optimizing flood Control Allocation for a
Multipurpose Reservoir TP-35 Computer Models for Rainfall-Runoff and River
Hydraulic Analysis TP-36 Evaluation of Drought Effects at Lake Atitlan TP-37 Downstream Effects of the Levee Overtopping at
Wilkes-Barre, PA, During Tropical Storm Agnes TP-38 Water Quality Evaluation of Aquatic Systems
TP-39 A Method for Analyzing Effects of Dam Failures in Design Studies
TP-40 Storm Drainage and Urban Region Flood Control Planning
TP-41 HEC-5C, A Simulation Model for System Formulation and Evaluation
TP-42 Optimal Sizing of Urban Flood Control Systems TP-43 Hydrologic and Economic Simulation of Flood
Control Aspects of Water Resources Systems TP-44 Sizing Flood Control Reservoir Systems by System
Analysis TP-45 Techniques for Real-Time Operation of Flood
Control Reservoirs in the Merrimack River Basin TP-46 Spatial Data Analysis of Nonstructural Measures TP-47 Comprehensive Flood Plain Studies Using Spatial
Data Management Techniques TP-48 Direct Runoff Hydrograph Parameters Versus
Urbanization TP-49 Experience of HEC in Disseminating Information
on Hydrological Models TP-50 Effects of Dam Removal: An Approach to
Sedimentation TP-51 Design of Flood Control Improvements by Systems
Analysis: A Case Study TP-52 Potential Use of Digital Computer Ground Water
Models TP-53 Development of Generalized Free Surface Flow
Models Using Finite Element Techniques TP-54 Adjustment of Peak Discharge Rates for
Urbanization TP-55 The Development and Servicing of Spatial Data
Management Techniques in the Corps of Engineers TP-56 Experiences of the Hydrologic Engineering Center
in Maintaining Widely Used Hydrologic and Water Resource Computer Models
TP-57 Flood Damage Assessments Using Spatial Data Management Techniques
TP-58 A Model for Evaluating Runoff-Quality in Metropolitan Master Planning
TP-59 Testing of Several Runoff Models on an Urban Watershed
TP-60 Operational Simulation of a Reservoir System with Pumped Storage
TP-61 Technical Factors in Small Hydropower Planning TP-62 Flood Hydrograph and Peak Flow Frequency
Analysis TP-63 HEC Contribution to Reservoir System Operation TP-64 Determining Peak-Discharge Frequencies in an
Urbanizing Watershed: A Case Study TP-65 Feasibility Analysis in Small Hydropower Planning TP-66 Reservoir Storage Determination by Computer
Simulation of Flood Control and Conservation Systems
TP-67 Hydrologic Land Use Classification Using LANDSAT
TP-68 Interactive Nonstructural Flood-Control Planning TP-69 Critical Water Surface by Minimum Specific
Energy Using the Parabolic Method
TP-70 Corps of Engineers Experience with Automatic Calibration of a Precipitation-Runoff Model
TP-71 Determination of Land Use from Satellite Imagery for Input to Hydrologic Models
TP-72 Application of the Finite Element Method to Vertically Stratified Hydrodynamic Flow and Water Quality
TP-73 Flood Mitigation Planning Using HEC-SAM TP-74 Hydrographs by Single Linear Reservoir Model TP-75 HEC Activities in Reservoir Analysis TP-76 Institutional Support of Water Resource Models TP-77 Investigation of Soil Conservation Service Urban
Hydrology Techniques TP-78 Potential for Increasing the Output of Existing
Hydroelectric Plants TP-79 Potential Energy and Capacity Gains from Flood
Control Storage Reallocation at Existing U.S. Hydropower Reservoirs
TP-80 Use of Non-Sequential Techniques in the Analysis of Power Potential at Storage Projects
TP-81 Data Management Systems of Water Resources Planning
TP-82 The New HEC-1 Flood Hydrograph Package TP-83 River and Reservoir Systems Water Quality
Modeling Capability TP-84 Generalized Real-Time Flood Control System
Model TP-85 Operation Policy Analysis: Sam Rayburn
Reservoir TP-86 Training the Practitioner: The Hydrologic
Engineering Center Program TP-87 Documentation Needs for Water Resources Models TP-88 Reservoir System Regulation for Water Quality
Control TP-89 A Software System to Aid in Making Real-Time
Water Control Decisions TP-90 Calibration, Verification and Application of a Two-
Dimensional Flow Model TP-91 HEC Software Development and Support TP-92 Hydrologic Engineering Center Planning Models TP-93 Flood Routing Through a Flat, Complex Flood
Plain Using a One-Dimensional Unsteady Flow Computer Program
TP-94 Dredged-Material Disposal Management Model TP-95 Infiltration and Soil Moisture Redistribution in
HEC-1 TP-96 The Hydrologic Engineering Center Experience in
Nonstructural Planning TP-97 Prediction of the Effects of a Flood Control Project
on a Meandering Stream TP-98 Evolution in Computer Programs Causes Evolution
in Training Needs: The Hydrologic Engineering Center Experience
TP-99 Reservoir System Analysis for Water Quality TP-100 Probable Maximum Flood Estimation - Eastern
United States TP-101 Use of Computer Program HEC-5 for Water Supply
Analysis TP-102 Role of Calibration in the Application of HEC-6 TP-103 Engineering and Economic Considerations in
Formulating TP-104 Modeling Water Resources Systems for Water
Quality
TP-105 Use of a Two-Dimensional Flow Model to Quantify Aquatic Habitat
TP-106 Flood-Runoff Forecasting with HEC-1F TP-107 Dredged-Material Disposal System Capacity
Expansion TP-108 Role of Small Computers in Two-Dimensional
Flow Modeling TP-109 One-Dimensional Model for Mud Flows TP-110 Subdivision Froude Number TP-111 HEC-5Q: System Water Quality Modeling TP-112 New Developments in HEC Programs for Flood
Control TP-113 Modeling and Managing Water Resource Systems
for Water Quality TP-114 Accuracy of Computer Water Surface Profiles -
Executive Summary TP-115 Application of Spatial-Data Management
Techniques in Corps Planning TP-116 The HEC's Activities in Watershed Modeling TP-117 HEC-1 and HEC-2 Applications on the
Microcomputer TP-118 Real-Time Snow Simulation Model for the
Monongahela River Basin TP-119 Multi-Purpose, Multi-Reservoir Simulation on a PC TP-120 Technology Transfer of Corps' Hydrologic Models TP-121 Development, Calibration and Application of
Runoff Forecasting Models for the Allegheny River Basin
TP-122 The Estimation of Rainfall for Flood Forecasting Using Radar and Rain Gage Data
TP-123 Developing and Managing a Comprehensive Reservoir Analysis Model
TP-124 Review of U.S. Army corps of Engineering Involvement With Alluvial Fan Flooding Problems
TP-125 An Integrated Software Package for Flood Damage Analysis
TP-126 The Value and Depreciation of Existing Facilities: The Case of Reservoirs
TP-127 Floodplain-Management Plan Enumeration TP-128 Two-Dimensional Floodplain Modeling TP-129 Status and New Capabilities of Computer Program
HEC-6: "Scour and Deposition in Rivers and Reservoirs"
TP-130 Estimating Sediment Delivery and Yield on Alluvial Fans
TP-131 Hydrologic Aspects of Flood Warning - Preparedness Programs
TP-132 Twenty-five Years of Developing, Distributing, and Supporting Hydrologic Engineering Computer Programs
TP-133 Predicting Deposition Patterns in Small Basins TP-134 Annual Extreme Lake Elevations by Total
Probability Theorem TP-135 A Muskingum-Cunge Channel Flow Routing
Method for Drainage Networks TP-136 Prescriptive Reservoir System Analysis Model -
Missouri River System Application TP-137 A Generalized Simulation Model for Reservoir
System Analysis TP-138 The HEC NexGen Software Development Project TP-139 Issues for Applications Developers TP-140 HEC-2 Water Surface Profiles Program TP-141 HEC Models for Urban Hydrologic Analysis
TP-142 Systems Analysis Applications at the Hydrologic Engineering Center
TP-143 Runoff Prediction Uncertainty for Ungauged Agricultural Watersheds
TP-144 Review of GIS Applications in Hydrologic Modeling
TP-145 Application of Rainfall-Runoff Simulation for Flood Forecasting
TP-146 Application of the HEC Prescriptive Reservoir Model in the Columbia River Systems
TP-147 HEC River Analysis System (HEC-RAS) TP-148 HEC-6: Reservoir Sediment Control Applications TP-149 The Hydrologic Modeling System (HEC-HMS):
Design and Development Issues TP-150 The HEC Hydrologic Modeling System TP-151 Bridge Hydraulic Analysis with HEC-RAS TP-152 Use of Land Surface Erosion Techniques with
Stream Channel Sediment Models
TP-153 Risk-Based Analysis for Corps Flood Project Studies - A Status Report
TP-154 Modeling Water-Resource Systems for Water Quality Management
TP-155 Runoff simulation Using Radar Rainfall Data TP-156 Status of HEC Next Generation Software
Development TP-157 Unsteady Flow Model for Forecasting Missouri and
Mississippi Rivers TP-158 Corps Water Management System (CWMS) TP-159 Some History and Hydrology of the Panama Canal TP-160 Application of Risk-Based Analysis to Planning
Reservoir and Levee Flood Damage Reduction Systems
TP-161 Corps Water Management System - Capabilities and Implementation Status