Sains Malaysiana 42(6)(2013): 783–792 Correction of Compliance Errors in the Dynamic Shear Modulus of Bituminous Binders Data (Pembetulan Ralat Pematuhan dalam Data Modulus Ricih Dinamik Pengikat Berbitumen) JIANTAO WU, NUR IZZI MD. YUSOFF*, FAUZAN MOHD JAKARNI & MOHD ROSLI HAININ ABSTRACT The dynamic shear rheometer (DSR) is one of the most complex and powerful instruments currently used to characterise the linear viscoelastic (LVE) rheological properties of bituminous binders. However, the DSR also has its limitations in that the measured complex modulus data are exposed to errors, known as compliance (testing) errors, particularly at low temperatures and/or high frequencies. This study was conducted to investigate the validity of equations developed by Schröter and associates on complex modulus data collected using the DSR. The equations used were originally developed based on the calibration of the advanced rheometric expanse system (ARES) rheometer. It was found that those equations are able to satisfactorily correct the data on unmodified bitumens and unaged bitumen-filler mastics, including unaged and aged samples. Similar results were also observed for storage and loss moduli master curves. Finally, the 2S2P1D Model was used to calibrate the corrected complex moduli data and it was found that the model satisfactorily simulates the rheological properties of tested samples. Keywords: Bitumen-filler mastic; compliance errors; linear viscoelastic; modelling; unmodified bitumen ABSTRAK Reometer ricih dinamik (DSR) adalah salah satu alat yang rumit dan berkuasa yang kini digunakan untuk mencirikan sifat reologi likat kenyal lelurus (LVE) bahan pengikat berbitumen. Walau bagaimanapun, DSR juga mempunyai batasan dengan data modulus kompleks yang diukur terdedah kepada ralat, yang dikenali sebagai kesilapan pematuhan (ujian), terutamanya pada suhu rendah dan/atau frekuensi tinggi. Kajian ini telah dijalankan untuk menyiasat pengesahan penggunaan persamaan yang dibangunkan oleh Schröter dan sekutu terhadap data kompleks modulus yang dikumpul menggunakan alat DSR. Persamaan yang digunakan pada asalnya dibangunkan berdasarkan penentukuran reometer advanced rheometric expanse system (ARES). Didapati bahawa persamaan tersebut dapat membetulkan data bitumen tidak terubah suai dan mastik-pengisi bitumen secara memuaskan, termasuk sampel yang tidak dan mengalami penuaan. Keputusan yang sama juga diperhatikan terhadap lengkuk utama modulus penyimpanan dan modulus kehilangan. Akhirnya, Model 2S2P1D telah digunakan untuk tujuan penentukuran data kompleks modulus yang diperbetulkan dan didapati bahawa model ini dapat mensimulasi sifat reologi sampel yang diuji dengan memuaskan. Kata kunci: Bitumen tidak diubah suai; kesilapan pematuhan; likat kenyal lelurus; mastik-terisi bitumen; permodelan INTRODUCTION The dynamic shear rheometer (DSR) is one of the most complex and powerful instruments currently used to characterise the rheological properties of bituminous binders. The method used with the DSR is to apply sinusoidal, oscillatory stresses and strains to a thin disc of bitumen, which is sandwiched between two parallel plates (Airey & Hunter 2003). Normally, the DSR tests are conducted using two parallel plate testing geometries consisting of 8 mm diameter plates with a 2 mm testing gap and 25 mm diameter plates with a 1 mm testing gap (Figure 1). The use of DSR has rapidly grown since the early 1990s, following the campaign of the Strategic Highway Research Programs (SHRP). The DSR, however, also has its limitations in that the measured data (complex modulus |G*|) are exposed to compliance (testing) errors, particularly at low temperatures and/or high frequencies. In this respect, it is known that at low temperatures and/or high frequencies, a limiting maximum modulus known as the glassy modulus (G g ), can be assumed to be 1 GPa (in shear) or 3 GPa (in extensional or flexural) and has widely been used for most engineering purposes (Christensen & Anderson 1992; Lu et al. 1998). However, as mentioned by Sui (2008), the glassy modulus value obtained from the |G*| master curve was found to be around 0.5 GPa, which is half the value recommended by previous researchers. The inappropriate use of spindle geometries is attributed to compliance errors in the linear viscoelastic (LVE) rheological data. The rheological measurements taken outside the LVE region of a binder disturb the thermo-
Transcript
Sains Malaysiana 42(6)(2013): 783–792
Correction of Compliance Errors in the Dynamic Shear Modulus of Bituminous Binders Data
(Pembetulan Ralat Pematuhan dalam Data Modulus Ricih Dinamik Pengikat Berbitumen)
Jiantao Wu, nuR izzi MD. YuSoff*, fauzan MohD JakaRni & MohD RoSli hainin
aBStRaCt
The dynamic shear rheometer (DSR) is one of the most complex and powerful instruments currently used to characterise the linear viscoelastic (LVE) rheological properties of bituminous binders. However, the DSR also has its limitations in that the measured complex modulus data are exposed to errors, known as compliance (testing) errors, particularly at low temperatures and/or high frequencies. This study was conducted to investigate the validity of equations developed by Schröter and associates on complex modulus data collected using the DSR. The equations used were originally developed based on the calibration of the advanced rheometric expanse system (ARES) rheometer. It was found that those equations are able to satisfactorily correct the data on unmodified bitumens and unaged bitumen-filler mastics, including unaged and aged samples. Similar results were also observed for storage and loss moduli master curves. Finally, the 2S2P1D Model was used to calibrate the corrected complex moduli data and it was found that the model satisfactorily simulates the rheological properties of tested samples.
Keywords: Bitumen-filler mastic; compliance errors; linear viscoelastic; modelling; unmodified bitumen
aBStRak
Reometer ricih dinamik (DSR) adalah salah satu alat yang rumit dan berkuasa yang kini digunakan untuk mencirikan sifat reologi likat kenyal lelurus (LVE) bahan pengikat berbitumen. Walau bagaimanapun, DSR juga mempunyai batasan dengan data modulus kompleks yang diukur terdedah kepada ralat, yang dikenali sebagai kesilapan pematuhan (ujian), terutamanya pada suhu rendah dan/atau frekuensi tinggi. Kajian ini telah dijalankan untuk menyiasat pengesahan penggunaan persamaan yang dibangunkan oleh Schröter dan sekutu terhadap data kompleks modulus yang dikumpul menggunakan alat DSR. Persamaan yang digunakan pada asalnya dibangunkan berdasarkan penentukuran reometer advanced rheometric expanse system (ARES). Didapati bahawa persamaan tersebut dapat membetulkan data bitumen tidak terubah suai dan mastik-pengisi bitumen secara memuaskan, termasuk sampel yang tidak dan mengalami penuaan. Keputusan yang sama juga diperhatikan terhadap lengkuk utama modulus penyimpanan dan modulus kehilangan. Akhirnya, Model 2S2P1D telah digunakan untuk tujuan penentukuran data kompleks modulus yang diperbetulkan dan didapati bahawa model ini dapat mensimulasi sifat reologi sampel yang diuji dengan memuaskan.
Kata kunci: Bitumen tidak diubah suai; kesilapan pematuhan; likat kenyal lelurus; mastik-terisi bitumen; permodelan
intRoDuCtion
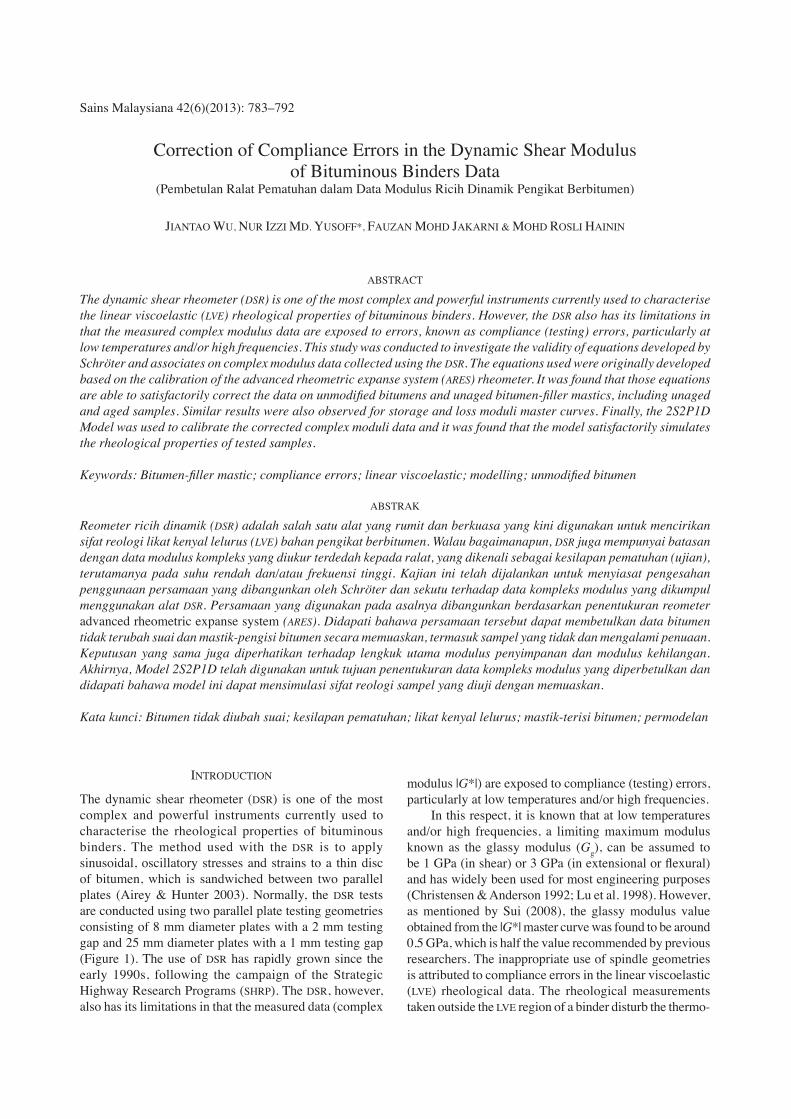
the dynamic shear rheometer (DSR) is one of the most complex and powerful instruments currently used to characterise the rheological properties of bituminous binders. the method used with the DSR is to apply sinusoidal, oscillatory stresses and strains to a thin disc of bitumen, which is sandwiched between two parallel plates (airey & hunter 2003). normally, the DSR tests are conducted using two parallel plate testing geometries consisting of 8 mm diameter plates with a 2 mm testing gap and 25 mm diameter plates with a 1 mm testing gap (figure 1). the use of DSR has rapidly grown since the early 1990s, following the campaign of the Strategic highway Research Programs (ShRP). the DSR, however, also has its limitations in that the measured data (complex
modulus |G*|) are exposed to compliance (testing) errors, particularly at low temperatures and/or high frequencies. in this respect, it is known that at low temperatures and/or high frequencies, a limiting maximum modulus known as the glassy modulus (Gg), can be assumed to be 1 GPa (in shear) or 3 GPa (in extensional or flexural) and has widely been used for most engineering purposes (Christensen & anderson 1992; lu et al. 1998). however, as mentioned by Sui (2008), the glassy modulus value obtained from the |G*| master curve was found to be around 0.5 GPa, which is half the value recommended by previous researchers. the inappropriate use of spindle geometries is attributed to compliance errors in the linear viscoelastic (lVE) rheological data. the rheological measurements taken outside the lVE region of a binder disturb the thermo-
784
The parallel plate can be sufficient to cause errors in the measurement (Petersen et al. 1994). they recommend using the following guidelines, although the range of |G*| that can be successfully measured with different size plates will vary according to the design (resolution and compliance) of each rheometer. if the |G*| value is greater than 30 MPa, they suggested using the bending beam rheometer (BBR) or torsion bar geometry. the 8 mm (with 2 mm gap) and 25 mm (with 1 mm gap) parallel plates can be used for 0.1 MPa < |G*| < 30 MPa and 1.0 kPa < |G*| < 100 kPa, respectively. When the |G*| is less than 1 kPa, 50 mm parallel plates are used (Petersen et al. 1994). it is observed that the involvement of more than one set of equipment is cost-ineffective and time-consuming. Several researchers suggested using a smaller plate, for instance 4 mm parallel plates, to capture |G*| data at low temperatures and/or high frequencies (Schröter et al. 2006; Sui et al. 2009). Even though this method is reliable, it is not universal, since the temperature controller of certain rheometers cannot measure very low temperatures. Recently, hutcheson and Mckenna (2008) and Schröter et al. (2006) conducted a dynamic mechanical analysis (DMa) of glycerol by means of the advanced rheometric expansion system (aRES) and developed a method to correct the compliance errors caused by this instrument. Sui et al. (2009) used a similar rheometer and they found that this method is able to correct the compliance errors of the modulus of unaged and aged unmodified bitumens. Conversely, no studies validate Schröter et al. (2006)’s method of using other types of rheometers. in fact, it should also be possible to use universal equations on different instruments. therefore, this paper investigates the validity and suitability of Schröter et al.(2006)’s method on DSR modulus data. the corrected |G*| data have been calibrated using the 2S2P1D Model.
CoRRECtion EquationS
Schröter et al. (2006) developed the following equation to correct the compliance errors caused by the aRES rheometer:
(1)
where K*mes is the measured complex torsional stiffness, K*s is the actual complex sample torsional stiffness and Kt is the machine torsional (elastic stiffness). torsional stiffness, K, of a cylindrical sample can be defined as follows: K = (2)
where G is the shear modulus of the material in torsion, h is the gap between the plates and R is the radius of the plates. as mentioned by Sui et al. (2009), the torsional stiffness can be taken as the complex modulus (|G*|) instead of G for elastic material like the instrument. By substituting (2) into (1), the following equation is obtained:
(3)
once the machine compliance, 1/Kt, is known, the G*s can be calculated using (3). Meanwhile, the instrument compliance for the measuring system of the parallel plates was first calculated using the following linear equation:
(4)
where 1/Kx is the compliance of DSR instrument and 1/Kn is the compliance of the plate. the compliance of total system using a 4 mm radius plate was assumed to be 8.102 × 10⁻³ rad/nm, as used by Schröter et al. (2006). from (2), one has,
(5)
where Gn is the shear modulus of the material used to construct the plate. in this study, the Gn of stainless steel can be taken to be equal to 73 GPa (hutcheson & Mckenna 2008; Schröter et al. 2006).
thE 2S2P1D MoDEl
the 2S2P1D, a combination of two springs, two parabolic creep elements and one dashpot, is a unique rheological model to fit the rheological properties of binders and asphalt mixtures (Delaporte et al. 2007; olard & Di Benedetto 2003). this model, shown in figure 2, is based on the generalisation of the huet-Sayegh model. the introduced model consists of seven parameters and |G*| can be shown in the following expression:
rheological simplicity of the binder and thereby the ability to produce smooth, continuously rheological parameter master curves (airey 2002).
a
b
c
fiGuRE 1. (a) the DSR body, (b) the 8 mm plates and (c) the 25 mm plates
785
G* = Go + (6)
where i is a complex number defined by i2 = -1, ω is frequency (rad/s or hz), k and h are exponents with 0 < k < h < 1, δ is constant, Go is the static modulus when ω→ zero, Gg is the glassy modulus when ω→ infinity, β is constant, defined by η = (Gg–Go)βτ, η is newtonian viscosity and τ is characteristic time, a function of temperature. τ evolution may be approximated by a shift factor law such as the William landel and ferry (Wlf) and arrhenius equations in the range of temperatures observed in the laboratory and can be shown in the following form (Delaporte et al. 2007): τ = aT(T)τo, (7)
where aT is the shift factor at temperature Ti and τo is τ (Tref), determined at the reference temperature Tref. it must be emphasised that the model only needs seven parameters to entirely determine the lVE behaviour of materials. however, the elastic modulus, G0 can be taken as zero since its values are very small and can therefore be neglected.
ExPERiMEntal PRoGRaMS
two penetration grades of bitumen – 15 and 50 – unaged and aged samples, together with three unaged bitumen-filler mastics – cement, gritstone and limestone – have been used in this study (Choi 2005; liao 2007). the rheological properties of these materials were determined using dynamic mechanical methods consisting of temperature and frequency sweeps in an oscillatory-type testing mode performed within the lVE region. the oscillatory tests were conducted on a Bohlin Gemini dynamic shear rheometer (DSR) using two parallel plate testing geometries consisting of 8 mm diameter plates with a 2 mm testing gap and 25 mm diameter plates with a 1 mm testing gap. in this study, the samples were prepared using a hot pour method and a silicone mould method. in the hot pour method, the gap between the upper and lower plates was set to a desired height of 50 μm plus the required testing gap, either at the proposed testing
temperature or at the mid-point of an expected testing temperature range. Once the gap has been set, a sufficient quantity of hot bitumen (typically between 100-150oC) was poured onto the lower plate of the DSR to ensure a slight excess of material appropriate to the chosen testing geometry. the upper plate of the DSR was then gradually lowered to the required nominal testing gap plus 50 μm. the bitumen that has been squeezed out between the plates was then trimmed flush to the edge of the plates using a hot spatula or blade. after trimming, the gap was closed by a further 50 μm to achieve the required testing gap as well as a slight bulge around the circumference of the testing geometry (periphery of the test specimen). Meanwhile, for the silicone mould method, the hot bitumen is poured into either the 8 mm or 25 mm diameter silicone mould of height approximately 1.5 times that of the recommended testing gap for the two geometries, namely 3 mm and 1.5 mm for the 8 mm and 25 mm geometries. The testing gap is set at a height of 50 μm plus 1 mm or 2 mm. once the bitumen has cooled, either by means of short-term refrigeration or by natural cooling, the bitumen disc (typically at ambient temperatures) is removed from the mould and centred on the lower plate of the DSR. the upper plate is then lowered to the required gap plus 50 μm, the excess bitumen is trimmed with a hot spatula and the gap further closed to its final testing height (Wu 2009). amplitude sweep tests were first conducted to determine the lVE region of the bituminous binders based on the point where |G*| has decreased to 95% of its initial value (Petersen et al. 1994). Dynamic mechanical analysis (DMa) was performed on the binders using a Bohlin Gemini DSR machine. the DSR tests reported in this paper were performed under controlled-strain loading conditions using frequency sweeps between 0.1 and 10 hz at temperatures between 0 and 70oC. the tests between 0 and 45oC were undertaken with 8 mm diameter – 2 mm gap, parallel plate testing geometry and from 25 to 70oC with 25 mm diameter – 1 mm gap geometry. the strain amplitude for all tests was confined within the linear viscoelastic response of the binders. the strain limits for 8 mm and 25 mm geometries in this study were selected at 0.15 and 0.25%, respectively. for the construction of the |G*| and δ master curves, Tref is arbitrarily taken at 0oC. the curve is shifted manually, without assuming any shift factor forms.
RESultS anD DiSCuSSion
CoMPlEx MoDuluS Data
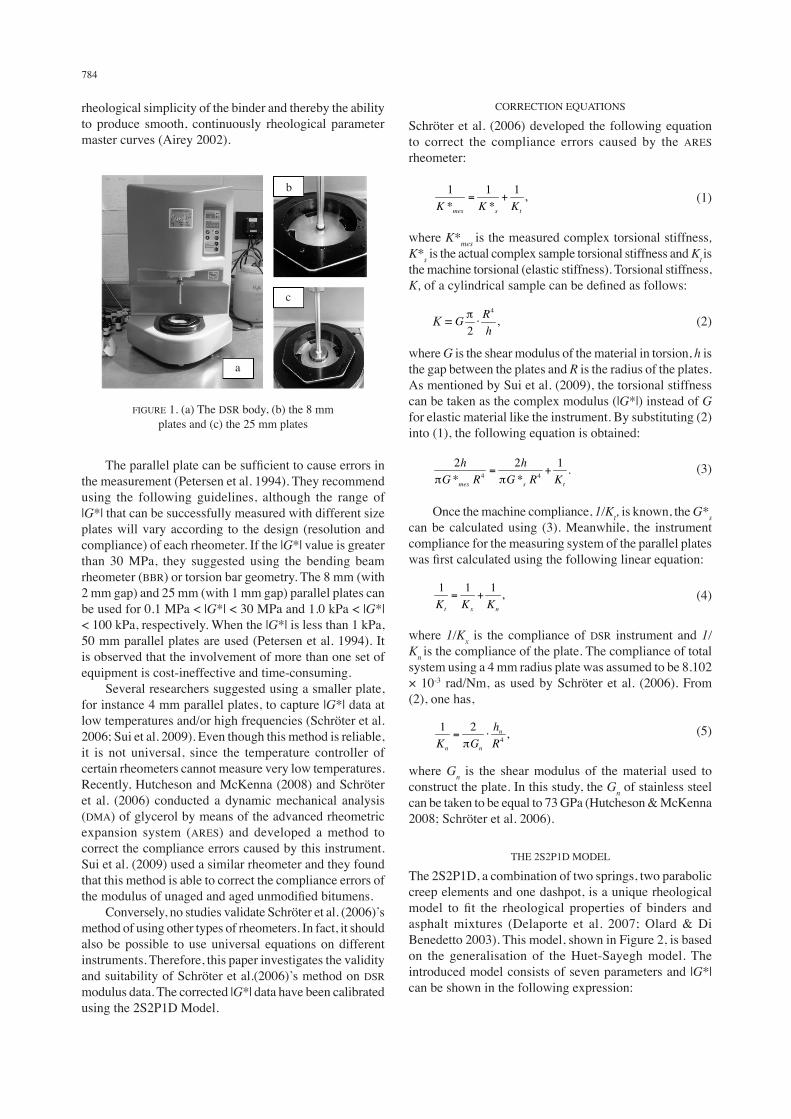
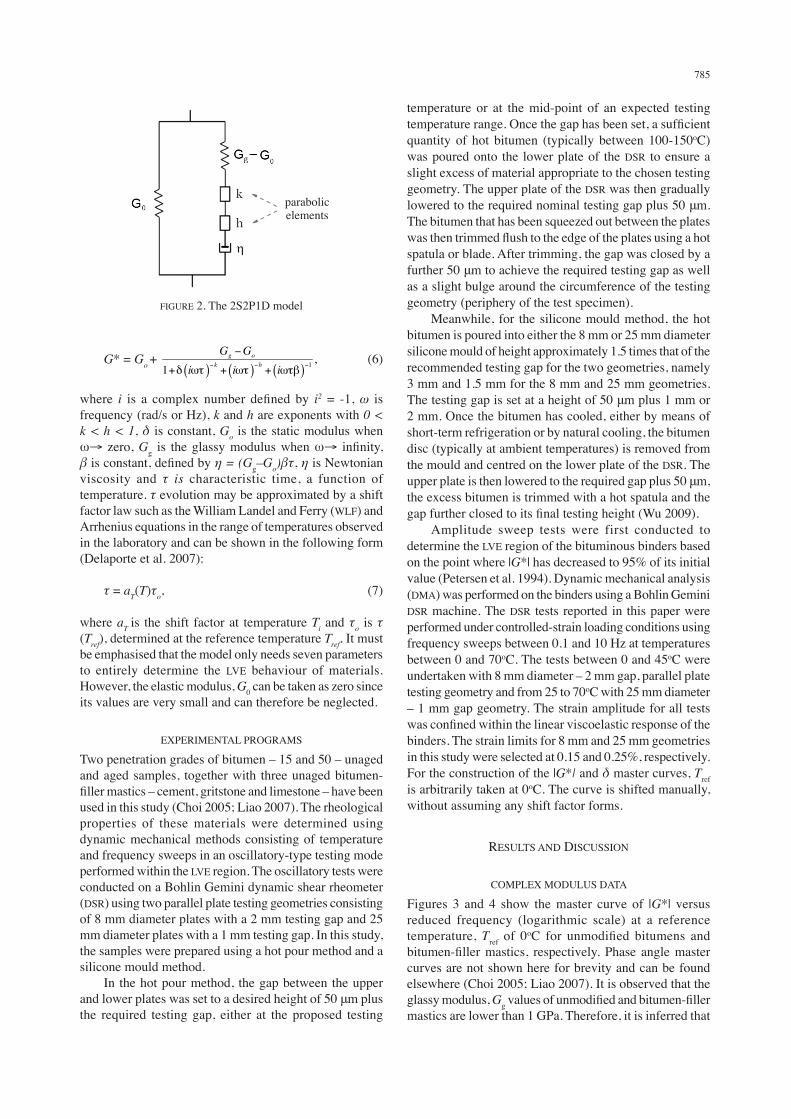
figures 3 and 4 show the master curve of |G*| versus reduced frequency (logarithmic scale) at a reference temperature, Tref of 0oC for unmodified bitumens and bitumen-filler mastics, respectively. Phase angle master curves are not shown here for brevity and can be found elsewhere (Choi 2005; liao 2007). it is observed that the glassy modulus, Gg values of unmodified and bitumen-filler mastics are lower than 1 GPa. therefore, it is inferred that
fiGuRE 2. the 2S2P1D model
parabolic elements
786
the measured |G*| from this study are exposed to testing errors from the DSR.
CoRRECtED BituMEn Data
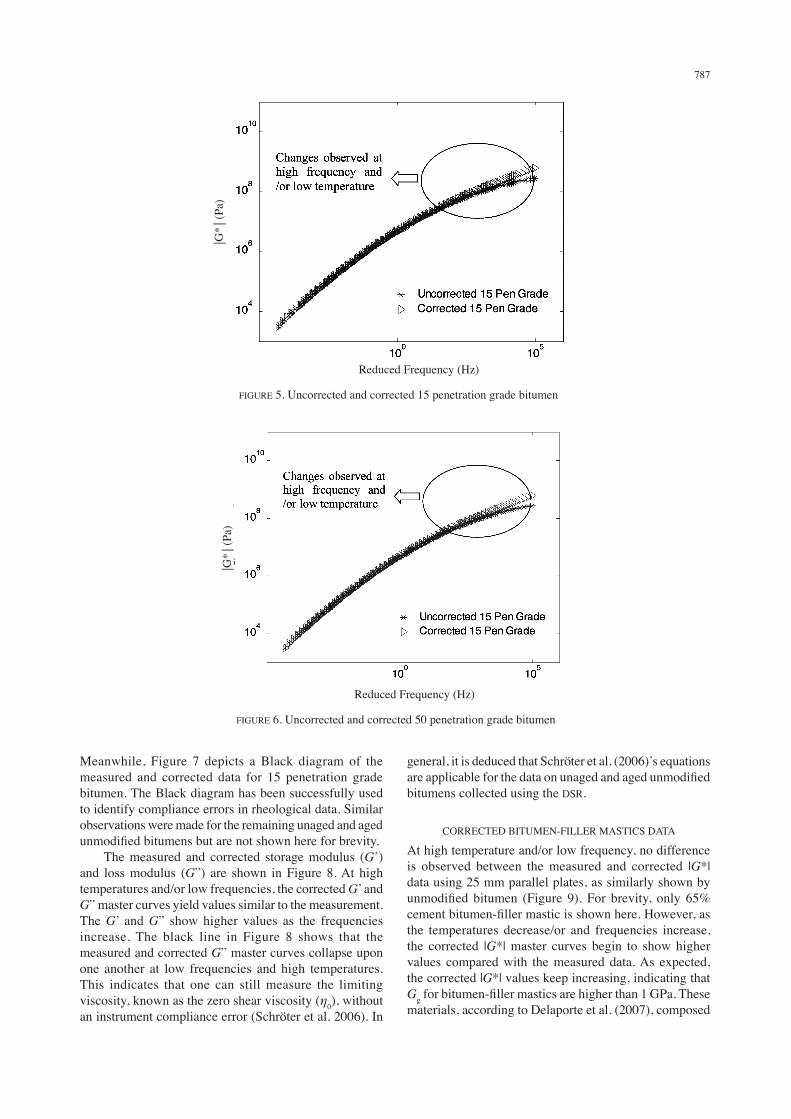
figures 5 and 6 show the |G*| master curves of unaged unmodified 15 and 50 penetration grades bitumens before and after the compliance errors correction. this plot shows how the correction works. These figures demonstrate the measured and corrected |G*| did not yield any differences at high temperatures and high frequencies. Data collected between approximately 35oC to 80oC with 25 mm parallel plates are unaffected by the compliance errors. however, the deviations of the corrected from the measured data are
seen when temperatures decrease, with the used of 8 mm parallel plates. the corrected 15 and 50 penetration grade bitumens deviate from the measured data at approximately 5 × 10⁷ Pa and 1 × 10⁸ Pa, respectively. the 15 penetration grade bitumen shows a larger deviation compared with the 50 penetration grade bitumen. this phenomenon might be attributed to the fact that the DSR is better at describing the rheological properties of ‘softer’ bitumen than of ‘hard’ bitumen. as the temperature decrease and/or frequency increase, the corrected curves approach higher Gg values compared with the measured data. This finding is in good agreement with the previous studies, with Gg taken as 1 GPa (Christensen & anderson 1992; lu et al. 1998).
Reduced frequency (hz)
⎥G*⎥
(Pa)
fiGuRE 4. Complex modulus master curves of bitumen-filler mastics
Reduced frequency (hz)
⎥G*⎥
(Pa)
fiGuRE 3. Complex modulus master curves of unmodified bitumens
787
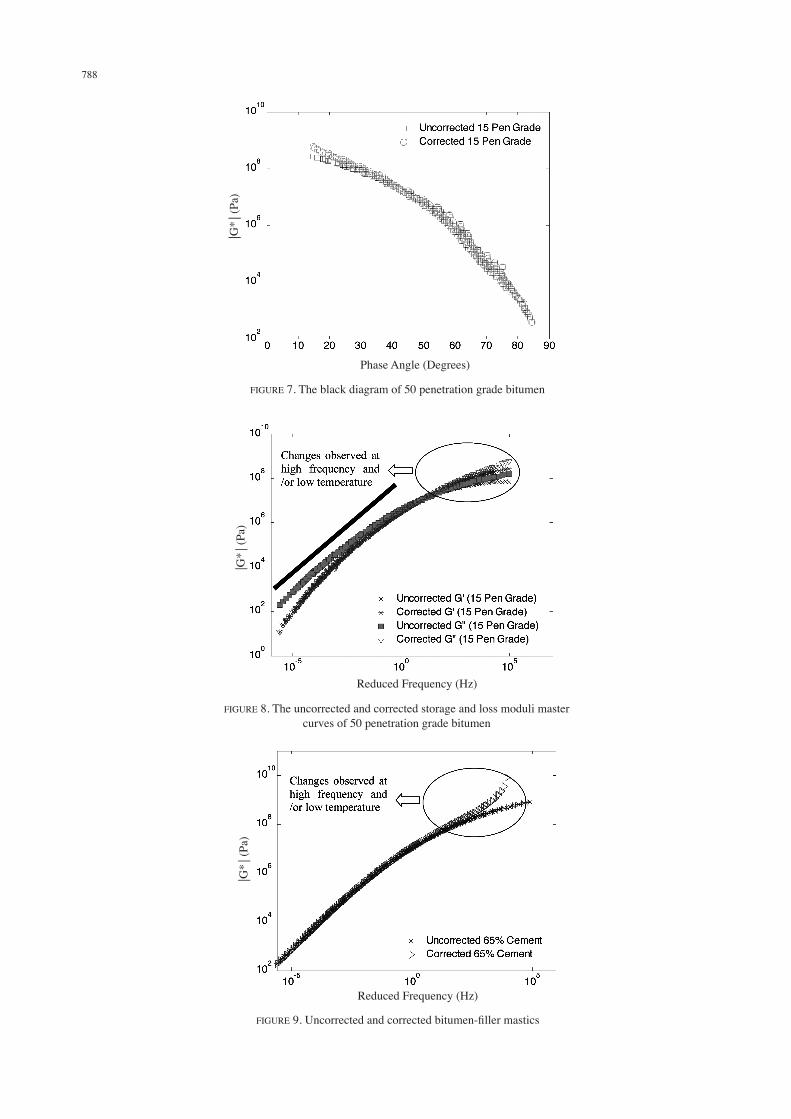
Meanwhile, figure 7 depicts a Black diagram of the measured and corrected data for 15 penetration grade bitumen. the Black diagram has been successfully used to identify compliance errors in rheological data. Similar observations were made for the remaining unaged and aged unmodified bitumens but are not shown here for brevity. the measured and corrected storage modulus (G’) and loss modulus (G”) are shown in figure 8. at high temperatures and/or low frequencies, the corrected G’ and G” master curves yield values similar to the measurement. the G’ and G” show higher values as the frequencies increase. the black line in figure 8 shows that the measured and corrected G” master curves collapse upon one another at low frequencies and high temperatures. this indicates that one can still measure the limiting viscosity, known as the zero shear viscosity (η0), without an instrument compliance error (Schröter et al. 2006). in
general, it is deduced that Schröter et al. (2006)’s equations are applicable for the data on unaged and aged unmodified bitumens collected using the DSR.
CoRRECtED BituMEn-fillER MaStiCS Data
at high temperature and/or low frequency, no difference is observed between the measured and corrected |G*| data using 25 mm parallel plates, as similarly shown by unmodified bitumen (Figure 9). For brevity, only 65% cement bitumen-filler mastic is shown here. However, as the temperatures decrease/or and frequencies increase, the corrected |G*| master curves begin to show higher values compared with the measured data. as expected, the corrected |G*| values keep increasing, indicating that Gg for bitumen-filler mastics are higher than 1 GPa. These materials, according to Delaporte et al. (2007), composed
Reduced frequency (hz)
⎥G*⎥
(Pa)
fiGuRE 5. uncorrected and corrected 15 penetration grade bitumen
Reduced frequency (hz)
⎥G*⎥
(Pa)
fiGuRE 6. uncorrected and corrected 50 penetration grade bitumen
788
Phase angle (Degrees)
⎥G*⎥
(Pa)
fiGuRE 7. the black diagram of 50 penetration grade bitumen
Reduced frequency (hz)
⎥G*⎥
(Pa)
fiGuRE 8. the uncorrected and corrected storage and loss moduli master curves of 50 penetration grade bitumen
Reduced frequency (hz)
⎥G*⎥
(Pa)
fiGuRE 9. Uncorrected and corrected bitumen-filler mastics
789
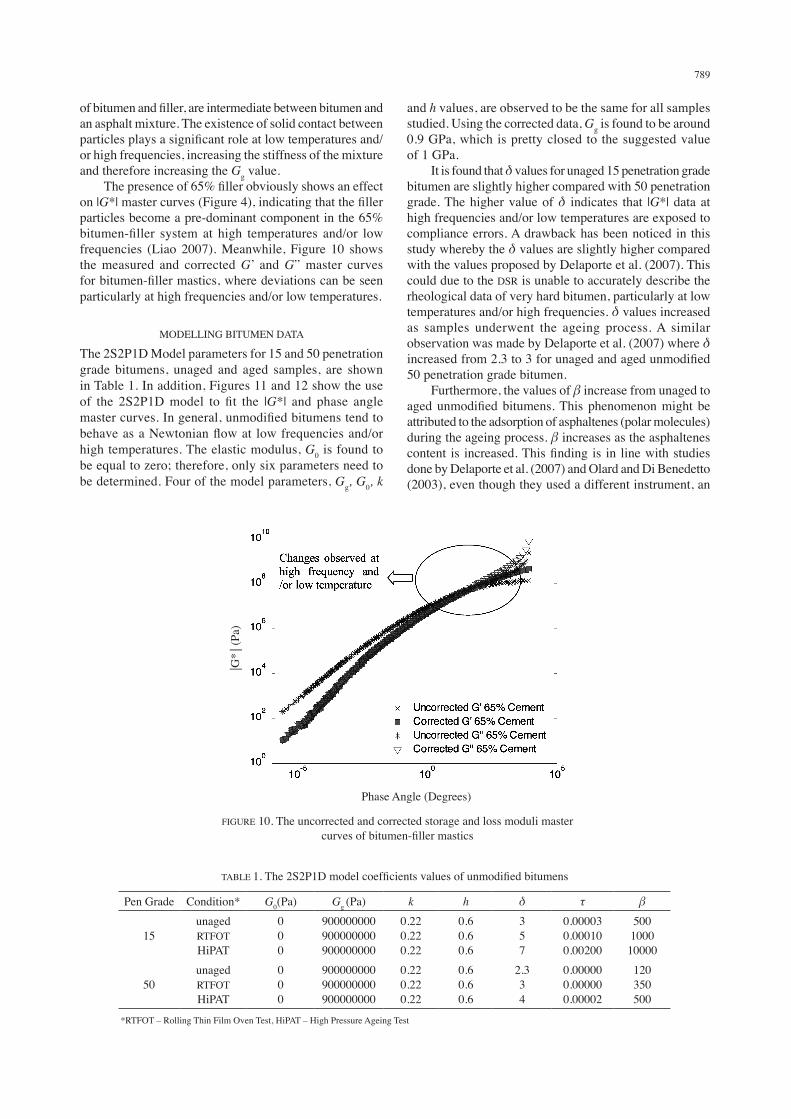
of bitumen and filler, are intermediate between bitumen and an asphalt mixture. the existence of solid contact between particles plays a significant role at low temperatures and/or high frequencies, increasing the stiffness of the mixture and therefore increasing the Gg value. The presence of 65% filler obviously shows an effect on |G*| master curves (Figure 4), indicating that the filler particles become a pre-dominant component in the 65% bitumen-filler system at high temperatures and/or low frequencies (liao 2007). Meanwhile, figure 10 shows the measured and corrected G’ and G” master curves for bitumen-filler mastics, where deviations can be seen particularly at high frequencies and/or low temperatures.
MoDEllinG BituMEn Data
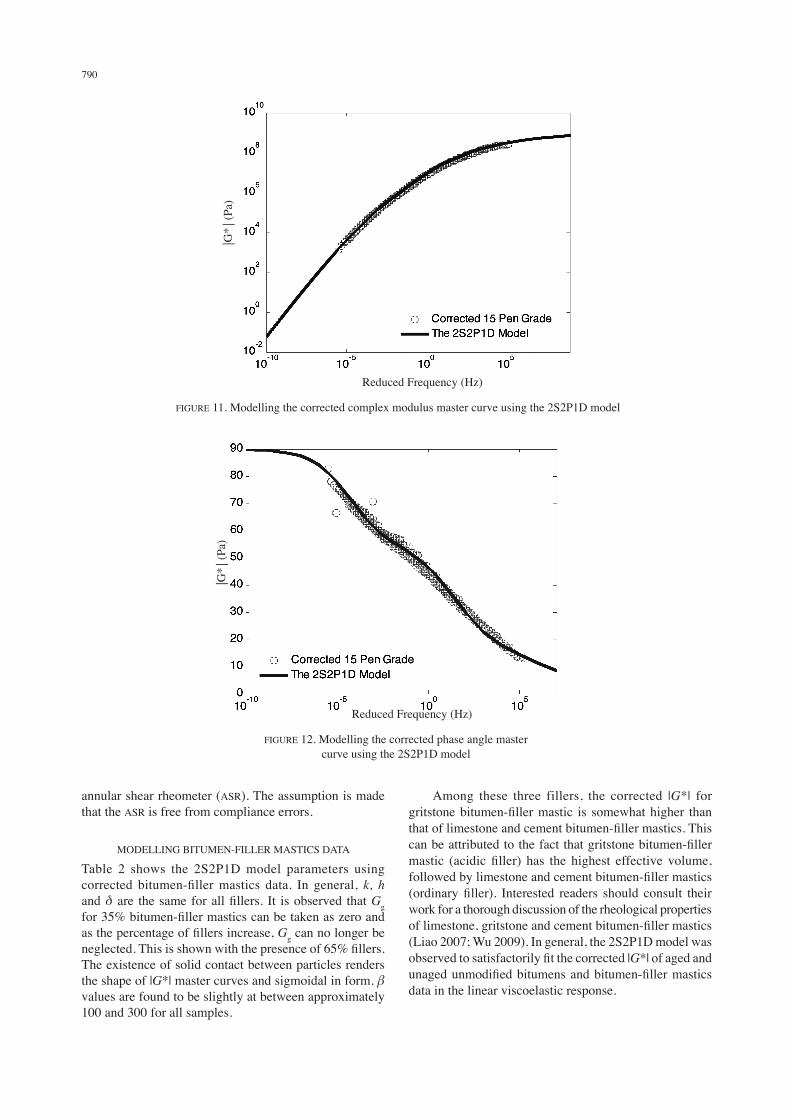
the 2S2P1D Model parameters for 15 and 50 penetration grade bitumens, unaged and aged samples, are shown in table 1. in addition, figures 11 and 12 show the use of the 2S2P1D model to fit the |G*| and phase angle master curves. In general, unmodified bitumens tend to behave as a Newtonian flow at low frequencies and/or high temperatures. the elastic modulus, G0 is found to be equal to zero; therefore, only six parameters need to be determined. four of the model parameters, Gg, G0, k
and h values, are observed to be the same for all samples studied. using the corrected data, Gg is found to be around 0.9 GPa, which is pretty closed to the suggested value of 1 GPa. it is found that δ values for unaged 15 penetration grade bitumen are slightly higher compared with 50 penetration grade. the higher value of δ indicates that |G*| data at high frequencies and/or low temperatures are exposed to compliance errors. a drawback has been noticed in this study whereby the δ values are slightly higher compared with the values proposed by Delaporte et al. (2007). this could due to the DSR is unable to accurately describe the rheological data of very hard bitumen, particularly at low temperatures and/or high frequencies. δ values increased as samples underwent the ageing process. a similar observation was made by Delaporte et al. (2007) where δ increased from 2.3 to 3 for unaged and aged unmodified 50 penetration grade bitumen. furthermore, the values of β increase from unaged to aged unmodified bitumens. This phenomenon might be attributed to the adsorption of asphaltenes (polar molecules) during the ageing process. β increases as the asphaltenes content is increased. This finding is in line with studies done by Delaporte et al. (2007) and olard and Di Benedetto (2003), even though they used a different instrument, an
Phase angle (Degrees)
⎥G*⎥
(Pa)
fiGuRE 10. the uncorrected and corrected storage and loss moduli master curves of bitumen-filler mastics
taBlE 1. The 2S2P1D model coefficients values of unmodified bitumens
Pen Grade Condition* G0(Pa) Gg (Pa) k h δ τ β
15unagedRtfothiPat
000
900000000900000000900000000
0.220.220.22
0.60.60.6
357
0.000030.000100.00200
500100010000
50unagedRtfothiPat
000
900000000900000000900000000
0.220.220.22
0.60.60.6
2.334
0.000000.000000.00002
120350500
*Rtfot – Rolling thin film oven test, hiPat – high Pressure ageing test
790
Reduced frequency (hz)
⎥G*⎥
(Pa)
fiGuRE 11. Modelling the corrected complex modulus master curve using the 2S2P1D model
Reduced frequency (hz)
⎥G*⎥
(Pa)
fiGuRE 12. Modelling the corrected phase angle master curve using the 2S2P1D model
annular shear rheometer (aSR). the assumption is made that the aSR is free from compliance errors.
MoDEllinG BituMEn-fillER MaStiCS Data
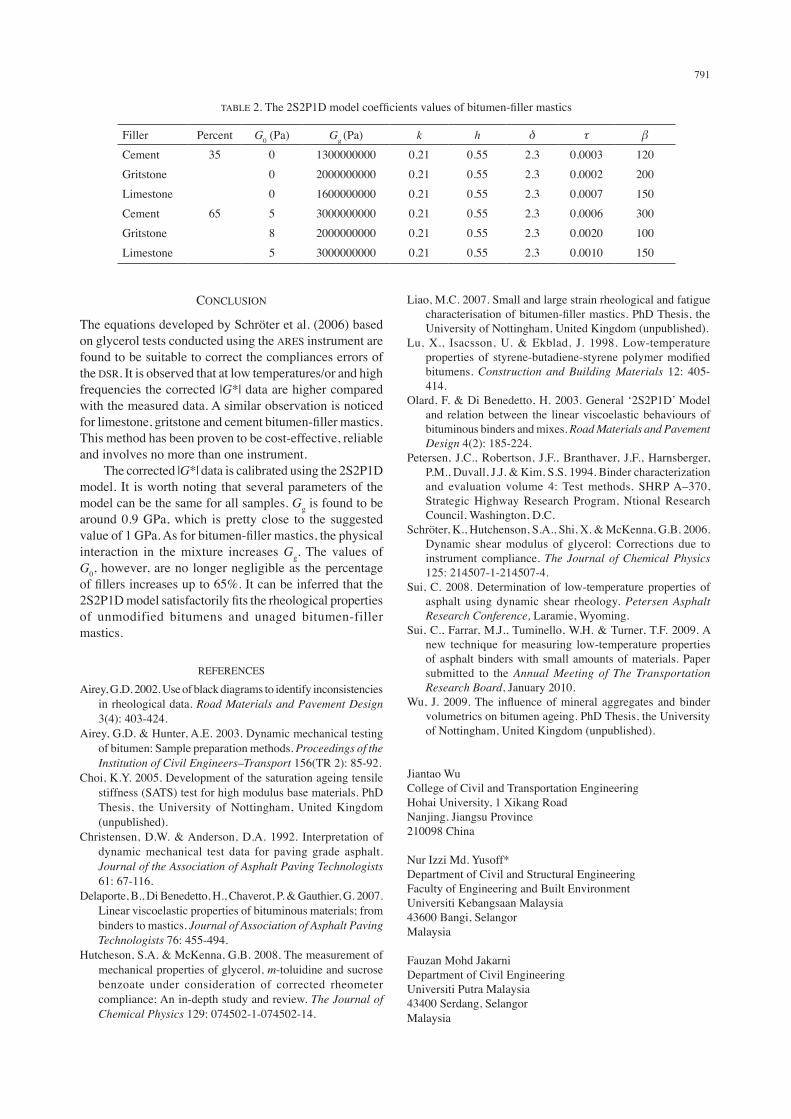
table 2 shows the 2S2P1D model parameters using corrected bitumen-filler mastics data. In general, k, h and δ are the same for all fillers. It is observed that Gg for 35% bitumen-filler mastics can be taken as zero and as the percentage of fillers increase, Gg can no longer be neglected. This is shown with the presence of 65% fillers. the existence of solid contact between particles renders the shape of |G*| master curves and sigmoidal in form. β values are found to be slightly at between approximately 100 and 300 for all samples.
among these three fillers, the corrected |G*| for gritstone bitumen-filler mastic is somewhat higher than that of limestone and cement bitumen-filler mastics. This can be attributed to the fact that gritstone bitumen-filler mastic (acidic filler) has the highest effective volume, followed by limestone and cement bitumen-filler mastics (ordinary filler). Interested readers should consult their work for a thorough discussion of the rheological properties of limestone, gritstone and cement bitumen-filler mastics (liao 2007; Wu 2009). in general, the 2S2P1D model was observed to satisfactorily fit the corrected |G*| of aged and unaged unmodified bitumens and bitumen-filler mastics data in the linear viscoelastic response.
791
ConCluSion
the equations developed by Schröter et al. (2006) based on glycerol tests conducted using the aRES instrument are found to be suitable to correct the compliances errors of the DSR. it is observed that at low temperatures/or and high frequencies the corrected |G*| data are higher compared with the measured data. a similar observation is noticed for limestone, gritstone and cement bitumen-filler mastics. this method has been proven to be cost-effective, reliable and involves no more than one instrument. the corrected |G*| data is calibrated using the 2S2P1D model. it is worth noting that several parameters of the model can be the same for all samples. Gg is found to be around 0.9 GPa, which is pretty close to the suggested value of 1 GPa. As for bitumen-filler mastics, the physical interaction in the mixture increases Gg. the values of G0, however, are no longer negligible as the percentage of fillers increases up to 65%. It can be inferred that the 2S2P1D model satisfactorily fits the rheological properties of unmodified bitumens and unaged bitumen-filler mastics.
REfEREnCES
airey, G.D. 2002. use of black diagrams to identify inconsistencies in rheological data. Road Materials and Pavement Design 3(4): 403-424.
airey, G.D. & hunter, a.E. 2003. Dynamic mechanical testing of bitumen: Sample preparation methods. Proceedings of the Institution of Civil Engineers–Transport 156(tR 2): 85-92.
Choi, k.Y. 2005. Development of the saturation ageing tensile stiffness (SatS) test for high modulus base materials. PhD thesis, the university of nottingham, united kingdom (unpublished).
Christensen, D.W. & anderson, D.a. 1992. interpretation of dynamic mechanical test data for paving grade asphalt. Journal of the Association of Asphalt Paving Technologists 61: 67-116.
Delaporte, B., Di Benedetto, h., Chaverot, P. & Gauthier, G. 2007. linear viscoelastic properties of bituminous materials; from binders to mastics. Journal of Association of Asphalt Paving Technologists 76: 455-494.
hutcheson, S.a. & Mckenna, G.B. 2008. the measurement of mechanical properties of glycerol, m-toluidine and sucrose benzoate under consideration of corrected rheometer compliance; an in-depth study and review. The Journal of Chemical Physics 129: 074502-1-074502-14.
liao, M.C. 2007. Small and large strain rheological and fatigue characterisation of bitumen-filler mastics. PhD Thesis, the university of nottingham, united kingdom (unpublished).
lu, x., isacsson, u. & Ekblad, J. 1998. low-temperature properties of styrene-butadiene-styrene polymer modified bitumens. Construction and Building Materials 12: 405-414.
olard, f. & Di Benedetto, h. 2003. General ‘2S2P1D’ Model and relation between the linear viscoelastic behaviours of bituminous binders and mixes. Road Materials and Pavement Design 4(2): 185-224.
Petersen, J.C., Robertson, J.f., Branthaver, J.f., harnsberger, P.M., Duvall, J.J. & kim, S.S. 1994. Binder characterization and evaluation volume 4: test methods. ShRP a–370, Strategic highway Research Program, ntional Research Council, Washington, D.C.
Schröter, k., hutchenson, S.a., Shi, x. & Mckenna, G.B. 2006. Dynamic shear modulus of glycerol: Corrections due to instrument compliance. The Journal of Chemical Physics 125: 214507-1-214507-4.
Sui, C. 2008. Determination of low-temperature properties of asphalt using dynamic shear rheology. Petersen Asphalt Research Conference, laramie, Wyoming.
Sui, C., farrar, M.J., tuminello, W.h. & turner, t.f. 2009. a new technique for measuring low-temperature properties of asphalt binders with small amounts of materials. Paper submitted to the Annual Meeting of The Transportation Research Board, January 2010.
Wu, J. 2009. The influence of mineral aggregates and binder volumetrics on bitumen ageing. PhD thesis, the university of nottingham, united kingdom (unpublished).
Jiantao WuCollege of Civil and transportation Engineeringhohai university, 1 xikang Roadnanjing, Jiangsu Province210098 China
nur izzi Md. Yusoff*Department of Civil and Structural Engineeringfaculty of Engineering and Built Environmentuniversiti kebangsaan Malaysia43600 Bangi, SelangorMalaysia
fauzan Mohd JakarniDepartment of Civil Engineeringuniversiti Putra Malaysia43400 Serdang, SelangorMalaysia
taBlE 2. The 2S2P1D model coefficients values of bitumen-filler mastics