U.S. Department of Justice Bureau of Justice Statistics 'M't Correctional Populations in the United States 1985 I¥lFI 4M2 iF It persons under correctional .' . . (1.7% of U.S. adult population) . . . . . . . - \
Transcript
U.S. Department of Justice
Bureau of Justice Statistics
'M't
Correctional Populations in the United States 1985
I¥lFI 4M2 iF It
2~9d4,979 persons under correctional sup~rvision .' . . (1.7% of U.S. adult population) . . . .
. . . - \
B2U F* ·M; &2
Bureau of Justice Statistics reports (revised February 1988)
Call toll-free 800-732-3277 (local 301-251-5500) to order BJS reports, to be added to one of the BJS mailing lists, or to speak to a re'erence specialist In statistics at the Justice Statistics Clearinghouse, National Criminal Justice Reference Service, Box 6000, Rockville, MD 20850. Single copies of reports are free; use NCJ number to order. Postage and handling are charged for bulk orders of single reports. For Single copies of multiple titles, up to 10 tilles are free: 11-40 titles $10; more than 40, $20; libraries call for special rates.
Public-use tapes of BJS data sets and other criminal justice data are available from the Criminal justice Archive and Information Network, P.O. Box 1248, A'ln Arbor, MI48106 (313-763-5010).
National Crime Survey Criminal Victimization In the U.S.:
crimes, NCJ-99643. 1/86 Reporting crimes to the police, NCJ-
99432, 12/85 Locating city, suburban, and rural
crime, NCJ-99535. 12/85 The risk of violent crime, NCJ-97119.
5/85 The economic cost of crime to victims,
NCJ-93450. 4/84 Family violence, NCJ-93449.4/84
BJS bulletins; Criminal victimization 1986, NCJ-
106989, 10/87 HouseholdS touched by crime, 1986,
NCJ-l05289. 6/8; The crime of rape, NCJ-96777.3/85 Household burglary, NCJ·96021. 1/85 Violent crime by strangers, NCJ-80829.
4/82 Crime and the elderly, NCJ-79614, 1/82 MeaSUring crime, NCJ-75710,2/81
Series crimes: Report of a field test (BJS technical report), NCJ-l04615,4/87
Crime and older Americans Information package, NCJ-l 04569, $1 0, 5/87
Lifetime likelihOOd of vlctimb:atlon, (BJS technical report). NCJ-l04274, 3/87
Teenage victims, NCJ-l03138, 12/86 Response to screening questions In the
National Crime Survey (BJS technical report), NCJ-97624, 7/85
Victimization and fear of crime: World perspectives, NCJ-93872, 1/85
The National Crime Survey: Working papers, vol. I: CUrrent and historical perspectives, NCJ-75374, 8/82 vol. II! Methodological studies, NCJ-90307, 12/84
Issues In the measurement of victimization, NCJ-74682, 10/61
The cost of negligence: Losses from preventable household burglaries, NCJ-53527, 12/79
Rape victimization in 26 American cities, NCJ-55878,8/79
Criminal victimization In urban schools, NCJ-56396,8/79
An Introduction to the National Crime Survey, NCJ-43732, 4/78
Local victim surveys! A review of the Issues, NC"J-39973, 8/77
Wi 4#" • .+s H*
Corrections BJS bulletins and special reporls:
Capital punlshment1986, NCJ-l06483, 9/87
Prisoners In 1986, NCJ-104864, 5/87 Imprisonment In four coun\rles, NCJ-
103967,2/87 Population density In State prisons,
NCJ-l03204. 12/86 State and Federal prisoners, 192·5,85,
102494, 11/86 Prison admlsssion and releases, 1983,
NCJ·l00582,3/86 Examining recidivism, NCJ-96501, 2/85 Returning to prison, NCJ-95700, 11/84 Time served In prison, NCJ-93924,6/84
Correctional populations In the U.S. 1985, NCJ-l 03957,1/88
1984 census of State adult correctional facilities, NCJ-l 05585,7/87
Hll!torlcal corrections statistics In the U_S" 1850-1984, NCJ-l 02529,4/87
P~isoners In State and Federal Insltitutions on Dec. 31,1984, NCJ-l03768,
3/87 Capital punishment 1984 (final), NCJ-
99562.5/86
1979 survey of inmates 01 State correctional facilities and 1979 r.ensus of State correctional/acilities:
BJS special reports: The prevalence of Imprisonment,
NCJ-93657.7/85 Career patterns in crime, NCJ-88672,
6/83
BJS bulletins: Prisoners and drugs, NCJ-87575.
3/83 Prisoners and alcohol, NCJ-86223,
1/83 Prisons and prisoners, NCJ-80697,
2/82 Veterans In prison, NCJ-79232, 11/81
Census 01 Ja,ls and survey o//all inmates: Jallinmales, 1986, NCJ-l07123,10/87 Jail Inmates 1985, NCJ-l05586, 7/87 The 1983 jail census (BJS bulletin).
NCJ-95536. 11/84 Census of jails, 1978: Data for
individual jails. vols. HV. Northeast, North Central, South. Wesl, NCJ-72279-72282,12/81
Proflte of jail inmates, 1978, NCJ-65412. 2/81
Parole and probation BJS bulletins:
Probation and parole 1986, NCJ-108012,12/87
Probation and parole 1985, NCJ-103683,1/87
Setting prison terms, NCJ-76218. 8/83
BJS special reports: Time served In prison and on parole,
NCJ-l08544.1/88 Recidivism of young parolees, NCJ-
104916,5/67
Parole In the U.S., 1980 and 1981, NCJ-87387,3/86
Characteristics of persons entering parole during 1978 and 1979, NCJ-87243,5/83
Characteristics of the parole population, 1978, NCJ-66479, 4/81
Children in custody: public Juvenile facilities, 1985
(bulletin), NCJ-l02457, 10/86 1982-83 census of juvenile detention
Police employment and expenditure, NCJ-l00117,2/86
Tracking offenders: The child victim, NCJ-95785, 1 2/84
Tracking offenders, NCJ-91572, 11/83 Victim and witness assistance: New
State laws and the system's rosponse, NCJ-87934, 5/83
BJS data report, 1986, NCJ-l06619. 10/87
Sourcebook of criminal justice statistics, 1986, NCJ-l05287. 9/87
BJS annual report, fiscal 1986, NCJ-103985,41-97
1986 directory of alltomat<!d criminal justice tnformal/on sytems, NCJ-102260,1/87, $20
PUblications of BJS, 1971-84: A topical bibliography, 1B030012, 10/86, $17.50
BJS publications: Selected library In microfiche, 1971-84, PR030012.
10/86, $203 domestic National survey of crime severity, NCJ-
96017.10/85 Criminal vlctlmlzlltlon of District of
Columbia residents and Capitol Hill employees, 1982-83, NCJ-97962; Summary, NCJ-98567.9/85
DC household Victimization survey data base: Study implementation, NCJ-98595, $7_60 Documentation, NCJ-98596, $6.40 User manual, NCJ-98597, $8.20
How to gain access to BJS data (brochure). BC·000022, 9/84
Report to the nation on crIme and justice: The data, NCJ-87068, 10/83
BJS maintains the following mailing lists: • Drugs and crime data (new) II White-collar crime (new) .. National Crime Survey (annual) • Corrections (annual) .. JuVenile corrections (annual) .. Courts (annual) .. Privacy and security of criminal
history information and information policy
• Federal statistics (annual) II BJS bulletins and special reports
(apprOXimately twice a month) .. Sourcebook of Criminal Justice
Statistics (annual) To be added to these lists, write to: Justice Statistics Clearinghouse/ NCJRS Box 6000, Rockville, MD 20850.
See order form on last page
U.S. Department of JusTice
Bureau of Justice Statistics
II lilli'S·
Correctional Populations in the
iA;
United St~tes, 1985
December 1987, NCJ-I03957
u.s. Department of JUstice National Institute of Justice
103957
This document has been reproduced exactly as received from the person or organization originating it. Points of view or opinions stated in this document are those of the authors and do not necessarily represent the official position or policies of the National Instilute of Justice.
Permission to reproduce this ~d material has been .9ranted by
PUblic Domain/BJS
U • S-..-D.ep.a.Ument-.G.f~!us.t-i--ee~--to the National Criminal Justice Reference Service (NCJRS).
FUrther reproduction outside of the NCJRS system requires permls. sion of the ~ owner. .
1 ; , • NC-JRS
NAR 1 1988
U.s. Department of ,Justice Bureau of Justice Statistics
Steven R. Schlesinger Director
Acknowledgments
This volume was prepared by Tom Hester, statistician, corrections unit. Editorial assistance was provided by Frank D. Balog and Jeanne IIlU'ris. Marianne Zawitz assisted in table design.
Marilyn Marbrook, publications unit chief, supervised volume production, assisted by Millie J. Baldea, and Arlene F. Jame,s.
The foll(lwing Bureau of the Census personnel collected and collated the data: jails--Carma Hogue, Stephanie Brown, Betty Ford, and Lisa McNelis under the direction of Diana Cull; probation and parole--Stephanie Brown and Art Ciampa, setting prison terms--Gregory Wells; prisoners--Gregory Wells; capital punishment--Arlene Rasmussen.
The Assistant Attorney General, Office of Justice Programs, coordinates the activities of the following program offices and bureaus: the Bureau of Justice Statistics, National Institute of Justice, Bureau of Justice Assistance, Office of Juvenile Justice and Delinquency Prevention, and the Office for Victims of Crime.
ii Con"ectional Populations in the United States, 1985
Foreword
Correctional Populations in the United States, 1985 represents a consolidation of data gathered in various statistical programs currently maintained by the Bureau of Justice Statistics (BJS). The goal was to compile in one volume the major components of corrections so that these statistics can be used easily.
This volume, in replacing foul' separate publications, emphasizes the connections between the parts of that large and growing population under correctional supervision. Its format Is designed to promote understanding of the po pula tion as a whole and of its management. Correctional Populations In the United States, 1985 thereby revives some of the aims expressed for the early reporting programs.
Deepest gratitude is extended to the State, Federal, and local respondents who have enabled us to continue this joint venture, which stretches back to 1850. I hope that this and future BJS reports will continue to help us all gain more insight into the important role of corrections agencies and employees throughout the Nation.
Steven R. Schlesinger Director
Making comparisons
Correctional Populations in the United States, 1985 is designed for the comparison of detailed information. Care must be exercised that departures from reporting criteria are taken into account when making comparisons. BJS follows data collection rules and reporting protocols that are the most widely used among the States, that are consistent with historical statistics, and that impose the least burden on respondents. However, some jurisdictions may depart from these conventions and are asked to document such dIfferences.
Many tables have been shortened from what appeared in previous reports. Readers should be aware that footnotes, table notes, and explanatory notes are essential for a full understanding of the data.
Parole in 1985 89 Tables 90 Explanatory notes 98 Questionnaire 101
Capital punishment in 1985 105 Tables 106 Questionnaires 143
Index 149
Correctional Populations in the United States, 1985 iii
Introduction
History of U.S. corrections statistics 2
Definition of common terms used in tables 3
Da ta sources 3 Notes to tables 1.1 and 1.2 4
Tables
1.1 Persons on probation, in jail, in prison, or on parole and their percent of the adult population, by State, 1985 5
1.2 Estimated number of adults on probation, in jail, in prison, or on parole and their percent of the adult population, by sex and race, 1985 6
•
Introduction 1
-History of U.S. eorrectional ~tatistics
In 1850 the Federal Government, in cooperation with the States as a part of the Seventh Decennial Census, initiated a count of prisoners in 32 St .. tes and in the territories of Minnesota, New Mexico, Oregon, and Utah. Between 1850 and 1870, U.S. marshals administered the census of prisoners as part of a special schedule of social statistics. The 188() report indicated there were 61 prisone.'rs in State institutions per 100,000 residents. By 1890 Nevada had the highest per capita rate among the States, 203, and Wyoming, the lowest at 16. In that same year New York had 136 prisoners per 100,000 residents, and California had 169.
In 1910 the introduction of the indeterminate sentence was described in prisoner statistics; 21% of State prisoners on January 1 had received such sentences. The 1923 report said that more than one-half the prison admissions that year were under indeterminate sentences and observed that such sentences resulted in wide rBnges between minimum and maximum sentences and disparities in setting release dates. In 1926 the Bur(!au of the Census began the annual collection of prisoner statistics, and the report for thai;: year described the goal of the effC)rt as the collection of data to "show the application of penal policies fer various classes of offenders and in different parts of the country." That first annual report in 1926, provided information by jurisdiction on admissions, releases, sentences and time sel'ved, inmates under sentence of death, recidivism, and crowding-issues of major concern today.
During the past 60 years the partnership between the Federal Government and the States and localities in collecting corrections data has grown and prospered.
In 1950 the program was transferred from the Bureau of the Census to the Bureau of Prisons in the Department of Justice and in 1971 to the prede-
cessor agency of the Bureau of Justice Statistics, the National Criminal Justice Information and Statistics Service of the Law Enforcement Assistance Administration (J~EAA). LEAA added the statistical series on local jails (1970), probation (1979), and parole (1976).
All of the major reporting series and projects of the corrections unit, Bureau of Justice Statistics (BJS) are outlined under "Data sources" below. The Bureau of the Census serves as the data collection agency for these series. When Congress created the Bureau of the Census in the late 19th century, it charged the agea.cy with the responsibility to account for prisoners. That involvement has continued intermittently and in various forms until the present, as shown in the following chronology that sketches the evolution of the statistical reports grouped in this volume:
1904. Prisoners and Juvenile Delinquents, 1904 reported movements rather than individuals. Prison officials served as enumerators.
1923. Prisoners, 1923 presented adults separate from juveniles.
1926. Prisoners in State and Federal Prisons and Reformatories began as an annual report that continued until 1946. The report included a special section on prisoners under sentence of death. From 1946 to 1970 the Federal Bureau of Prisons (BOP) published the annual figures. The Law Enforcement Assistance Administration (LEA A) followed for 9 years until BJS was created in 1980. (The Bureau of the Census has acted as collecting agent since 1972.)
2 Correctional Populations in the United States, 1985
1947. Tile Bureau of Prisons began the separate annual reports on prisoners under sentence of deeth. The LEAA and then BJS continued the reports until 1984. The Bureau of Justice Statistics will continue to publish annual bulletins about the death penalty and persoIlS sentenced to death; the mor'e detailed statistics will appear in the corrections volume.
1965. The National Council on Crime and Delinquency (NCCD), a non governmental organization, started the Uniform Parole Reports project under Federal contract.
1970. LEA A conducted its first 1-day count of jails.
1974. LEAA, with the Bureau of the Census, surveyed a national random sample of offenders in State prisons. The survey, repeated in 1979 and 1986, collected information about personal background and criminal history and inquired about drug and alcohol usage.
1976. The NCCD and LEAA annual reports covered parole data beginning in 1976.
1978. The Bureau of the Census counted prisoners In U.S. jails; the Bureau repeated the complete enumeration in 1983.
1979. The first annual report on parole and probation appeared, published by BJS. This Department of Justice agency will continue issuing sum mary reports, reserving detailed data for the corrections statistics volume.
1982. The Bureau of the Census completed the first annual jail sample survey for BJS. Bulletins containing data from the sample survey will be supplemented by the corrections volume.
---------------------------------------------
Definitions of common terms used in the tables
Custody. To have custody of a prisoner, a State must hold that person in one of its facilities. Early statistical reports gave custody counts that largely have been replaced by jurisdiction counts of State prison populations. A State may have custody of a prisoner over whom another State maintains jurisdiction. For example, State A's prison burns, and State Z houses the A inmates temporarily. State Z has custody; State A, jurisdiction. The tables present both kinds of counting procedures, with jurisdiction counts being more complete; States that report only on custody are noted.
Detention status. This term distinguishes between prisoners, usually in jail, who were convicted or who were awaiting judgment.
Discretionary parole. A release from prison to supervision is discretionary when it is decided by a board or other authority.
Good-time. When correctional authorities deduct time from a prison or jail sentence, often to reward or to encourage good behavior, they give good-time. When the good-time is tied to a specific action, such as working in prison industry or performing a meritorious deed, it is called "earned."
mspanic origin. A person of Hispanic origin may be of any race; however, a few States treat the ethnic category as a racial one. Reporting officials usually rely on f1elfdefinition, but some States classify according to surname.
Jurisdiction. Jurisdiction refers to a unit of government or to the legal authority to exercise governmental power. Accor~;ng to the latter meaning~ the prisoners under a State's jurisdiction may be in the custody of local jails. (See "custody.")
Mandatory parole. Mandatory parole results from statutory and correctivnal guidelines, and no judgment by a panel or board is required for release of a prisoner to supervision outside of prison.
Maximum sentence length. Some jurisdictions sentence offenders to a range of years; the larger number in that range is the most that a prisoner may serve on a sentence. Often good-time is subtracted from the maximum sentence. When the tables report on prisoners with sentences longer or shorter than a year, the maximum sentence is used where applicable.
Movement. In corrections, a movement is an admission to or a release from a status--prisoner, parolee, or probationer. A transfer between facilities does not, unless specifically noted, count as a movement.
One-day count. For a I-day count a jurisdiction or facility is asked to report how many people were on its roll on a certain day. The average daily popUlation is a year's total number of people on the roll each day, divided by the number of days. The methods of counting in aggregate do not yield estimates of either the number of persons in a status during a year or the average amount of time persons remain in a status.
Race. Classification by race often depends on the reporting program and the State. A few States reported two categories: white and nonwhite. A few others categorized Hispanic offenders as belonging to Hother race." Numbers of persons with certain racial backgrounds were sometimes estimated.
Reporting time. The prison, probation, parole, and capital punishment figures are from December 31, 1985, unless otherwise noted. The Bureau of the Census surveyed jailS on June 30, 1985; they last took a complete census of jails on June 30, 1983.
Revisions. Many States revise the yearend number reported for the previous year. Those revisions are made in the total, not the detail. For example, the numbers of blacks, whites, and members of other races for 1984 were not changed by a State in 1985 to equal its revised 1984 total.
Youthful offender status. State legislatures create the youthful offender status through statutes that provide for special sentencing, commitment, or record sealing procedures for young adult offenders adjudicated in a crimlne! court, as opposed to a juvenile court. The offenders may be above the statutory age limit for juveniles but below a specified upper age limit.
Data sources
Series that aggregate by reporting unit
NPSI. Annual yearend count of prisoners present by jurisdiction, sex, race, Hispanic origin, and admissio~s and releases during the year
NPSIA. Count of prisoners present on June 30 by jurisdiction
UPS lB. Advance yearend count of prisoners; emergency releases because of prison crowding; rated, operational, and design capacities of prison facilities
NPS8A. Yearend count of persons in prison under sentence of death
NPS8B,C. Complete survey of States to determine any significant changes in statutes or case law relating to the death penalty
NPR1. Yearend count, admissions, and releases of persons on probation by jurisdiction
UPRI. Yearend count, admissions, and releases of persons on parole by jurisdiction
CJS. Annual sample survey of lOClli jails to estimate the population of jails in jurisdictions holding a daily average of more than 100 people,
Introduction 3
CJ5A. Annual sample survey of local jails to estimate the population of jails in jurisdictions holding a daily average of fewer than 100 people
CJ42. Census every 5 years of all State-operated, community-based correctional facilities to record their characteristics
CJ43. Census every 5 years of all State prison facilities to record their characteristics
CJ3. Census every 5 years of all jail facilities to record their characteristics
CJ11. Census every 2 years of privately operated facilities for the detention or commitment of juveniles
CJ29. Census every 2 years of publicly operated facilities for the detention or commitment of juveniles
Series based on reported individual off enders
NPS8. Charaeteristics of persons admitted to, under, or released from a sentence of death during the year
NCRP-IA. Individual record data on each offender admitted to prison during a year, covering race, age, Hispanic origin, jail credits, prior prison credit, offenses and number of counts, and maximum and minimum sentence
NCRP-1B. Individual record data on each offender released from prison during a year, covering data contained in NCRP-IA, offenses and sentences since admittance, time spent in halfway houses, time served, and category of discharge
NCRP-IC. Individual record data on each offender discharged from parole supervision, covering data contained in NCRP-1A and IB, parole discharge, and category of discharge
Series based on interviews of sampled prisoners
SlJ-43. Survey every 5 years of a random sample of prisoners in jails to determine criminal history, drug and alcohol use, and personal background
NP8-25. Survey every 5 years of a random sample of prison inmates to determine criminal history, drug and alcohol use, and personal background
Special studies of recidivism
BJS has conducted two major studies of the arrests and convictions of offenders after they are released from prison.
Recidivism I. This project analyzed arrests and convictions of a cohort of offenders paroled fl'om prison in 20 States. It has incorporated into the parole records FBI data on each parolee's contacts with criminal justice agencies. The selected offenders were 18 to 22 years of age when they were released from prison in 1978.
Recidivism IL This data collection program will permit the analysis of criminal justice contacts for a sample of 15,000 prisoners released from prisons in 10 States in 1983. The effort merges FBI, State, and local police records with correctional records.
4 Correctional PopUlations in the United States, 1985
&S
Notes to tables 1.1 and 1.2
The numbers in this volume come from officials of the Nation's prisons, jails, and probation and parole agencies. They counted about 2.9 million Americans under their supervision on a day in 1985 (table 1.1). Probation agencies accounted for the largest part of that population, about 1.9 mUlion offenders. Prisons held more than half a million persons, and an additional 275,000 were on parole from prison. The remainder, approximately 250,000, were in jail.
Reported figures from 1985, augmented with the complete jail census last taken in 1983, show that the persons in the care, custody, or control of correctional authorities made up about 1.696 of all adults. Most of them were men (table 1.2). About two-thirds of them were white; onethird, black or of another race.
Were it possible to count everyone under correctional supervision at any time during 1985, rather than only on 1 day, the percent of the adult population would be several times 1.6%. The large number of brief stays in jail would be the main source of dif~ ferences between results from the two methods of counting. With a quarter million prisoners on a single day, jails had more than 8 million admissions and 8 million releases in the course of 12 months. How many different persons those 16 million movements represented is not known, but the size of the number leads to the conclusion that the percentage of adults, especially men, involved in corrections during 1985 was substantially more than 1.696.
Table 1.1. Persons on probation, in jail, in prison, or on parole and their percent of the adult population, by State, 1985
Total adult POl2ulation in correctional carel custod:tz or control Percent Regions and resident of adult jurisdictions population Total Jail8 Probation Prison Parole population
U.S. total 175,725,000 2,869,836 218,995 1,870,132 503,271 277,438 1.6%
Federal 175,725,000 112,300 55,217 40,223 16,860 state 175,725,000 2,757,536 '218,995 1,814,915 463,048 260,578 1.6
United States adult resident population'" 175,727,000 83,905,000 '~l,822,000 151,629,000 19,284,000 4,814,000
Percent in correctional care or custody 1.7% 3.0% .4% 1.2% 5.2% .8% ----Note: Details may not add to totals because "'Resident population age 18 yea:s and over on of rounding. July 1, 1985.
6 Correctional Populations in the flnit~d States, 1985
~,~ .. ----------------------------------
-Tables
J ail inmates in 1985
2.1 Jail census: Inmates by jurisdiction, sex, legru. status, and ratio to total resident population, June 30, 1983 8
2.2 Jail population: One-day counts and average dally population, by legal status and sex, 1983-85 9
2.3 Detention status of adult jail inmates, by sex, 1983-85 9
2.4 Jail inmates, by sex, race, and Hispanic origin, 1984 and 1985 10
2.5 Annual jail admissions and releases of adults and juveniles, by sex, 1983-85 10
2.6 Jail capacity and occupancy, 1983-85 10
2.7 Jails in jurisdictions with large jail populations: Impact of crowding elsewhere, 1983-85 11
2.8 Jails in jurisdictions with large jail populations: Rated capacity and percent of capacity occupied, 1984 and 1985 11
2.9 Jails in jurisdictions with large jail populations: Number of jails under court order to reduce population or to improve conditions of confinement, 1985 11
2.10 Jails in jurisdictions with large jail populations: Inmate deaths, 1983-85 12
2.11 Twenty-five largest jails: Average daily population and 1-day count, June 30, 19115 12
Explanatory notes 13
Quest~onnaires 14, 18
Jail Inmates in 1985 7
Table 2.1. Jail census: Inma~es by jurisdiction, sex, legal status, and ratio to total resident population, June 30, 1983
Number of inmates per
Number Number of~ail inmates 100,000 Regions and of AI! mmates A uHs Juvemles resident jurisdictions jails Total Male Female Total Male Female Total Male Female population
U.S. total 3,338 223,551 207,782 15,769 221,815 206,163 15,652 1,736 1,619 117 98
Note: Five States-Connecticut, Delaware, integrated jail-prison systems and therefore has five locally operated jails in addition to HaWaii, Rhode Island, and Vermont-have were excluded from the report. Alaska, which an integrated jail-prison system, is included.
8 Correctional PopUlations in the United States, 1985
-------------~.~----~----
Table 2.2. Jail population: One-day counts and average daily population, by legal status and sex, 1983-85
Number of jail inmates National Annual survey jail census of jails
1983 1D84 1985 Percent chan~e
1983-85 198 -85
One-day counts
All inmates 223,551 234,500 256,615 15% 9% Mult 221,815 233,018 254,986 15 9
Note: Data for I-day counts are for June 30 of each year. ·Juveniles are persons of an age specified by State statute (usually under 18) as initially subject to juvenile court authority even if
they are tried as adults in criminal court. Because juveniles made up less than 1 % of the jail population, caution must be used in interpreting any changes in their number.
Table 2.3. Detention status of adult jail inmates, by sex, 1983-85
Total nu mber 0 f adults with known conviction status
Convicted Male Female
Unconvicted Male Female
National jail census
1983
221,644
107,660 100,557
7,103
).13,984 105,459
8,525
Note: Data are for June 30 of each year.
/i "
Number of jail inmates Annual survey of jails
1984 1985
229,822 250,468
113,491 123,409 105,529 114,131
7,962 9,278
116,331 127,059 107,901 117,560
8,430 9,499
Jail Inmates in 1985 9
--~~---~~--------------------~-----------------
Table 2.4. Jail inmates, by se:a:, race, and Hispanic origin, 1984 and 1985
Percent of jail inmates
Characteristic 1984 1985
Selt 100% 100%
Male 93 &2 Female 7 8
Raee 100% 100%
White 59 59 Male 55 55 Female 4
Black J..,j 40 Male 3'1 37 Female 3 3
Other· 1 1 Male 1 1 Female
Hispanic origin 100% 100%
Hispanic 13 14 Male 12 13 Female 1 1
Non-Hispanic 87 86 Male 81 80 Female 6 7
Note; Data are for June 30 of each year. Sex was reported for all inmates in both years. Race and Hispanic origin were reported for 88% of the inmates in 1984 and for 80% in 1985. Percents may not add to totals because of rounding. - Less than 0.5% • • Includes American Indians, Aleuts, ASians, and Pacific Islanders.
Table 2.5. Annual jail admissions and relesses or adults and juveniles, by sex, 1983-85
National jail census
1983
Admissions, total 8,084,344
Adult 7,978,978 Male 7,270,663 Female 708,315
Juvenile· 105,366 Male 86,850 Female 18,516
Releases, total 7,941,236
Adult 7,837,156 Male 7,145,818 Female 691,338
Juvenile· 104,080 Male 85,564 Female 18,516
Number of inmates Annual survey of jails
1984 1985
7,838,521 8,364,533
7,742,941 8,252,427 7,007,292 7,430,148
735,649 822,279
95,580 112,106 79,617 94,579 15,963 17,527
7,716,067 8,279,054
7,622,366 8,169,461 6,904,343 7,359,076
718,023 810,385
93,701 109,593 77,564 92,235 16,137 17,358
Note: Data are for the year ending June 30 • • Juveniles are persons of an age specified by State statute (usually under 18) as initially
subject to juvenile court authority even If they are tried as adults in criminal court.
Table 2.6. Jail capacity and occupancy, 1983-85
Number of inmates
Ra ted capacity of jails
Percent of rated capacity occupied
Note: Data are for June 30 of each year.
National jail census
1983
223,551
261,556
85%
10 Con'ectional Populations in the United States, 1985
Annual survey of jalls
1984 1985
234,500
261,432
90%
256,615
272,830
94%
Table 2.7. Jails in jurilldictions with large jail populations: Impact ot crowding elllewhere, 1983-85
1983
All jails in jurisdictions with large jail populations 618
Jails holding inmates for other authorities:. 130
Federal 31 state 84 Local 44
All inmates in jurisdictions with large jail populations 168,250
Inmates being held for other authorities: 4,400
Federal 306 state 3,606 Local 488
Note: Data are for June 30 of each year and cover all jails in jurisdictions with an average daily inmate population of 100 or more in the 1983 jail census.
Number 1984 1985
621 614
150 137 35 30
112 100 52 57
173,155 190,221
6,199 6,107 460 534
4,733 4,462 1,006 1,111
·Detail adds to more than total because some jails hold inmates for more than one authority.
Table 2.8. Jails in jurisdictions with large jail populations: Rated capacity and percent of capacity occupied, 1984 and 1985
Number Rated Jails in jurisdictions with of jails ca~acit:i large jail populations 1984 1985 1984 1985
Number of jail inmates
1984 1985
Total 621 614 169,967 179,729 173,155 190,221
Jails not under court order to reduce popUlation 487 477 121,098 126,965 124,567 134,967
Jails under court order to reduce population. 134 137 48,869 52,764 48,588 55,254
Percent of ca~acit:i occu~ied
1984 1985
10296 10696
103 106
99 105
Notu: Data are for June 30 of each year and cover all jails in jurisdictions with an average daily inmate population of 100 or more in the jail census.
~he court-ordered capacity for these jails in 1984 was 49,572-703 inmates higher than the rated capacity. In
1985 it was 54,375-1,611 higher than the rated capacity.
Table 2.9. Jails in jurisdictions with large jail populations: Number of jails under court order to reduce population or to improve conditions of confinement, 1985
Number of jails in jurisdictions with large jail populations
Ordered to Not ordered to Total limit population limit population
Total 614 137 477
Jails under court orders citing spt<cific conditions of confinement 153 120 33
Subject of court order:
Crowded living units 132 114 18 Recreational facilities 88 68 20 Medical facilities or services 83 65 18 Visitation practices or policies 51 51 0 Disciplinary procedures or policies 62 48 14 Food service (quantity or quality) 49 38 11 Administrative segregation procedures or poliCies 57 45 12
Staffing patterns 59 45 14 Grievance procedures or policies 60 46 14 Education or training programs 48 33 15 Fire hazards 51 41 10 Counseling programs 38 29 9 Other 29 18 11
Note: Data are for June 30, 1985, and cover jail census. Some jails were under court all jails in jurisdictions with an average daily order for more than one reason. inmate population of 100 or more in the 1983
Jail Inmates in 1985 11
Table 2.10. Jails in jurisdictions with large jail populations: Inmate deaths. 1983-85
Total
Cause of death: Natural causes Suicide InjUrYt?Y another person Other
Jails reporting dea ths8 1983 1984 1985
169 150 163
87 83 84 99 96 89 5 5 9
11 10 16
Inmate deaths 1983 1984 1985
276 278 303
129 136 151 130 126 119
5 6 11 12 10 22
Note: Data are for ihe year ending June 30 and cover all jails in jurisdictions with an average daily inmate population of 100 or more in the 1983 jail census.
aDetail adds to more than total because some ialls reported more than one type of death. ~ncludes accidents and undetermined cause of death.
12 Correctional Populations in the United States, 1985
FlEe.
Explanatory notes
The 1985 survey of jails was the third annual survey sponsored by the Bureau of Justice Statistics (BJS) and conducted by the U.S. Bureau of the Census. This series follows a similar effort made by the Law Enforcement Assistance Administration (LEA A) during the 1970's.
The sample surveys yield estimates of the national jail population for those years that lack a complete enumeration. Full censuses were done on February 1, 1978, and June 30, 1983.
The 1985 survey, conducted on June 30, included 1,142 jails in 893 jurlsdictions--counties, municipalities, or townships that administer 1 or more jails. A jurisdiction with an average dally inmate population of 100 or more in the 1983 census automatically entered the survey. Such units of government, referred to as certainty jurisdictions, accounted for 614 jails and 189,329 inmates, or 7496 of the total estimated inmate population.
Administrators of jails in jurisdictions with large jail populations reported the number of inmates held because of crowded facilities elsewhere, jail capacity, and reasons for court orders, if any. (See the questionnaire CJ-5.) The other jurisdictions in the survey belonged to a stratified random sample or jurisdictions wi!h an average daily inmate population of less than 100.
The survey excluded five types of facilities from the count:
" lock-ups that house persons for less than 48 hours; • Federal facilities; .. State facilities; ., privately operated facilities; • the combined jail-prison systems of Connecticut, Delaware, Hawaii, Rhode Island, and Vermont.
Data were obtained through mailed questionnaires. Two follow-up mailings and phone calls elicited a response from every sampled jail not in a certainty jurisdiction (8 jurisdiction with such a large population that it has 10096 certainty of entering the sample). Ninety-five percent of the facilities in jurisdictions with large populations responded.
Jail Inmates in 1985 13
CJ-5 OMS No. 1121-0094:
U.S. OEPARTMENT OF COMMERCE. BUREAU OFTHE CENSUS
I ____ .....!~~~~!!~!.E.L ____ _lFORM CJ-5 "" (6-17·85)
Name 1985 SAMPLE SURVEY OF JAilS
Title
Official address (Number and street, city, State, ZIP code)
Bureau of the Cen:u:: ATTN: Governments Division Washington, D.C. 20233
FROM THE DIRECTOR BUREAU OF THE CENSUS
Please correct any error in name and address including ZIP code.
On behalf of the Bureau of Justice Statistics (BJS), Department of Justice, the Bureau of the Census is conducting a sample survey of jails in the United States. The survey will obtain current information on the Nation's jail facilities and inmate population.
State, local, and Federal officials wi" use the data to assess the changing needs of these facilities and to keep informed of their status. BJS wi"'publish the data in a bulletin scheduled for release in early 1986.
Your facility and other facilities on the scientifically selected sample wi" represent the characteristics and population of all jails in the United States. So that we can produce estimates with a high degree of accuracy and publish the survey results as soon as possible, please complete this questionnaire within the next 3 weeks and return it in the enclosed envelopo.
If ~nswers to questions are not readily available, please provide reasonable estimates and indicate them with an asterisk. If we can help in completing the questionnaire, please call (301) 763-7825.
The Omnibus Crime Control and Safe Streets Act of 1968, as amended (42 U.S.C. 3732), authorizes this report. Although you are not legally required to respond, we need your participation to make the results of this survey comprehensive, accurate, and timely.
We will therefore appreciate your cooperation in this voluntary survey.
Sincerely,
JOHN G. KEANE
Enclosures
Note - If your ·facility is only a temporary holding or lock~p facility, i.e., inmates are never held beyond arraignment and are usually transferred within 48 hours or less, please mark (X) the box at the right • 0 and return the questionnaire without completing it.
complete form on reverse side
14 Correctional Populations in the United States, 1985
INSYRUCTIONS
Please answer all questions for only the facility identified on the Please mark (X) the box if more than one ~D mailing label. If you need additional questionnaires please call facility is included on the questionnaire. (301) 763-7825. Please mark (X) the box if your jurisdiction_ D If exact figures are not available, please estimate and mark with has opened a new jail since June 30, 1983 an asterisk. If figures for June 30, 1985 are not availatJle, provide and list the name and address in the Remarks figures for today and mark with an asterisk. section on page 4.
I· · II1!I @NMATE POPULATION Juveniles ~ A. Inmate population at this facility on Adults
(See definition of juvenifes) June 30, 1985 TOTAL
Males Females Males Females
(1 ) (2) (3) 141 (5)
1. TOTAL inmates in facility en June 30, 1985 Should equal sum of 2a through 21 ....
2. What was the number of inmates in the facility on I June 30, 1985 in each of the following categories7
8. Awaiting arraignment/trial or being tried at this I time'
b. Convicted and awaitinQ sentence2
c. Serving sentence (whether appealing or not) 2
d. Technical probation or parole violators only, with no new charges 3 .
e. Juveniles housed for juvenile authorities (i.e., runaways, awaiting transfer to juvenile facility, etc.)
f. Other - Specify '"'1
, Include bail jumpers and escapees, whether convicted or unconvicted, returned with new charges for which they have not been convicted. Include mUltiple offenders who are unconvicted on all current offenses.
2 Include convicted bail jumpers and escapees returned, who have no new charges. Include multiple offenders convicted of any current offense.
3Technical violators only. Those who have been charged with another crime while on probation or parole should be reported undel 2a above, if they have not been convicted of the new charge; under 2b above, if they are convicted of and awaiting sentence on the new charge; or under 2c above, if they are convicted of and serving sentence on the new charge.
~ B. What was the inmate population BY RACE, Adults Juveniles on June 30,19857 TOTAL
Males Females Mal('s Females ;1) (2) (3) (4) (5)
1 • TOTAL inmate population Sum of lines Ii through 8 below IiI1
a. White, not of Hispanic origin
b. Black, not of Hispanic origin
c. Hispanic origin' - Sum of lines c(1} and c(2}
(1) White, Hispanic origin
(2) Black, Hispanic origin
d. American Indian/Alaskan Native
e. Asian/Pacific Islander
, Persons of Mexican, Puerto Rican, Cuban, Central or South American, or other Spanish culture or origin, excluding persons from Brazil, Jamaica, and Haiti.
Page 2 FOAM CJ.5 16·17·85)
Jail Inmates in 1985 15
1"1'LO:!.t. 11. INMATE POPULATION Continued
• C. Inmates held for Federal, State, and other local authorities Federal Other on June 30, 1985. State counties
Illegal aliens Other or cities
( 11 (2) (3) (4)
1 . Of the total number of inmates reported in item A how many were being held for Federal, State, and other local authorities? Should equal sum of 2a and 2b(1) and (2) below.
2. Of those prisoners being held for Federal, State, and other local authorities, how many were -
o. Being held as a direct result of overcrowding in Federal, State, and other local institutions? (That is, inmates serving a sentence or in an indefinite status pending availability of space in another institution.)
b. Being held for other reasons:
(1) Whose early transfer is anticipated upon completion of necessary arrangements such as paperwork or transportation.
(2) Other (e.g., trustees, security reasons, or special programs).
~ D. Average daily population and Adults Juveniles population movement TOTAL
Include only inmates who have been admitted and housed in Males Females Males Females
your facility. Count a case only once. Example: A felon who (1 ) (2) (3) (4) (5) is housed at your facility, transferred to a diagnostic center and returned to your facility without being booked on a new charge is considered one admission.
1 . What is the average daily population for your facility for the year ending June 30, 1985?
2. How many persons were admitted between July 1, 1984 and June 30, 1985?
3. How many persons were discharged or transferred between July 1, 1984 and June 30, 1985?
• E. Inmate deaths Adults Juveniles
Please report the number of inmates who died while TOTAL confined in this facility for the period July 1 r 1984 Males femalos Males Female:: to June 30, 1985. (1) (2) (3) (4) (5)
1. TOTAL number of inmate deaths 2. Cause of death -
iI. Illness/natural causes (exclude "AIDS," and report below)
b. Suicide
c. Homicide by other inmates
d. Homicide - Other
e. Acquired immune deficiency syndrome (AIDS) f. Other deaths - Specify ""1
FORM CJ-5 (6·17-851 Page 3
16 Correctional Populations in the Uma:d States, 1985
Ii ::r.:iIT. ilIl. FACILITY CHARACTERISTICS
~ A. Capacity Rated capacity
1. On June 30, 1985 what was the rated capacity for your facility that was set by State or local authorities?
2. On June 30, 1985 what was the design capacity of your jail, i.e., the number of Design capacity inmates you can house without crowding. (Examples of crowding would include double bunking where the facility was designed for a single bunk, or temporary use of a day room as sleeping quarters that would not ordinarily be used as such.!
~ B. Are you now under court order to limit 1 fJ Yes - Complete item C below the maximum number of inmates you can
2 n No - SKIP to item 0 house? Number of inmates Adults Juveniles
TOTAL Males Females Males Females ~ C. If you are under court order,
(1 ) (2) (3) (4) (5) onter the maximum number of inmates you can house • I
i ~D. Court ordered conditions of confinement I
1 '. 1 Yes I
1. Was your institution under court order for conditions of confinement on June 30, 1985? I 2, -1 No I
2. If "Yes" is marked above, indicate the reasons - Mark (X) as many as apply
10 Crowded living units 9i . Staffing patterns 20 Administrative segregation wi 1 Education/training programs
procedures/policies 111.! Counsf'ling programs 3D Disciplinary procedures/policies
1 Food service (quantity, quality) 40 Grievance procedures/policies 12 )
sO Medical facilities/services d: Other - Specify?
sO Fire hazards ............... "-'_~~" _____ • _____________ • ____ ,, __ ,_v __ ·_·_~ _____ +_~ __ ~. __
DEFINITIONS Local jail - a confinement facility usually administered by a local law enforcement agency, intended for adults but sometimes also containing juveniles, which holds persons detained pending adjudication and/or persons committed after adjudication for sentences usually a year or less. Temporary holding facilities, or lockups, that do not hold persons after being formally charged in court (usually within 48 hours of arrest) are excluded.
Juvenile - a person subject to ~he exerrise of juvenile court jurisdiction for purposes of adjudication and treatment based on age and offense limitations as defined by State law. For the purposes of this report, a person of juvenile age is considered a juvenile even though tried as an adult in criminal court.
AdlJlt criminal offendiJr - a person subject to the original jurisdiction of the criminal court rather than the juver;;,e court because at the time of the offense the person was above a statutory age limit.
Youthful offender - a person adjudicated in criminal court, who may be above the statutory age limit for juveniles but below a specified upper age limit ar;d for whom special correctional commitments and special record-sealing procedures are made available by statute. For the purposes of this report youthful offenders should be considered adults.
REMARKS
CENSUS USE
Page 4 FOAM CJ516·17·8S1
Jail Inmates ill 1985 17
CJ-5A OMB No. 1121·0094: A 30,1987
I ___ .E;~~!Ee~~X-____ ~FORM CJ-SA I- (6.17.85)
U.S. DEPARTMENT OF COMMERCE BUREAU OF THE CENSUS
Name 1985 SAMPLE SURVEY OF JAILS
Title
Official address (Number and street, city, State, ZIP code)
Bureau of the Census ATTN: Governments Division Washington, D.C. 20233
FROM THE DIRECTOR BUREAU OF THE CENSUS
SECOND REQUEST Please correct any error in name and address including ZIP code.
On behalf of the Bureau of Justice Statistics (BJS)' Department of Justice, the Bureau of the Census is conducting a sample survey of jails in the United States. The survey will obtain current information on the Nation's jail facilities and inmate population.
State, local, and Federal officials will use the data to assess the changing needs of these facilities and to keep informed of their status. BJS will publish the data in a bulletin scheduled for release in early 1986.
Yourfacility and other facilities on the scientifically selected sample will represent the characteristics and population of all jails in the United States. So that we can produce estimates with a high degree of accuracy and publish the survey results as soon as possible, please complete this questionnaire within the next 3 weeks and return it in the enclosed envelope.
If answers to questions are not readily available, please provide reasonable estimates and indicate them with an asterisk. If we can help in completing the questionnaire, please call (301) 763-7825.
The Omnibus Crime Control and Safe Streets Act of 1968, as amended (42 U.S.C. 3732), authorizes this report. Although you are not legally required to respond, we need your participation to make the results of this survey comprehensive, accurate, and timely.
We will therefore appreciate your cooperation in this voluntary survey.
Sincerely,
JOHN G. KEANE
Enclosures
Noto - If your facility is only a temporary holding or lockup facility, i.e., inmates are never held beyond arraignment and are usually transferred within 48 hours or less, please mark (X) the box at the right .0 and return the questionnaire without completing it.
Please complete form on reverse side
18 Correctional Populations in the United States, 1985
INSTRUCTIONS
Please answer all questions for only the facility identified Please mark (X) the box if more than one .. 0 on the mailing label. If you need additional questionnaires facility is included on the questionnaire.
.. 0 please call (301) 763- 7825. Please mark (X) the box if your jurisdiction If exact figures are not available, please estimate and mark has opened a new jail since June 30, 1983 with an asterisk. If figures for June 3D, 1985 are not available, and list the name and address in the provide figures for today and mark with an asterisk. Remarks section on page 4.
I- • 1111 INMATE POPULATION
• A .Inmato population at this facility on Adults Juveniles (See definition of juveniles)
Juno 30, 1985 TOTAL Males Females Males Females
(1) (2) (3) (4) (5)
1 • TOTAL inmates in facility on Juno 30, 1985 Should equal sum of 28 through 2f ....
2. What was tho number of inmates in the facility on June 30, 1985 in each of the following categories? a. Awaiting arraignment/trial or being tried at this
timet
b. Convicted and awaiting sentence2
c. Serving sentence (whether appealing or not)2
d. Technical probation or parole violators only, with no new charges3
o. Juveniles housed for juvenile authorities (j.e., runaways, awaiting transfer to juvenile facility, etc.) .
f. Other - Specify ~
, Include bail jumpers and escapees, whether convicted or unconvicted, returned with new charges for which they have not been convicted. Include mUltiple offenders who are unconvicted on all current offenses.
2 Include convicted bail jumpers and Ei\scapees returned, who have no new charges. Include multiple offenders convicted of any current offense.
3 Technical violators only. Those who have been charged with another crime while on probation or parole should be reported under 2a above, if they have not been convicted of the new charge; under 2b above, if they are convicted of and awaiting sentence on the new charge; or under 2c above, if they are convicted of and serving sentence on the new charge.
~ B. What was the inmate population BY RACE, TOTAL
Adults Juveniles on Juno 30, 1985?
Males Females Males Females (1 ) (2) (3) (4) (5)
1 • TOTAL inmate population Sum of lines a through e below .. a. White, not of Hispanic origin
~~k. not of Hispanic origin
c. Hispanic origin' - Sum of lines c(1} and c(2)
(1) White, Hisp:.'lnic origin
(2) Black, Hispanic origin
d. American Indtan/'6.laskan Native
I o. Asian/Pacific Islander
1 Persclns of Mexican, Puerto Rican, Cuban, Central or South American, or ether Spanish culture or origin, eXcluding persons from Brazil, Jamaica, and Haiti • .
Page 2 HlRM OJ-5A 16-17-851
Jail Inmates in 1985 19
.,orn INMATE POPULATION - Continued
~ C. Average daily population and Adults Juveniles
population movement TOTAL
Include only inmates who have been admitted and housed in Males Females Males Females
your facility. Count a case only once. Example: A felon who ( 11 (2) (31 (4) (5)
is housed at your facility, transferred to a diagnostic center and returned to your facility without being booked on a new charge is considered one admission.
1 . What is the average daily population for your facility for the year ending June 30, 19857
2. How many persons were admitted between July 1, 1984 and June 30, 19857
3. How many persons were discharged or transferred between July 1, 1984 and June 30, 19857
1"1':·r.li' .ITIIIIIIIII FACILITY CHARACTERISTICS
~ A. Capacity Rated capacity
1. On June 30, 1985 what was the rated capacity for your faciiity that was set by State or local authorities7
.•. -2. On June 30, 1985 what was the design capacity of your jail, i.e., the number Design capacity
of inmates you can house without crowding. (Examples of crowding would include double bunking where the facility was designed for a single bunk, or temporary use of a day room as sleeping quarters that would not ordinarily be used as such.)
DEFINITIONS
local jail - a confinement facility usually administered by a local law enforcement agency, intended for adults but sometimes also containing juveniles, which holds persons detained pending adjudication andloi persons committed after adjudication for sentences usually a yea, or less. Temporary holding facilities, or lockups, that do not hold persons after being formally charged in-:::ourt (usually within 48 hours of arrest) are excluded.
Juvenile - a person subject to the exercise of juvenile court jurisdiction for purposes of adjudication and treatment based on age arid offense limitations as defined by State law. For the purposes of this report, a person of juvenile age is con!;.idered a juvenile even though tried as an addt in criminal court.
Adult criminal offender - a person subject to the original jurisdic(ion of the criminal court rather than the juvenile court because at the time of the offense the person was above a statutory age limit.
Youthful offender - a person adjudicated in criminal court, who may be above the statutory age limit for juveniles but below a specified upper age limit and for whom special correctional commitments and special record-sealing procedures are made available by statute. For the purposes of this report youthful offenders should be considered adults.
REMARKS
CENSUS USE
FOR CJ·5A M 1617851 Page 3
20 Correctional PopUlations in the United States, 1985
,~
OTHER REMARKS
~
,'-
,
Page 4 FORM CJ·5A (6·17·851
Jail Inmates in 1985 21
----~---------------------...... ------
Probation in 1985
Tables
3.1 Adults on probation, by national totals for characteristics, 1985 24
3.2 Adults on probation, 19G:.l 25
3.3 Adults on probation, by status of probation, 1985 26
3.4 Adults on probation, by status of supervision. 1985 27
-
3.5 Adults entering probation, by type of sentence, 1985 28
3.6 Adults leaving probation, by type of exit, 1985 29
3.7 Adults on probation, by SI'lX,
1985 30 3.8 Adults on probation, by race,
1985 31 3.9 Adults on probation, by
Hispanic origin, 1985 32, 3.10 Adults on probation, by type
of offense, 1985 33
Explanatory notes by jurisdiction 34
Questionnaire 36
Probation in 1985 23
~-~~~ ~~-------,--
Table 3.1. Adults on probation, by national totals for characteristics, 1985
Characteristics
Total number of adults on probation
Status ot probation
Execution of sentence suspended Imposition of sentence suspended Direct imposition of probation Other specified status
Status of sttlervision
Active supervision Inactive supervision Absconded from supervision Supervised out of State
Adu!ts entering probation
Probation without jail Probation with jail Probation of other types
Adults leaving probation
Successful completions Discharged absconders Discharged to detainer/warrants Returned to prison
With new sentence With the same sentence
Other type of exit Death
Sex of adults on probation
Male Female
Race of adults on probation
White Black American Indian/Alaska native AsianIPaciflc Islander Other races
Hispanic origin of adults on probation
Hispanic Non-Hispanic
Type of offense of adults on probation
Felony Misdemeanor Infractions
Numbe~ of adults on proba tion fro m S ta te or Federal courts
1,870,432
1,071,339
502,540 90,662
475,631 2,506
1,697,114
1,440,460 120,865
98,738 37,051
985,650
916,307 49,205 20,138
851,592
681,207 20,647 33,888
26,721 39,855 45,273 4,001
1,657,516
1,384,878 272,638
1,243,311
872,905 355,408
9,349 2,071 3,578
768,596
109,532 659,064
1,346,924
677,074 657,114
12,706
Percent of those persons with a known status
100'0
47 8
44 1
100%
85 7 6 2
100%
93 5 2
100%
80 2 4
3 5 5 1
100%
84 16
70
70 29 1
100%
14 86
100%
50 49 1
Note: See the detailed tables, the questionnaire, and the explanatory notes for definitions, limitations, and exceptions. For each characteristic there existed persons of unknown status or type; their numbers are in
the detailed tables. More than a third of the responses for status of probation, race, and Hispanic origin were in the unknown or not reported category. -Under .5%.
24 Correctional Populations in the United States, 1985
Table 3.2. Adults on probation, 1985
Percent Number on pro-change in bation in 1985
Probation Probation probation per 100,000 Regions and population 1985 population population resident jurisdic tions 1/1/85 Entries Exits 12/31/85 1984-85 population
U.S. total 1,740,948 1,174,832 1,046,383 1,870,132 7.4% 1,064
Note: Figures for January I, 1985, may e1ndiana and Montana reported their 1984 differ from the previously reported numbers p,gures for 1985. for December 31, 1984, because of revisions Iowa inclUded 3,198 reinstatements and by the jurisdictions in the counts or in the transfers to probation as entries and 2,954 coun ting procedures. transfers as exits. / Jurisdiction did not report category. gMaryland traced cases, not individuals, and 8Connecticut's probation staff no longer reduced its case counts by 10% to estimate supervise pre-trial alcohol cases. Jurisdiction the nroba tion popula tion • over 12,990 such cases was transferred to the . Okiahoma estimated entries. Ere-Trial Bail Commission. IYirginia's reporting period went from July 1,
Pennsylvania estimated entries and E'xits. 1.984, to June 30, 1985. CJurisdiction estimated the data. Alabama JA Utah statute has restricted the length of sstlmated data in the detail categories. probation. Judges stopped giving probated Illinois estimated exits. sentences for less serious offenses.
Probation in 1985 25
Table 3.3. Adults on probation, by status of probation, 1985
Probation Number on I2roba tion b~ 5ta tus
Execution Imposition Direct im- Unknown Regions and population of sentence of sentence position of or not jurisdictions 1?/31/85 s\!spended suspended probation Other reported
U.s. total 1,870,132 502,540 90,662 475,631 2,506 798,793
Federal 55,217 / / / / 55,217 State 1,814,915 502,540 90,662 475,631 2,506 743,576
Northeast 296,391 33,836 21,710 160,203 3 80,639
Connecticut 36,805 26,848 / 9,957 / / Maine 4,451 1,571 12 2,868 / / Massachusetts 24,637 / / / / 24,637 New Hampshire 3,096 119 5 2,969 3 / New Jersey 48,466 / / / / 48,466
New York 100,816 I / 100,816 / / Pennsylvania 65,286 / 21,693 43,593 / / Rhode Island 7,536 / / / / 7,536 Vermontft 5,298 5,298 / / / /
/ Jurisdiction did not report category. reduced its case counts by 10% to estimate sAll data were estimated. ~e probation POPUlation. i>fudiana and Montana repeated their 1984 irginia's reporting period went from figures for 1985. July 1, 1984, to June 30, 1985. CMaryland traced cases, not individuals, and
26 Correctional PopUlations in the United States, 1985
Table 3.4. Adults on probation, by status of supervision, 1985
Number on probation in Probation each status of su~ervision Unknown
Regions and por 'Ila tion Ab- Out of or not jurisdictions 12. J1/85 Active Inactive sconded state Other reported
U.s. total 1,870,132 1,440,460 120,865 98,738 37,051 1,270 171,748
Federal 55,217 50,757 1,286 3,174 / / State 1,814,915 1,389,703 119,579 95,564 37,051 1,270 171,748
Connecticut 36,805 16,562 19,415 / 828 / / Maine 4,4;i1 3,926 / 358 167 / / Massachusetts 24,6l7 / I / I / 24,637 New Hampshire 3,f.96 3,001 44 44 3 4 / New Jersey 48,,166 41,425 / 5,068 1,973 / / New York 100,816 87,002 I 8,498 5,316 I I Pennsylvania 65,286 58,582 6,563 / 141 / I Rhode Island 7,536 3,371 3,731 I 434 I / Vermonta 5,298 4,289 1,009 I I I /
South 795,374 618,097 53,521 68,052 21,373 750 33,581
Alabama 16,520 10,118 2,283 3,444 675 / / Arkansas8 9,268 8,673 / / 595 / / Delaware 7,103 5,144 '168 459 732 / / Dist. of Columbia 11,777 10,207 926 / 644 / / Florida 130,767 106,962 22,970 823 12 / / Georgia 94,461 88,503 / 4,779 1,179 / / Kentucky 14,887 5,969 8,330 / 588 / / Louisiana 26,638 26,638 / I / I I MarylandC 67,138 39,453 10,479 14,244 2,212 750 I Mississippi 6,636 5,847 77 / 712 / / North Caroli:1a 56,207 45,305 3,21<1 6,004 1,684 I I Oklahoma 20,310 615 / I / I 19,695 South Carolina 17,964 15,684 I 1,685 595 I I Tennessee 24,648 6,155 4,455 152 I / 13,886 Texas 269,909 223,893 I 36,456 9,560 / I Virginiad 17,236 15,161 I / 2,075 / I West Virginia 3,905 3,770 19 6 110 I I
West 347,138 324,957 4,983 4,521 4,691 / 7,986
Alaskae 2,606 2,606 I / I I / Arizona 18,176 13,939 / 2,156 2,081 I / California 210,449 210,449 I I I / I Colorado 17,612 15,851 1,761 I I / I Hawaii 7,986 I I / / / 7,986 Idaho 3,414 2,666 / / 748 / I Montanab 2,712 2,291 / / 421 I / Nevada8 5,365 5,091 / I 274 / I New Mexico 4,185 4,185 I I I I I Oregon 22,377 21,033 I 1,344 I I I utah 6,330 5,375 / 906 49 / I Washington 44,248 40,182 3,222 115 729 I / Wyoming 1,678 1,289 I I 389 I I
Note: See page two of the questionnaire for brndiana and Montana repeated their 1984 detailed explanations of categories of super- figures for 1985. vision. The absconded cases were those per- CMaryland traced cases, not indivit'uals, and sons who left probation without permission reduced its case counts by 10% to estimate before the end of the sentence. The cases y!e probation population. being supervised out of State remained in the Virginia's reporting period went from July 1, jurisdiction of the State where the sentence 1984, to June 30, 1985. was imposed. eAlaska could not identify the number of ,Jurisdiction did not report category. absconders who were InclUded in the active
All data were estimated. category.
Probation in 1985 27
Table 3.5. Adults entering probation, by type oC sentence, 1985
Probation Number of adults entering: erobation Regions and population Probation Probation Other Unknown or jurisdictions 12/31/85 without jail with jail type& no t reported
U.s. total 1,870,132 916,307 49,205 20,138 189,182
Federal 55,217 19,596 4,555 142 / State 1,814,915 896,711 44,650 19,996 189,182
Northeast 296,391 98,346 12,912 1,130 69,781
Connecticut 36,805 37,486 / / / Maine 4,451 2,482 642 / / Massachusetts 24,637 / / / 18,005 New Hampshire 3,096 2,312 13 13 / New Jersey 48,466 21,923 3,664 1,117 / New York 100,816 32,658 6,702 / I Pennsylvania 65,286 / / / 47,830 Rhode Isl,and 7,536 / / I 3,946 Vermont 5,298 1,485 1,891 / /
/ Jurisdiction did not report category. gersons entering probation. SOther type of sentence included reinstate- Maryland traced cases, not individuals, and ments, transfers, and entries other than reduced its case counts by 1096 to estimate glrect commitment from court. ~e probation population.
All data were estimated. Oklahoma estimated the number of entries "Indiana and Montana repeated their 1984 to balance yearend population. fi:ures for 1985. gVirglnia's reporting period went from July 1,
outh Dakota could not report number of 1984, to June 30, 1985.
28 Correctional Populations in the United States, 1985
Table 3.6. Adults leaving probation, by type of exit, 1985
Number of adults leaving: ~roba tiC:!1 Discharged
Total to custody, Incarcera ted Other Unknown Regions and leaving Successful detainer or New Same type or not jurisdictions probation completion Absconded warrant sentence sentence Death of exit reported
I Jurisdiction did not report category. ygures for 1985. gMaryland traced cases, not individuals, and aConnecticut tra!lsferred supervision of Iowa included 2,954 transfers under "other reduced its case counts by 10% to estimate 12,990 pre-trial s:cohol cases from the ~pe of exit." hhe proba tion popula tion. probation s~aff to the Pre-Trial Bail outh Dakota could not estimate the number Virginia's reporting period went from July 1, ~mmission. ?f adults leaving probation. (984, to June 30, 1985.
he State estimated the number of exits and Alabama based the number of exits on the final Alaska could not separate absconders from the number in types of exits. population count and known entries. It other types. cIndiana and Montana repeated their 1984 estimated the number of persons in each type.
Probation in 1985 29
---------------------------
Table 3.7. Adults on probation, by sex, 1985
Probation Number of adults on I2robation Regions and population Sex jurisdictions 12/31/85 Male Female unreported
·U.S. total 1,870,132 1,284,878 272,638 312,616
Feeleral 55,217 42,077 13,140 / State 1,814,915 1,242,801 259,498 312,516
Northeast: 296,391 177,292 33,162 85,937
Connecticut 36,805 29,444 7,361 / Maine 4,451 3,810 641 / Massachusetts 24,637 / / 24,637 New Hampshire 3,096 2,604 492 / New Jersey 48,466 / / 48,466
New York 100,816 87,247 13,569 / Pennsylvania 65,286 54,187 11,099 / Rhode Island 7,536 / / 7,536 Vermont 5,298 / / 5,298
/ Jurisdiction did not report category. CMaryland traced cases, not Individuals, aIndlana and Montana repeated their 1084 and reduced Its case counts by 10% to egures for 1985. attlmate the probation population.
All data are estimated. Alabama and New Irglnia's reporting period went from Mexico estimated the number of men and July 1, 1984, to June 30, 1985. women.
30 Correctional Populations in the United States, 1985
Table 3.8. Adults on probation, by race, 1985
Number of adu1 ~s on E!roba tion American
Probation Indian/ Aslan/ Unknown Regions and population Alaska Pacific or not jurisdictions 12/31/85 White Black native Islander Other reported
U.S. total: 1,8,0,132 1172,905 355,408 9,349 2,071 3,578 626,821
Federal 55,217 40,350 13,220 720 701 / 226 State 1,814,915 832,555 342,1,88 8,629 1,370 3,578 626,595
, JUrisdiction did not report ea tegory. CMaryland traced cases, not individuals, and Indiana and Montana repeated their 1984 reduced its case counts by 10% to estimate
R¥ures for 1985. t4e proba tion popula tlon. he State estimated numbers for each racial lrginia's reporting period went from
group. JUly 1, 1984, to June 30, 1985.
l, r
Probation in 1985 31
Table 3.9. Adults on probation, by Hispanic origin, 1985
Probation Number of adults on (!robation Regions and population Non-jurisdictions 12/13/85 Hispanic Hispanic Unknown
u.s. total 1,870,132 109,532 659,064 1,101,536
Federal 55,217 5,183 36,663 13,371 State 1,814,915 104,349 622,401 1,088,165
Northeast 296,391 14,660 149,919 131,812
Connecticut 36,805 / / 36,805 Maine 4,451 / / 4,4.51 Massachusetts 24,637 / / 24,637 New Hampshire 3,096 11 492 2,593 New Jersey 48,466 / / 48,466
New York 100,816 13,148 86,099 1,569 Pennsylvania 65,286 1,501 63,328 457 Rhode Island 7,536 / / 7,536 Vermont 5,298 / / 5,298
'Jurisdiction did not report category. bNew Mexico estimated the number of His-Indiana and Montana repeated their 1984 panic and non-HispaniC! persons on proba tion.
figures for 1985.
32 Correctional Populations in the United States, 1985
Table 3.10. Adults on probation, by type of offense, 1985
Probation Number of adults on (!robation Regions and population Unknown or jurisdictions 12/31/85 Felony Misdemeanor not reported
U.s. total 1,870,132 677,074 657,144 523,208
Federal 55,217 27,741 14,061 13,415 State 1,814,915 649,333 643,083 509,793
Northeast 296,391 72,055 75,227 149,096
Connecticut 36,805 14,809 21,996 / Maine 4,451 3,201 1,250 / Massachusetts 24,637 / / 24,637 New Hampshire 3,096 / 523 2,560 New Jersey 48,466 / / 48,466
New York 100,816 48,237 49,730 2,849 Pennsylvania 65,286 / I 65,286 Rhode Island 7,536 5,808 1,728 I Vermont 5,298 / / 5,298
Note: Five States reported adults on / Jurisdiction did not report category. probation for violations or regulations or aIllinois reported under "other" type of statutes not classified as Celonies or offense 11,034 persons given probated sen-misdemeanors. In Illinois 11,034 persons ~ences for driving while Intoxicated. received probated sentences for driving while Indiana and Montana repeated their 1984 Intoxicated. States reporting adults on figures for 1985. probation In similar categories Included cAll offense da ta were estima ted. Kansas, 1,639; New Jersey, 13; Washington, dVlrglnia's reporting period went from 13; and Ohio. 7. July 1, 1984, to June 30, 1985.
Probation ill 1985 33
us
Explanatory notes by jurisdiction
Alabama Alabama der.ived the number of
persons leaving pr'obation from the number of persons entering and the number present at the end of the year.
Alabama estimated all detail except status of supervision.
Alaska Alaska could not give the number
of absconders and included them under "active supervision."
Arkansas Arkansas revised its previously
reported estimate of December 31, 1984, to include local offices. Arkansas estimated all data.
California The January 1, 1985, probation
population differs from the December 31, 1984, population because of a caseload audit.
Connecticut The probation stllff before 1985
supervised pre-trial alcohol cases, During the year the State transferred 12,990 such cases to the Pre-Trial Bail Commission and classified them as "other" persons leaving probation.
Florida The January 1, 1985, probation
population differs from the December 31, 1984, population because the survey added local agencies to the count. (See table at end of notes.)
Georgia The January 1, 1985, probation
population differs from the December 31, 1984, population; Georgia changed from counting cases to counting people and corrected a double counting in De Kalb and Fulton counties.
Dlinois Illinois estimated the number of
persons leaving probation.
Indiana Indiana reported 1984 data for
1985.
.~
Iowa For persons entering probation,
3,198 were classified as "othel',tI ~-Ihich were reinstatements and transfers. Ofiicials could not separate the two. For persons transferred from probation, 3,954 were classified as "other type of exit.1I
Kansas The January 1, 1985, probation
population differs from the December 31, 1984, population because of corrections made by Kansas.
Kentucky In 1985 Kentucky <-eaRed to
report data on inactive probation cases, estimated to have been 8,330.
Louisiana Louisiana estimated counts for
sex, race, and offense type.
Maryland Maryland estimated the number
of persons on probation by reducing its count of probation cases 1096.
Michigan The January 1, 1985, probation
population differs from the December 31, 1984, pop',/lation because local agencies were added to the survey. (See table at end of notes.) Many of the persons reporting to local probation agencies were sentenced for drunk driving.
Missouri The January 1, 1985, probation
population differs from the December 31, 1984, population because of computer problems.
Missouri estimated all felony figures.
Montana Montana reported 1984 data for
1985 because it was installing a new computer system at the time of reporting.
Nevada Nevada estimated all data.
New Hampshire The January 1, 1985, probation
population differs from the December 31, 1984, population because local agencies were added to the survey. (See table at end of notes.)
34 Correctional Populations in the United States, 1985
• fIIrwx ..... New Jersey
The January 1, 1985, probation count differs from the December 31, 1984, count because New Jersey inventoried the probation population.
New Mexico The January 1, 1985, probation
population diffel's from the December 31, 1984, population because of corrections made by the State.
New Mexico estimated counts for sex, race, and Hispanic origin.
New York The January 1, 1985, probation
population differs from the December 31, 1984, population because of corrections made by the State.
Ohio The January I, 1985, probation
population differs from the December 31, 1984, population because Ohio substituted a complete enumeration of local offices for estimates.
Oklahoma The January 1, 1985, probation
population differs from the December 31, 1984, population because of corrections made by the State.
Oklahoma estimated the number of persons entering probation to balance the yearend population.
Oregon The January 1, 1985, probation
population differs from the December 31, 1984, population because of corrections made by the State.
Pennsylvania Pennsylvania estimated the
number of persons entering and leaving probation. The large increase in counts from 1984 to 1985, according to Pennsylvania officials, resulted from a computer's replacing manual reporting and from more DWI cases.
South Carolina The January 1, 1985, probation
population differs from the December 31, 1984, populatiM because of corrections made by the State.
P .. ,
South Dakota South Dakota did not report the
number of persons entering or leaving probation, and officials did not want to estimate. South Dakota authorities attributed the increased number on probation to an increase in DWI cases.
Utah The January 1, 1985, probation
population differs from the December 31, 1984, population because of corrections made by the State.
To account for the decline in the number of persons on probation, Utah officials cited a law that restricts the length of probation and the fact that probation was no longer being used for less serious offenses.
Vermont Vermont estimated all data.
Virginia The January 1, 1985, probation
population differs from the December 31, 1984, population because of corrections made by the State.
Virginia reported for its fiscal year, July 1, 1984, to June 30, 1985.
Virginia estimated counts for sex and race.
Washington The January 1, 1985, probation
population differs from the December 31, 1984, population because Washington substituted a complete count of local offices for estimates.
west Virginia The January 1, 1985, probation
population differs from the December 31, 1984, population because of corrections made by the State.
Wisconsin The January 1, 1985, probation
population differs from the December 31, 1984, population because of corrections made by the State.
& -Local probation agencies and the number of persons entering, leaving, or remaining on probation, 1985
Note: The above table indicates the number of local probation agencies that supply data which could not be reported by the State
Wyoming The January 1, 1985, probation
population differs from the December 31, 1984, population because of corrections made by the State.
Federal probation The J'anuat'y 1, 1985, probation
population differs from the December 31, 1984, population because of a corr'ection made by a reporting official.
Probation Probation Population entries exits 12/31/85
78,212 68,659 62,342 4,619 4,156 '1,974
43,596 39,068 43,974 5,385 3,637 4,692
545 519 536
31,043 27,882 53,944 2,178 2,267 615
11,754 11,103 11,013 21,938 20,044 22,955
respondent. The numbers reported above are Included in the overall probation figures for each State.
Probatlon in 1985 35
FORM CJ-8 (1-22-BBI
OMB No. 1121-0064:
REPORT PERIOD COVERED January 1, 1985 - December 31,1985
U.S. DEPARTMENT OF COMMERCE BUREAU OF THE CENSUS
1985 PROBATiON DATA SURVEY
Bureeu of the Census ATTN: Governments Division Washington, D. C. 20233
FROM THE DIRECTOR BUREAU OF THE CENSUS
SECOND REQUEST Please correct arrors in or ZIP code
On behalf of the Bureau of Justice Statistics (BJS). Department of Justice, the Bureau of the Census is conducting the National Probation Data Survey. The survey will obtain current information on the probation population in calendar year 1985 and the population movement.
State, local, and Federal officials will use the data to assess the changing needs of probation systems and monitor their status. The BJS will publish the data in a bulletin entitled Probation and Parole 1985 scheduled for release in fall 1986.
Expires 12/31/88
So that we can finish data collection and publish the survey results as soon as possible, please complete this questionnaire within the next 3 weeks and return it in the enclosed envelope. If we can help in completing the questionnaire, please call Arthur Ciampa at (301) 763- 7825.
The Omnibus Crime Control and Safe Street Act of 1968, as amended (42 U.S.C. 3732), authorizes this report. Although you are not required legally to respond, we need your participation to make the results of this survey comprehensive, accurate, and timely.
Thank you for your cooperation in the survey,
Sincerely,
JOHN G. KEANE
Enclosure
Pl •••• continue on pllfle 2 ______
36 Correctional Populations in the United States, 1985
Page 2
INSTRUCTIONS
Please complete each of the items on the questionnaire. When an exact amount is not available, please estimate the figure and mark with an asterisk. Do not leave blanks or mark dashes. Mark a "0" if your State can have probationers in the particular category, but has nono at this time. Mark "NA" (not applicable) if the item coes not apply in your State. Mark "OK" (don't know) if the item applies to probationers in your State, but yoo are unable to provide the number and/or have included it in another category. Describe difficulties encountered and items which cannot be estimated in the Remarks section.
THE PROBATION POPULATION
Probationers are those who have been placed under the supervision of a probation agency as part of a court order - regardless of whether they have been convicted.
Please include only adult probationers.
Include both active and inactive supervisory cases.
Exclude persons on "bench probation," "court probation," or "summary probation," who have not been placed under the supervision of a probation agency.
For interstate compacts, include those probationers who are sent to anothar State for supervision, but exclude those whom your State supervises for another State.
Itam 1 - PROBATION POPULATION (JANUARY 1,1985)
Provide the population at the beginning of the year in item 1. Please describe in the Remarks section any differences between this figure and the one which was reported last year. (Last year's figure has been entered on the worksheet.)
Itema 2 and 3 - POPULATION MOVEMENT IN 1985
Please enter the number of cases that entered and exited the probation system during 1985. Individuals should be counted separately each time they entered or exited.
2. Entries - Include those who have entered the probation system. (Exclude those sentenced to serve probation, whose terms have not actually begun.)
a. Probation without Incarceration - Include those sentenced to probation with no jail or prison term.
b. Probation with prison or Jail sentence - Enter those on probation whose sentence included incarceration. (That is, they entered probation from a correctional facility.)
3. Exits
iii. Completion of probation - Include all probationers who completed their term and were discharged during 1984. (Consider early term discharges to be the completion of a shortened term.)
b. Discharged absconder. - Include absconders who were discharged from probation while on absconder status. (Report absconders who were incarcerated under e.)
c. Discharged to custody, detainer, or warrant
d.lncarcerated with new sentence - Include all probationers removed from probation supervision because of incarceration on a new offense.
e .Incarcorated under current 80ntence - Include all probationers whose probation was revoked.
Item 4 - PROBATION POPULATION (DECEMBER 31, 1985)
Please provide the year end population. (This figure shou!d equal the population in item 1 plus the number of entries In item 2 minus the number of exits in item 3.)
Items 5 through 7 - SEX, RACE, ETHNICITY
These items are self explanatory.
Item 8 - OFFENSE TYPE (DECEMBER 31,1985)
a. Felonv - Include all probationers who were felony cases, regardless of whether convicted or unconvicted.
b. Misdemeanor - Include all probationers who were misdemeanor cases, regardless of whether convicted or unconvicted.
Item 9 - PROBATION STATUS (DECEMBER 31, 1985)
a. Suspended exocutlon of 8entenc9 - Include all probationers whose sentence of confinement was imposed and then suspended.
b. Suspended Imposition of 8entence - Include all probationers whose sentence of confinement was not imposed (e.g., case continued without finding, deferred sentence, and probation before verdict).
c. Direct 8entence to probation - Include all probationers whose probation was imposed and executed as the final sentence.
Item 10 - SUPERVISION STATUS (DECEMBER 31,1985)
a.Actlve - Include all probationers who were reporting on some regular basis. (Do not include probationers who were under supervision out of State.)
b.lnactlve - Include all probationers who were excused from regular reporting. (Do not include probationers who were under supervision out of State.)
c.Absconder - Include all probationers who were on absconder status. (Do not include probationers who were under supervision out of State.)
d. Supervl8ed out of State - Include all probationers who were under your jurisdiction but are supervised out of State.
Item8 11 through 13 - COVERAGE AND AVAILABILITY OF DATA
Please answer these items relating to your ability to report data on all adult probationers.
FORM CJ·B ,1-22·861
Probation in 1985 37
1986 PROBATION DATA SURVEY
Note: December 31, 1984 Number Number population reported in the 1984 Probation Data Survey was G.Race If line 1 differs, please explain
a.White discrepancy in Remarks section. 1 • Probation population
b.Black on January 1, 1985 ~
Population movement In 1985: c.American Indian or Alaskan Native
2. Entrlas
a. Probation without incarceration d.Asian or Pacific Islander a. Other - Specify ~
b. Probation with prison or jail sentence
c. Other - Specify ~ f. Not known
g. TOTAL - Sum of lines 6a through 6f 7. Ethnicity
d. TOTAL- Sum of lines 2a through 2c ill. Hispanic
3. Exits b. Not Hispanic
a. Completion of probation c. Not known
b. Discharge absconders d. TOTAL - Sum of lines 7a through 7c
8 • Offense type c. Discharge to custody, a.Felony
detainer, or warrant b. Misdemeanor
d.lncarceration with new sentence c. Other - Specify ~
a.lncarceration under current sentence d. Not known
f. Death a. TOTAL - Sum of lines 8a through 8d g. Other - Specify ~ 9. Probation status
a. Sus~ended execution of sentence
b.Suspended imposition of sentence
h. TOTAL - Sum of lines 3a through 3g c. Direct sentence to probation
4. Probation population on d. Other - Specify ~ Decamber 31,1985 »
(Note: This figure should equa/line 1 e. TOT AL- Sum of lines 9a through 9d plus line 2d minus 3h.J 10. Supervision status
• Note: The total number in items 4, 5c, 6g, 7d, 8e, ge, a.Active
and 1 Of should be identical. b.lnactive
Number
5.Sax c. Absconder
a.Male d. Supervised out of State
b. Female a. Other - Specify ~
f. TOTAL - Sum of lines 70a c. TOTAL - Sum of lines 5a and 5b through 10e
FORM CJ 8 (1 22 86) .. Page 3
38 Correctional Populations in the United States, 1985
11 . Coverage of reported data
Does your State have adult probationers other than those reported in this survey (e.g., probationers supervised by county probation authorities or inactive cases)?
DYes - Explain
ONo
12. Reporting period
Does the information reported in this survey represent the calendar year ending on December 31, 1985?
DYes Month Year
o No - Specify the ending date of your year • 13. Current Absconderu
a. Current absconders are -
o Inch,.Ided in your year end probation populations (items 1 and 4) o Terminated from probation (omitted from items 1 and 4) o Placed indefinitely on inactive status (included in items 1 and 4) o Placed indefinitely on inactive status (omitted from items 1 and 4) o Other - Describe
b.Of the absconders reported in item 10c, how many were changed to absconder status in 1985? 14. Data supplied by
Name Title Date Telephone Area code I Number I Extension
15. Remarks
Page 4 FORM CJ·a (1·22·06)
Probation in 1985 39
'-----~--~~-.-.. - .. ~~.-~~-"--.~ ... '
Setting • prIson
terms
Tables
4.1 Parole and sentencing characteristics of selected jurisdictions, January 1, 1985 42
4.2 Youthful offender status in 28 jurisdictions, January 1, 1985 43
4.3 Application of good-time to prison sentences, by State 44
4.4 Automatic and earned goodtime applied by correctional authorities, January 1, 1985 45-47
4.5 Statutory, administrative and court provisions to reduce prison crowding, January 1, 1985 48
Explanatory notes 49
Setting Prison Terms 41
T,able 4.1. PlU'()le I'M sentencing characteristics of selected jurisdictions, January 1, 1985
Jurisdictions Sentencing guidelines
JuriSdiction Year initiated With mandatory With parole
Florida Louisiana Maryland Massachusetts Minnesota New Jersey Ohio Pennsylvania Rhode Island Tennjlssee Utah WiSconsin
aFor offenders who have presumptive or determinate sentences.
~ororrenders with life In prison or indeterminate sentences.
42 Correctional Populations in the United States, 1985
Table 4.2. Youthful offender status in 28 jurlsdicdons, January 1, 1985
Alabama Judges may grant youthful offender status to persons under 21 years of age, based on the offenders' records and the gravity of their offenses. The maximum length of incarceration is 3 years; the maximum fine, $1,000. Court records are not public, and the trials have no jury.
Arkansas The Alternative Service Act of 1975 permits courts to sentence to supervision outside of prison those lirst offenders under 26 who have not committed capital crimes, rape, robbery, or murder. An offender may receive a suspended or probated sentence, II term not longer than 3 years In an alternative service program, or a sentence to the Department of Corrections with the stipulation of immediate parole or pardon. When the sentence or proba tion is completed, the record of the offense may be expunged. The 1971 Youthful Offender Act provides that first-time male offenders under 21 may be confined In a separate facility.
California The California Youth Author:ty has jurisdiction over all offenders under 25. Arter successful completion of parole an offender may petition the court to set aside the conviction. Adjudication of youthful offenders occurs In juvenile court under a separate children's code. Minors may be committed for less than 3 years to the Department of Institutions. In some circumstances minors may be prosecuted as adults and receive sentences to the Department of Corrections.
Colorado First offenders who are 16 or 17 years old may use the youthful offender plea.
Connecticut The sentence can be a fine of less than $1,000, imprisonment, conditional or unconditional discharge, community service, or a suspended sentence. With no more felony convictions before the offender reaches 21, the sealed records of the offense are erased.
District of Columbia The Federal Youthful Corrections Act was repealed. The D.C. youth Corrections Act had not taken effect at the time of the survey.
Florkla First-time defendants, 18 to 20 years old at the time of the offense, may be tried as youthful offenders for felonies that have maximum sentences less than life in prison. An offender may receive a probated or suspended sentence, incarceration for no more than 6 years, or placement in a community control program for no more than 2 years. Certain nonviolent first offenders under 25 and with maximum sentences under 10 years may be treated as youthful offenders. First offenders under 19 and with sentences more than 10 years but less than life may also be considered youthful offenders If they face mental or physical harm In an adult facility.
Georgia Offenders who are between 17 and 25 years old may be given youthful offender status which accords separate prison facilities and more program opportunities. Youthful offender records are not sealed unless the defendant Is a first offender.
Note: State legislatUres create youthful offender status through statutes that provide for special sentencing, commitment,
Hawaii First offenders between 16 and 21 years old may qualify for special terms of commitment: Class A, 8 years; Class B, 5 years; and Class C, 4 years •. Idaho The youth Rehabilitation Act provides that juvenile court waives jurisdiction for the following offenses: murder, robbery, rape, forcible sexual penetration with a foreign object, Infamous crimes against nature, mayhem, or assault and battery committed while attempting a crime just listed.
Maine Courts may give indeterminate sentences to offenders under 18; in some specific cases, usually severe, offenders younger than 21 receive indeterminate sentences.
Massachusetts In certain circumstances an offender under age 27 may recel're a reformatory or indeterminate sentence.
Michigan The Holmes. Youthful 'rralnee Act of 1967 provides that courts may assign offenders 17 to 21 years old to a minimum security facility of the Department of Corrections or to probation less than 4 years. Persons who have committed murder or major controlled substance offenses are not eligible. The youthful trainee status is not a conviction.
Nebraslca For those offenders under age 16 juvenile court has exclusive jurisdiction over misdemeanants and concurrent jurisdiction with district court over felons. For all offenders 16 and 17 years old both types of court have concurrent jurisdiction. Concurrent jurisdiction requires that cClunty a ttorneys decide in which court to file. Juvenile courts seal their records and provide a variety of alternatives to incarceration. Two State correction centers, one for each sex, imprison juvenile offenders.
New Hampshire Delinquent minors, 17 to 18 years old, may be sent to the House of Correction or jail for no longer time than adul'. offenders would receive for like offenses. Two limitations must be observed: the offenders cannot be incarcerated past their 19th birthday and they must be separated from adults. New Jersey Offenders under 26 who have never before served a state prison sentence may be committed to the youth correctional institution to serve indeterminate sentences. The sentences must not exceed 5 years or the maximum time that the law specifies for the. offense, whichever is shorter.
New Yoric Offenders between the ages of 16 and 19 at the time of the offense may have their convictions replaced by youthful offender adjudication. The sentence to an Indeterminate term may not exceed 4 years. Records are confidential and proceedings are private. Class A felons and armed robbers do not qualify for this adjudication.
North Carolina Legislation in 1983 permits judges to designa te certain offenders Committed Youthful Offender (CYO). If
or record sealing procedures for young adult offenders adjudicated In a criminal court, as opposed to a juvenile court. The offenders
misdemeanants, offenders must be under 25, and if Class H or A felons, offenders must be under 21. They may be sentenced to a 20-year maximum term with no minimum. They are im mediately eligible for parole with good-time or gain-time deducted from the maximum,
North Dakota Felonious offenders between the ages of 16 and 18 are treated as adults except that they are sentenced to the State Industrial School for Juveniles. If they pose behavior problems at the school, they may face a hearing and be transferred to the State penitentiary.
Ohio First offenders under age 30 may be committed as reformatory inmates who receive about 1096 more good-time than prison Inmates.
Oklahoma Nonviolent offenders under 22 may be sentenced to the Department of Corrections or to com munity corrections. If they are not arrested for other offenses during the parole period, they can petition to have their criminal record dismissed.
Pennsylvania The Camp Hill or Youthful Offenders Act provides that offenders who are 16 or 17 and certified as adults, or who are under 25 may be given maximum sentences without minimums. The sentences may be 6 years or the maximum prescribed for an offense, whichever is less. The inmates are eligible for parole at any time. The act was used to sentence about 100 offenders a year. Legislative repeal of the act was in progress in January 1985.
South C.arolina Offenders under 21 may be sentenced one time to special youthful offender treatment for not more than 6 years. With their consent offenders between 21 and 25 years old can also be sentenced as special youthful offenders.
South Dakota Offenders younger than 21 may be committed to the State Training School or a youth forestry camp.
Vermont Offenders 10 to 17 years old may be prosecuted as adults for serious felonies including murder, rape, aggravated assault, and robbery.
Virginia First offenders, 18 to 21 years old, or juveniles certified as adults may receive indeterminate senteMes no longer than 4 years. Before returning to society olfenders must pass tests that show that they are capable of being productive citizens. The Parole Board has the authority to release the offender at any time after rehabilitation.
West Virginia Offenders from 18 to 20 years old may be sentenced for certain crimes committed before their 21st birthday. The sentences to a special facility are from 6 months to 2 years long. At the end ot their terms the inmates return to sentencing court with recommendation of probation, release, or remand to an adult prison.
Federal The Federal youth Corrections Act was repealed, effective October 1984.
may be above the statutory age limit for juveniles but below a specified upper age limit.
Setting Prison Tenns 43
Table 4.3. Application of good-time to prison sentences, b!! State
Minimum sentences
Alabama Delaware Hawaii Idaho Kansas Kentucky Maryland Massachusetts Michigan MissiSSippi Missouri Montana Nebraska Nevada North Dakota Ohio Wisconsin
'r'/pes of sentences reduced by good-time
Maximum sentences
Alaska Arizona Arkansas Dlst. of Columbia Louisiana New Hampshire New York Oklahoma Oregon Rhode Island South Dakota Tennessee Texas Vermont Virginia West Virginia Federal system
Definite or determinate sentences
California Colorado Connecticut Florida Illinois Indiana Maine Minnesota New Mexico North Carolina Washington
£loth minimum and maximum sentences
Iowa New Jersey South Carolina Wyoming
Note: Georgia, PennS'Jlvanill, and Utah have no provisions for good-time reductions.
44 Correctional Populations in the Unite" Stptes, 1985
Table •••• Automatic and earned good-time applied by correctional authorities, January 1, 1985
Alabama
Automatic good-time For every 30 days in prison:
75 days for class 1 felonies 40 days for class 2 felonies 20 days for class 3 felonies Class 4 felonies not eligible
Earned good-time 30 days credit for each year for
blood donatio!'
A1anIcIla
Automatic good-time For every 30 days in prison:
10 days
Earned good-time None
Arizona
Automatic good-time For every 30 days in prison:
15 days for class 1 felonies 10 days for class 2 felonies
Earned good-time None
ArIamsas
Automatic good-time For evel'y 30 days in prison:
30 daya for class I felonies 20 days for class II felonies 8 days for class ill felonies Class IV felonies not eligible
Earned good-time None
Califomia
Automatic good-time None
Earned good-time Up to 1 year credit for heroism or
exceptional help in the maintenance of prison security
Up to half of sentence for program participation
Colotado
Automatic good-time For every 30 days in prison:
15 days
Earned good-time 30 days credit for eaClh 6 months for
meritorious conduct
Note: See the explanatory notes for a definition and discussion of good-time. Good-time may be applied differently depending on the offense, sentence length, time served, or criminal history of the prisoner. Earned good-time may be applied, when appropria te, after subtraction of automatic go()!j-time. Those States that credit automatic good-
Connecticut
Automatic good-time For every 30 days in prison:
10 days for sentences under 5 years 12 days for scntences of 5 years or
more
Earned good-time Up to 120 days deducted from term
for meritorious conduct 1 day credit for every 7 work days
Delaware
Automatic good-time For every 30 days in prison:
5 days during the first year 7 days during second year 9 days during third year 10 days during subsequent years
Earned good-time 5 days credit per month of work or,
with special permission, 1 day credit for every 2 days of work
5 days credit per month of program participation
Dtstrict of Columbia
Automatic good-time For every 30 days in prison:
5 days during the first year 6 days for second up to the third year 7 days for the th;rd up to the fifth
year 8 days for the firth up to the tenth
year 10 days for 10 years or more
Earned good-time Up to 3 days credit for each month
for meritorious conduct
Florldab
Automatic good-time For every 30 days in prison:
10 days for basic gain time
Earned good-time 1 to 60 days credit for each incident of
meritorious conduct Up to 20 days credit for each
month for incentive gain time
Georgiac
Automatic good-time None
Earned good-time None
Hawslld
Automatic good-time For every 30 days in prison:
10 days
Earned good-time None
Idaho
Automatic good-time For every 30 days in prison:
5 days during the fit'st year 6 days during second up to third year 7 days during the third up to fifth
year 8 days during the fifth up to the tenth 10 days for 10 years or more
Earned good-time 5 days credit for each month for
meritorious conduct
lllloots
Automatic good-time For every 30 days in prison:
30 days
Earned good-time Up to 90 days per sentence for
meritorious conduct
Indiana
Automatic good-time For every 30 days in prison:
30 days for class 1 felonies 15 days for class 2 felonies Class 3 felonies not eligible
Earned good-time None
Iowa
Automatic good-time For every 30 days in prison:
30 days
Earned good-time 5 days credIt for each month for
program participation
Kans.sse
Automatic good-time For every 30 days in prison:
10 days
Earned good-time Up to 90 days credit for each incident
of meritorious conduct
time according to classes of offenders do not observe the same categories for earned iood-time ul\less otherwise noted.
cGeorgia's earned good-time was repealed a? January 1, 1984.
Hawaii applies no good-time for persons under life sentences. Alaska may alternatively deduct up to 1/4
Qf the imposed sentence. "Florida calls good-time "gain-time," Inmates with mandatory sentences for firearm offenses receive no gain time until completion of the mandatory term.
Cj{ansas applies, in addition to 10 days of good-time a month, 1 month of good-time for each year in prison.
Setring Prison Tenns 45
Table 4.4 continued. Automatic and earned good-time, January 1, 1985
Kentucky
Automatic good-time For every 30 days in prison:
Up to 10 days
Earned good-time 5 days credit tor each month for
meritorious conduct
Louilllana
Automatic good-time For every 30 days in prison:
15 days
Earned good-time 1 day from maximum sentence for each
day of public work
Maine
Automatic good-time For every 30 days in prison:
10 days
Earned good-time For meritorious conduct up to 3 days
credit for each month in maximum security Inside prison and up to 5 days credit for each month In minimum security outside the prison
M/ll'yland
Automatic good-time FOl' every 30 days in prison:
5 days
Earned good-time 5 days credit for each month for
meritorious conduct, work, or program participa tion
Massachlllletts
Automatic good-time For every 30 days in prison:
o days for less than 4 months 2.5 days tor 4 months up to 1 year 5 days tor 1 year up to 2 7.5 days for 2 years up to 3 10 days for 3 years up to 4 12.5 days for 4 or more years
Earned good-time 5 days credit tor a pint of blood for those
In prison between 30 days and 1 year 10 days credit for a pint of blood for
those in prison a year or more 7.5 days credit for each month of
participation In work and education programs
2.5 days of credit per month of prison camp
Michigan
Automatic good-time For every 30 days in prison:
5 days during the first and second years
6 days during the third and fourth years
7 days during the fifth and sixth years 9 days during the seventh to ninth year 10 days during the tenth to fourteenth 12 days during fifteenth to nineteenth 15 days for 20 years or more
Earned good-time Up to 84 days credit for each year for
disciplinary credits (may lose 5 days a month for a major rule Infraction)
1 day credit for 4 days worked In public work camps
Minnesota
Automatic good-time For every 30 days in prison: 15 days
Earned good-time None
Millsissippi
Automatic good-time For every 30 days In prison:
30 days for class I felonies 20 days for class II felonies 8 days for class III felonies Class IV felonies not eligible
Earned good-time None
Missouri!
Automatic good-time For every 30 days In prison: 2.5 days
Earned good-time None
Montana
Automatic good-time For every 30 daysTn prison:
10 days for medium I felonies 13 days for medium II felonies 15 days for medium IT felonies (after
first year)
FArned good-time 13 days credit per month for education
progl'am participation Up to 3 days credit per month tor parti
cipation In self-improvement programs
Nebraska
Automatic good-time For every 30 days in prison;
5 days during first and second year 7.5 days during third year 10 days during subsequent years
Earned good-time Up to 5 days per month for performance
of duties
Nevada
Automatic gOOd-time For every 30 days in prison:
5 days during first and second year 10 days during third and fourth year 12.5 days during subsequent years
Earned good-time Discretionary amounts of cI'edit for
blood donation, meritorious conduct, and work
New Hampshire
Automatic good-time 150 disciplinary days added to each year
of the minimum sentence with goodtime credits being deducted from this disciplinary period; minimum sentence never reduced
Earned good-time Up to 12.5 days credit per month
deducted from the disciplinary period tha t is added to the minim urn sentence
Nelf Jerse~
Automatic good-time For every year in prison:
6 days durIng the first year 7 days durIng second year 8 days during third year Add 1 day per year for subsequent
years
Earned good-time 1 day credi t for 5 work days Up to 5 days credit for each month for a
minimum security prisoner or trustee
New Mexico
Automatic good-time None
Earned good-time Discretionary amount of credit up to 1
year for meritorious conduct 10 to 20 days per month for work Up to 5 days credit Cor each month of
program participation (prison industry inma tes ineligible)
New York
Automatic good-time Up to 1/3 maximum term
Earned good-time None
(Missouri excludes specific offense and parole violators.
gNew Jersey calculates automatic goodtime from the number of years that an
inmate has been In prison.
46 Correctional Populations in the United States, 1985
Table 4.4 continued. Automatic and earned good-time, January 1, 1985
North Carolina
Automatic good-time For every 30 days In prison:
30 days
Earned good-time DlScrebonary amounts of credit fOl'
work and meritorious conduct
North Dakota
Automatic good-time For every 30 days in prison,
6 days during up to 3 years 7 days during 3 years up to 5 8 deys during 5 years up to 10 10 days during 10 or more years
Earned good-time
Ohio
Discretionary credit given for ex(!eptional conduct
Automatic good-time For every 30 days in prison:
8 days for time in prison 12 days for time in reformatory
Earned good-time None
Oklaboma
Automatic good-time None
Earned good-time 20 days credit on maximum sentence for
each blood donation 1 day for each day of work or program
participation
Oregon
Automatic good-time For every 30 days in prison:
15 days
Earned good-time From 1 day good-time for 15 days of
participation up to 1 day for 5 days of participation in prison industry and education programs, depending on numbel' ot years spent In prison
io'l:Om 1 day for 10 worked in prioon agriculture up to 1 day for 6, depending on time in prison
PeMBylvania
Automatic good-time None
Earned good-time Governor's clemency or commutation
only
Rhode Island
Automatic good-time Varies according to years in prison
Earned good-time 10 days credit for each blood donation,
up to 4 dona tlons a year Discretionary amounts for meritorious
conduct
South Carolioah
Automatic good-time For every 3D clays in prison:
20 days
Earned gOOd-time Up to 1 day credit on minimum sentence
for 2 days worked with a maximum of 180 days a year
South Dakota
Automatic good-time For every 3D days in prison:
5 days during the first and second year 7.5 days during the third year 10 days during the fourth to ninth year 15 days during subsequent years
Earned good-time Governor's clemency or commutation for
exceptional behavior or falling health
Tennesseei
Automatic good-time 80% of sentence for mitigated category 70% of sentence for standard category 60% of sentence for aggravated category 60% of sentence for persistent ca tegory 50% of sentence for aggravated &.
persistent category
Earned good-time Up to 15 days per month for prison performance credits
Texas
Automatic good-time For every 30 days in prison:
20 days for class I felonies 10 days for class II felonies Class III felonies not eligible 40 days for trustee I, !I, III 45 days for trustee IV
Earned good-time 30 days credit for annual blood donation 5 to 15 days credit per month for
program participation
Utah
Automatic good-time None
Earned good-time Available only to misdemeanants
Vermont
Automatic good-time For every 30 days In prison:
10 days
Earned good-time 5 days credit for each month for
meritorious conduct
Vit'gInia
Automatic good-time For every 30 days in prison:
30 days for class I felonies 20 days for class II felonies 10 days for class III felonies Class IV felonies not eligible
Earned good-time Discretionary amount for extraordinary
service
Washington1
Automatic good-time Up to 1/3 of the sentence
Earned good-time Calculated with automatic good-time
west Virginia
Automatic good-time For every 30 days in prison
30 days
Earned good-time Discretionary amount for exceptional
work or service
Automatic good-time Up to 1/3 of sent.ence
Wyoming
Automatic good-time For every 30 days in prison:
10 days
Earned good-time 15 days credit for each month of
minimum sentence for meritorious conduct
Federal
Automatic good-time For every 30 days in prison:
o days during the first 6 months 5 days during seventh to twelfth month 6 days for 1 year &. 1 day up to 3 years 7 days for 3 years up to 5 years 8 days for 5 years up to 10 years 10 days fQr 10 or more years
Earned good-time Extra good-time: 3 days credit for
meritorious conduct and work for each month served during the first year; 5 days credit during the thirteenth month and above
lisouth Carolina deducts automatic goodtime from the maximum sentence and earned good-time from the minimum ~entence.
estimated dates. The time that a standard offender, for example, would expect to stay in prison would be 30% of his maximum sentence, unless he committed Infractions. JWashington may reduce up to 1/3 of a sentence. Of that gooo-time 2/3 is earned and cannot be lost as a result of
misbehavior; the remaining 1/3, which is automatically credited, can be taken away feor misconduct.
Wisconsin sets a mandatory release date at 2/3 of a sentence or 1 day for every 2 days in prison. A minimum of 1/4 of a sentence must be completed.
'Tennessee assigns inmates "release eligibility dates." Good-time credits cannot advance those dates; rule violations can result in pushing back the
Setting Prison Terms 47
Table 4.5. Statutory, administrative, and court provisloIlll to reduce prison crowding, January 1, 1985
Type of Details 'l'ype of Details provision State of provision provision State of provision
Emergency release Texas Advances trustees' releases up to
Alaska 'l'he Governor may condi tionally 30 days if the prison population exceeds 95% of facility capacity.
commute terms of nonviolent offenders who are within 4 months Early parole of release.
Arizona May release first offenders up to Alabama Applies supervised intensive restitution, a program that returns 180 days before completion of their prisoners to the community wlth-imposed terms. out the formality of parole deter-
Wisconsin When the Secretary of Health and mination (1983). Human Services rflcommends, Arizona First offenders, felony classes Wisconsin may release prisoners 4 through 5, may be released to who are within 135 days of their work furlough or parole. mandatory release date.
Iowa All except class A felons become Court orders eligible for parole if they are
within 9 months of release. West Virginia Was under court order, January 1,
Montana If prison exceeds design capacity 1985, to reduce crowding. for 30 days, Montana considers
Hawaii Was under a consent decree. paroling Inmates who stand within 120 days of parole eligibility.
Sentence rollbacks New Jersey May parole to Intensive supervision
Connecticut Advances by 90 days the releases of those nonviolent offenders who
prisoners with the oldest sentences have served 30 to 60 days. if a facility Is above 109% of No. Carolina The Secretary of Corrections may designa ted capacity for 30 days. direct the Parole Commission to
Florida If prlson population reaches 98% reduce crowding by releasing eligible inmates 6 months before of capacity, Florida advances their discharge dates (1983). releases of eligible Inma tes up to
30 days (1983). Ohio After the Governor declares a Georgia If the number of prisoners exceeds state of emergency, the Parole
capacity for 30 days, Georgill Board may grant ellrly paroles. IIdvances prisoners' releases 90 days So. Carolinll Selected prisoners may be released (1982). on furlough to supervision before
Iowa If fllcilities lire over capllcity 45 they parole eligibility. days, Iowa advances selected
Other methods prisoners' releases 90 days. Michigan Advances prisoners' relellse da tes Washington If the Governor declares a state of
90 days if the number of prisoners emergency because of prison exceeds prison capacity (1980). crowding, the Sentencing Guide-
Oklahoma Advances prisoners' release dates lines Commission and the Clem-ency Pardon Board convene to 60 days if the number of prisoners eCfect reductions. The Leglslll-exceeds prison capacity. ture has also specified early
So. Carolina Advances prisoners' release dates release procedures for selec ted up to 90 days if the popUlation Inmates to reach the target exceeds capacity for 30 days. percent oC capacity (1983).
Tennessee Advances prisoners' release dates up to 6 months (1983).
48 Correctional Populations ill the United States, 1985
. --Explanatory notes
In l'ecent years many jurisdictions have begun to modify their statutes and regulations governing sentences to prison and the means by which convicted offenders are discharged from their prison terms. Generally, such reforms have been designed to reduce the amount of discretion available to sentencing or release authorities, to promote a greater degree of uniformity and certainty in sentencing and release decisions, and to define punishment policies more clearly and explicitly.
This chapter provides data derived from a survey of chief judges, attorneys general, and paroling authorl-· ties In each State in January 1985. In general the survey obtained information on these reforms, specifically as they may relate to a prison sentence.
The five tables that summarize the findings of the survey reveal the following:
• Which States use sentencing and parole guldellnes--measures that can encourage greater uniformity in sentence and release decision making (table 4.1);
• Some of the special provisions available for differential handling of youthfUl offenders (table 4.2);
• Detailed information on how sentences are combined with incentive good-time systems to encourage inmate conformity with institutional rules and expectations for behavior (tables 4.3 and 4.4);
• Information on how prison crowding may affect the time that prisoners serve (table 4.5).
=tpg •
Earned and automatic good-time
Good-time Is defined as credits toward a sentence, which may be authorized in statute or regulation (automatic good-time) or allocated on the basis of specific activities or achievements, frequently on a discretionary basis (earned good-time). Good-time provides a system of incentives to assure inmate cooperation in managing the institution, to deter rule-violating behavior, and to encourage maximum participation in programs of work and education.
Laws and regulations vary as to whether good-time credits may be withheld at the time of a disciplinary action against future earnings or whether deductions are ninde from cumulative credits earned at that time. Generally, good-time is awarded on the basis of days served (for example, 10 days credit for 30 days served) or of days spent in a particular activity or program (such as 1 day credit for 5 days worked). Automatic or statutory good-time generally provides for specific rates of award as the duration of confinement increases; earned good-time usually reflects a greater degree of discretion in the size of the credit.
Earned good-time may be awarded for a variety of activities like:
• meritorious or exceptional conduct, for example, fighting forest fires or assisting a correctional officer;
/I program participation, for example, attending school or working in a prison Industry;
• institutional classification, for example, achieving minimum security or transfer to a camp or reformatory;
• situational factors, for example, donating blood or suffering ill health.
Setting Prlson Tenns 49
Tables
5.1 Prisoners under State or Federal jurisdiction, by sentence length, 1984 and 1985 52
5.2 Male prisoners under State or Federal jurisdiction, by sentence length, 1984 and 1985 53
5.3 Female prisoners under State or Federal jurisdiction, by sentence length, 1984 and 1985 54
5.4 Incarceration rates for pris-oners under State or Federal jurisdiction or in State or Federal custody, by sentence length, 1985 55
5.5 Prisoners housed in jails because of overcrowded State facilities, by sex, 1984 and 1985 56
5.6 Prisoners under State or Federal jurisdiction, by race, 1985 57
5.7 Male prisoners under State or Federal jurisdiction, by race, 1985 58
5.8 Female prisoners under State or Federal jurisdiction, by race, 1985 59
5.9 Prisoners l nder jurisdiction of State or Federal correctional authorities, by sex and Hispanic origin, 1985 60
5.10a Sentenced prisoners admitted to State or Federal jurisdiction, by type of admission, 1985 61
5.10b Sentenced prisoners released from State or Federal jurisdiction, by type of release, 1985 62
5.11a Sentenced male prisoners admitted to State or Federal jurisdiction, by type of admission, 1985 63
5.11b Sentenced male prisoners released from State or Federal jurisdiction, by type of release, 1985 64
5.12a Sentenced female prisoners admitted to State or Federal jurisdiction, by type of admission, 1985 65
5.12b Sentenced femaie prisoners released from State or Federal jurisdiction, by type of release, 1985 66
a.~
Prisoners in 1985
5.13 Sentenced prisoners released conditionally or unconditionally from State or Federal jurisdiction, by type of release, 1985 67
5.14 Sentenced male prisoners released conditionally or unconditionally from State or Federal jurisdiction, by type of release, 1985 68
5.15 Sentenced female prisoners released conditionally or unconditionally from State or Federal jurisdiction, by type of release, 1985 69
5.16 Sentenced prisoners admitted to State or Federal jurisdiction for violation of parole or other conditional release, by sex and status of sentence, 1985 70
5.17 Deaths among senter!ced prisoners under State or Federal jurisdiction, by sex and cause of death, 1985 71
5.18 Prisoners in custody of State or Federal correctional authorities, by sentence length, 1984 and 1985 72
5.19 Male prisoners in custody of State or Federal correctional authorities, by sentence length, 1984 and 1985 73
5.20 Female prisoners in custody of State or Federal correctional authorities, by sentence length, 1984 and 1985 74
Exp~natory notes by jurisdiction 75
Questionnaire 82
Prisoners in 1985 51
Table 5.1. Prisonel'l! under state or Federal jurisdiction, by sentence ler.gth, 1984 and 1985
Maximum sentence length Year or less/unsentenced
Total More than a :lear Total Year or less Unsentenced
Note: See the questionnaire for category more; the explanatory notes may provide brigures inClude both jail and prison inmates; definitions and the explanatory notes for further detail. bails and prisons are combined in one system. State-by-State variations from definitions. ~. Not applicable. The yearend total of prisoners sentenced All dllta for Arizona, Californil'l, the District , Not reported. to more than 1 year in Ohio includes 1,582 men of ColUmbia, Florida, Georgia, Indiana, Iowa, Counts of inmates by sentence length may be ~nd 181 women with sentences of a year or less. Massachusetts, Michigan, Texas, and West slightly incorrect. See "Sentencin~ infor- Bureau of Justice Statistics has estimated all Virginia are custody, rather than jurisdiction mation ll for the relevant jurisdictions in the Idaho fi~ures from monthly prison reports of the counts, Most, but not all States, reserve explanatory notes. Idaho Department of Corrections. prison for offenders sentenced to a year or
52 Correctional Populations in the United States, 1985
------------_ .. _---
Table 5.2. Male prisoners under State or Federal jurisdiction, by sentence length, 1984 and 1985
Maximum sentence length Year or less/unsentenced
Total More than a :lear Total Year or less Unsentenced Per- Per- Per-
Regions and cent cent cent jurisdictions 12/31/85 12/31/84 change 12/31/85 12/31/84 change 12/31/85 12/31/84 change 12/31/85 12/31/84 12/31/85 12/31/84
U.s. total 479,277 441,208 8.6% 458,972 424,193 8.2% 20,305 17,015 19.3% 10,463 9,339 9,842 7,676
Note: See the questionnaire for category more; the explanatory notes may provide jalls and prisons are combined in one system. definitions and the eXDlanatory notes for further detail. <l<rhe yearend total of prisoners sentenced to State-by-8tate variations from definitions. _. Not applicable. more than 1 year In Ohio includes 1,582 men All datil for Arizona, California, the District 'Jurisdiction did not report category. W,1d 181 women with sentences of a year or less. of Columbia, Florida, Georgia, Indiana, IOWa, Counts of inmates by sentence length may be Hawaii, Maryland, and Oklahoma estimate the Massachusetts, Michigan, Texas, and West slightly incorrect. See "Sentencing Infor- number of women and men. Virginia are custody, rather than jurisdiction mation" for the relevant jurisdictions In the "Bureau of Justice Statistics has estimated all counts. Most, but not all StateR, reserve ~Planatory notes. Idaho figures from monthly prison reports of the prIson for offenders sentenced to a year or iQ"res Include both jail and prison Inmatesl Idaho Department of Correotlons.
Prisoners in 1985 53
Table 5.3. FemllIe prisoners under State or Federal jurisdiction, by sentence lengtb, 1984 and 1985
Maximum sentence length Year or less/unsentenced
Total More than a :tear Total Year or less Unsentenced Per- Per- Per-
Regions and cent cent cent 12/31/84 jurisdictions 12,'31/85 12/31/84 change 12/31/85 12/31/84 change 12/31/85 12{31/84 change 12/31/85 12/31/84 12/31/85
U.s. total 23,099 20,';'94 11.1% 21,296 19,205 10.9% 1,803 1,589 13.5% 966 985 837 604
Note: See the questionnaire for category morel the explanatory notes may provide jails and prisons are combined in one system. definitions and the explanatory' notes for further detail. ~he yearend total of prisoners Gentenced to State-by-State variations from definitions. ... Not applicable. more than 1 year in Ohio includes 1,582 men All data for Arizona, California, the District / Jurisdiction did not report category. ~nd 181 women wlth sentences of a year or less. of Columbia, Florida, Georgia, Indiana, Iowa, acounts of inmates by sentence length may be Hawall, Me.ryland, and Oklahoma estimate the Massachusetts, Michigan, Texas, and West slightly incorrect. See "Sentencin,~; In for- number of women and men. Virginia are custody, rather than jurisdiction mation" fOr the relevant jurisdictions in the Elaureau of Justice Statistics has estimated all counts. Most, but not all States, reserve Iixplanatory notes. Idaho figures from monthly prison reports of the prison for offenders sentenced to a year or Figures include both jail and prison inmates; Idaho Department of Corrections.
54 Correctional Populations in the United States, 1985
Table 5.4. Inoorceration rates for prisoners under State or Federal jurisdiction or in State or Federal custody, by sentence length, 1985
Number of Erlsoners Eer 1001°00 resident EOEulation
Sentenced with sentence Unsentenced or with
Regions and Total number of erisoners
Under Federal or 10 Federal or length of more than 1 :tear sentences of a :lear or less
Under Federal or In Federal or Under Federal or In Federal or jUrisdictions State jurisdiction State custody State jurisdiction Sta te custody State jurisdiction S ta te custody
U.s. total 209 203 200 194 9 9 Federala 17 15 14 12 3 3 State 193 188 187 182 6 7
Note: See the questionnaire for category sentenced to a year or more; the explana tory jails and prisons are combined in one system. defhitions and the explanatorY notes for notes may provide fUrther detail. '1'he yearend jurisdiction total of prisoners State-by-State variations from definitions. _. Not applicable. sentenced to more than 1 year in Ohio Includes All data for Arizona, California, the J Jurisdiction did not report category. 1,582 men and 181 women with sentences of a District of Columbia, Florida, Georgia, aCounts of Inmates by sentence length may be iiear or less. Indiana, Iowa, Massachusetts, Michigan, slightly incorrect. See "Sentencing Informa- Bureau of Justice Statistics has estimated all Texas, and West Virginia are custody, rather tlon" for the relevant jurisdictions in the Idaho figures from monthly prison reports of than jurisdiction counts. Most, but not all fiflanatory notes. the Idaho Department of Corrections. States, reserve prison for offenders igures inclUde both jail and prison inmates;
Prisoners in 1985 55
'J,'dble 5.5. Prisoners housed in jails because of overcrowded state facilities, by sex, 1984 and 1985
Note: See the questionnaire for category inmates In jails in their jurisdiction counts; definitions and the explanatory notes for however, the percent of jurisdiction popu-State-by-state variations from definitions. lation was calculated for all persons serving Unlisted jurisdictions either had combined sentences to prison, whether in prison or in jail-prison systems or did not report prisoners jail. held in local jails. Arkansas, Colorado, New Jersey, and Tennessee did not include the
/ Jurisdiction did not report category.
56 Con·eetional PopUlations in the United States, 1985
Table 5.S. Prisoners under State or Federal jurisdiction, by race, 1985
Number of erisoners American
Prisoner Indian or Asian or Regions and population Alaskan Pacific Not jurisdic tions 12/31/85 White Black native .Islander known
U.S. total 502,376 260,847 227,137 4,790 1,904 7,698
Federal 40,223 26,123 13,066 710 324 ° State 462,153 234,724 214,071 4,080 1,580 7,698
Northeast 75,706 35,582 38,036 96 110 1,882
Connecticuta 6,149 2,210 2,765 5 7 1,162 Maine 1,226 1,193 15 18 ° ° Massachusetts 5,390 3,527 1,849 9 5 ° New Hampshire 683 669 14 ° ° ° New Jersey 11,335 3,841 7,483 ° ° 11
Note: See the questionnaire for category bThe jurisdiction estimates racial group definitinns and the explana tory notes for membership of population. See relevant State-by-8tate variations from definitions. iurJsdictions in the explanatory notes. All data for Arizona, California, the District 'rennessee and Virginia categorize persons of Columbia, Florida, Georgia, Indiana, Iowa, whose race Is neither black nor white as ~' >«sachusetts, Michigan, Texas, and West "Other," here reported as "Not known." VirgInia are custody, rather than jurisdiction dTexas l'eports only two racial categories: counts. white and non white. ,Jurisdiction did not report category. CSureau of Justice Statistics has estimated
Figures include both jail and prison inmates; all Idaho figures from monthly prison reports jails and prisons are combined in one system. of the Idaho Department of Corrections.
Prisoners in 1985 57
Table 5.'1. Male prisoners under State or Federal jurisdiction, by race, 1935
Number of male !2risoners American
Prisoner Indian or Asian or Regions and population Alaskan Pacific Not jurisdictions 12/31/85 White Black native Islander known
U.s. total 479,277 249,418 216,344 4,480 1,800 7,235
Federal 37,819 24,771 12,064 681 303 0 State 441,458 224,647 204,280 3,799 1,497 7,235
Northeast 73,022 34,353 36,675 92 110 1,792
ConnecticutS 5,826 2,094 2,620 4 7 1,101 Maine 1,194 1,161 15 18 0 0 Massachusetts 5,079 3,326 1,740 8 5 0 New Hampshire 665 654 11 0 0 0 New Jersey 10,947 3,709 7,238 0 0 0
Note: See the questionnaire for category membership of population. See relevant definitions and the explanatory notes for ~risdictions in the explanatory notes. State-by-8tate variations from definitions. Hawaii, Maryland, and Oklahoma estimate All data for Arizona, California, the District ~e number of male and female prisoners. of Columbia, Florida, Georgia, Indiana, Iowa, ennessee and Virginia categorize persons Massachusetts, Michigan, Texas, and West whose race is neither black nor white as Virginia are custody, rather than jurisdiction "Other," here reported as "Not known." counts. eTexas reports only two racial ca tegories: , Jurisdiction did not report category. r,hlte and non white.
Figures Include both jail and prison inmates; Bureau of Justice Statistics has estimated ~lS and prisons are combined in one system. all Idaho figures from monthly prison reports
he jurisdiotion estimates racial group of the Idaho Department of Corrections.
58 Correctional Populations in the United States, 1985
Table 5.8. Female prisoners under State or Federal jurisdiction, by race, 1985
Number of female erison",,':; Amerioan
Prisoner Indian or Asian or Regions and population Alaskan Pacific Not jurisdictions 12/31/85 White Black native lslander known
Note: See the qUestionnaire for category membership of population. See relevant definitions and the explanatory notes for turlsdictions in the explanatory notes. State-by-State variations from definitions. Hawaii, Maryland, and Oklahoma estimate All data for Arizona, California, the District ~ number of male and female prisoners. of Columbia, Florida, Georgia, Indiana, Iowa, ennessee and Virginia categorize persons Massachusetts, Michigan, Texas, and West whose race is neither black nor white as Virginia are custody, rather than jurisdiction "Other," here reported as "Not known." counts. e.rexas reports only two racial categories: / Jurisdiction did not report category. r,hite and non white. 8FIgures include both jail and prison inmates; Bureau of Justice Statistics has estimated l:;IS and prisons are combined in one system.
he jurisdiction estimates racial group all Idaho figures from monthly prison reports of the Idaho Department of Corrections.
Prisoners in 1985 59
, ,
Table 5.9 Prisoners under jurisdiction of State or Federal correctional authorities, by sex and Hispanic origin, 1985
Number of [2risoners Total Male Female
l'rlsoner Non- Non- Non-Regions and population Hls- His- Not His- His- Not His- His- Not jurisdictions 12/31/85 panic panic known Total panic panic known Total panic panic known
U.s. total 502,376 54,672 292,394 155,310 479,277 52,460 278,556 148,261 23,099 2,212 13,838 7,049
Note: See the questionnaire for category SFigures inclUde both iail and prison inmates; Mexican Americans as Hispanic prisoners and de finition~ and the explanatory notes for ~ails and prisons are combined in one system. reported other Hispanic inmates to be non-State-by-5tate variations from definitions_ Arkansas, Colorado, Hawaii, Indiana, and Hispanic. Ohio reported only on Hispanic All data for California, the District of Montana estimated the number of Hispanic srisoners in custody. ColUmbia, Florida, Georgia, Indiana, Iowa, prisoners. Hawaii, Maryland, and Oklahoma Bureau of Justice Statistics has estimated Massachusetts, Michigan, Texas, and West estimated the number of male and female all Idaho figures fl-om monthly prison reports Virginia are custody, rather than jurisdiction grisoners. of the Idaho Department of Corrections. counts. Callfornia and Michigan categorized only
60 Correctional Populations in the United States, 1985
~"---------------------------~.----
Table 5.10a. Sentenced prisoners admitted to state or Federal jurisdiction, by type of admission, 1985
Number of sentenced I2risoners admitted during 1985 Parole or other con-
New ditional Returns Transfers Prisoner court release Escapees from from other
Regions and population commit- violators and AWOLS appeal jurls- Other jurisdictions 12/31/84 Total ments returned returned or bond dictions admissions
U.s. total 443,398 271,366 198,499 58,694 8,305 362 4,547 959
Note: See the questionnaire for category , Jurisdiction did not report ca tegory. drhe yearend total' of prisoners sentenced definitions and the explanatory notes for Counts of inmates by sentence iength may to more than 1 year in Ohio includes 1,582 State-by-State variations from definitions. be slightly incorrect. See "Sentencing infor- men and 181 women with sentences of a year All data for Arizona, California, the District mation" under the relevant jUrisdictions in or less. of Columbia, Florida, Georgia, Indiana, Iowa, tha explana tory notes. eBureau of Justice Statistics has estimated Massachusetts, Michigan, Texas, and West bFigures include both jail and prison inmates) all Idaho figures from monthly prison reports Virginia are custody, rather than jurisdiction tails and prisons are combined in one system. of the Idaho Department of Corrections. counts. Hawaii, Maryland, and Massachusetts ••• Not applicable. estimate for admission categories •
Prisoners ill 1985 61
Table 5.10b. Sentenced prisoners released (rom state or Federal jurisdiction, by we of release, 1985
Number of sentenced I2rlsoners released during: 1985 Transfers
Condi- Uncondl- Escapes Out on to other Prisoner Regions and tional tional and appeal juris- Other population jurisdictions Total releases releases AWOLs 01' bond dictions Deaths releases 12/31/85
U.s. total 234,496 174,916 41,915 9,578 542 4,433 1,175 1,937 480,268
Note; See the qUestionnaire for category 'JUrisdiction did not report category. estimate the numbers for release categories. definitions and the explanatory notes for Counts of inmates by sentence length ~he yearend total of prisoners sentenced State-by-State variations from defini- may be slightly Incorrect. See "Sen- to more than 1 year In Ohio includes 1,582 tions. All data for Arizona, California, teneing information" under the relevant men and 181 women with sentences of a the District of ColUmbia, Florida, ~urisdictions in the eXplanatory notes. ~ar or less. Georgia, Indiana, Iowa, Massachusetts, Figures include both jail and prison ureau of Justice Statistics has esti-Michigan, Texas, and West Virginia are inmates; jails and pl'lsons are combined in mated all Idaho figures from monthly custody, rather than jurisdiction cOlintS. one system, prison reports of the Idaho Department ••• Not applicable. cHawail, Maryland, and Massachusetts of Corrections.
62 Con'ectional Populations in the United States, 1985
Table S.l1a. Sentenced male prisoners admitted to State or Federal jurisdiction, by type or admission, 1985
Number of male ~risoners admitted during: 1985 Parole or other con-
Number New ditional Escapees Returns of male court release and from Transfers
Regions and prisoners commit- violators AWOLS appeal from other other jurisdictions 12/31/84 Total ments returned returned or bond jurisdictions admissions
U.s. total 424,193 253,821 184,594 55,996 7,779 336 4,280 8:16
Note: See the questionnaire for category aCounts of inmates sentenced to more gories. Hawaii, Marylalld, and Oklahoma definitions and the explana tory notes for than 1 year may include some sentenced to ~timate the number of women and men. State-by-State variations from defini- a year or less. See "Sentencing informa- he yearend total of prisoners sentenced tions. All data for Arizolll1, California, the tlon'! under the relevant jurisdictions in the to more than 1 year in Ohio includes 1,582 District of ColumbIa, Florida, Georgia, sxplanatory notes. men and 181 women with sentences of a Indiana, IOWa, MlIssschusetts, Michigan, Figures include both jail and prison ~ar or less. Texas, and West Virginia are custody, inmates; jails and prisons are combined in Ureau of Justice Statistics has estl-rather than jUrisdiction counts. one system. mated all Idaho figures from monthly ••• Not applicable. cHawaif, Maryland, and Massachusetts prison reports of the Idaho Department of I Jurisdiction did not report category. estimate the numbers in admission cate- Correc tions.
Prisoners in 1985 63
Table 5.11b. sentenced male prisoners released from State or Federal jurisdiction, by type of release, 1985
Number of male I2l'1soners released during: 1985 Transfers Number
Condi- Uncondi- Escapes Out on to other of male Regions and tiona I tional and appeal juris- Other prisoners jurisdictions Total releases releases AWOLs or bond dictions Deaths releases 12/31/85
U.s. total 219,042 163,486 39,158 8,968 509 4,137 1,148 1,636 458,972
Note: See the questlrmnaire for category / Jurisdiction did not report category. Maryland, and Oklahoma estimate the definitions and the explanatory notes for aCounts of inmates sentenced to more than 1 ~mber of women and men. State-by-State variations from definitions. year may include some sentenced to a year or he yearend total of prisoners sentenced All data for Arizona, California, the District less. See "Sentencing informa tkm" under the to more than 1 year in Ohio includes 1,582 of ColUmbia, Florida, Georgia, Indiana, Iowa, ~evant jurisdictions in the explanatory notes. men and 181 women with sentences of a year Massachusetts, Michigan, Texas, and West igures include both jail and prison inmates; or less. Virginia are custody, rather than jurisdiction ~ails and prisons are combined in one system. Ilaureau of Justice Sta tis tics has estimated counts. Hawaii, Maryland, and Massachusetts estimate all Idaho figures from monthly prison reports ... Not applicable. the numbers in release categories. Hawall, of the Idaho Department of Corrections.
64 Correctional Populations in the United States, 1985
Table 5.12a. Sentenced female prisoners admitted to State or Federal jurisdiction, by type of admission, 1985
Number of female Erisoners admitted during: 1985 Parole or othel' con-
Number of New ditional Escapees Retul'ns Transfers female court release and from from other
RegfCJils and prisoners commlt- violators AWOLS appeal juris- Othel' jurlsdietions 12/31/84 Total ments returned r~~llrned or bond dictions admissions
U.s. total 19,205 17 ,545 13,905 2,698 526 26 267 123
Note: See the questionnaire for category 8Counts of Inmates sentenced to more than 1 categories. Hawaii, Maryland, and Oklahoma definitions and the explanatory notes for year may inclUde some inmates sentenced to 8 ~tlmate the number of women and men. State-by-Btate variations from definitions. year or less. See "Sentencing information" he yearend totai of prisoners sentenced to All data for Arizona, California, the District under the relevant jUrisdictions in the more than 1 year in OhIo includes 1,582 men of Columbia, Florida, Georgia, Indiana, Iowa, RFPlanatory notes. and 181 women with sentences of a year or Massachusetts, Michigan, Texas, and West igures include both jail and prison Inmates; less. Virginia are custody, rather than jurisdiction ~ails and prisons are combined In one system. Gaureau of Justice Statistics has estimated counts. Hawaii, Maryland, and Massachusetts estimate all Idaho figures from monthly prison reports ... Not applicable. the nUmbers in admission and release of the Idaho Department of Corrections. I Jurisdiction did not report category.
Prisoners in 1985 6S
Table 5.12b. Se!ltenced female prisonern released rrom State 01' Federal jurisdiction, by type or release, 1985
Number of female I2risoners released during: 1985 Number Condi- Uncondi- Escapes Out on Transfers o( female
Regions and tional tiona I and appeal to other Other prisoners jurisdic tions Total releases releases AWOLs or bond jurisdictions Deaths releases 12/31/85
U.s. total 15,454 11,430 2,757 610 33 296 27 301 21,296
Note: See thE: questionnaire for category "counts of inmates sentenced to more than categories. HawaII, Maryland, and Oklahoma definitions and the e"1>lanatory notes for 1 year may include some inmates ~:entenced to ~t1mate the number of women and men. State-by-State variations from definitions. a year or less. See "Sentencing information" he yearend total of prisoners sentence<;l to All data for Arizona, California, the District under the relevant jurisdictions in the explan- more than 1 year in Ohio includes 1,582 men of Columbia, Florida, Georgia, Indiana, Iowa, ~ory notes and 181 women with sentences of a year or Massachusetts, Michigan, TeKas, and West igures include both jail and prison inmates; less. Virginia are custody, rather than jurisdiction ~alls and prisons are combined in one system. ~ureau of Justice Sta tistics has estimated counts. Hawaii, Maryland, and Massachusetts esti- ali Idaho figures from monthly prison reports ••• Not applicable. mate the numbers in admission and release of the Idahu Department of Corrections. I JUrisdiction did not report category.
66 Con'ectional Populations in the United States, 1985
Table 5.13. Sentenced prisoners released conditionally or unconditionally from State or Federal jurisdiction, by type of release, 1985
Number of I2risoners released conditionall:z: Supervised
Number of I2risuners released unconditionall:z:
Regions and Pro- mandatory Expiration Commu-jurisdictions Total Parole bation release Other Total of sentence tation Other
U.s. total 174,916 93,905 9,319 65,763 6,052 41,915 38,458 8!l9 2,568
Note: See the questionnaire for category , Jurisdiction did not report category. ~tCgories. definitions and the explanatory notes for Counts of inmates sentenced to more than 1 he yearend total of prisoners sentenced to State-{)y-State variations frum definitions. year may include some sentenced to a year or more than 1 year in Ohio includes 1,582 men All data for Arizona, California, the District less. See "Sentencing information" under the and t81 women with sentences of a year or of ColUmbia, Florida, Georgia, Indiana, Iowa, belevant jurisdictions in the explanatory notes. less. Massachusetts, Michigan, Texas, and West Figures include both jail and prison inmates; eBureau of Justice Statistics hs.s estimated Virginia are custody, rather than jurisdiction tails and prisons are combined in one system. all Idaho figures from monthly prison reports counts. Hawaii, Maryland, and Massachusetts estimate of the Idaho Department of Corrections. ... Not applicable. the numbers in admission and release
Prisoners in 1985 67
Table 5.14. Sentenced male prisonefS released conditionally or unconditionally from state or Federal jurisdiction, by type of release, 1985
Number of male I2risoners released conditionall:t Number of male prisoners Supervised released unconditionall:t
Regions and Pro- mandatory Expiration Commu-jurisdictions Total Parole bation rel"ase Other Total of sentence tation Other
U.s. total 163,486 87,619 8,575 61,752 5,540 39,158 35,991 821 2,346
Federala 8,027 5,302 I 2,725 0 3,895 3,713 2 180 state 155,459 82,317 8,575 59,027 5,540 25,263 32,278 819 2,166
Note: See the questionnaire for category / Jurisdiction did not report category. categories. Hawaii, Maryland, and Oklahoma definitions and the explanatory notes for 8Counts of inmates sentenced to more than 1 ~tjmate the number of women and men. state-by-State variations from definitions. year may Include some sentenced to a year or he yearend total of prisoners sentenced to All data for Arizona, California, the District less. See "Sentencing informa tion" under the more than 1 year in Ohio Includes 1,582 men of Columbia, Florid!l, Georgia, Indiana, Iowa, ~evant jurisdictions in the explanatory notes. and 181 women with sentences of a year or Massachusetts, Michigan, Texas, and West igures inclUde both jail and prison inmates; less. VirgInia are custody, rather than jurisdiction ~ails and prisons are combined in one system. 6aureau of Justice Sta tistics has estimated counts. Hawaii, Maryland, and Massachusetts esti- all Idaho figures from monthly prison reports ••• Not applicable. mate the numbers in admission and release of the Idaho Department of Corrections.
68 Correctional Populations in the United States, 198:"
'l'able 5.15. Sentenced female prisoners released conditionally or unconditionally from State or Federal jurisdiction, by type of release, 1985
Number of female I2risoners released conditionall:i Number' of female prisoners Supervised released unconditionall:i
Regions and Pro- mandatory Expiration Commu-jurisdictions Total Parole bation release Other Total of sentence tation Other
U.s. total 11,430 6,286 621 4,011 512 2,757 2,467 68 222
Note: See the questionnaire for category I Jurisdiction did not report category. categories. Hawaii, Maryland, and Oklahoma definitions and the explanatory notes for sCounts of inmates sentenced to more than 1 ~timate the number of women and men. St'lte-by-5tate variations from definitions. year may include some sentenced to a year or he yearend total of prisoners sentenced to All data for Arizona, California, the District less. See "Sentencing informa tion" under the more than 1 year in Ohio includes 1,582 men of Columbia, Florida, Georgia, Indiana, Iowa, belevant jurisdictions in the explana tory notes. and 181 women with sentences of a year or ~!assachusetts, Michigan, Texas, and West Figures include both jail and prison Inmates; less. Virginia are custody, rather than jurisdiction balls and prisons are combined in one system. eBureau of Justice Statistics has estimated counts. Hawaii, Maryland, and Massachusetts esti- all Idaho figures from monthly prison reports ... Not applicable. mate the numbers in admission and release of the Idaho Department of Corrections •
Prisoners in 1985 69
Table 5.16. Sentenced prisoners admitted to State or Federal jurisdiction for violation ot parole or other conditional release, by sex and status of sentence, 1985
Parole viola tors Other conditional release violators Regions and New sentence No new sentence New sentence No new sentence jurisdictions Total Total Male Female Male Female Total Male Female Male Female
Note: See the questionnaire, for category 6Counts of inmates sentenced to more than 1 sentence. See "Category estimates" for the definitions and the explanatory notes, for year may include some sentenced to a year or rtievnnt jurisdiction in the explanatory note? State-by-State variations from definitions. less. See "Sentencing information" under the he yearend total of prisoners sentenced to All data fOr Arizona, California, the District relevant jurisdictions in the explanatory more than 1 year in Ohio includes 1,582 men of Columbia, Florida, Georgia, Indiann, Iowa, Botes. and 181 women with sentences of a year or MassachUsetts, Michigan, Texas, and West Figures inclUde both jail nnd prison inmates; less. Virginia are Ilustody, rather than jurisdiction ~ails nnd prisons are combined in one system. €aureau of Justice Statistics has estimated counts. The jurisdiction estimates the number of aU Idaho figures from monthly prison reports / Jurisdiction did not report category. inmates for admissions, sex, or status of of the Idaho Department of Corrections.
70 Correctional Populations in the United States, 1985
-------------~----
Table 5.17. Deaths among sentenced prisoners under state or Federal jurisdiction, by sex and cause or death, 1985
Number of deaths among sentenced ~risoners
Illness or Caused Unspec-natural Accidental by ified
Regions and Total cause Suicide self-injur~ Execution another cause jUrisdictions Total Male Female Total Male Female Total Male Female Total Male Female Male Maie Maie
U.S. total 1,175 1,148 27 731 708 23 112 109 3 33 32 1 18 105 176
Note: See the questionnaire for category custody, rather than jurisdiction, counts. aFlgures include both jail and prison definitions and the explanatory notes for Most, but not all States, reserve prison for Inmates; jailS and prisons are combined in State-by-state variations from definl- offehders sentenced to a year or more; the ~e system. tions. All data for Arizona, California, explana tory notes may provide further ureau of Justice Statistics has estimated the District of Columbia, Florida, detail. all Idaho figures from monthly prison Georgia, Indiana, Iowa, Massachusetts, ••• Not applicable. reports of the Idaho Department of Michigan, Texas, and West Virginia are I Jurisdiction did not report detail. Corrections.
Prisoners in 1985 71
Table 5.18. Prisoners in custody ot State or Federal correctional authorities, by sentence length, 1984 and 1985
Maximum sentence length Year or less7unsentenced
Total More than a ;tear Total Year or less Unsentenced Per- Per- Per-
Regions and cent cent cent jurisdictions 12/31/85 12/31/84 change 12/31/85 12/31/84 change 12/31/85 12/31/84 change 12/31/85 12/31/84 12/31/85 12/31/84
U.s. total 487,359 448,264 8.7% 464,804 429,050 8.3% 22,555 19,214 17.4% 11,411 10,520 11,144 8,694
Note: See the questionnaire for category prison for offenders sentenced to a year or maHon" for the relevant jUrisdictions in the definitions and the explanatory notes for more; the explanatory notes may provide ~Planatory notes. State-by-Btate variations from definitions. further details. igures include both jail and prison inmates; All data for Arizona, California, the District _. Not applicable. jails and prisons are combined in one system. of Columbia, Florida, Georgia, IndiaM, IOWa, / Jurisdiction did not report category. cBureau of Justice Statistics has estimated all Massachusetts, Michigan, Texas, and West aCounts of inmates by sentence length may ldaho figures from monthly prison reports of the Virginia are custody, rather than jurisdictiQn be slightly incorrect. See "Sentencing infor- Idaho Department of Corrections. counts. Most, but not all States, reserve
72 Correctional Populations in the United States, 1985
Table 5.19. Male prisoners in custody of State or Federal correctional authorities, by sentence length, 1984 and 1985
Maximum sentence length Year or less/unsentenced
Total More than a :lear Total Year or less Unsentenced Pel'- Per- Per-
Regions and cent cent cent jurisdictions 12/31/85 12/31/84 change 12/31/85 12/31/84 change 12/31/85 12/31/84 change 12/31/85 12/31/84 12/31/85 12/31/84
U.s. total 465,283 428,491 8.6% 444,658 410,974 8.2% 20,625 17,517 17.7% 10,376 9,478 10,249 8,039
Note: See the questionnaire for category more; the explanatory notes may provide ~IS and prisons are combined in one system. definitions and the explanatory notes for further detail. he yearend total of prisoners sentenced to State-by-state variations from definitions. _. Not applicable. more than 1 year in Ohio includes 1,582 men All data for Arizona, California, the District 'Jurisdiction did not report category. and 181 women with sentences of a year or less. of Columbia, Florida, Georgia, Indiana, Iowa, Counts of inmates by sentence length may Hawaii, Maryland, and Oklahoma estimate the Massachusetts, Michigan, Texas, and West be slightly Incorrect. See "Sentencing info\'- number of women and men. Virginia are custody, rather than jurisdiction mation" for the relevant jurisdictions In the eaureau of Justice Statistics has estimated all counts. Most, but not all States, reserve gxplana tory notes. Idaho figures from monthly prison reports of prison for offenders sentenced to a year or Figures include both jail and prison inma tes; the Idaho Department of Corrections.
Prisoners in 1985 73
Table 5.20. Female prisoners in custody or, state or Federal correctional authorities, by sentenee length, 1984 and 1985
Maximum sentence length Year or lessiunsentenced
Total More than a :lear Total Year or less Unsentenced Per- Pel'- Per-
Regions and cent cent cent jurisdictions 12/31/85 12/31/84 change 12/31/85 12/31/84 change 12/31/85 12/31/84 change 12/31/85 12/31/84 12/31/85 12/31/84
U.s. total 22,076 19,773 11.6% 20,146 18,076 11.5% 1,903 1,697 13.7% 1,035 1,042 895 655
Note: SIlC the questionnaire for category more; the explanatory notes may provide tails and prisons are combined in one system. definitions and the explanatory notes for further details. The yearend total of prisoners sentenced State-by-State variations from definitions. _. Not applicable. to more than 1 year in Ohio includes 1,582 men All data for Arizona, California, the District I Jurisdiction did not report category. ~nd 181 women with sentences of a year or less. of ColumbIa, Florida, Georgia, Indiana, Iowa, aCounts of inmates by sentence length may be Hawa:l, Maryland, and Oklahoma estimate the Massachusetts, Michigan, Texas, and West slightly incorrect. Sec "Sentencing infor- number of women and men. Virginia are cUstody, ra ther than jurisdiction mation'l for the relevant jurisdictions in the eSureau of Justice Statistics has estimated all counts. Most, but not all States, reserve explana tory notes. Idaho figures from monthly prison reports of the prison for offenders sentenced to a year or !>Figures include both jail and prison Inmates; Idaho Department of Corrections.
74 Correctional Populations in the United States. 1985
.1iLZ
Explanatory notes by jurisdiction
Alabama New court commitments: Include
parole and other conditional release violators with or without new sentences.
Parole violators with new sentences: Include parole violators without new sentences.
Escapees and AWOL prisoners: Counted as a single category.
Other admissions: Unspecified to the Alabama data system.
Other unconditional releases: Court-ordered releases.
Other conditional releases: Unspecified to the Alabama data system.
Cause of death: Can specify only execution.
Other releases: Unspecified to the Alabama data system.
Alaska New court commitments: Include
other conditionall'elease violators, with or without new sentences.
Transfers to and from other jurisdictions: Include custody transfers of inmates under Alaska's jurisdiction from and to Federal maximum security facilities.
Other unconditional releases: Court-ordered releas"'s.
Other conditional releases: Emergency releases.
Arizona Other conditional releases:
Include supervised discretionary releases and supervised work furloughs.
Arkansas Arkansas revised the previously
reported December 31, 1984, population of inmates of more than 1 year maximum sentences.
Sentencing information: Reported population includes a small number of inmates with sentences of a year or less.
Parole violators with new sentences: Include parole violators without new sentences.
Conditional release violators with new sentences: Include conditional release violators without new sentences.
A
Other unconditional releases: Court-ordered releases.
Other conditional releases: Persons released under the provisions of Arkansas' Acts 309, 378, and 814 to some type of supervision.
California California revised the previously
reported December 31, 1984, population of inmates with more than 1 year maximum sentences.
New court commitments: May include a small number of transfers from other jurisdictions.
Conditional release violators with new sentences: Include some parole violators with new sentences.
Conditional release violators without new sentences: Include some parole violators without new sentences.
Other admissions: Prisoners returned from supervised, mandatory release or parole and awaiting a revocation hearing.
Unconditional releases, expil1l.: tions of sentence: Include some court-ordered releases.
Supervised mandatory releases: Include some releases to parole.
Other releases: Residual not accounted for in other release categories. May include prisoners released to court, county jail, hospital, or fire fighting, as well as court-ordered conditional releases.
Unsentenced inmates: Include civil commitments of narcotic addicts and county diagnostic cases.
Total custody population and count of State prisoners in jails: Include 995 men and 127 women housed in jails and work release facilities to ease prison crowding.
Hispanic prisoners: Include only Mexican Americans. Other Hispanic prisoners categorized as nonHispanic.
Colorado Sentencing information: Report
ed population includes a very small number of inmates with 1 year maximum sentences.
Jurisdiction counts ~or admissions, releases, and population characteristics: Exclude 245 men held in jails solely to ease prison crOwding.
Escapees returned: Number estimated.
5",
Transfers to other jurisdictions: Number estimated.
Unconditional releases, expirations of sentence: Include some court-ordered releases.
Other releases: Court-ordered releases for which conditions, if any, are unknown.
Custody population counts: Made on January 3, 1986.
Connecticut New court commitments: May
include a small number of prisoners returned from appeal or bond and some probation violators entering with or without new sentences.
Parole violators with new sentences: May include a small number of other conditional release violators returned with new sentences.
Escapees and AWOL prisoners: Counted as a single category.
Unconditional releases, expirations of sentence: Include some probation releases.
Other unconditional releases: Court-ordered releases and pardon discharges.
Other conditional. releases: "Community Residence" releases under supervision similar to that for parolees.
Unspecified causes of death: Unspecified to the Connecticut data system.
Hispanic prisoners: Categorized as prisoners of unknown race.
Delaware Sentencing information, partially
suspended sentences: Some prisoners serve sentences in which the term in prison is partially suspended, to be completed under probation. They were categorized with inmates sentenced to a year or more only when the prison portion of their sentences exceeded 12 months. As a result, the population and movement counts of inmates with maximum sentences of more than 1 year are understa ted, and the population count of inmates with a year or less maximum sentences is overstated.
New court commitments: InclUde some conditional release violators other than parolees, with or without new sentences.
Escapees and A WOL prisoners: Counted as a single category.
Prisoners in 1985 75
Other admissions: Prisoners for whom type of admission was unknown at time of data collection.
Unconditional releases, expirations of sentence: Include some releases to probation.
Other unconditional releases: Court-ordered releases.
Other releases: Prisoners for whom type of release was unknown at time of data collection.
District of Columbia In 1985 the District of Columbia
began to include in its prison counts inmates in the jail and the detention center.
Sentencing information, partially suspended sentences: Some prisoners serve sentences in which the term in prison is partially suspended, to be completed under probation. They were categorized with inmates sentenced to a year or more only when the prison portion of their sentences exceeded 12 months. As a result, the population and movement counts of inmates with maximum sentences of more than 1 year are understated, and the population count of inmates with a year or less maximum sentences is overstated.
Sentencing information, short sentences: An undetermined number of inmates housed in neither the District of Columbia jail nor the detention center, and having either no sentence or a maximum sentence of a year or less, was included in the admissions, releases, and population counts of inmates with more than 1 year maximum sentence. As a result, the population and movement counts of inmates with maximum sentences of more than 1 year are overstated, and the population count of inmates with a year or less maximum sentences is understated.
Parole and other conditional release violators: The total number is actual; counts of men within categories of violation are estimates. The female parole violators are counted as having new sentences.
Transfers from other jurisdictions: Transfers from mental hospitals and Federal facilitiea.
Unconditional releases, expirations of sentence: Include some inmates with partially suspended sentences and released to probation.
Cause of death: No cause is specified.
Other transfers to other jurisdictions: Transfers to mental hospitals and to Federal facilities.
Jurisdictional population totals: Include unsentenced inmates held for the first time in the District jail or detention center.
Federal prisons Sentencing information, partially
suspended sentences: Some prisoners serve sentences in which the term in prison is partially suspended, to be completed under probation. They were ca tegorized with inma tes sentenced to a year or more only when the prison portion of their sentences exceeded 12 months. As a result, the population and movement counts of inmates with maximum sentences of more than 1 year are understated, and the population count of inmates with a year or less maximum sentences is overstated.
New court commitments: Include other conditional release violators with new sentences.
Parole violators with and without new sentences: The total number of parole violators is actual; however, the numbers in sentencing categories are estimated.
Other admissions: Include an adjustment for inmates counted as being released even though they remained in jurisdiction of a prison. Include prisoners returning from a release on writs or from authorized temporary absences that became long-term.
Unconditional releases, expirations of sentence: Include some inmates with partially suspended sentences released subject to conditions of probation.
Other releases: Include an adjustment for inmates counted as being admitted although they were already in jurisdiction of a prison. Include prisoners released on writs or authorized temporary absences that became long-term.
76 Correctional PopUlations in the United States, 1985
It
other unconditional releases: Include court-ordered releases and prisoners released by pardons or clemency.
Population total, unsentenced inmates: Includes 1,882 men and 6 women held under the jurisdiction of the Immigration and Naturalization Service.
Florida New coul't commitments: Include
other conditional release violators, with or without new sentences.
Admissions, returns from appeal or bond hearin s and other admissions for men): Include an adjustment for inmates counted as being released even though they remained in jurisdiction of a prison. May include admissions from authorized temporary absences and from appeal or bond.
Admissions, returns from appeal or bond hearin s and other admissions (for women: InclUde an adjustment for inmates counted as being released even though they remained in jurisdiction of a prison. Also include the residual not accounted for in other admissions categories.
Other unconditional releases: Include pardons, vacated sentences, and unconditional releases ordered by the Probation and Parole Commission.
Releases on appeal or bond and other releases (for men): Include an adjustment for inmates counted as being admitted although they were already in jurisdiction of a prison. May include releases for authorized temporary absences and for appeal or bond.
Releases on a eal or bond and other releases for women: Include the prisoners for whom type of release was not known at the time of data collection. Also include the difference between the total number of releases and the total of releases classified in other categories.
Georgia Georgia revised the previously
reported December 31, 1984, population of inmates with more than 1 year maximum sentences.
New court commitments: May include some prisoners returning from appeal or bond.
Parole violators with new sentences: Include parole violators without new sentences and other conditional release violators with or without new sentences.
Escapees and AWOL prisoners: Counted as a single category. .
Other unconditional releases: Include three inmates whose convictions were overturned and two inmates whose sentences were revoked after they had paid a fine.
Other conditional releases: The Parole Board controls the conditional reprieve releases.
Unspecified causes of death: Cannot specify cause which may include accidents.
Jurisdiction population: Excludes inmates awaiting pick-up from jails.
Black prisoners: Include all persons 0 a race other than white.
Hawaii Category estimates: Jurisdiction
and custody totaIs represent actual counts. Admissions, releases, race, and Hispanic origin are estimated from the 1985 fiscal year report.
Prisoners of unknown race: Include Puerto Ricans, prisoners of other Hispanic origin, and inmates who identified more than one racial background; however, prisoners of part-Hawaiian ancestry are counted as Asians or Pacific Islanders.
Idaho The Bureau of Justice Statistics
estima ted all figures reported in 1985. It used the monthly prison management reports of the Idaho Department of Corrections. Thus, the Idaho counts represent estimated rather than actual data. The totals also revise numbers previously reported for 1985.
illinois Conditional release violators with
new sentences: Include some parole violators with new sentences.
Conditional release violators without new sentences: Include some parole violators without new sentences. Also include some returned violators with charges pending.
Other admissions: Include an adjustment for inmates counted as being released even though they remained in jurisdiction of a prison.
Include transfers and prisoners returning from a release on medical furlough, writ, appeal, or bond.
Other unconditional releases: Court-ordered releases.
Other releases: Include an adjustment for inmates counted as being admitted although they were already in jurisdiction of a prison. Include transfers and prisoners leaving for a release on medical furlough, writ, appeal, or bond.
Jurisdiction population (over 1 year maximum sentence) total: Includes 223 men and 7 women serving concurrent Illinois sentences While in other States' prisons.
His(?anic (?risoners: Categorized as prisoners of unknown race.
Indiana Conditional release violators with
new sentences: InclUde parole violators with or without new sentences and other conditional release violators without new sentences.
Unconditional releases, commutations: Parole Board determines the termination of sentences.
Conditional releases, probations: Number estimated. -Other conditional releases: Releases to Regulated Community Assignment.
Iowa Category estimates by sex:
Numbers of admissions and releases estimated from the sex ratio present on December 31, 1985.
Parole violators without a new sentence: Number estimated. Include remanded parolees awaiting formal revocation hearings.
Other admissions: Include prisoners returning from "probation other than shock."
Unconditional releases, expirations of sentence: Include prisoners who received executive commutations that free inmates immediately and unconditionally.
Other unconditional releases: Court-ordered discharges.
zm=R
Conditional releases, paroles: Number estimated. Include prisoners remanded to prison prior to a formal revocation hearing at which they were returned to parole. Also include inma tes released to parole by Conditional Commutation Orders.
His(?anic prisoners: Categorized as prisoners of unknown race.
KanstlS New court commitments: May
include a small number of prisoners returning from appeal or bond.
Other conditional release violators, with or without new sentences: InclUde some probation violators who should be categorized as new court commitments.
Escapees and AWOL prisoners: Counted as a single category.
Other conditional releases: Prisoners under supervision similar to that of parole.
Kentucky Escapees and AWOL prisoners:
Counted as a single category. Other admissions: Prisoners
returned to prison by C!ourt. May include some prisoners returning from appeal or bond.
Other releases: Court-ordered releases, conditional or unconditional. May include some releases for appeal or bond.
Total jurisdiction population: Excludes prisoners in jails awaiting pick-up because of prison crowding.
State prisoners in jail because of crowding: The total number is actual count; the number of men and women are estimated.
Louisiana Escapees and AWOL prisoners:
Counted as a single category. Other unconditional releases:
Court-ordered releases:'
Maine Escapees and A WOL prisoners
returned to prison: Counted as single category.
Prisoners in 1985 77
IlL
Maryland Category estimates: The .
admissions, releases, and populatIon totals are actual counts. Categories for admissions and releases are estimated by applying percents from automated data to the totals which are made manually. The automated data count only inmates with a sentence longer than 1 year while the detailed categories in the manual data include inmates with a maximum sentence of a year or less.
New court commitments: May include a small number of prisoners returning from appeal or bond.
Escapees and AWOL prisoners returned to prison: Counted as single group.
Other admissions: Prisoners readmitted after a court, in error, had ordered their release.
Other unconditional releases: Court-ordered releases. May include a small number of releases to appeal or bond.
Other conditional releases: Inmates from Patuxent Institution released to halfway houses.
Other releases: Inmates admittea In error and released.
M8SS8.chusett.s Category estimates: The totals
for admissions and releases are actual; the categories are estimated.
New court commitments: Include some parole VIOlatOrs with new sentences and other conditional release violators, with or without new sentences.
Unconditional releases, expirations of sentence: Include some releases to probation.
Other unconditional releases: Court=<i'rdered releases.
Michigan Transfers from other jurisdic
tions: Include transfers from mental hospitals and may include other longterm admissions like writs or medical cases.
Unspecified causes of death: Thirteen inmates who had been temporarily released died for unspecified reasons; lehe cause of one other death was unknown at the time of data collection.
Asian and Pacific Islander risoners: Categorized as prisoners
o un nown race.
Hispanic prisoners: Include only Mexican Americans who are also categorized as prisoners of unknown race. Other Hispanic pl'isoners are classified as non-Hispanic.
Minnesota Parole violators with new sen
tences: Include other conditional release violators from supervised mandatory releases and work releases, with new sentences.
Escapees and AWOL prisoners: Counted as a single category.
Other unconditional releases: Include prisoners discharged after the Office of Adult Releases modified their sentences or after a court or executive order. May include some commutations.
Other conditional releases: Work releases.
Prisoners of unknown race: Five non-Hispanic men categorized as prisoners of unknown race.
Hispanic prisoners and prisoners of unknown race: Include 84 men and 2 women, Hispanics, categorized as prisoners of unknown race.
Mississippi New court commitments: Include
a small number of shock probation violators.
Other admissions: Include 24 men and 2 women returned to prison to await revocation hearings.
Other unconditional releases: Court-ordered releases.
Other conditional releases: Include supervised earned releases, supervised work releases, Governor's Suspension and Emergency Powers Act releases.
Other releases: Include those prisoners who had been returned to prison before revocation hearings that then released them again to community supervision. Also include an adjustment for inmates counted as being admitted although they were already in the jurisdiction of a prison.
Missouri Missouri revised the previously
reported December 31, 1984, population of female inmates with more than 1 year maximum sentences. The total number of male inmates for 1985 also differs from an earlier one reported.
78 Correctional Populations in the United States, 1985
TE •
New court commitments: Include some "shock probation" commitments and may include other conditional release violators who were returned to prison.
Parole violators, without new sentences: Include some parole violators with new sentences.
Escapees and A WOL prisoners: Counted as a single category.
Other unconditional releases: Court-ordered releases.
Conditional releases, paroled women: Number estimated. ---unspecified causes of death: No cause specified.
Montana Montana revised the previously
reported December 31, 1984, population of female inmates with more than 1 yeat' maximum sentences.
Parole violators without new sentences, women: Include some female parole violators with new sentences.
Other conditional release violators with new sentences: Include some other conditional release violators with new sentences.
Male escapees and male AWOL prisoners: Counted as a single category.
Race and Hispanic origin of male prisoners: Numbers estimated.
Nebraska Nebraska revised the previously
reported December 31, 1984, population of female inmates with more than 1 year maximum sentences.
New court commitments, men: May include some prisoners returned from appeal or bond.
Parole violators without new sentences, men: Include some parole violators with new sentences.
Transfers, women: Prisoners admitted from and released to a work release center (custody movements only).
Nevada New court commitments: May
include a small number of prisoners returned from appeal or bond.
Escapees and AWOL prisoners: Counted as a single category.
Other unconditional releases: Court-ordered releases.
Hispanic prisoners: Categorized as prisoners of unknown race.
w WI
New Hampshire New court commitments: Include
some prisoners returned from appeal or bond and may include other conditional release violators with or without new sentences.
Parole violators without new ~~ntences: Include parole violators who reCe1Ve new sentences after readmission to prison.
Other unconditional releases: Court-ordered releases.
Other conditional releases: Court-ordered releases to Marathon House Program, a 24-month, inhouse drug addiction treatment program.
New Jersey New court commitments: May
include some transfers from other jurisdictions.
Other conditional release violators without new sentences: Prisoners returned (some with new sentences) from the Intensive Supervision Program, an experimental program operated by the Administrative Office of the Courts. The program provides a sanction that in severity lies between incarceration and probation.
Escapees and AWOL prisoners: Counted as a Single category.
Other conditional releases: Prisoners released to the Intensive Supervision Program.
Total jurisdiction POPUlation and categories for admissions and releases: Exclude 1,1;; 4 male and 16 lemale prisoners held in jails to ease prison crowding.
New Mexico Parole violators without new sen
tences: May include parole Violators 'W'i'fii""ii"ew sentences.
New York New court commitments: Include
parole violators and other conditional release violators with new sentences.
Transfers from and to other jurisdictions: Transfers from and to the Department of Mental Hygiene for psychiatric treatment.
Other admissions: Type of admissions unknown at the time of data collection.
Other causes of death: Causes unknown at the time of data collection.
Custody popUlation with sentences more than 1 year and total: Include 617 male and 17 female alleged parole violators detained on warrant and awaiting revocation hearings.
!iispanic prisoners and race: All Puerto Rican inmates, white and black, are categorized as white.
North Carolina Sentencing information, partially
suspended sentences: Some prisoners serve sentences in which the term in prison is partially suspended, to be completed under probation. The prisoners are categorized with inmates sentenced to a year Ol' more oilly when the prison portion of their sentences .exceed 12 months. Although the maximum sentences of all such prisoners were more than 1 year, nearly all of them are included with those prisoners having sentences of a year or less. During 1985 there were 1,228 uncounted admissions and an almost equal number of uncounted releases of inmates with partially suspended sentences. As a result, the counts of population, admissions, and releases of inmates with more than 1 year maximum sentences are understated, and the population of inmates with a year or less maximum sentences is oversta ted.
Parole violators with new sentences: Include some parole violators without new sentences and other conditional release violators, with or withoui new sentences.
Escapees and A WOL prisoners: Counted as a single category.
Other admissions: Residual not accounted for in other categories, used to adjust the movement data to the yearend total.
Other unconditional releases: Court-ordered releases.
Other releases: Residual not accounted for in other categories, used to adjust the movement data to the yearend total.
Category estimates, sentencing: Population totals represent actual counts; however, sentence length populations, more or less than 1 year, are estimates.
North Dakota New court commitments: Include
some parole violators with new sentences.
Other conditional releases: Court-ordered releases.
Ohio Sentencing information: The
yearend total of inmates with over 1 year maximum sentences included 1,582 male and 181 female inmates with sentences shorter than a year and a day. Admissions and releases reflect those 1,763 short-sentence prisoners.
New court commitments: Include some other conditional release violators with new sentences.
Other unconditional releases: Sentences vacated by courts.
Other conditional releases: Extended furloughs from prison to parole supervision, as in pre-parole and medical furloughs.
Race and Hispanic origin: Actual counts only of jurisdictional inmates in Ohi:..,'s custody.
Oklahoma category estimates, admissions
by sex: Number of men and women in each admission category estimated.
Sentencing information: Population, admissions, and releases may include a very small number of inmates with a 1 year sentence.
New court commitments: Include other conditional release violators returned, with or without new sentences.
Escapees and AWOL prisoners: Counted as a single category.
Other unconditional releases: Include 400 male and 28 female legislative CAP releases (Senate Bill 445) and 1 I1ll!n .. eleased by court order.
Cause of death: Under investigation at the time of data collection.
Hispanic prisoners: Categorized as prisoners of unknown race.
Oregon Parole violators without new
sentences: Include some returned parolees whose revocation status was unknown at the time of admission.
Escapees and A WOL prisoners: Counted as a single category.
Prisoners in 1985 79
='"M'.
other admissions: Inmate recommitted after a court-ordered release.
Unconditional releases, expirations of sentence: Include some supervised mandatory releases.
Other unconditional releases: Court-ordered releases.
Pennsylvania Parole violators, with or without
new sentences: Include 690 men and 6 women returned to state incarcerfltion by the Board of Probation and Parole. They entered on their original sentences and not as technical or convicted parole viola tors. Their count was divided between violators with new sentences and violators without new sentences according to the ratios of actual convicted or technical parole violators. Hence j
382 men and 3 women were categorized as parole violators with new sentences; 308 men and 3 women were considered to be parole violators without new sentences.
Conditional releases, paroles: Include 116 men who had been a.dmitted to prison for parole viola tions and then released after revocation hearings on their original paroles.
Other releases: The reason for these releases was unknown at the time of data coliection.
Rhode Island Sentencing information: Some
prisoners serve sentences in which the term in prison is partially suspended, to be completed under probation. They were categorized with inmates sentenced to a year or more only when the prison portion of their sentences exceeded 12 months. As a result, the population and movement counts of inmates with maximum sentences of more than 1 year are understated, and the population count of inmates with a year or less maximum sentences is overstated.
Other unconditional releases: Convictions overturned.
South Carolina South Carolina revised the pre
viously reported December 31, 1984, population of male inmates with more than 1 year maximum sentences.
New c ')urt commitments: Include a very sniall number of transfers from other jurisdictions.
Other unconditional releases: Court-ordered releases.
Other corditional releases: Inmates released to the jurisdiction of the Department of Parole and Community Corrections under the Emergency Powers Act.
Unspecified causes of deaths: Death of escaped prisonel'.
Tennessee Tennessee revised the previously
reported Decembet' 31, 1984, population of inmates with more than 1 year maximum sentences.
Parole violators with new sentences: Include parole violators withOUt new sentences and other conditional release violators with or without new sentences.
Other unconditional releases: Court-ordered releases.
Total jurisdiction population: Excludes 628 male and female sentenced inmates housed in jails solely to ease prison crowding.
Men in jails to relieve prison crowding: The 628 male inmates include some femal~ inmates.
Prisoners of unknown race: Include all inmates not classified as white or black.
'rexas Pal'ole violators with or without
new sentences: All parole violators reported as having new sentences.
Transfers from other jurisdictions: Transfers from State hospitals.
Other admissions, men: Include an adjustment for inmates counted as being released even though they remained in the jurisdiction of a prison. Include prisoners returning from long-term bench warrants aild medical furloughs.
Other unconditional releases: Court-ordered releases.
Other conditional releases: Conditional pardon releases.
80 Con'ectional Populations in the United States, 1985
-~---------
.... Unspecified causes of death:
Cause of death not determined at the time of data collection.
Transfers to other jurisdictions: Transfers to State hospitals.
Other releases, women: Adjustment to account for an unexplained difference between yearend populations, 1984 and 1985.
Race: Two categories used: white and nonwhite.
Utah Utah revised the previously re
I?orted December 31, 1984, population of inmates with more than 1 year maximum sentences.
Other unconditional releases: The Board of Pardona determines terminations of sentences.
Vermont Vermont revised the previously
reported December 31, 1984, population of inmat~s with over 1 year maximum sentences.
New court commitments, men: May include some other conditional release violators and prio;oners returned from appeal or bond.
New court commitments, women: Include all female admissions.
Other releases: Type of release not known at the time of data collection.
Combined prison and jail populations: Numbers reflect population of integrated jail &nd prison system. "Lockups" operated by some cities and counties are excluded.
PopUlation counts: Made December 21, 1985.
Virginia New court commitments: May
include a small number of prisoners returning from appeal or bond.
Transfers from other jurisdictions: Include inmates admitted to begin Virginia sentences or to continue Virginia sentences. ThUS, transfers from other jurisdictions may be slightly overstated, and new court commitments slightly understated,
Other unconditional releases: Administrative releases.
I,
7 -uns~€cified causes of death:
UnspecIfied to the Virginia data system for some deaths.
Prisoners of unknown race: Include all inmates who are neither ,¥lhite nor black.
Washington New court commitments: May
include a small number of prisoners returned from appeal or bond.
Escapees and AWOL prisoners: Counted as a single category.
Other admissions: Reflect the difference 6etween the numbers in two categories: parole violators returned to prison to await revocation hearings and parolees who leave prison after a hearing does not revoke their paroles.
Other releases: See "Other admissions."
Unspecified causes of death: Include a car accident that killed an escapee and a shooting by police of an inmate on work release.
Hispanic prisoners and prisoners of unknown race: Prisoners of unknown race include Hispanics and inmates with mixed racial origins.
West Virginia West Virginia revised the previ
ously reported December 31, 1984, populations of male and female inmates with more than 1 year maximum sentences.
Poeulation, admissions and releases counts, men: Based on custody data.
New court commitment;;: Include parole violators and other conditional release violators with new sentences.
Other admissions: Return from Medical Respite.
Conditional releases, probations: Include rome releases to court jurisdiction of inmates declared unfit to remain in a particular minimum security facility.
Other conditional releases:, Released to Medical Respite.
Other releases: Court-ordered releases for which conditions, if any, are unknown.
I:::;
-Wisconsin
Wisconsin revised the previously reported December 31, 1984, population of inmates with more thlln 1 year maximum sentence!":.
Other admissions: 'Type unknown at the time or data collection.
Other unconditional releases: Pardons.
Other conditional releases: SpeCial Action early releases.
Unseecified causes of death: Unspecified to the Wisconsin data system.
Other releases: Court-ordered releases for whIch conditions, if any, are unknown.
Wyoming New court commitments: May
include a small number of administrative turnovers-the start of a consecutive sentence.
Unconditional releases, exeirations of sentence: May include a small number of administrative turnovers-the end of one sentence to be followed by another.
REPORT PERIOO COVERED: JanlJary l,19861hroIJgh December 31,1986
FORM NPS-1 tlO-15·B5T NOTICE - These datu are being collected In accordance with the 1979 Crime Control Act.
U.S, DEPARTMENT OF COMMERCE aUREAIJ OF THE CENSUS
ACTING AS COI,lECTlNG AGi:NT FOR THE BUREAU OF JUSTICe 5T ATISTICS
U.S. DEPARTMENT OF JUSTICt;
SUMMARY OF SENTENCED POPULATION MOVEMENT
NATIONAL PRISONER STATISTICS
1985
FROM THE DIRECTOR BUREAU OF THE CENSUS
fFIt..'tlSl! correct arty error In name and address Includmg ZIP code}
The Bureau of the Census, at the request of the Bureau of Justice Statistics (BJSl, collects data on the inmates of prisons in each state, the District of Columbia, and the Federal Bureau of Prisons. This has been done by the Bureau of Prisons, the Law Enforcement Assistance Administration, or the Bureau of the Census each year since 1926. The collection of these data is iluthorized by Title 42, United States Code, Section 3732, and is designed to provide annual summary measures of movement into and out of the Nation'S correctional systems.
This report form concerns inmates with maximum sentences greater than 1 year who moved into or out of the jurisdiction of your State during the period January 1, 1985 through December 31,1985. The figures posted in the "1984" columns were transcribed from the NPS-1 report your State submitted last year. Please complete and return the form by February 14, 1986 to expedite timely pUblication of the data.
In the past, a major problem for national correctional studies has been the inability to collect comparable data from all states because of differing definitions and reporting procedures. We have developed a set of definitions to try to overcome this problem. If you are unable to use our definitions when completing the NPS-1 form, please let us know the specific differences so that we can inform the users of the data.
Although your participation in this endeavor is voluntary, the information you provide is very useful to BJS, the Congresl), the states, and others involved in the formulation of national, state, and local justice policy and decision making_
If you need any help, please call collect on (3011 763-2061.
Thank you for your cooperation.
Sinceraly,
JOHN G. KEANE
PLEASE READ INSTRUCTIONS ON PAGES 5 AND 6 8EFOflEi COMPLETING THIS FORM
BUREAU OF THE CENSUS Attn: Demographic Surveys Division Washington, D.C. 20233
82 Correctional Populations in tHe United States, 1985 f)
0° ..
GENERAL INSTRUCTIONS
In this report, you are asked to report summary Enter "NA" (Not Applicable) if by law or regulation populations and movements of offenders under the your State cannot have the type of inmates described jurisdiction of your state prison system in 1985, by the Item. Enter "0" (zero), if your State can have whether they were within the custody of your such inmates but did not have any during 1985. Enter state's system or were housed elsewhere. 8ecause "NR" (Not Reported) in the item, if your State had the the NPS-1 is an effort to collect comparable data type of inmates described by the item but you cannot from all states, we urge that you try to adhere to determine the number of such inmates your State had the concepts and ,!,,;-;nitions provided on pages 5 in 1985. If you cannot determine the number of and 6 of this form. inmates separately by item, report the combined
count in one of the items, enter "NR" in the However, If after reviewing the concepts and remaining items and specify in the notes space on definitions, you are not able to report an item using pages 2, 4, or 6 all of the items represented by the our guidelines, please inform us using the following combined count. Please do not leave any item blank. procedure.
FOR PROCEllSING I YEAR I STATE FIPS CODE USEONLY-__ l I I I
SUMMARY OF SENTENCED POPULATION MOVEMENT - 1985
INMATES WITH OVER 1 YEAR MAXIMUM SENTENCE
Item tlescription MAl.E FEMALE
1984 1985 1984 1985
1. Jurisdiction population on January 1 '" 2. Admissions
a. New court commitments
~: Parole violators with new sentences
c. Other conditional release violators with new se'ltences
d. Parole violators only, no new sentences
e. Other conditional release violators only, no new sentences
f. Transfers from other jurisdictions
g.AWOL returns, with or without new sentences
h. Escapee returns, with or without new sentences
I. Returns from appeal/bond
j. Other admissions (Specify;n "Notes" below) .,...
8. Racial T composition a.TOTAL (TranscritJe from item 5dJ ~
Dec:31 b.Raca l!!.ldhite
(2) Black ---.. (3) American Indian or
Alaskan Native
(4) Asian or Pacific Islander (5) Other (Specify in
"Notes" below)
(6) Not known
Item description ETHNIC COMPOSITION
Of thosli enumerated in item 5d. "Total inmate MALE FEMALE population - jurisdiction population December 31." please sptlcify ethnic counts. 1984 1986 1984 1986
9. Ethnic composition a. TOT AL (Transcribe from item 5dJ • Dec. 31 b.Ethnicity !
(Additional space for notes is provided on page 6)
.-j Date completed 10. R9port .1 Name and title , Telephone
submitted ~ ,;:;.;; ~OdO r"';-';;-be-,--- I Extens~o--;;--' by "'\
!
fORM NPS·, tlo·\O· ... P 4
Prisoners in 1985 85
INSTRUCTIONS
COVERAGE
In this report, you are asked to report populations and movements of all adults and youthful offenders adjudicateu through the adult court and sentenced to n maximum of at least one year and one day and admitted to or released from the jurisdiction of your State prison system, even though they may be housed in another state or in a Federal institution or in a county facility. For example, you should report the admission or release of prisoners sentenced for offenses in your State but housed In another state for safekeeping. You should report the admission or release of state inmates held in local/ails as a direct re&.,lt of overcrowding in state facilities if these inmates are considered to be under your State's jurisdiction while they serve in local jails. You should not report the admission or release of inmates your State was merely housing for other states.
JURISDICTION POPULATION ON JANUARY 1
The jurisdiction population on January 1, 1985 (Item 1) should equal the number of inmates with over 1 year maximum sentence on December 31, 1984 (Item 5al. Revise Item 5a for 1984 if appropriate.
ADMISSIONS
a. New court commitments - Include all inmates who were admitted with all new sentences, that is, these inmates were not readmitted for any sentences. This category includes probation violators entering prison for the first time on the probated offenses. Do not include parole violators with new sentences as new court commitments.
b. Parole violators with new sentences - Include all parolees returned with new sentences.
c. Other conditional release violators with new sentences - Include all conditional releases (other than parolel returned With new sentences, for example, returns from shock probation, from supervised mandatory release, etc.
d. Parole violators only, no new sentences -Include all parolees returned only for formal revocations of parole which were not accompanied by new sentences. If the parole was not formally revoked, that Is, the parolee was held only temporarily pending a hearing, no admission occurred for NPS purposes.
e. Other conditional ralaase violators only, no new sentences - Include ail conditional release violators other than violators returned only for formal revocations of conditional release which were not accompanied by new sentences. If th" conditional release was not formally revoked, that is, the conditional release violator was held only temporarily pending a hearing. no admission occurred for NPS purposes.
f. Transfers from other jurisdictions - Include all inmates transferred to this State's jurisdiction to continue sentences already in force. Do not report the admission if your State does not acquire jurisdiction. Do not report movements from prison to prison within your State.
g. AWOL retums, with 0. without new sentences -Include all returns from AWOL. AWOL is defined as failure to return from authorized temporary absences such as work furlough, study release, mercy furlough, or other authorized temporary absence.
h. Escapeo raturns, with or without new sentences - Include ail returns from escape. Escape ;s defined as unlawful departure from a State correctional facility or from the custody of State correctional personnel.
FOAM NPS,l 00·15,951 Pag.5
ADMISSIONS - Continued
i. Returns from appeal/bond - Include all inmates reinstated to correctional jurisdiction from longterm jurisdictional absences on appeal or bond. Do not report returns from short-term movements (that is, less than 30 days) to court (that is, where the State retains jurisdiction).
j. Othar admissions - Include all other admissions not covered by the above categories. Please specify the nature of these admissions in the "Notes" section on page 2.
RELEASES
Unconditional - An unconditional release occurs only if the released inmate cannot be reimprisoned for any sentence for which he was in prison.
a. Expirations of sentence - Include all inmates whose maximum court sentences minus credits have been served.
b. Commutations - Include all inmates whose maximum sentences have been changed (lowered) to time served to ailow immediate unconditional release.
c. Other unconditional releases - Include all other unconditional releases not covered by the above categories. Please specify the nature of these raleasas in the "Notes" section on page 4 or page 6.
Conditional - A conditional release occurs if the released Inmate, upon violating the conditions of his release, can be imprisoned again for any of the sentences for which he was in prison.
d. Probations - Include ali inmates who have been placod under probation supervision and condi· tionally released. Include all shock probation releases.
e. Supervised mandatory releases - Include all inmates who must, by law, be conditionally released. This type of release may also be called mandatory conditional release.
f. Paroles - Include all inmates conditionally released to parole. Enter only releases officially entitled "parole."
g. Other conditional releases - Include all other conditional releases not covered by the above categories. Please specify the nature of these releasas in the "Notes" section on pogo 4 or poge 6.
Death
h. Exacutions - Self-explanatory
I. Illnesses/natural causes - Self-explanatory
j. Suicides - Self·explanatory
k. Accidental injury to self - Include all inmates who accldentall'{ caused their own deaths (for example, a fall from a ladder, mishandling electrical equipment).
I. Death caused by another persoll - Include all inmates whose deaths were caused accidentally or intentionally by another inmate or prison personnel.
m. Other deaths - Include all other deaths not covered by the above categories. Please specify the nature of these deaths in the "Notes" section on page 4 or page 6.
86 Correctional Populations ill the United States, 1985
INSTRUCTIONS
RELEASES - Contlnuod
Other Relea8a8
n. AWOLS - Include all failures to return from an authorized temporary absence such as work furlough, rotudy release, rnercy furlough, or other authorizEld temporary absence.
o. Ellcapo8 from contino mont - Include all unlawful departures from a State correctional facility or from the custody of State correctional personnel.
p. Trlil'lsfers to other jurisdictions - Include all inmates who were transferred from this State's jurisdiction to another to continue sentences already in force. Do not report the release if your State does not relinquish jurisdiction. Do not report movements from prison to prison within your St;lte.
q. Ralea808 to appeal/bond - Include all inmates released from correctional jurisdiction to long· term Jurisdictional absences on appeal or bond. Do not report short-term movements (that is, less than 30 days) to court where the State correctional system retains jurisdiction.
r. Other rele8se8 - Include all other releases not covered by the above categories. Please specify the nature of these releases in the "Notes" section on page 4 or page 6.
JURISDICTION POPULATION DECEMBER 31
Include all inmates underthis State's jurisdiction on December 31, regardless of the location of the inmates. Do not include other jurisdictions' inmates (for example, inmates from other States, pre·trial detainees) merely housed in your prisons. These inmates, however, are enumerated in item 6, "Custody Population."
CUSTODY POPULATION DECEMBER 31
Include all inmates in this State's custody, that is, housed in your State correctional facilities on December 31. Do not include State inmates housed outside State prison facilities (these are reported under "Jurisdiction Population," item 51. Include other jurisdictions' inmates (for example, inmates from other States. the courts, local jails) housed in your State's facilities.
FOAM NPS t '10 1!) 9.51
NOTES
OVERCROWDING DECEMBER 31
Include all inmates housed in local jails on December 31, as a direct result of overcrowding in your State's prisons. Do not include inmates held in local jails for other reasons, (for example, work release, court appearance, etc.). Mark the "Yes" or "No" box to indicate whether or not these inmates are included in 5d, "Total Inmate Population - Jurisdiction Population December 31." If you mark "No," explain in the "Notes" section on page 4 or page 6.
RACE
(1) White - A person having origins in any of the original peoples of Europ'l, North Africa, or the Middle East.
(2) Black - A person having origins in any of the black racial groups of Africa.
(3) American Indian or Alaskan Native - A person having origins in any of the original peoples of North America, and who maintains cultural identification through tribal affiliation or community recognition.
(4) Asian or Pacific Islander - A person having origins in any of the original peoples of the Far East, Southeast Asia, the Indian Subcontinent, or the Pacific Islands. This area includes, for example, China, India, Japan, Korea, the Philippine Islands, and Samoa.
(5) Other - Any other races not covered by the above categories. Please specify the races in the "Notes" section on page 4 or page 6.
(6) Not known - Any inmate whose raCe is unknown should be included here.
ETHNIC ORIGIN
(1) Hispanic - A person of Mexican, Puerto Rican, Cuban, Central Of South American or other Spanish culture or origin, regardless of race.
(2) Not Hispenic - A person not covered by the above category.
(3) Not known - Anyone whose ethnic origin is unknown should be included here.
Prisoners ilt 1985 87
Parole in 1985
.... po
Tables
6.1 Adults on parole, by national totals for characteristics, 1985 90
6.2 Adults on parole, 1985 91 6.3 Adults on parole, by status
of supervision, 1985 92 6.4 Adults entering parole, by
type of parole, 1985 93 6.5 Adults leaving parole, 1985
94 6.6 Adults on parole, by sex and
Hispanic origin, 1985 95 6.7 Adults on parole, by race,
1985 96 6.8 Adults on parole, by
sentence length, 1935 97
Explanatory notes by jurisdiction 98
Questionnaire 101
Parole in 1985 89
Table 6.1. Adults on parole, by national totals for characteristics, 1985
Characteristics
Number of adults on parole from state or Federal prisons
Percent of those persons with a known sta tus
Stntus of supervision
Active supervision Inactive supervision Absconded from supervision Supervised out of State
Adults entering parole
Discretionary parole Mandatory parole
Adults 1e.'1ving parole
Successful completions Discharged absconders Discharged to detainers/warrants Returned to prison
With new sentence With parole revoked With revocation pending With charges pending
Transferred to another State Death
Ser of adults on parole
Male Female
Race of adults on parole
White Black Other races
Hispanic origin of adults on parole.
Hispanic Non-Hispanic
Note: See the detailed tables, the question., naire, and the explanatory notes for definitions, limitations, and exceptions. For every characteristic there existed persons of unknown status or type; their numbers are in
259,748
213,208 14,635 21,796 10,109
170,671
98,847 71,824
159,156
92,703 3,448 2,921
18,835 32,240
2,402 1,593 3,221 1,693
262,854
245,707 17,147
254,061
137,990 110,906
5,165
187,231
31,315 155,916
the detailed tables.
100%
82 6 8 4
100%
58 42
58 2 2
12 20
2 1 2 1
100%
93 7
100%
54 44
2
100%
17 83
·Jurisdictions failed to report Hispanic origin for 90,207 persons. Caution must be used in interpreting this category.
90 Correctional Populations in the United States, 1985
Table 6.2. Adults on parole, 1985
Percent 1985 change parolees
Parole Parole in parole per popu- popu- popu- 100,000
Regions and lation 1985 lation lation adult jurisdictions 12/31/84 Entries Exits 12/31/85 1984-85 residents
U.s. total 266,992 183,422 172,976 277,438 3.9% 158 Federal 16,854 7,932 7,926 16,860 10 State 250,138 175,490 165,050 260,578 4.2 148
••• Not applicable. men held at the Adult Correctional Institu-: Jurisdiction did not know. tion on detention warrants and 6 persons aConnecticut reported an undetermined under Federal supervision. number of parolees supervised out ot' State all eWisconsin categorized under "Other" those sbscondlng from supervision. parolees for whom viola tlon warrants Were
Maine abolished parole in 1976. ~sued. cThe jurisdiction estimated the data. Florida did not report on parolees supervised dRhode Island included under "Out of State" out of State, five men serving sentences Imposed by other States. 1'he "Other" status included 17
gMontana repeated the 1984 figures for 1985.
92 Correctional Populations in the United States, 1985
Table 6.4. Adults entering parole, by type of parole, 1985
Number of adults entering: l2arole Regicns and 'fotal Parole t~l2es Other or jurisdictions in 1985 Discrehonary' Mandatoryb unknownO
U.s. total 183,422 98,847 71,824 12,751 Federal 7,932 6,679 1,207 46 states 175,490 92,168 70,617 12,705
Northeast 29,631 27,383 2,097 151 Conne8ticut 300 250 0 50 Maine Massachusetts 3,382 3,382 0 0 New Hampshire 147 147 0 0 New Jersey 7,849 7,849 0 0 New York 12,458 10,361 2,097 0 Pennsylvania 5,017 4,927 0 90 Rhode lsland 347 335 0 11 Vermont 131 131
••• Not applicable. from prison were not decided by a parole : Jurisdiction did not know. board. ·Included in another category. COther or unknown type of entry Includes, aDiscretionary parole entries are persons among others, persons reinstated to parole going on parole because of a parole board ~fter their cases were closed. gecision. Maine has no parole system.
Manda tory parole entries include those eAiabama and Arkansas did not report parole entering because of determinn te sentencing R:pes. statutes, good-time provisions, or emergency Kentucky reported manda tory releases to releases; they are persons whose rei eases parole in the discretionary ca tegory.
Parole in 1985 93
Table 6.5. Adults leaving parole, 1985
Success- Dis- Dis- Trans-
fully charged charged Returned to I2rison or Jail ferred Other
com- as to de- With With With re- With to an- or un-
Regions and pIe ted abscon- tainer, new parole vocation charges other knowu
jurisdiction Total parole del' warrant sentence revoked pending pending State Death status
U.s. total 172,976 92,703 3,448 2,921 18,835 32,240 2,402 1,593 3,221 1,693 13,920
••• Not applicable. in an adjustment category. ~tate cases terminated, and 54 unspecified. : Jurisdiction did not know. eOklahoma included an adjustment residual in California included 6,185 suspended paro-*Included in ano ther ca legory. "Other." lees at large-absconders-under "Other." ~Iaine abolished parole in 1976. fTennessee estimated the number of parolees lMontana reported 1984 data for 1985.
tate estimated parole exit data. who died in 1985. Revoca tions pending were reported as cRhode Island reported under "Other" six gVirginia summarized all releases to prison revoca tions, charges pending as new sen-~bsconders Whose parole was revoked. under "Discharged to detainer, warrant." Under tences, and transfers to other States as
Illinois included under "Other" the following: "Other" Virginia reported the following: 497 successful completions. 545 absconders, 548 other discharges, and 917 transferred to other districts, 202 out-of-
94 Correctional Populations in the United States, 1985
Table 6.6. Adults on parole, by sex; and HL~nic origin, 1985
Number of adults on earole Parole Sex His~lIniC origin
Regions and population Unre- on- Unre-jurisdictions 12/31/85 Male Female ported Hispanic Hl~panic ported
U.S. total 277,438 245,707 17,147 14,584 31,315 155,916 90,207
Federal 16,860 15,752 ~,108 0 1,326 10,481 5,053 State 260,578 229,955 16,039 14,584 29,989 145,435 85,154
: Jurisdiction did not know. ca tegories. individuals who were on mandatory parole. BMaine aholished parole in 1976. eState estimated sex data. eMontana repeated its 1984 figures fol' 1985. bState estimated all data in detailed dAlaska did not report on approximately 150
Parole in 1985 95
Table 6.7. Adults on parole, by race, 1985
Number of adults on l2arole American
Parole Indian, Asian, Regions and popUlation Alaskan Pacific jurisdictions 12/31/84 White Black native Islander Other Unknown
u.s. total 277,438 137,990 110,906 1,800 1,165 2,165 6,965
Federal 16,860 10,416 6,083 253 69 0 39 State 260,578 127,574 104,823 I,S47 1,096 2,165 6,926
Northeast 57,116 ~3,465 26,993 305 482 0 5,567
Conneiticut 597 277 234 0 0 0 86 Maine 68 Massachusettsb 4,.496 3,057 944 0 90 0 405 New Hampshire ~53 451 2 0 0 0 0 New Jersey 13,.185 6,123 7,252 1 9 0 0 New York 25,279 7,133 12,637 302 371 0 4,836 Pennsylvania 1~"WO 6,116 5,831 2 11 0 240 Rhode Island 402 308 93 0 1 0 0 Vermont 236
: Jurisdiction did not know. ~nd Pacific Islanders. ~Maine abolished parole in 1976. Alaska did not report on approximately 1:>0 State estimated racial group data. ~ersons who were on mandatory parole.
cTennessee estimated the number of Asians Montana repeated its 1984 figures for 1985.
96 Correctional Populations in the United States, 1985
Table 6.8. AduIts.on parole, by sentence length, 1985
Number of adults on earole Length of sentenceS
Regions and Less than 1 year jurisdictions 12 months or more Unreported
U.S. total 1,951 214,036 106
Federal 187 16,673 ° State 1,764 197,363 106
Northeast 1,262 38,854 0
conn~ticut 7 590 0 Maine Massachusetts / / / New Hampshire 0 453 0 New Jersey 1,248 12,137 0
New York 0 25,279 0 Pennsylvania c Rhode Island 7 395 0 Vermont
Sou th Carolina Tennessee 0 7,499 0 Texas ° 47,471 0 Virginia 0 5,641 0 West Virginia 0 638 0
West 185 42,818 106
Alaska Arizona 175 1,542 0 California 0 33,983 ° Colorado 2,003 0 Hawaii 0 716 0 Idaho 0 381 102 Montanad 0 694 0 Ne\!ada New Mexico Oregon 3 2,003 4 Utah 0 1,174 0 Washington Wyoming 7 322 0
I Jurisdiction did not report category. CPennsylvania reported 11,-117 parolees : Jurisdiction did not know. with maximum sentences longer than 2 years aSentences are the maximum sentences ~nd 783 with sentences shorter than 2 years. ~hen ranges are used. Montana repeated its 1984 figures for
Maine abolished parole in 1976. 1985.
Parole in 1985 97
&planatory notes by jurisdiction
Alabama For adults entering or leaving
parole (tables 6.4 and 6.5) Alabama provided no details.
Alabama did not repOl·t sex, Hispanic origin, and sentence length. It estimated the number of black and white parolees.
Alaska Alaska did not report sentence
length of parolees. Data for approximately 150 parolees on mandatory parole were not available.
Arizona For adults entering parole (table
6.4) "Other" includes interstate compact cases.
Arkansas For adults leaving parole (table
6.5) "Returned to prison or jail, parole revocation" includes all categories of parole revocation.
Arkansas provided almost no detail and estimated data for sex, race, and supervision status.
California California combined counts from
the California Department of Corrections and the California Youth Authority.
For adults entering parole (table 6.4) "Reinstate" includes 6,246 absconders who were reinstated.
For adults leaving parole (table 6.5) California did not report those parolees returned to prison with pending charges and those transferred to other States. "Othet''' includes 6,185 suspended parolees at large, absconders.
Colorado For status of supervision (table
6.3) "Inactive" and nSentences less than 1 year" do not apply.
For adults entering parole (table 6.4) Colorado had only mandatory parolees.
For adults leaving parole (table 6.5) Colorado l'eported only those parolees who were successful, who were returned to prison, or who died.
Connecticut For adults leaving parole (table
6.5) "Absconder" includes some parolees supervised out-of-State.
Delaware For adults leaving parole (table
6.5) those returned to prison were included with those discharged to custody, detainer, or warrant.
District of Columbia The District amended its Decem
ber 31, 1984, figure to include 501 inactive cases. Demographic data were estimated for those cases.
Data fot' Hispanic origin ahd sentence length were unknown.
Florida For adults leaving parole (table
6.5) nOther" includes everyone except those who completed parole successfully or were discharged as absconders.
Florida did not report Hispanic origin and sentence length data and excluded data on persons supervised out of State.
Georgia Georgia did not report data for
Hispanic origin and sentence length.
Hawaii The State Intake Services Center
estimated data for race and Hispanic origin because State policy forbids release of actual numbers.
Idaho Idaho revised its previously
reported December 31, 1984, figure. A corrections department
employee reported estimates of Idaho's numbers by telephone.
Dlinois For adults entering parole (table
6.4) "Other" includes transfers from other states.
FOI' adults leaving parole (table 6.5) "Other" incluues 545 absconders transferred to the apprehension unit, 548 other discharges, and a reporting ajustment of 917.
Illinois estimated all demographic data from the percentage distribution of parolees on active supervision. It had no demographic information on absconders and parolees supervised out of State.
Indiana indiana estimated some of its
racial and Hispanic origin data.
98 Correetional Populations in the United States, 1985
<,:..------------------
£1 WI"*
Iowa For adults leaving parole (table
6.5) Iowa reported no information on I?arolees who died.
Data for race and Hispanic origin were unknown.
Kansas For adults on parole (table 6.3),
the January 1 figure includes an estimated 1,372 regular parolees, an estimatl'ld 100 supervised conditional releaSl3S from prison, and an estimated 525 out-of-State parolees. The December 31 figure includes 1,588 parolees in Kansas as well as conditional releases from prison and 694 out-of-State parolees.
For adults leaving parole (table 6.5) "Other" includes discharged absconders, those discharged to warrant, persons returned to incarceration with pending proceedings, and transferred parolees.
Kansas estimated data for race and Hispanic origin. It reported no demographic data on parolees supervised outside Kansas.
Kentucky Kentucky revised its previously
reported count for December 31, 1984.
For adults entering parole (table 6.4) "Discretionary releases from prison" includes mandatory releases. "Other" includes transfers from other jurisdictions.
For adults leaving parole (table 6.5) those successfully completing parole include releases from active superVision, final discharges, and closed cases.
Kentucky did not report demographic and sentence length data.
Louisiana Louisiana did not report Hispanic
origin.
Maine Maine abolished parole in 1976.
Mary1mld Maryland did not report Hispanic
origin.
Massachusetts Massachusetts revised its pre
viously reported December 31, 1984, figure to exclude out-of-State parolees being supervised in Massachusetts.
Massachusetts estimated all data.
Michigan Michigan revised its previously
reported December 31, 1984, figure to account for late entries.
Minnesota For adults leaving parole (table
6.5) "Successful completion" includes absconding as well as being transferred or discharged to custody, detainer, or warrant.
Missouri Missouri revised its previously
reported figure for December 31, 1984, because an error existed in the computerized reporting system.
The state estimated all data.
Mississippi For adults entering parole (table
6.4) "Othe1'" includes persons on work release (35) and supervised earned release (2). It also includes a data adjustment (6). .
Montana Montana could not report 1985
data because of a computer conversion; all numbers presented came from 1984 data.
F.:>r adults leaving parole (table 6.5) those returned to incarceration with new charges or parole revoca·, tion pending were reported as having completed the proceedings; parolees transferred to other jurisdictions were classified as successful completions.
Nevada Nevada estimated all data
because of budgetary constraints. T'he State did not report demo
graphic and sentence length information.
New Hampshire New Hampshire did not report
data for Hispanic origin and supervision status.
The State places absconders on an inactive case list. When an absconder is found, the authorities decide to reactivate the case, to cite the parolee for a violation, or to discharge him.
New Jersey For adults leaving parole (table
6.5) "Other" includes recalls by the court.
New Mexico New Mexico revised its
previously reported figure for December 31, 1984.
The State estimated demographic data from a random sample of caseloads. It did not report supervision status.
New York For adults leaving parole (table
6,5), those counted as successfully completing parole include parolees discharged to custody, detainer, or warrant. Parolees returned to incarceration with new charges or parole revocation pending were reported as having completed the proceedings.
New York did not include parolees from county jails.
North carolina "Other" on all tables illcludes an
adjustment figure. For adults leaving parole (table
6.5) "Returned to prison with revocation pending" includes all those returned to prison or jail.
North Carolina did not report data for Hispanic origin and sentence length.
Ohio For adults entering parole (table
6.4) "Other" includes parolees placed in other States.
For adults leaving parole (table 6.5) "Other" incl!Jdes compact cases closed.
Ohio did not report demographic data.
Oklahoma Oklahoma revised its previously
reported figure for December 31, 1984, to correct errors and to account for late entries.
For adults entering parole (table 6.4) "Other" includes an adjustment figure.
The State did not report on supervision status and sentence length.
Oregon Oregon revised its previously re
ported figure for December 31, 1984, to reflect a correction in the computer files.
For adults entering parole (table 6.4), those reinsta ted were reported as discretionary releases from prison.
For adults leaving parole (table 6.5) "Other" includes absconders whose files were closed. "Returned to prison, parole revoked" includes all parolees returned to prison.
Oregon excluded inactive cases and misdemeanants.
Pennsylvania For adults leaving parole (table
6.5) "Discharged to custody, detainer, or warrant" includes absconders discharged from parole.
Pennsylvania excluded 19,536 parolees supervised by county parole authorities.
The state parole board has jurisdiction over persons sentenced to a maximum of 2 years or more and over special parolees, offenders with sentences of less than 24 months but certified by a court to board supervision. On December 31, 1985, there were 11,417 regular parolees and 783 special parole cases.
Rhode Island Rhode Island revised its
previously reported figure for December 31, 1984.
For adults on parole (table 6.3) "Supervised out-of-State" includes five men in out-of-State prisons; "Other" includes 17 men held at the Adult Correctional Institution on detention warrants, 2 serving Federal sentences, 2 supervised by the U.S. Immigration and Naturalization Service, and 2 persons supervised in the Federal Witness Program.
For adults leaving parole (table 6.5) "Other" includes six absconclers whose parole was revoked.
South Carolina South Carolina revised previously
reported figure for December 31, 1984, to include provisional parolees.
The State did not report data for Hispanic origin and sentence length.
Parole in 1985 99
.. South Dakota
South Dakota reported on data from June 30, 1984, to June 30, 1985.
For adults entering parole (table 6.4) "Other ll includes those with a suspended sentence to probation and work release.
Tennessee "Other" (tables 6.4 and 6.5)
covers interstate compact cases. For adults leaving parole (table
6.5), the State estimated the number of deaths.
Tennessee estimated the number of Asian and Pacific Islanders in table 6.7.
Texas Texas reported the data for
September 1, 1984, to August 31, 1985.
Texas estimated the demographic data.
Uwh Utah revised its previously
reported figure for December 31, 1984, to exclude compact cases.
Vermont Vermont estimated all reported
data. The State did not report racial,
Hispanic origin, and sentence length data.
Virginia For adults entering I?arole (table
6.4) "Other" includes 469 transferred from other districts, 234 transferred from other States, and 29 Virginia cases transferred from other States.
For adults leaving parole (table 6.5) "Discharged to custody, detainer or warrant" includes all those returned to incarceration; "Othel'" includes 497 parolees transferred and 202 terminations of out-of-State cases.
Virginia estimated the numbers for race and sex based on percents in December 1985.
The state did not report Hispanic origin and supervision status.
Washington Washington estimated all data.
For adults leaving parole (table 6.5) "Other" includes all categories.
Washington did not report sentence length.
West Virginia West Virginia did not report
Hispanic origin.
Wisconsin Wisconsin revised its previously
reported figure for December 31, 1984, to correct errors and to account for late entries.
For ~dults on parole (table 6.3) "Other;" includes parolees with violation warrants issued.
For adults leaving parole (table 6.5) "Other" includes parolees taken off the record.
Wyoming Wyoming revised its previously
reported figure for December 31, 1984, to account for late entries.
Federal parole system The Federal system revised its
previously reported figure for December 31, 1984, which was only 97% complete.
For adults leaving parole (table 6.5) 1I0ther" includes statistical closings.
The Federal system excluded 3,530 special parolees: drug offenders who must serVfl a supplemental period of supervision at the end of the regular parole. Military parolees (391) were also excluded.
100 Correctional Populations in the United States, 1985
OMS No. 1121·0064: Approval Expires 12/31/88
U.S. DEPARTMENT OF COMMERCE BUREAU OF THE CENSUS
1985 PAROLE DATA SURVEY
Bureau of the Census ATTN: GovernnuIOta Dlvilion Welhlngton, D.C. 20233
FROM THE DIRECTOR BUREAU OF THE CENSUS
REPORT PERIOD COVERED January 1, 1985 - Dacember 31, 1985
Please correct errors in name, address, or ZIP code
On behalf of the Bureau of Justice Statistics (BJS), Department of Justice, the Bureau of the Census is conducting the National Parole Data Survey. The survey will obtain current information on the parole population in calendar year 1985 and the population movement.
State, local, and Federal officials will use the data to assess the changing needs of parole systems and to keep informed of their status. BJS will publish the data in a bulletin entitled Probation and Parole 1985 scheduled for release in fall 1986.
So that we can complete data collection and publish the survey results as soon as possible, please complete this questionnaire within the next 3 weeks and return it in the enclosed envelope. If we can help in completing the questionnaire, please call Stephanie Brown at (301 ) 763-7825.
The Omnibus Crime Control and Safe Street Act of 1968, as amended (42 U.S.C. 3732), authorizes this report. Although you are not required legally to respond, we need your participation to make the results of this survey comprehensive, accurate, and timely.
We will therefore appreciate your cooperation in the survey.
Sincerely,
JOHN G. KEANE
Enclosure
Plaue continue on page 2-
Parole in 1985 101
INSTRUCTIONS
Page 2
Please complete each of the items on the questionnaire. When an exact number for an item is not available, please estimate the figure and mark (X) in appropriate column. Do not leave blanks or mark dashes. Mark a "0" if your State can have parolees in the particular category, but has none at this time. Mark "NA" (not applicable) if the item does not apply in your State. Mark "OK" (don't know) if the item applies to parolees in your State, but you are unable to provide the number and/or have included it in another category. Describe difficulties encountered and Items which cannot be estimated in Item 14.
Items 1 and 4 - PAROLE POPULATION
Include all adult parolees who haw been conditionally released to parole supervision (whether by parole board supervision or by mandatory conditional release).
Include both active and inactive supervision cases.
Exclude juveniles.
Include both parolees sentenced to less than one year and those sentenced to a year or more.
For interstate compacts, Include those parolees who are sent to another State for supervision, but exclude those parolees whom your State supervises for another State.
Item 2 - ENTRIES
Individuals entering into the parole system more than once during the year must be counted as mUltiple entries. Classify each separate parole entry into only one of the entry categories provided.
a. Discretionary release from prison - Include all parolees who entered parole as the result of a parole board decision. Also Include persons granted a Governor's pardon or a commutation of sentence, If they are to be supervised.
b. Mandatory release from prlmon - Include all parolces whose releasa from prison was not determined by a Parole Board. Include persons released through determinate sentencing statutes, and/or good-time provisions.
c. Reinstatement - Include all parolees who entered parole as the result of reinstatement. For example, include discharged absconders whose cases have been reopened.
Item 3 - EXITS Individuals exiting from the parole system more than once during the year must be counted as mlJltiple exits. Classify each separate parole exit into only one of the exit categories provided.
a. Comploted parole - Include all parolees who have served full-term sentences or who have been released early due to a parole authority decision, cOI,lmutation, or pardon.
b. Olschorged absconder - Include all parolees i'ormally dlschargod from the parole authority while known to be on absconder status, regardless of whether a warrant has been issued. 'Exclude changes from active to inactive supervision status. Exclude absconders who have been located and returned to prison. Report these in Items 3(d) or 3(e).
102 Correctional Populations ill the United States, 1985
c. Discherged to custody , detainer, or warrant -Include ail parolees discharged to another jurisdiction under cu:;tody, detainer or warrant. Also include parolees released from parole jurisdiction to a non correctional agency, e.g., mental hospital or halfway house.
d. Returned to prison or jail with new sentence -Include parolees readmitted into the custody of a prison or jail after receiving a sentence for a new offense.
e. Returned to prison or jail - parole revocation -Include parolees readmitted into the custody of a prison or jail due to the violation of the conditions of parole without receiving a new crimina! sentence.
f. Returned to prison or jail, parole revocation pending -Include persons readmitted into the custody of a jail or prison awaiting revocation headng. or final disposition from a revocation hearing.
g. Returned to prison or jeil with new charges pending -Include parolees readmitted into the custody of a jail or prison awaiting trial or Imposition of sentence for new charges.
h. Transferred to another parole jurisdiction -Include parolees transferred to the jurisdiction of another State while still on parole. Exclude interstate compact cases unless legal responsibility for the parolee is no longer retained by your State.
i. Death
Items 5 through 7 - SEX, RACE, ETHNICITY
These items are self explanatory.
Item 8 - SUPERVISION STATUS
a. Actl'le - Include persons required to make regular contact with the supervisory parole authority (in person, by mail, or telephone).
b. Inactive - Include all parolees who were excused from reporting on a regular basis, but remained under your agency's jurisdiction.
c. Absconder - InclUde all parolees who have not been discharged and who fail to report to the parole authority or leave the geographical area of supervision without permission.
d. Supervised out of State - Include all parolees who are under your jurisdiction, but are supervised out of State. Include both active and inactive cases as defined above.
Item 9 - LEII'~TH OF SENTENCE
a. Less than one year - Include all adult parolees who were originally sentenced to less than one year.
b. One year or more - Include all adult parolees originally sentenced to one year or more.
Items 10 through 13 - COVERAGE AND AVAILABILITY
Please answer these items relating to the ability of your facility to report data on parolees.
FORM CJ-7 (1-22·B61
1985 PAROLE DATA SURVEY
Note: December 31, 1984 Number Number
Mark (X) if es~imate • Items 5 through 9 cover distribution of parole
Mark (XI if estimat"
population reported in 1984 Parole Data Survey was population on December 31, 1985
If line 1 differs, please explain discrepancy in item 14. 5.Sex
1 • Parolo population on a.Male January 1, 1985 ~
2. Entries b. Female
8. Discretionary release from prison c. TOTAL Sum of lines 5a and 5b
S.R8co b. Mandatory release from prison
a.White
c. Reinstatement b. Black
d. Other - Specify y-c.American Indian or Alaskan Native
d. Asian or Pacific Islander o. TOTAL - Sum of lines 2a through 2d
o.Other - Specify ~ 3. Exits
a. Completed parole
f.Not known
b. Discharged absconder g. TOTAL - Sum of lines 6a through 6f
c.Discharged to custody, detainer, 7. Ethnicity or warrant
a.Hispanic
d. Returned to prison or jail with b. Not Hispanic new sentence
e. Returned to prison or jail, c.Not known
parole revocation d. TOTAL - Sum of lines 7a through 7c
f.Returned to prison or jail, parole revocation pending
8. Supervision status
a.Active
g. Returned to prison or jail, new charges pending b.lnactive
h. Transferred to another . c. Absconder
parole jurisdiction d. Supervised out of S ,ate
I.Death e. Other - Specify?
j. Other - Specify? I--
f. TOTAL Sum of lines 8a through 8e
k. TOTAL- Sum of lines 3a through 3j 9. Length of sontence
4. Parole population on a. Less than one year
December 31, 1985 • b. One year or more (Note: This figure should equal line 1
plus line 2e minus line 3k.J c. Not known
Not@: The total number in items 4, 5c, 69, 7d, 8f, and 9d should be identical. d.TOTAL Sum of lines 9a through 9c
FOAM CJ.7 (1·22·861 Page 3
Parole ill 1985 103
------------~~-~-------------------,
10. Coverage of reported data
Does your State have adult parolees other than those reported in this survey (e.g., parolees supervised by county parole authorities or inactive cases for which you could not ,aport) 7
D Ves - Explain M
--. DNQ
11. Reporting period
Does the information reported in this survey represent the calendar year ending on December 31, 1985?
DVes Month Year
D No - Specify when your reporting year ends ~ '" 12. Absconders
a. CUrrent absconders are -
D Included in your total year end parole population (items 1 and 4) D Terminated from parole (omitted from items 1 and 4) D Placed indefinitely on an inactive case load (included in items 1 and 4) D Placed indefinitely on an inactive case load (omitted from items 1 and 4) D Other - Describe
b. Of the absconders reported in item 8c, how many were changed to absconder status during 1985?
13. Data supplied by
Name Title Date T31'3phone Area code rumber jExtenslon
14. Remarks
Page 4 FOAM CJ·7 (1·22·86)
104 Correctional Popl~lations ill the United Stqtes, 1985
Tables
7.1 Status of death penalty, by jurisdiction, 1985 106
Prisoners under sentence of death, December 31, 1985
7.2 Movement of all prisoners under sentence of death, by race, 1985 107
7.3 Movement of women under sentence of death, by race, 1985 108
7.4 Movement of Hispanic prisoners under sentence of death, 1985 108
7.5 Time between sentencing and the yearend for prisoners under sentence of death, by race, 1985 109
7.6 Age of prisoners under sentence of death, by race, 1985 111
7.7 Level of education completed by prisoners under sentence of death, by race, 1985 113
7.8 Marital status at time of imprisonment of prisoners under sentence of death, by race, 1985 115
7.9 Legal status at time of capital offense for prisoners under sentence of death, by race, 1985 117
7.10 Felony history of prisoners under sentence of death, by race,1985 119
Prisoners received from court, January I-December 31, 1985
7.11 Age of prisoners received from court under sentence of death, by race, 1985 121
7.12 Level of education completed by priGoners received from court under sentence of death, by race, 1985 123
7.13 Marital status at time of imprisonment of prisoners received from court under sentence of death, by race, 1985 124
7.14 Legal status at time of capital offense for prisoners received from court under sentence of death, by race, 1985 125
7.15 Felony history of prisoners received from court under sentence of death, by race, 1985 127
Capital punishment in 1985
Prisoners removed from death row Jnnuary I-December 31, 1985
7.16 Status of prisoners removed from death row, by race, 1985 128
7.17 Means of removal for all prisoners who left death row, by race, 1985 129-;;0 .
7.18 Time between sentencing and removal for prisoners removed from death row, by race, 1985 131-32
7.19 Age of prisoners removed from death row, by race, 1985 133-34
7.20 Level of education completed by prisoners removed from de lIth row, by race, 1985 135
7.21 Marital status at time of imprisonment of prisoners removed from death row, by race, 1985 136
7.22 Legal status at time of capital offense for prisoners removed from death row, by race, 1985 137-38
7.23 Felony history of prisoners removed from death row, by race, 1985 139-40
Prisoners executed, 1930-85
7.24 Prisoners executed under civil authority in the United States, by year, region, and jurisdiction, 1930-85 141
7.25 Prisoners executed under civil authority in the United States by race and offense, 1930-85 142
Quesgonnaires 143, 145, 147
Capital Punishment in 1985 105
Table 7.1. Status of death penalty, by juri.'ldiction, 1985
Jurisdictions with death penalty law
With no executions, 1985
Alabama Arizona Arkansas California Colorado Connecticut Delaware Idaho Illinois Kentucky Maryland Mississippi Missouri Montana Nebraska New Hampshire New Jersey New Mexico North Carolina Ohio Oklahoma Oregon Pennsylvania South Dakota Tennessee Utah Vermont Washington Wyoming
With executions, 1985
Florida Georgia Indiana Louisiana Nevada Sou th Carolina Texas Virginia
Number of executions
3 3 1 1 1 1 6 2
Jurisdictions that changed a death penalty law in 1985
Arizona Arkansas Colorado Connecticut Montana Nevada New Jersey Texas Virginia
106 Con'ectional Populations in 1M United States, 1985
Jurisdictions without death penalty law
Alaska DlsL of Columbia Hawaii Iowa Kansas Maine Massachusetts Michigan Minnesota New York North Dakota Rhode lsland Wisconsin West Virginia
ll'able 7.2. Movement of all prisoners under sentenee of death, by race, 1985
Prisoners under sentence of deatha
Under death sentence Received fro~ Executtd Dea th sen tence Ii- Under death sentence Regions 12/31/84 court in 1985 in 1985 IlDved in 1985 ,c 12/31/85
and States Total Black White Otherb Total Black White Total Black White Total Black White Total Black White Otherb
U.s. total 1,420 598 806 16 273 111 160 18 7 11 84 30 52 1,591 672 903 16
Note: The following States with death bTwo American Indian prisoners were the appropriate totl'.ls. No person of a race penalty sta tutes reported no prisoners received from court under sentence of other than black or white was executed. under sentence of death in 1984 or 1985: death In 1985. Both were convicted in ~he reasons other than execution for Connecticut, New Hampshire, Vermont, North Carolina. Two American Indian persons leaving death row included South Dakota, and Oregon. prisoners, one each in Oklahoma and dismissal of indictment, reversal of 8All prisoners under sentence of death in Arizona, were relieved of a death judgment, commutation, resentencing, 1985 had been convicted of murder. sentence. Their numbers are included in order for a new trial, and death.
L_. _~ ______ . Capital Punishment in 1985 107
Table 7.3. Movement oC women under sentence oC death, by race, 1985
Women under sentence of dea the
Under death Received Death sentence Under death sentence from court remov(1d sentence
Regions 12/31185 during: 1985b,c during 1985c,d 12/31/85
and States 'rotal Black White Otherc Total White Total White Total Black White Otherc
Note: The jurisdictions that do not appear yearend 1985 and not of the white or black race had no women under sentence of death In was an American Indian who had entered prison 1984 or 1985. ~fore 1985. aNo women were executed in 1985. he reasons other than execution for persons bAll 'Nomen received from court under a leaving death row included dismissal of sentence of death in 1985 had been convicted indictment, reversal of judgment, commutation, of murder. resentencing, and order of a new trial. cThe sole woman under sentence of death at
Table 7.4. Movement oC Hillpanic prisoners under sentence of death, 1985
Hiseanic prisoners under sentt.llce of dea the
Under death Received Death sen- Under death Regions sentence from court tence remOted sentence and States 12/31/84 during 1985 Executed during 1985 12/31/85
Note: Hispanic prisoners may be of any geath in 1985 had been convicted of murder. race. Jurisdictions that do not appear had no The reasons other than execution for persons Hispanic prisoners under sentence of death In leaving death row included dismissal of 1984 or 1985. indictment, reVersal of judgment, commutation, HAll Hispanic prisoners under sentence of resentencing, order for a new trial, and death.
108 COlrectional Populations in the United States, 1985
Table 7.5. Time between sentencing and the yearend for prisoners under sentence of death, by race, 1985
Prisoners under sentence of death
Regions Less than 12-23 24-35 36-47 48-71 More than Median num-and Stat!!s Total 12 months months months months months 71 months ber of months
Note: The following States with death *Medians were not calCUlated on fewcr than 5 penalty statutes reported no prisoners on cases. death row in 1985: Connecticut, New a"Other prisoners" incbdes 11 American Indians Hampshire, Vermont, South Dakota, and and 5 Asians. Oregon.
110 Correctional Populations ill the United S'wtI!S, 1985
Table 7.6. Age of prisoners under sentence of death, by race, 1985
Prisoners under sentence of death
Regions All Under 20 to 25 to 30 to 35 to 40 to 5S years and States ages 20 years 24 years 29 years 34 years 39 years 54 years and older
Note: The following States with death Oregon. penalty sta tutes reported no prisoners under ·"Other prisoners" includes 11 American Indians sentence of death in 1985: Connecticut, New and 5 Asians. Hampshire, Vermont, South Dakota, and
112 Correctional Populations in the United States, 1985
Table 7.7. Continued
Prisoners under sentence of death
Regions Total 7th grade 8th 9th to 12th Any Not and States number or less grade 11th grade grade college reported
White prisoners
U.S. total 903 86 92 239 271 89 126
Northeast 34 1 6 12 6 0 9 New Jersey lil 0 2 2 2 0 4 Pennsylvania 24 1 4 10 4 0 5
Note: The following States with death Oregon. penalty statutes reported no prisoners under .IIOther prisoners" includes 11 American Indians sentence of death in 1985: Connecticut, New and 5 Asians. Hampshire, Vermont, South Dakota, and
114 Correctional Populations 111 tk ,I United States, 1985
Table 'l.8. Marital status at time of imprisonment of prisoners under sentence of death, by race, 1985
Prisoners under sentence of death
Regions Divorced or Never Not and States Total Mlirried separated Widowed married reported
West 7 1 0 0 5 1 Arizona 1 0 0 0 1 0 California 5 1 0 0 3 1 Washington 1 0 0 0 1 0
Note: The following states with death ·"Other prlsonersll Includes 11 American Indian penalty sta tu tes reported no prisoners on and 5 Asiail prisoners. death row in 1985: Connecticut, New Hamp-shire, Vermont, South Dakota and Oregon.
116 Con'ectional Populations in the United States, 1985
Table 7.9. Legal status at time of capital offense for prisoners under sentence of death, by raile, 1985
Prisoners under sentence of death who had the following: legal statuses when the:l committed ca2ital crimes
Regions Not charged with or sen- Charged with Under sentence for another crime Othera
Legal sta tus and States tenced for another crime another crime Total On probation On parole Escaped In prison not reported
Note: 'rhe following States with death Oregon. b"Other prisoners" includes 11 American penalty statutes reported no prisoners on a"Other" inclUdes mandatory conditional Indians and 5 Asians. death row in 1985: Connecticut, New release, bail, temporary leaves, wo,'k Hampshire, Vermont, South Dakota, and release or furlougll, and jail.
118 Correctional PopUlations in the United States, 1985
Table 7.10. Felony bistory of prisoners under sentence of death, by race, 1985
Prisoners under sentence of death
With I2rior felon:i convictions With Regions Total with Criminal Other Type of ofren- no prior Felony history and States Total prior felonies homicide offenses ses unreported felonies not reported
With I2rior feJon:t convictions With Regions Total with Criminal Other Type of offen- no prior Felony history and states Total prior felonies homicide offenses ses unreported felonies no t reported
Note: The following States with death penalty ·"Other pri~onersll includes 11 American Indians statutes reported no prisoners under sentence and 5 Asians. of death !n 1985: Connecticut, New Hamp-shire, Vermont, South Dakota, an~ Oregon.
120 Correctional Populations in the United States, 1985
Note: The following States with death *"All prisoners" includes American Indian penalty statutes reported receiving from prisoners as well as whites and blacks, NOl'th court no prisoners under sentence of dea th in Carolina sentenced to death two American 1985: Connecticut, New Hampshire, Indian prisoners, one of whom was between 40 Vermont, Delaware, Nebraska, South Dakota, lind 54 years old and the other, older than 54 Colorado, Oregon, and Wyoming. years.
122 Correctional Populations in the United States, 1985
Table 7.12. Level of education completed by prisoners received from court under sentence of dea.th, by race, 1985
PrL~oners received from court under sentence of death
Regions Total 8th grade or less 9th to 11th gra-le 12th grade An:;£ coll~e Not reQorted
and states Total Blacl< White Total Black White Total Black White Total Black White Total Black White Total Black White
Note: The following States with death Hampshire, Vermont, Nebraska, Delaware, prisoners as well as whites and blacks. penalty statutes reported receiving from Colorado, New Mexico, Oregon, and North Carolina sentenced to death in 1985 court no prisoners under a sentence of Wyoming. two American Indian prisoners, both of death In 1985: Connecticut, New >!1J'he totals include American Indian whom had gone to school less than 8 years.
Capital Punishment in 1985 123
Table 7.13. Marital status at time of imprisonment of prisoners received from court under sentence of death, by race, 1985
Prisoners received from court under sentence of death
Regions Total Married Dlvorced/se~arated Widowed Never married Status unreeorted
and States Total Black White Total Black White Total Black White Total Black White Total Black White Total Black White
Note: The following States with death Vermont, Nebraska, Delaware, Colorado, North Carolina sentenced to death in 1985 penalty statutes reported receiving from New Mexico, Oregon, and Wyoming. two American Indian prisoners. One was a court no prisoners under sentence of dea th *The totals include American Indian widower, and the other was separated or In 1985: Connecticut, New Hampshire, prisoners as well as whites and blacks. divorced.
124 Correctional Populations in the United States, 1985
, ________________ ~ ____ . ___ c
Table 7.14. Legal status at time oC capital oflense Cor prisoners received from court under sentence of death, by race, 1985
Prisoners received from court who had the following legal statuses when the:z: committed ca2ital crimes
Regions Not charged with or sen- Charged with Under sentence for another crime Legal sta tus and States tenced for another crime another crime Total On proba lion On parole Escaped In prison Othera not reported
Prisoners received from court who had the following legal statuHs when the:i committed caEital crimes
Regions Not charged with or sen- Charged with Under sentence for another crime Legal sta tUB and States tenced for another crime another crime Total On proba tion On parole Escaped In prison Othera not reported
Note: The following States with death a"Other" includes mandatory conditional North Carolina sentenced to death in 1985 penalty statutes reported receiving from release, ball, temporary leaves, Work two American Indian prisoners against court no prisoners under sentence of death r,elea.se or furlough, and jail. whom no charges were pending when they in 1985: Connecticut, New Hampshire, "All prisoners" includes American Indian committed murder. Vermont, Nebraska, Delaware, Colorado, prisoners as well as whites and blacks. New Mexico, Oregon, and Wyoming.
126 Correctional Populations in the United States, 1985
Table 7.15. Felony history of prisoners received from court under sentence of death, by race, 1985
Prisoners received from court under sentence of death
With erior felon:t convictions
Total with Criminal Type of offen- Without Felony history
Regions erior felonies homicide Other offenses ses unreeorted erior felonies not reeorted __
and States Total Black White Total Black White Total Black White Total Black White Total Black White Total Black White
Note: The following States with death New Mexico, Oregon, and Wyoming. two American Indian prisoners. One had penalty statutes reported receiving from *The totals include American Indian previously been convicted of homicide, and court no prisoners under sentence of death prisoners as well as whites and blacks. the other had been convicted of a felony or in 1985: Connecticut, New Hampshire, North Carolina sentenced to death in 1985 felonies that were not homicide. Vermont, Nebraska, Delaware, Colorado,
Capital Punishment in 1985 127
Table 7.16. Status oC prisoners removed from death row, by race, 1985
Prisoners removed from death row
Serving Awaiting Awaiting
Regions life sentence Died new trial new sentence Charges droeeed
and States Total Total Black White Total Black White Total Black White Total Black White Total Black White
Note: The following States with death Wyoming. prisoners as well as whites and blacks. An penalty statutes reported no prisoners 4 The appropriate totals include one white American Indian prisoner In Oklahoma was leaving death row in 1985: Connecticut, prisoner who was removed from Alabama's serving a life sentence after removal from New Hampshire, New Jersey, Vermont, death row In 1985 and who had an unknown death row in 1985. An American Indian South Dakota, Colorado, Montana, New ~tus. removed from death row in Arizona awaited Mexico, Oregon, Washington, and he totals include American Indian a new trial.
128 Con'ectional Populations in the United States, 1985
Table 7.17. Means or removal ror all prisoners who left death row, by race, 1985
Prisoners removed from death row
Death by Regions other than Sentence Sentencg Convictbon and States Total Executed execution commuted8 vacated vacated
Note: No death penalty statute, in whole or in bFurther legal proceedings may have followed part, was struck down in 1985. Such court the vacating of sentences and of convictions rulings could have resulted in removing from and may have resulted in new sentences of death row affected groups of prisoners. death. The following States with death penalty stat- cOklahomll and Arizona each vacated the utes reported no prisoners leaving death row conviction of an American Indian prisoner under in 1985: Connecticut, New Hampshire, New ~entence of death. Jersey, Vermont, South Dakota, Colorado, One inmate under sentence of death in Ohio Montana, New Mexico, Oregon, Washington, committed suicide; one each in Missouri and and Wyoming. Tennessee was murdered by another inmate, and tlCommutation changed sentences from one in Louisiana died of natural causes. execution to life in prison or terms of years.
130 Correctional Populations ill the United State~ 1985
Table 7.18. Time between sentencing and removal for prisoners removed from death row, by race, 1985
Prisoner~ removed from death row
R!!gions Less than 12 to 23 24 to 34 35 to 47 48 to 71 More than and States Total 12 months months months months months 71 months
Note: The following States with death ·"All prisoners" includes American India,} penalty statutes reported no prisoners leaving prisoners as well as whites and blacks. death row in 1985: Conneclicut, New Hamp- Oklahoma removed one American Indian shire, New Jersey, Vermont, illinois, Missouri, prisoner from death row within 36 to 47 months; South Dakota, Colorado, Montana, New Arizona removed one within 12 to 23 months. Mexico, Oregon, Washington, and Wyoming.
132 Correctional Populations in the United States, 1985
Table 7.19. Age of prisoners removed from death row, by race, 1985
Prisoners removed from death row
Regions All 20 to 25 to 30 to 35 to 40 to 55 years and states ages 24 years 29 years 34 years 39 years 54 years and older
Note: The following States with death *"All prisoners" Includes American Indian penalty statutes reported no prisoners leaving prisoners as well as whites and blacks. death row in 1985: Connecticut, New Oklahoma and Arizona each removed from Hampshire, New Jersey, Vermont, South death rowan American Indian prisoner who was Dakota, Colorado, Montana, New Mexico, between 30 and 34 years old. Oregon, Washington, and Wyoming.
134 Con'ectional Populations in the United States, 1985
Table 7.20. Level of education completed by llrisoners removed from death row, by race, 1985
Prisoners removed from death row
Regions Total 8 th grade or less 9th to 11th grade 12th grade Anl college Not rel20rted
and states Total Black White Total Black White Total Black White Total Black White Total Black White Total Black White
Note: The following States with death Colorado, Montana, New Mexico, Oregon, American Indian prisoner removed from penalty statutes reported no prisoners Washington, and Wyoming. death row. The Oklahoma man had leaving death row in 1985: Connecticut, *The totals include American Indian completed less than 9 years of school, and New Hampshire, New Jersey, Vermont, prisoners as well as whites and blacks. the Arizona prisoner had graduated from lll1nois, Missouri, South Dakota, Oklahoma and Arizona each reported an high school.
Capital Punishment in 1985 135
Table 7.21. Marital status at time of imprisonment of prisoners removed from death row, by race, 1985
Prisoners removed from dee th row
Divorced Regions Total Married or sel2ara ted Widowed Never married Not rel20rted
and States Total Black White Total Black White Total Black White Total Black White Total Black White Total Black White
Note: The following States with death Illinois, Missouri, South Dakota, Colorado, prisoners as well as whites and blacks. penalty statutes reported no prisoners Montana, New Mexico, Oregon, Washing- Oklahoma and Arizona each removed from leaving death row in 1985: Connecticut, ton, and Wyoming. death rowan American.Indian prisoner who New Hampshire, New Jersey, Vermont, *The totals include American Indian had never married.
136 Correctional Populations in the United States, 1985
Table 7.22. Legal status at time oC capital olCense for prisoners removed from death row, by race, 1985
Prisoners removed from death row who had the following legal statuses when the ca[!ital crimes occurred
Regions Not charged with or sen- Charged with Under sentence for another crime Legal sta tus and States Totala tenced for another crime another crime Total'" On probatIOn On parole Escaped In prison not reported
Prisoners remc .. ed from death row who had the followi[!g legal statuses when the cal2ital crimes occurred
Regions Not charged with or sen- Charged with Under sentence for another crime Legal sta tus and States Total tenced for another crime another crime Total On probation On parole Escaped In prison not reported
Note' The following States with death allAll prisoners" includes American Indian an American Indian who was on probation at penalty statutes reported no prisoners prisoners as well as whites and blacks. the time of the capital offense. leaving death row in 1985: Connecticut, Oklahoma removed from death rowan Alabama removed from death row a white New Hampshire, New Jersey, Vermont, American Indian who was on parole when prisoner convicted of a murder that South Dakota, Colorado, Montana, New the murder, for which he was convicted, occurred while he was on work release Mexico, Oregon, Washington, and occurred. Arizona removed from death row from prison. He is included in the total. Wyoming.
138 Correctional Populations in the United States, 1985
Table 7.23. Felony history oC prisoners removed from death row, by race, 1985
Prisoners removed from death row
With I2rior felon:i convictions With Regions Total with Criminal Other Type of offen- no prior Felony history and States Total prior felonies homicide offenses ses unreported felonies not reported
With I2rior felon:i convictions With Regions Total with Criminal other Type of offen- no prior Felony history and States Total prior felonies homicide offenses ses unreported felonies not reported
Note: The following States with death ·"All prisoners" includes American Indian penalty statutes reported no prisoners leaving prisoners as well as whites and blacks. death row in 1985: Connecticut, New Oklahoma and Arizona each removed from Hampshire, New Jersey, Vermont, South death rowan American Indian prisoner with one Dakota, Colorado, Montana, New Mexico, or more past felony convictions that were not Oregon, Washington, and Wyoming. murder.
140 Correctional Populations in the United States, 1985
Table 7.24. Prisoners executed undcr civil authority in the United States, by year, region, and jurisdiction, 1930-1985
Regions and 1980- 1975- 1970- 1965- 1960- 1955- 1950- 1945- 1940- 1935- 1930-jurisdictions Total 1985 1984 1983 1979 1974 1969 1964 1959 1954 1949 1944 1939 1934
2. Inmate nome z El ~o k } Skip to item II 3 n nown Last iFir,! iMiddle lOb. Were ony of these convictions for criminal homicide?
I linltlal I I I 0 Yes - Specify (e.g .. murder. attempted murder,
involuntary manslaughter, vehicular 3. Sex (Mark (X) appropriate box) manslaughter)
IOMale z 0 Female
20No
40. Race (Mark (X) appropriate box) 3D Unknown
10 White 11. Date of original conviction for capital offense z D Black Month Year 3D American Indian or Alaskan Native [IJ-[JJ 4 C Asian or Pacific Islander 5 D Other - Speci f~ 12. Date of first sentence for capital offense
Month Year
b. Hispanic origin (Mark (X) appropriate box) OJ-m 10 Hispanic 130. Inmate status an December 31, 19_ 2 C Non-Hispanic (Mark (X) appropriate box) 3 C Not known 1 D Under sentence of death - Contirue with item b
5. Date of birth 2 D Sentence of death removed - Skip to
items c and d Month Year b. Was this inmate an escape or at a mental
OJ-OJ hospital an December 31? Month Year
6. Capital offense(s) for which imprisoned I D Yes, on escape - Enter CD OJ
month and year of escape. • • -CMurder 2DYes, ata mental hospital-CRape Enter month and year of CD CD D Kidnap transfer to mental hospital • • -
Q Other - Specify aONo No further information required for this inmate
c. Reason for inmate's removal from under ,entence of
I u;i~~Ucy I I I I I I I death (Mark (X) appropriate box) Month Year "-
7. Marital status at time of first imprisonment CD-IT] for capital offense I D Executed ••••••••••••••
1 C Married -Include common law marriage CD-CD 20 Divorced or separated 20 Deceased by other causes •••
3 CWidowed 3 D Capital sentence declared 4 C Never married unconstitutional by State CD-CD 5 l~ No.t known
or U.S. Supreme Court •••••
8. Highest year of education completed at time 40 Sentence commuted ••••••• CD-CD of first imprisonment for capital offense 5 D Conviction affirmed, sentence [IJ-[D Ole 7th grade or less 07 C I st year of college
overturned by appellate court
02 D8th grade 08 L-= 2nd year 6 D Conviction and sentence OJ-OJ overturned by appellate court
03D9th grade 090 3rd year 7 D Other - Specify)!. 040 10th grade 100 4th year CD-IT] 05 C 11th grade 1 I 0 More than 4 ycars 06 C 12th grade - of college e D Information not available at this office
(Include GED) 120 Not known d. Current status of Inmate removed from sentence of .. -
9. Legal status at time of capital offense death (Mark the one box showing the inmate's status
(Mark (X) appropriate box) as of the day you fill out this report. i.e., TODAY)
NOT UNDER SENTENCE I 0 Under new sentence of
I 0 No charges pending 2 C Charges pending 2 D Awaiting retrial to determine guilt
UNDER SENTENCE 3 D Awaiting resentencing only (guilt affirmed)
3 c:: On probation 40 Found not guilty in retrial
4 C On parole 50 All charges on capital offense dropped
5 [-: On esc~pc 60 Other - SpecifYjl
6 [~ Imprisoned 7 C1 Other - Specify legal statu"" 7 0 No action has been taken since removal
from sentence of death 80 Information not ava! lable at this office
e C UNKNOWN 9 D Dead
Capital Punishment in 1985 143
INSTRUCTIONS
Please complete one card for each person who (1) entered your State's correctional system under sentence of death at any time during the report year, or (2) had received a sentence of death in a previous year but was not previously reported. Attempt to answer all items.
Item b. Card of Cards - Complete this item to insure proper accounting of all persons under sentence of death in your correctional system who have not been previously reported.
Example: If you are reporting 4 persons who were given a sentence of death during the report year, or had not been previously reported, and this card relates to the third person reported, you would enter: Card 3 of 4 Cards
Item 4a. Race
(1) White - A person having origins in any of the original peoples of Europe, North Africa, or the Middle East.
(2) Black - A person having origins in any of the black racial groups of Africa.
(3) American Indian or Alaskan Native - A person having origins in any of the original peoples of North America, and who maintains cultural identification through tribal affiliation or community recognition.
(4) Asian or Pacific Islander - A person having origins in any of the original peoples of the Far East, Southeast Asia, the Indian Subcontinent, or the Pacific Islands. This area includes, for example, China, India, Japan, Korea, the Philippine Islands, and Samoa.
(5) Other - Any other race not covered by the above categories. Please specify the race in the space provided.
Item 4b. Hispanic Origin - Hispanics are defined as those having an ethnic origin or background in Central America, South America, Mexico, Cuba, Puerto Rico, or Spain.
Item 5. Date of Birth - Enter two digits for month (January=Ol, February=02, etc.) and last two digits of year. •
Item 6. Capital offense for which imprisoned -Mark all and only those offenses for which capital punishment was originally levied.
Item 7. Marital status at time of first imprisonment for capital offense - "Time of first imprisonment" refers to the inmate's original time of arrival at
prison after his first sentencing to death. Separated does not include separation for reason of imp risonment.
Item 8. Highest year of education completed at time of first imprisonment for capital offense -Time frame as in Item 7 above. Include Graduate Equivalent Degree (GED) as "12th grade."
Item 9. Legal status at time of capital offense -If the person was known to be free in all States with no charges pending at the time of the offense, mark "Not under sentence - no charges pending."
If the person was charged but not sentenced, e.g., out on bail, mark "Not under sentencecharges pending."
If person was under sentence (not merely charged) at time of offense, mark "On probation," "On parole," "Imprisoned," "On escape," or "Other" as appropriate.
Item 11. Date of original conviction for capital offense - Enter the first month and year (digits as in item 5) in which the person was found guilty of the capital offense. DO NOT enter the date of appeal rejections or prison admission.
Item 12. Date of first sentence for capital offenseEnter the month and year (digits as in item 5) after the person's original conviction in which inmate was first sentenced to death.
Item 13a. Inmate status on December 31, 19-Indicate whether or not the inmate was under sentence of death at the end of the report year.
Item 13b. If inmate was under sentence of death on December 31, indicate if the inmate was on escape or at a mental hospital. Enter the month and year of escape or transfer to mental hospital.
Item 13c. Manner of removal from sentence of death - Complete this item only if sentence of death was removed during the calendar year. Mark the box which most accurately describes how the inmate was initially removed from sentence of death.
Item 13d. Current status of inmate removed from sentence of death - Mark the one box which most accurately shows the inmate's legal status as of THE DATE THIS REPORT IS COMPLETED. If "Under new sentence" enter new sentence.
144 Correctional Populations in the United States, 1985
'. (Please correct any error in name and address including ZIP code)
FROM THE DIRECTOR BUREAU OF THE CENSUS
The Bureau of the Census, at the request of the Bureau of Justice Statistics, annually collects data concerning the status of state and Federal death penalty statutes. The Bureau collects these data under the authority of Title 42, United States Code, Section 3732. The questionnaire on the reverse side of this letter relates to the death penalty laws in your jurisdiction during the period January 1, 1985 through December 31, 1985. Please complete and return this questionnaire by February 18, 1986 to expedite timely publication of these data.
Your response to this request is voluntary and there are no penalties for refusing to supply the information. Your cooperation is extremely important to help us assemble an accurate picture of capital punishment in the United States.
If you need assistance in completing the questionnaire, please call Arlene Rasmussen collect on (301) 763-2061. We will continue to mail publications of the final reports to you as they become available.
Thank you for your past participation in this endeavor.
Sincerely,
JOHN G. KEANE
Capital Punishment in 1985 145
1. National Prisoner Statistics (NPS) records I o No - Go to Question 4 show that at the end of 1984 your State had I
DYes I NO CAPITAL PUNISHMENT STATUTE. At I any time in 1985 was such a law I Effective date I Citation established? I
I I I Please provide a copy of the law, if possible.
2. During 1985, was that law explicitly struck I I o No - Go to Question 4 by the U.S. or State Supreme Court? I
DYes I I o Wholly struck o By U.S. Supreme Court I o By State Supreme Court I r o By U.S. Supreme Court I o Partially struck I o By State Supreme Court I I Effective date 1 Citation I I I I Please provide ~ copy of the decision, if possible.
3. In the opinion of the Attorney General, I o All wer<:l effectively removed from under sentence of death as of the what was the impact on persons sentenced I decision date; that is, leg .. lly these persons could not be executed I under your State's statute? I under that sentence.
I o None were effectively removed from under sentence of death as of I the decision date; that Is, legally these persons could still possibly I be executed under that sentence, I o Some were effectively removed from under sentence of death as I of the decision date while others were not; that is, legally some I could still possibly be executed under that sentence while others I I could not.
4. As of December 31, 1985, does your State I DNa CONSTITUTION specifically prohibit I DYes capital penalties? I
I .-1 Date JCitation I I
5. As of December 31, 1985, yOUi' State - I o Had a capital punishment statute I I o Hau no capital punIshment statute - Go to item 10 I
6. For what offense(s) carl the death penalty I I
be imposed in your State? I I I I I I I
7. Doea your State provide for automatic I I DYes appeal upon imposition of the death I
penalty, i.e., irrespective of defen·.1ant's I o No wishes? I I
8. What is the minimum age at which persons I Age I
can be sentenced to death in your State? I I
9. What methods of execution are authorized I
in your capital punishment statute? I ! I I I I I
10. Report Name and title Telephone Date completed submitted Area code Number Extension by
146 Con'ectz'onal Populations in the United States, 1985
FORM NPS-8C 18·26·85}
NOTICE - These data are being collected in accordance with the 1973 Crime Control Act.
U.S. DEPARTMENT OF COMMERCE BUREAU OF THE CENSUS
ACTING AS COLLECTING AGENT FOR THE BUREAU OFJUSTICE STATISTICS
U.S. DEPARTMENT OF JUSTICE
STATUS OF DEATH PENALTY STATUTES
STATUTE IN FORCE, 1984
NATIONAL PRISONER STATISTICS
1985 . , r.' .... : AETURN .- . BUREAU OF THE CENSUS
, . ~ ~. ~ (Please correct any error in name and address including ZIP codel
FROM THE DIRECTOR BUREAU OF THE CENSUS
The Bureau of the Census, at the request of the Bureau of Justice Statistics, annually collects data concerning the status of state and Federal death penalty statutes. The Bureau collects these data under the authority of Title 42, United States Code, Section 3732.
The questionnaire on the reverse side of this letter relates to the death penalty laws in your jurisdiction during the period January 1, 1985 through December 31, 1985. Please complete and return this questionnaire by February 18, 1986 to expedite timely publication of these data.
Your response to this request is voluntary and there are no penalties for refusing to supply the information. Your cooperation is extremely important to help us assemble an accurate picture of capital punishment in the United States.
If you need assistance in completing the questionnaire, please call Arlene Rasmussen collect on (301) 763-2061. We will continue to mail publications of the final reports to you as they become available.
Thank you for your past participation in this endeavor.
Sincerely,
JOHN G. KEANE
Capital Punishment in 1985 147
1. National Prisoner Statistics (NPS) records D No - Go to Question 3 show that at the end of 1984 your State had
DYes a capital punishment statute. During 1985, was that law explicitly struck in whole or In o Wholly struck D By U.S. Supreme Court part by the U.S. or the State Supreme Court? D By State Supreme Court
D Partially struck D By U.S. Supreme Court D By State Supreme Court
I Effectivll date Citation
I I Please provide a copy of the decision, if possible.
2. In the opinion of the Attorney General, I D All were effectively removed from under sentence of death as of the what was the impact on persons sentenced I decision date; that is, legally these persons could not be executed
I under that sentence. under your State's statute? I I D None were effectively removed from under sentence of death as of I the decision date; that is, legally these persons could still possibly I be executed under that sentence. I D Some were effectively removed from under sentence of death as I of the decision date while others were not; that is, legally some I could still possibly be executed under that sentence while others I could not.
3. During 1985, was the capital puntshment I o Revised or modified statute: I
I I Effective date Citation
(Mark (X) all that apply) I I I r Please provide a copy of the revised sections, if possible. I If revised more than once, please specify I
D Replaced (entirely new statute)
I Effective date Citation
Please provide a copy of the new statute, if possible.
D None of the above
4. As of December 31, 1985, your State - D Had a capital punishment statute
1 D Had no capital punishment statute - Go to item 9
5. For what offense(s) can the death penalty I I be imposed in your Stato 1 I I I 1
6. Does your State provide for automatic I I DYes appeal upon imposition of th" death I
penalty, i.e., irrespective of defendant's I D No wishes? : 7. What is the minimum age at which persons I Age
I can be sentenced to death in your State? I
I
8. What methods of execution are authorized I in your capital punishment statute? I
I I I
9. Report Name and title Telephone Date completed submitted Area code Number Extension by
FOAM NPS·8C (8·26·851
148 Correctional Populations in the United States. 1985
'PH
Abscond~, from parole 6.5, 6.3 - from probation 3.4, 3.6
Accldcnts in prison, cause of death, by sex 5.17
Admissions, to jail 2.5 - to prison, by type of admissions
5.100, men 5.110, women 5.128 -. to death row 7.2
Age, jail Inmates 2.1, 2.2, 2.5, 7.3 - prisoners under sentence of dea th
7.5,7.11,7.19 Alaskan natives (see "Race") AmerIcan Indians (see "Race") Appeals, automatic, required in capital
punishment cases 7.1
Bl&cks (see "Race")
capacity, Jails 2.6 Capital punishment 7.1-7.25
- age of prisoners 7.6, 7.11, 7.19 - criminal history of prisoners,
by race 7.10, 7.15, 7.23 • - educational background of pris
oners, by race 7.7, 7.12, 7.20 -legal status at time of capital
crime, by race 7.9,7.14,7.22 - marital status of prisoners, by
race 7.8,7.13,7.21 - prisoners received on death row
7.11-7.15 - prisoners removed from dea th row
7.16-7.23 - prisoners under sentence of death,
by race 7.2-7.10 - time that prisoners spent on death
row, by race 7.5,7.18 - women on death row, by face
1972-85 7.3 Commutations of sentences 5.13,
men 5.14, women 5.15 COmpletion, parole 6.1, 6.5
-probation 3.1, ~.6 Conditions of continement, jails 2.9 Correctional sUpervision, total under
Juvenile offeoders (see also "Youthful otfender'? 4.2
- in jaIl 2.1, 2.2, 2.5
Legal status, time of capital offense, by race 7.9, 7.14, 7.22
Marital status, prjsoners under sentence of death, by race 7.7,7.12, 7.20
~Ien, deaths in prison, by cause 5.17 - in jail 2.1,2.2,2.3,2.4,2.5 - in prL,oo, by Sta Ie and race 5.7 - on parole 6.6 - on probation 3.7 - number under correctional super·
vision 1.2 - prison admiSSions, by type and
State 5.11a - prison releases, by type and State
5.lIb - prisoners, by sentence length,
1984-85 5.2
- prisoners released, by type oC release 5.14
- violators ot parole, by status of sent~nce 5.16
Misdemeanors, probated sentences 3.10
Native Americans (see IIRacell)
otrense types, by probation 3.10 Overcrowding (see "Crowding")
Pucitic Islanders (see "Race II) Parole 6.1-S.8
- by Hispanic orIgin S.6 - by sex 6.1, 6.6 - by status of supervision 6.1, 6.3 - changes in population size,
- parole violators 5.16 Sex, by admissions to jon 2.5
- by parole 6.6 - by releases trom jail 2.5 - detention status in Jail 2.5 - jails holding prison Inmates
5.5 - offenders on probation 3.7 - prisoners, by State and race
5.7,5.8, 5.11a-l>, 5.12a-4> - prisoners, by State and sen
tence length men 5.2, women 5.3
- total number ot men and women under correctional supervision 1.2
Suicide, In jail 2.9 - men and women in prison
5.17 SUperVision, parole 6.3
- probation 3.4 Suspended sentences 3.3
Time on den tit row, by race 7.5,7.18
Transfers, parolees to another State S.S
- admissIons to prison 5.10n, men 5.U8, women 5.120
- releases from prison 5.10b, men 5.11b, women 5.12b
Warrants, released from parole 6.5
- released from probation 3.6 Whites (see "Race") Women, des ths In prLo;on, by
cnuse 5.17 -In jail 2.1, 2.2, 2.3,
2.4,2.5 - on death row, 7.3 - on parole 6.6 - on probation 3.7 - prisoners, by type oC admis-
sion 5.128 - prisoners, by sentence
length, 1984-85 5.3 - prisoners, by State and
race 5.8 - prisoners, by type of release
5.12b, 5.15 - violators or parole 5.16
YouthCul otfender status, definition 4.2
Index 149
.----_The 1986 Directory of Automated Criminal Justice Information Systems,_--,
If your company's market researchers want to know which Federal, State, and local criminal justice agencies are fully automated and what computer equipment is currently used, they need a copy of the Bureau of Justice Statistics' 1986 Directot)' of Automated Criminal Justice Information Systems. This one-of-a-kind index lists more than 1,000 computerized information systems being used by police, courts, corrections, and other criminal justice agencies across the United States.
Organized alphabetically by State, city, or county, the Directot)' is a reference guide to information systems that are operational or are being developed. Each entry lists the type of information system in place-whether it be police computer-aided dispatch or Prosecution Management Support System (PMSS). In addition, the Directory supplies information about the status of a system's applications and its statistical and communications capabilities, names hardware and software, and furnishes
key contact names, addresses, and telephone numbers of criminal justice agency administrators and data processing personnel with purchasing authority.
Never before have so many aspects of criminal justice database information systems been systematically compiled and reported. Five indexes help locate systems by jurisdiction, system name, system function, statistical topic, and central processing unit.
The Directot}', prepared by SEARCH Group, Inc., for the U.S. Bureau of Justice Statistics, is a major step in the Bureau's program to provide a CUlTent reference for data processing and criminal justice planners who are developing new systems or who are enhancing existing ones.
The 1986 Directory of Automated Criminal Justice Information Systems costs only $20.
-----------------------------------------------------------------.---------------------------~ Ordering information Yes! Please send me Systems (NCJ 102260).----
copy(s) of the 1986 Directory of Automated CriminalJustice 1nformation
To speed the delivery of your Directory, have your credit card ready and dial toll-free 800-732-3277.
Please print:
Name _____________________________ ___
Organization ______________________ _
Address _______________________ _
City _______________ State ____ _
ZIP ___ _ Telephone ____________ _
o Check this box if you want to be placed on the Bureau of Justice Statistics mailing list.
To order, fill out and return this form with your check or money order. PREPAYMENT IS REQUIRED. Mail to: Justice Statistics Clearinghouse/NCJRS
Department F-AEY Box 6000 Rockville, MD 20850
o Enclosed is a check or money order in the amount of $ . (Please make check payable to the Justice Statistics Clearinghouse/NCJRS.)
D Charge $ to my 0 VISA D MasterCard
Account number
Signature ________________________ _
Expiration date ___ _
Bureau of Justice Statistics reports (revised February 1988)
Call toll-free 800-732-3277 (local 301-251-5500) to order BJS reports, to be added to one of the BJS mailing lists, or to speak to a reference specialist in statistics r).t the Justice Statistics Clearinghouse, National Criminal Justice Reference Service, Box 6000, Rockville, MD 20350. Single copies of reports are free; use NCJ number to order. Postage and handling are charged for bulk orders of single reports. For single copies of multiple titles, up to 10 titles are free; 11-40 titles $10; more than 40, $20; libraries call for special rates.
Public-use (apes of BJS data sets and other criminal justice data are available from the Criminal Justice Archive and information Network, P.O. Box 1248, Ann Arbor, M I 48106 (313-763-5010).
National Crime Survey Criminal victimization In the U.S.:
crimes, NCJ'99643, 1/86 Reporting crimes to the police, NCJ-
99432, 12/85 Locating city, suburban, and rural
crime, NCJ-99535, 12/85 The risk of violent crime, NCJ-97119,
5/85 The economic cost of crime to Victims,
NCJ-93450, 4/84 Family Violence, NCJ-93449,4/84
BJS bulletins: Criminal victimization 1986, NCJ·
106989, 10/87 Households touched by crime, 1986,
NCJ'105289,6/87 The crime of ralle, NCJ-96777,3/85 Household burglary, NCJ-96021, 1/&5 Violent crime by strangers, NCJ-80829,
4/82 Crime and the elderly, NCJ·79614, 1/82 Measuring crime, NCJ-7571 0, 2/81
Series crimes: Report of a field test (BJS lechnlcal report), NCJ-l04615,4/87
Crime and older Americans Information package, NCJ-l 04569, $1 0, 5/87
Lifetime likelihood of victimization, (BJS technical report), NCJ-l042?4, 3/87
Teenage victims, NCJ·l03138, 12/86 Response to screening questions In the
National Crime Survey (BJS technical report), NCJ·97624, 7/85
Vlctlmlzatfon and fear of crime: World perspectives, NCJ-93872, 1/85
The National Crime Survey: Working papers, vol. I; Current and historical perspectives, NCJ-75374, 8/82 vol, II: Methodological studies, NCJ-90307,12/84
Issues In the measurement of victimization, NCJ-74682, 10/81
The cost of ne9I1gen;::e: Losslls from preventable household burglaries, NCJ·53527, 12/79
Rape Victimization In 26 American cities, NCJ-55878,8/79
Criminal victimization In ur.ban schools, NCJ·56396, 8/79
An Introduction to the National Crime Survey, NCJ-43732, 4/78
l.ocat victim surveys: A review of the Issues, NC'J-39973,8/77
Corrections BJS bulletins and speCial reports:
Capital punishment 1 986, NCJ-l06483, 9/87
Prisoners In 1986, NCJ·l04864, 5/87 Imprisonment In four countries, NCJ·
103967,2/87 Population density In State prisons,
NCJ-l03204,12/86 State and Federal prisoners, 1925-85,
102494, 11/86 Prison admlsssion and releases, 1983,
NCJ-l 00582, 3/86 Examining recidivism, NCJ-96501, 2/85 Returning to prison, NCJ-95700, 11/84 Time served In prison, NCJ-93924,6/84
Correctional populations in the U.S. 1985, NCJ-l 03957.1/88
1984 census of State adult correctional faCilities, NCJ-l05585, 7/87
Historical corrections statistics In the U.S., 1850-1984, NCJ·102529, 4/87
Prisoners in State and Federal Insltltutlens on Dec. 31, 1984, NCJ-10!3768,
3/87 Capital punishment 1984 (Ilnal), NCJ-
99562,5/86
1979 survey o/lnmates of Stale correctional facilities and 1979 census of Stale correctional/acilitles:
BJS speCial reports: The prevalence of Imprisonment,
NCJ·93657,7/85 Career patterns In crime, NCJ-88672,
6/83
BJS bulletinS: Prisoners and drugs, NCJ·87575,
3/83 Prisoners and alCOhol, NCJ·86223,
1/83 Prisons and prisoners, NCJ·80697,
2/82 Veterans in prison, NCJ'79232, 11/81
Census of /alls and survey of /all Inmales: Jail inmates,1986, NCJ-l07123,10f87 Jail Inmates 1985, NCJ·l 05586,7/87 The 1983 Jail census (BJS bulletin),
NCJ'95536,11/84 Census of jailS, 1978: Data lor
indIVIdual )alls, vols. HV, Northeast, North Central, South, West, NCJ-72279-72282,12/81
Profile of Jail Inmates, 1978, NCJ·65412. 2/81
Parole and probation BJS bulletins:
Probation and parole 1986, NCJ-108012,12/87
Probation and parole 1985, NCJ· 103683, 1/87
Setting prison terms, NCJ-76218, 8/83
BJS speCial reports: Time served in prison and on parole,
NCJ-l08544, 1/88 Recidivism of young parolees, NCJ-
104916,5/87
Parole In the U.S., 1980 and 1981, NCJ-87387,3/86
Characteristics of persons entering parole during 1978 and 1 979, NCJ· 87243,5/83
Characteristics of the parola population, 1978, NCJ·66479, 4/81
Children in custody: Public Juvenile facilities, 1985
(bulletin), NCJ-l02457, 10{86 1982-83 census of juvenile detention
Police employment and expenditure, NCJ'100117,2/86
Tracking offenders: The chlld Victim, NCJ-95785, 12/84
Tracking offenders, NCJ·91572, 11/83 Victim and witness assistance: New
State laws and the system's response, NCJ'87934,5/83
BJS data report, 1986, I'JCJ·l06679, 10/87
Sourcebook of criminal justice statistics, 1986, NCJ'l 05287.9/87
BJS annual report, IIsca11986, NCJ-103985,4/87
1986 directory of automated criminal jUP~lce information sytems, NCJ· ~,,;1260, 1/87,$20
Publications of BJS, 1971-84: A topical bibliography, TB030012,10/86, $17.50
BJS publications: Selected library In micrOfiche, 1971-84, PR030012,
10/86, $203 domeshc National survey of crime severity, NCJ-
96017,10/85 Criminal victimization of District of
Columbia residents and Capitol HIli employees, 1 982-83, NCJ·97982; Summary, NCJ·98567, 9/85
DC household victimization survey data base: Study implementation, NCJ·98595, $7.60 Documentation, NCJ·98596, $6.40 User manual, NCJ-98597, $8.20
How to gain access to BJS data (ilrochurej, BC'000022, 9/84
Report to the nation on crime and justice: The data, NCJ'87068, 10/83
BJS maintains the following mailing lists: • Drugs and crime data (new) • White-collar crime (new) • National Crime Survey (annual) • Corrections (annual) • Juvenile corrections (annual) • Courts (annual) • Privacy and security of criminal
history information and information policy
• Federal statistics (annual) • BJS bulletins and speCial reports
(apprOXimately twice a month) • Sourcebook of Criminal Justice
Statistics (annual) To be added to these lists, write to: Justice Statistics Clearinghouse/ NCJRS Box 6000, Rockville, MD 20850,
See order form on last page
To be added to any BJS mailing list, please copy or cut out this page, fill in, fold, stamp, and mail:
Name:
Title:
Organiza tion:
Street or box:
City, State, Zip:
Daytime phone number:
Interest in criminal justice (put your organization and title here if you used home address above):
PLEASE PUT ME ON THE MAILING LIST FOR:
o Justice expenditure and employment reports-annual spending and staffing by Federal/State/local governments and by function (police, courts, etc.)
o D
Computer crime reports-electronic fund transfer system crimes
Privacy and security of criminal history information and information policy-new legislation; maintaining and releasing intelligence and investigative records; data quality issues.
o Federal statistics-data describing Federal case processing, from investigation through prosecution, adjudication, and corrections
D Juvenile corrections reports-juveniles in custody in public and private detention and correctional facili ties
o o
o
BJS bulletins and special reports-timely reports of the most current justice data
Courts reports--State court caseload surveys, model annual State reports, State court organization surveys
Corrections reports--results of sample surveys and censuses of jails, prisons, parole, probation, and other corrections data
o National Crime Survey reports--the only regular national survey of crime victims
D Sourcebook of Criminal Justice Statistics (annual)--broad-based data from 150+ f;ources (400+ tables, 100+ figures, index)
D Ser.d me a form to sign up for NIJ Reports (issued free 6 times a year), which abstracts both private and government criminal justice publications and lists conferences and training sessions in the field.
To order copies of recent BJS reports, You will receive an annual renewal card. If you check them on the back of this sheet. do not return it, we must drop you from the list.
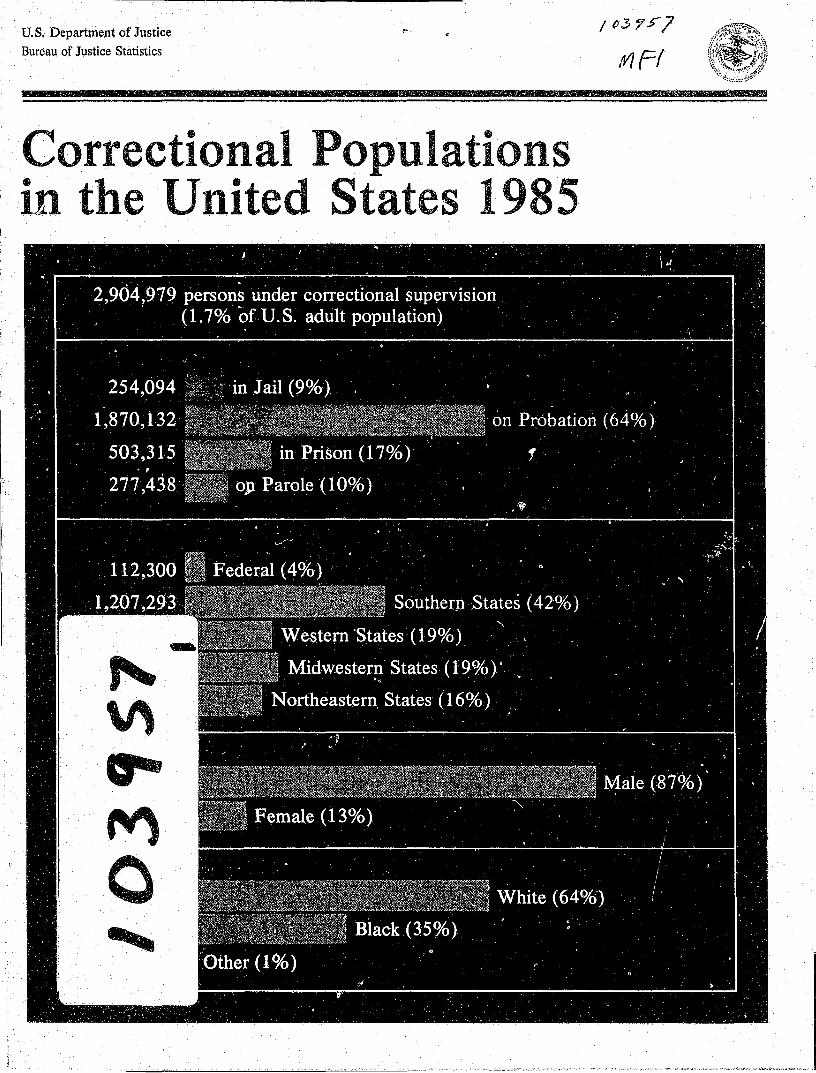


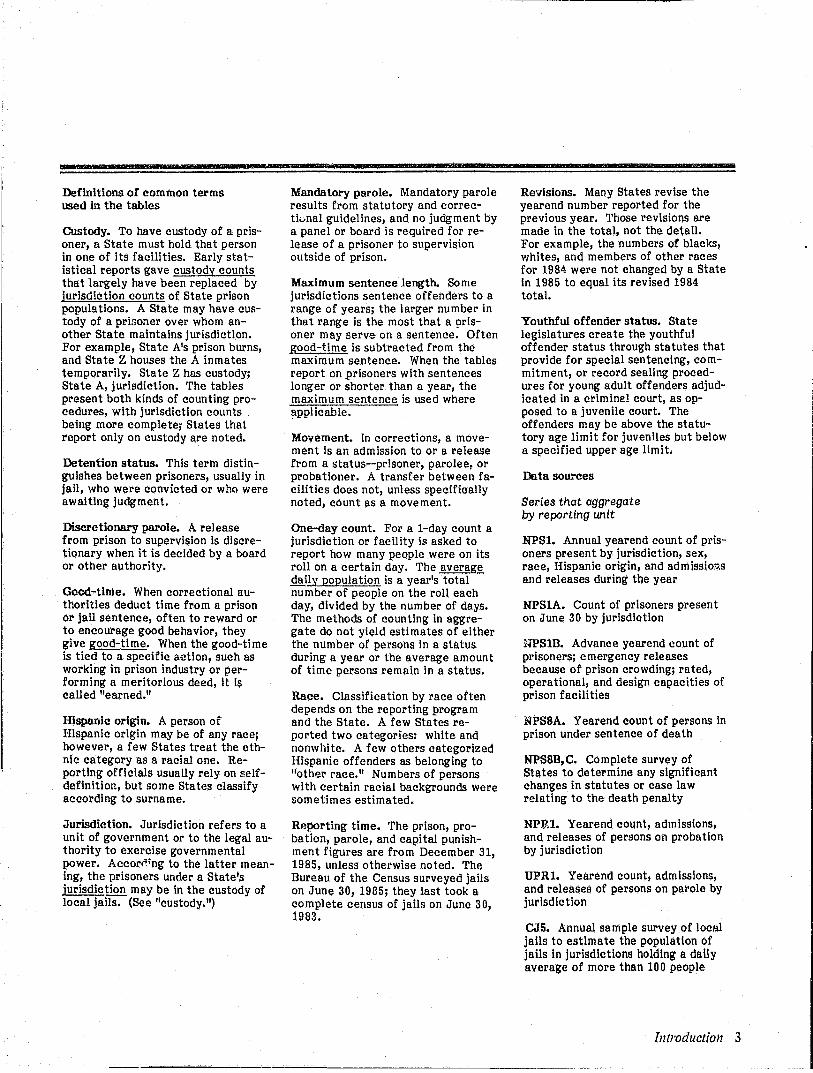
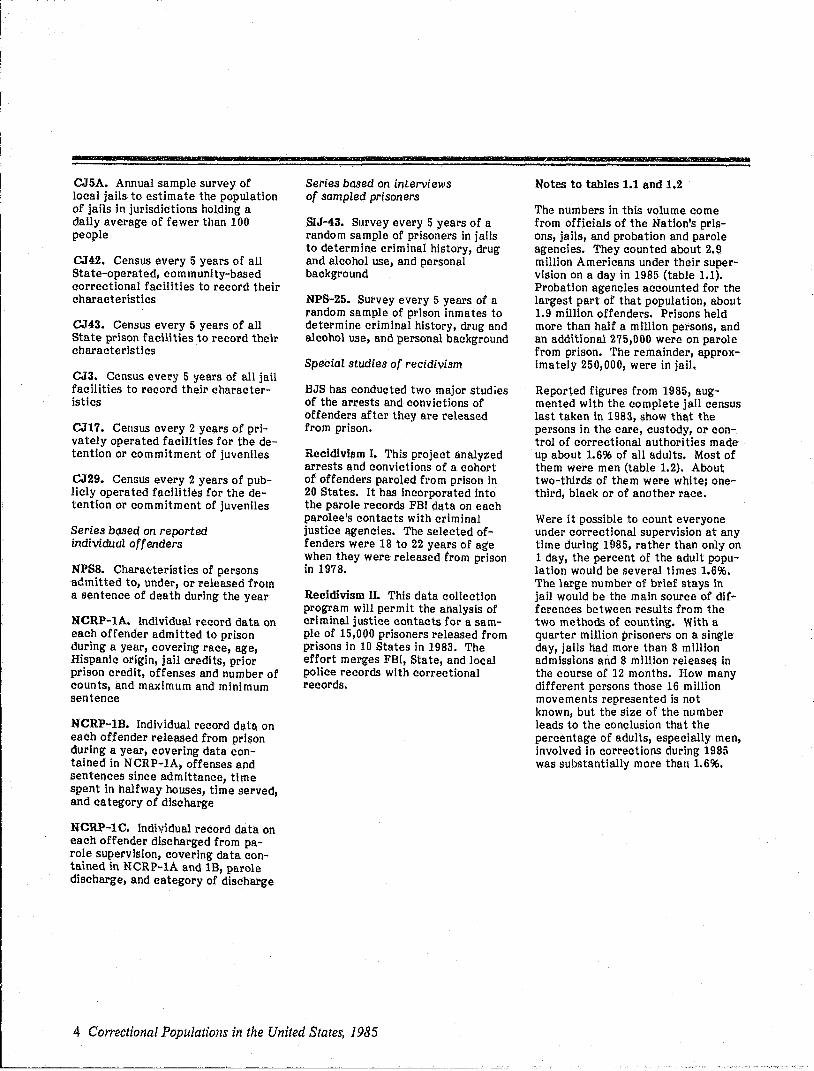
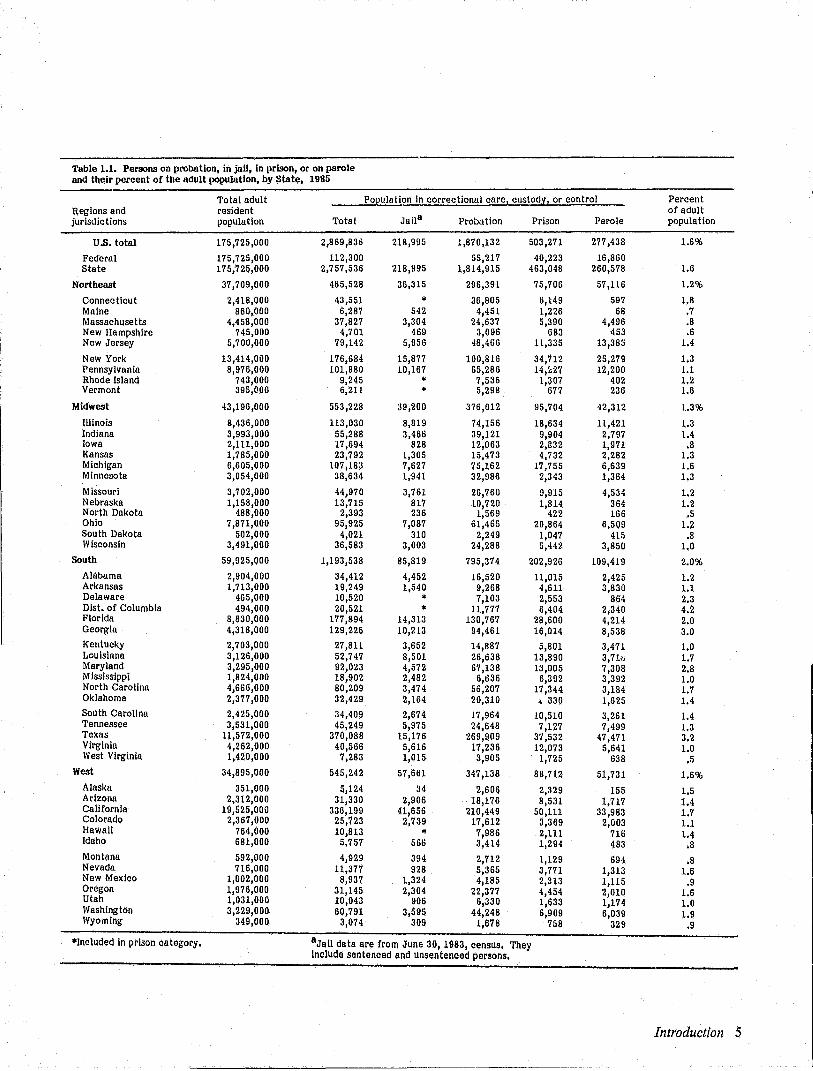
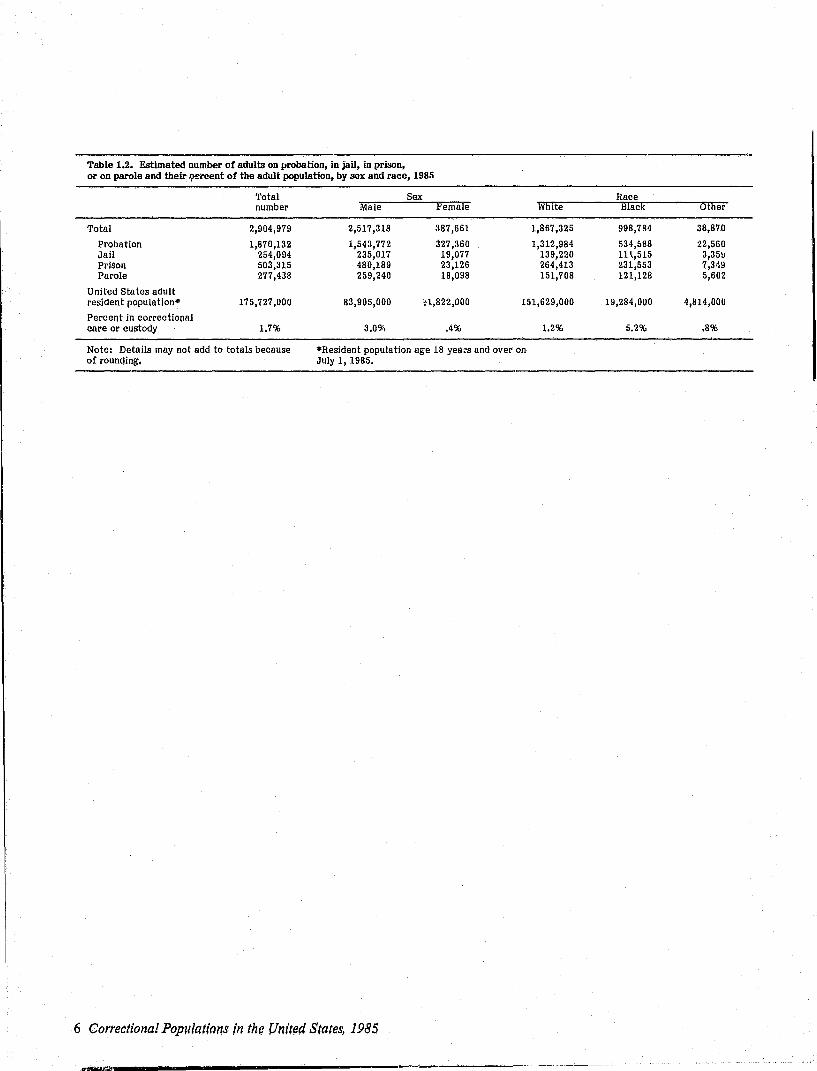


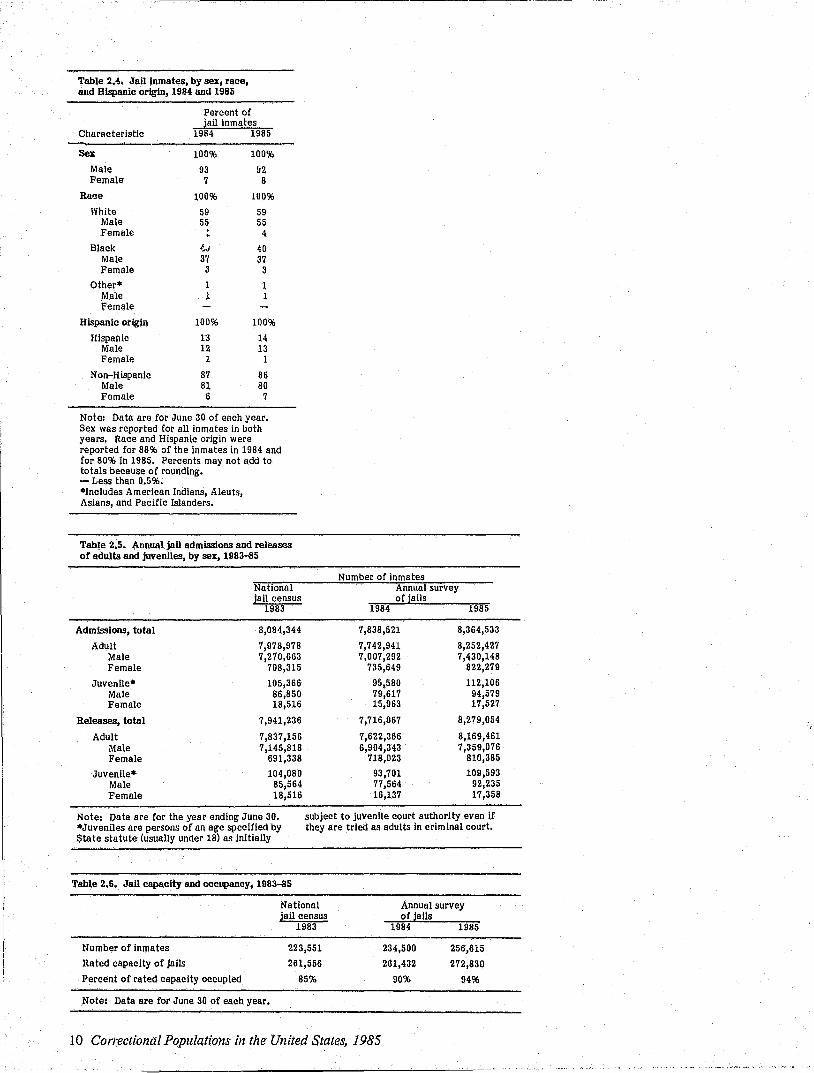
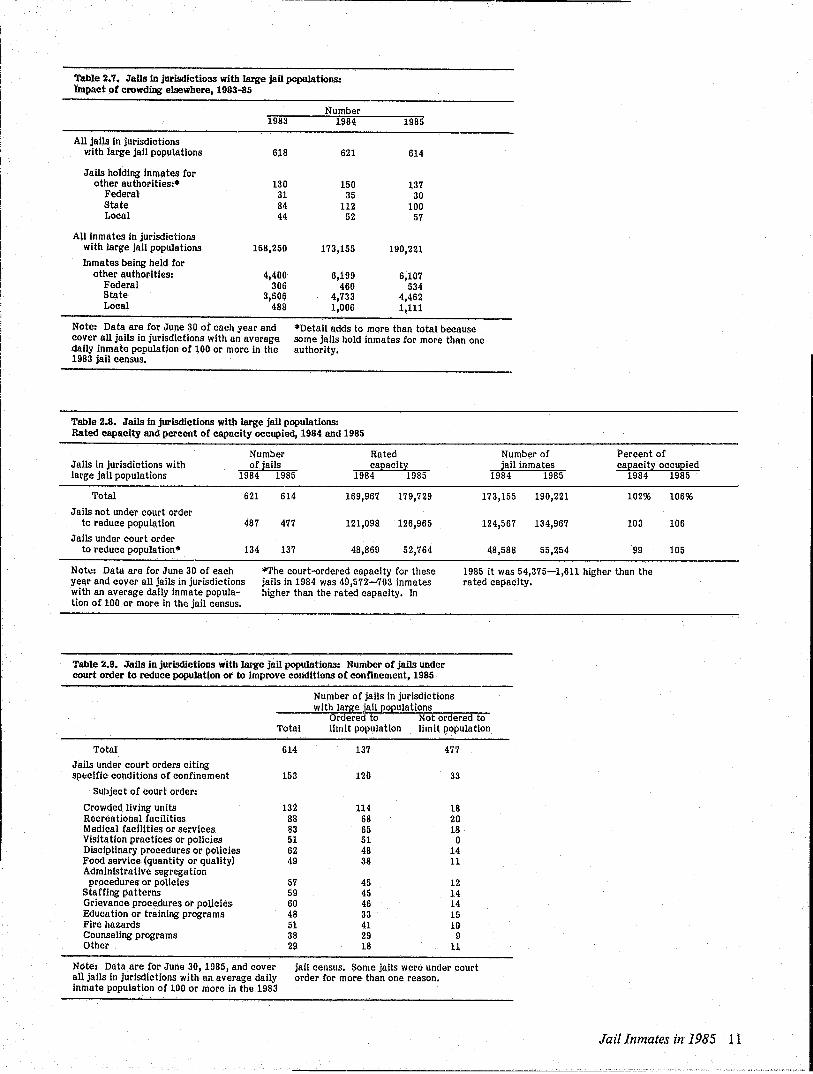

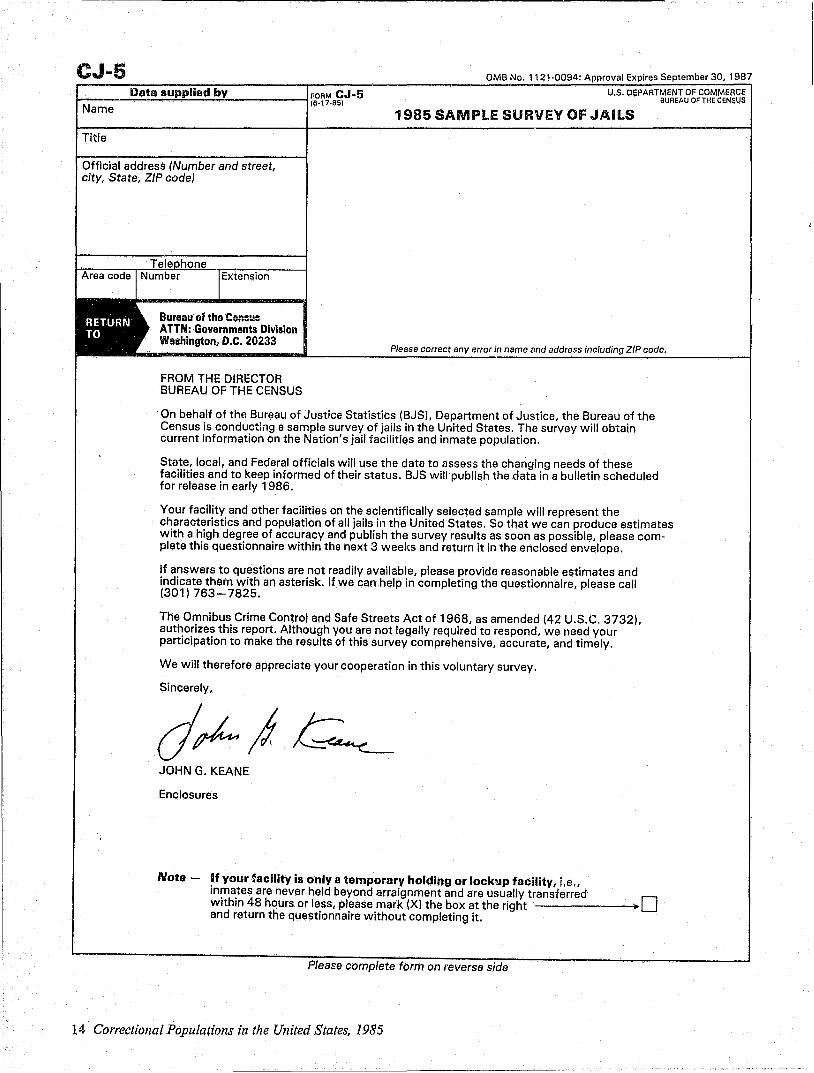

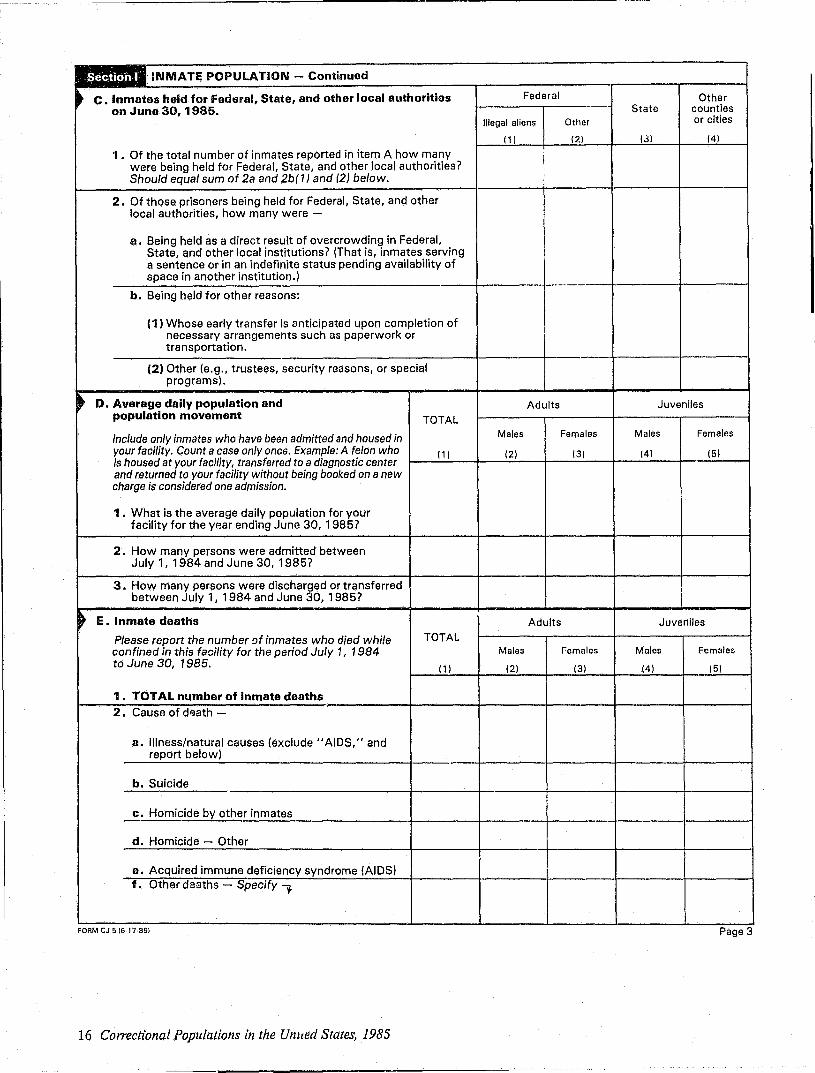
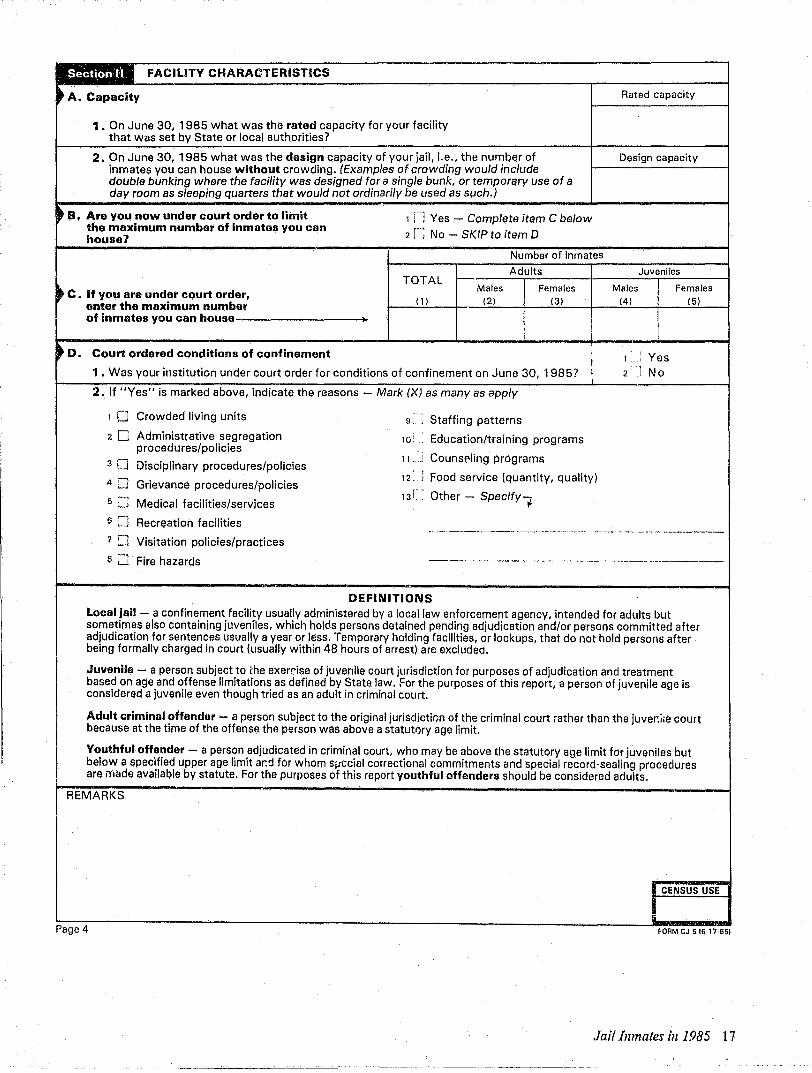
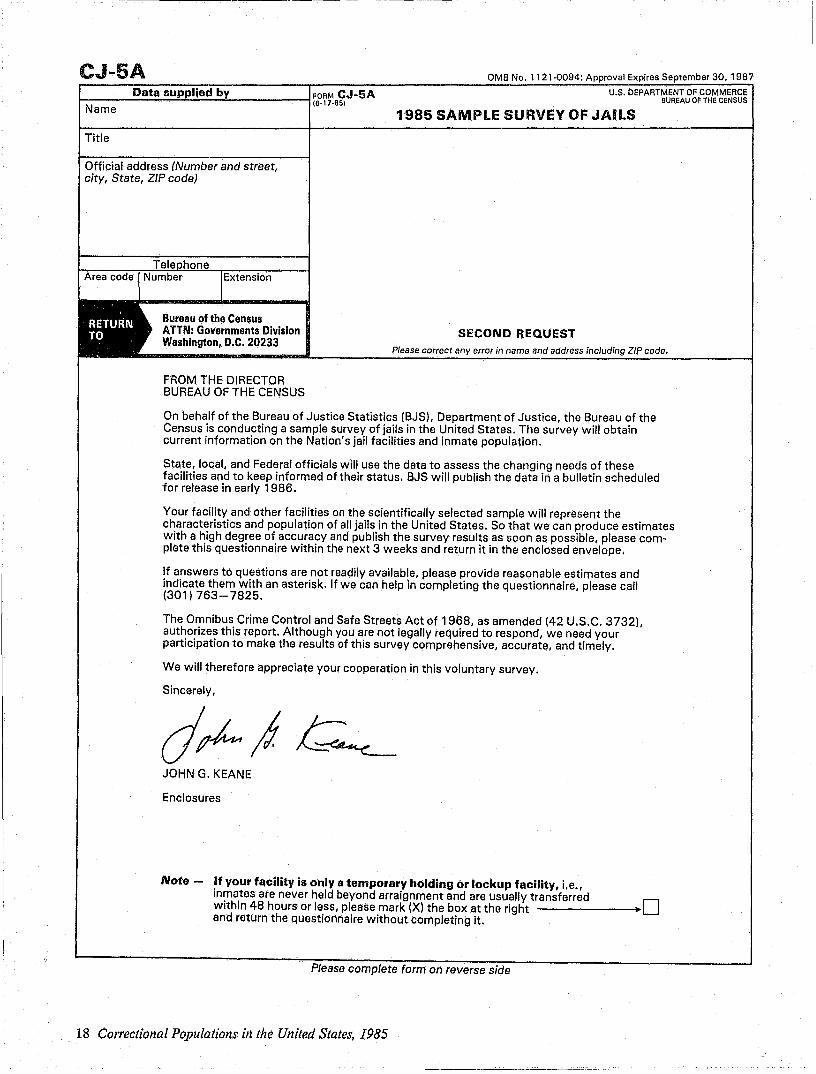


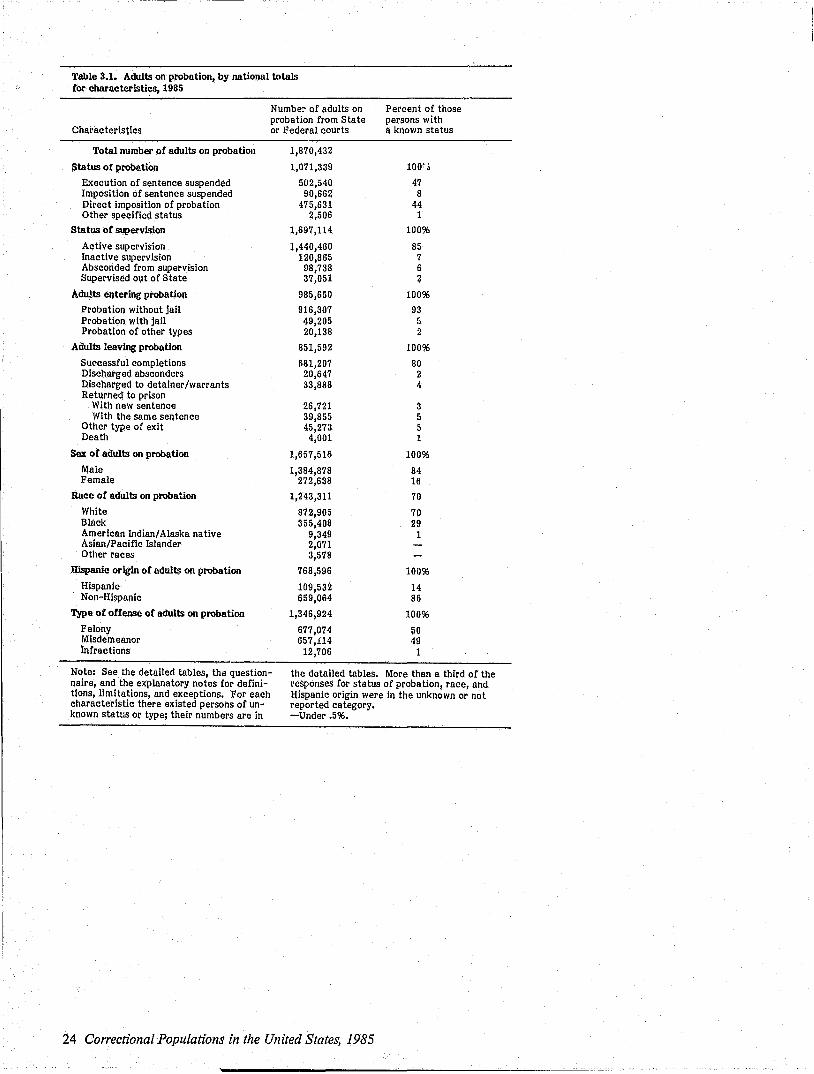
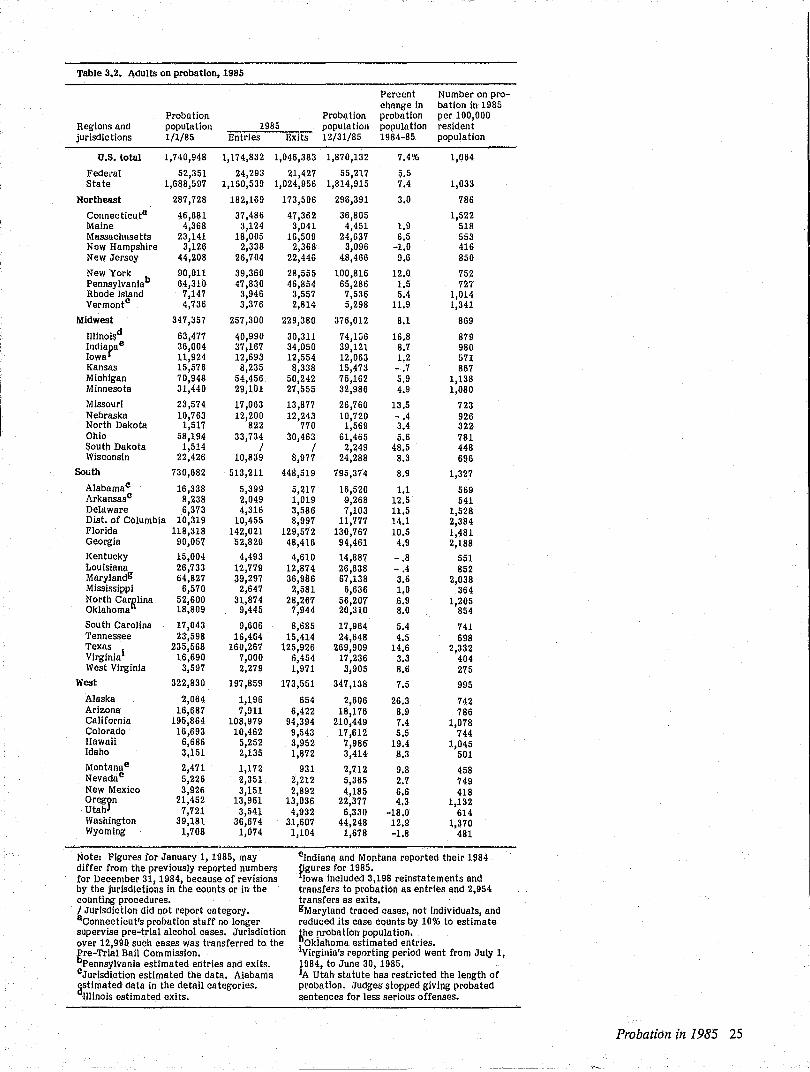
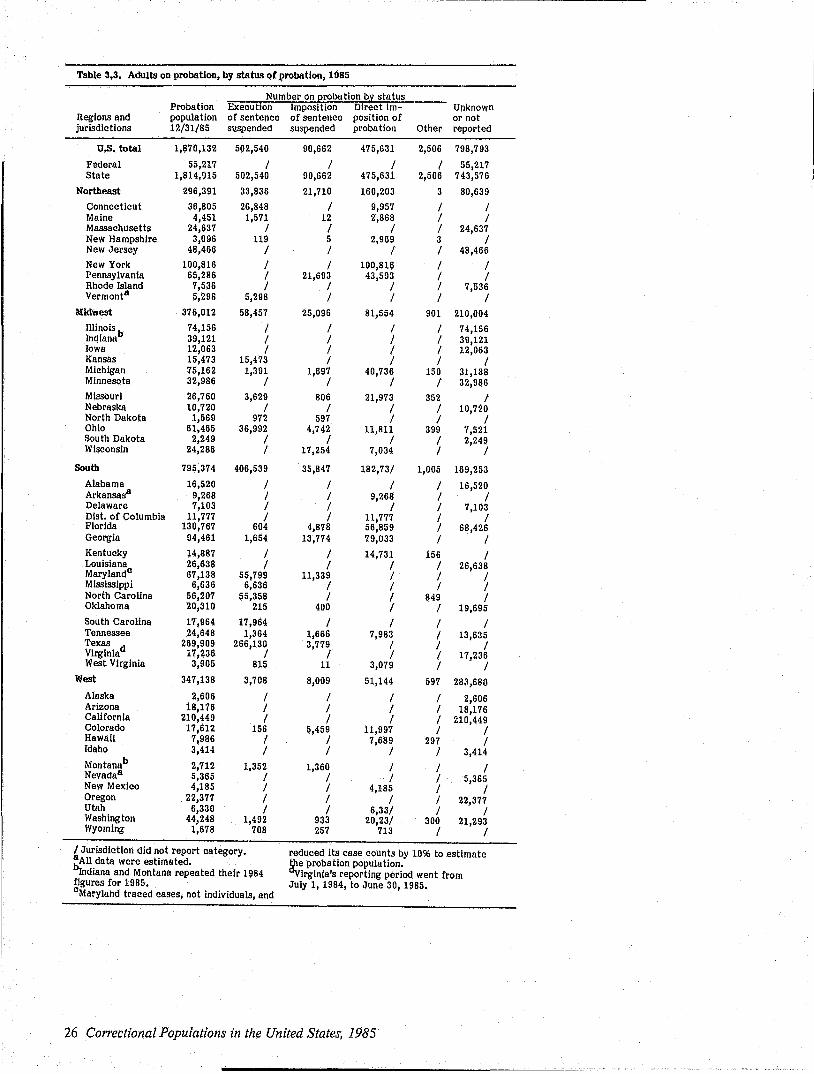
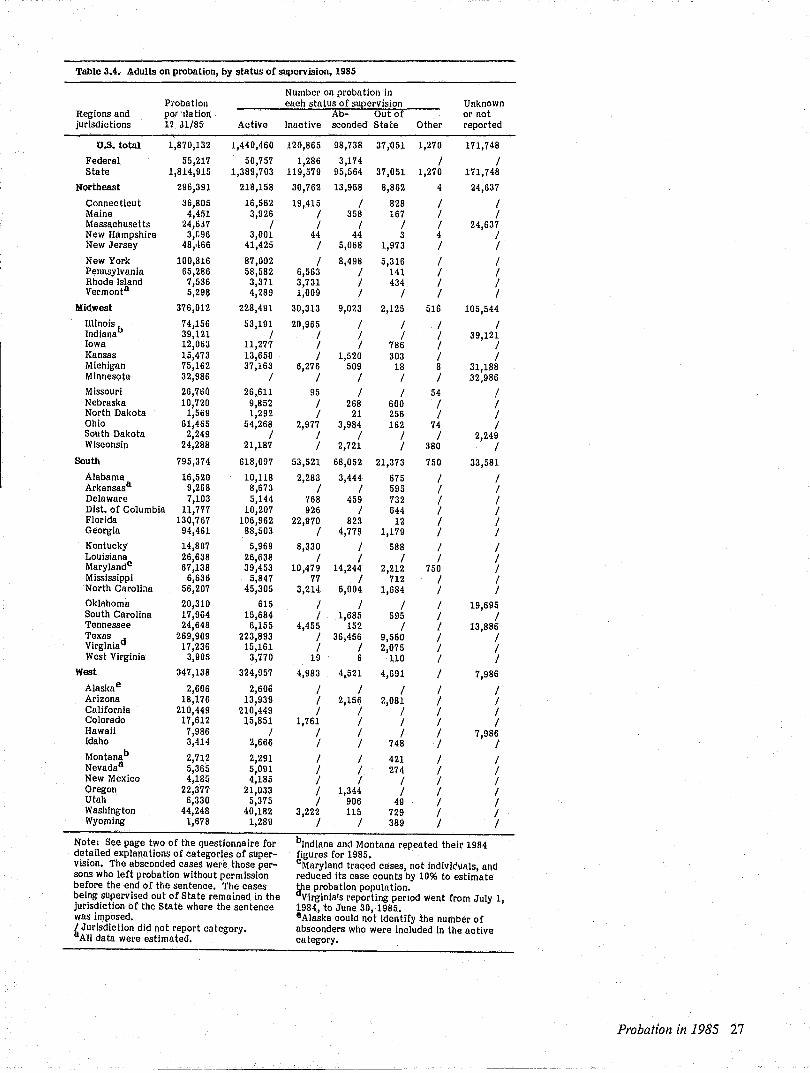

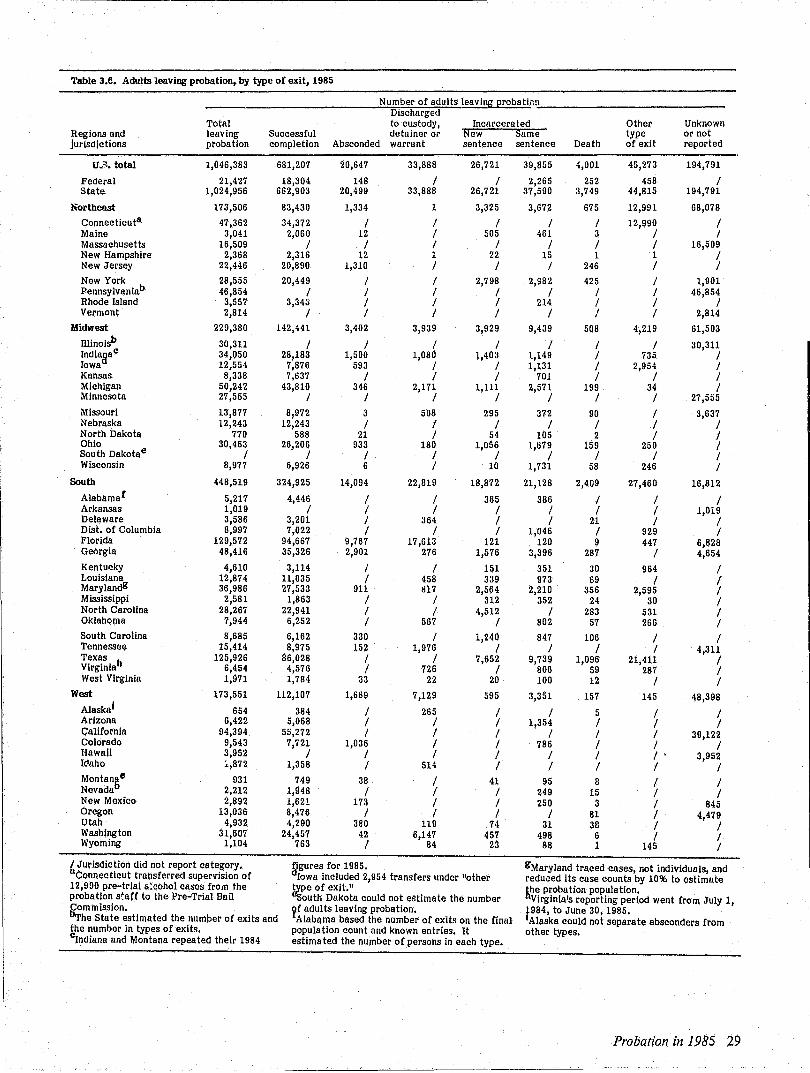

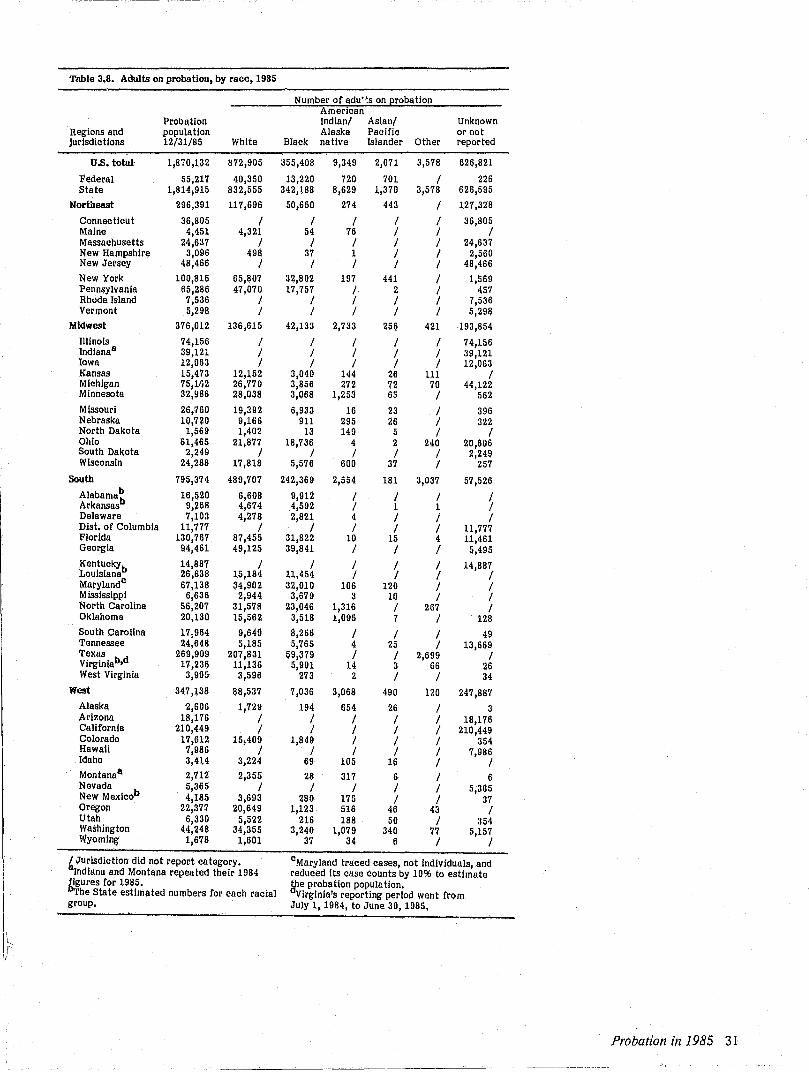
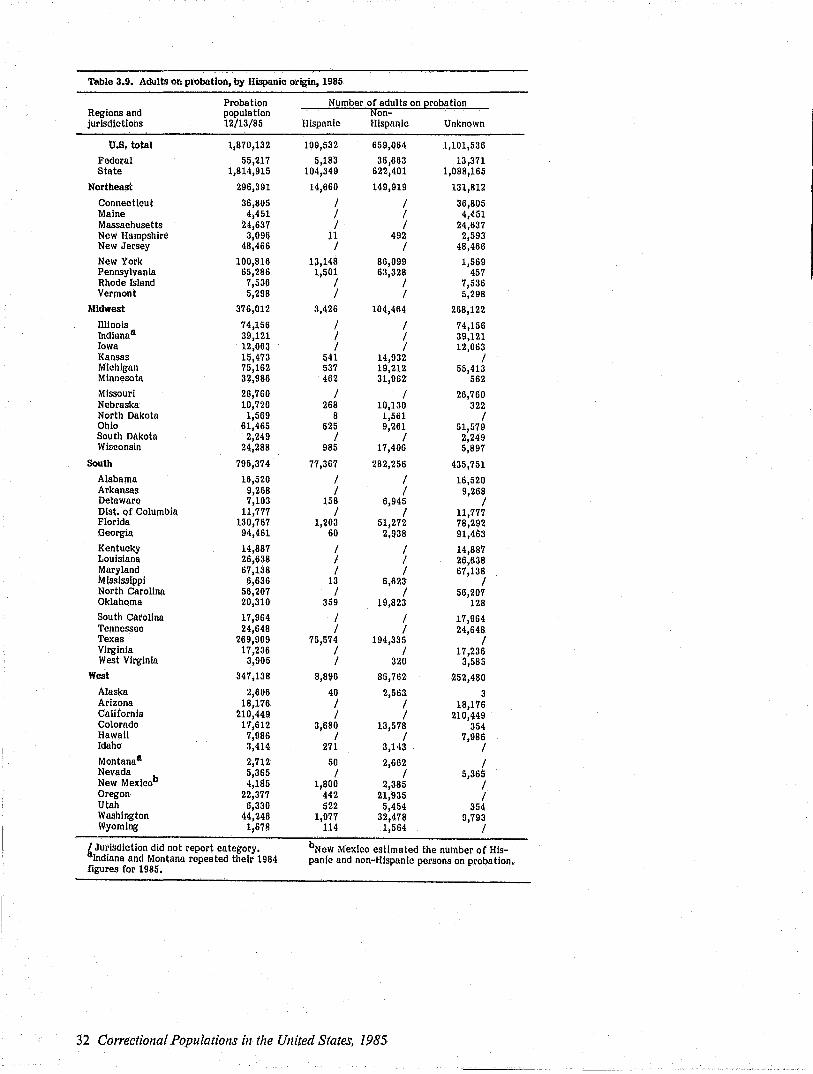
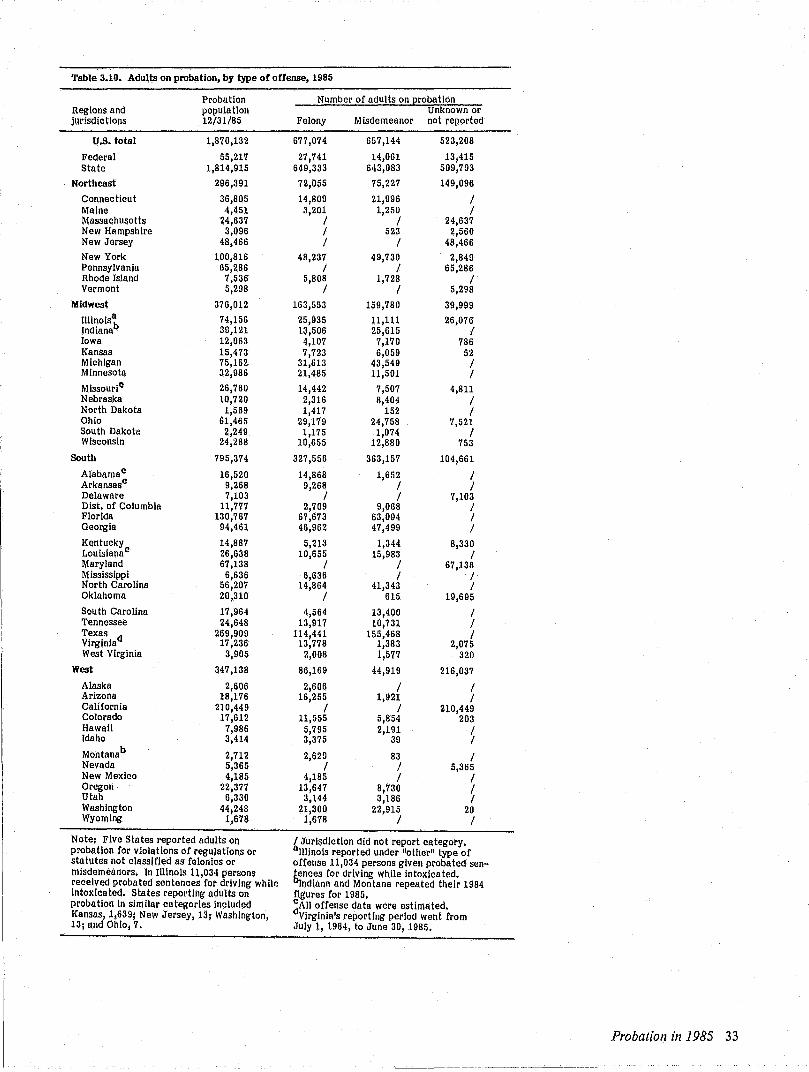

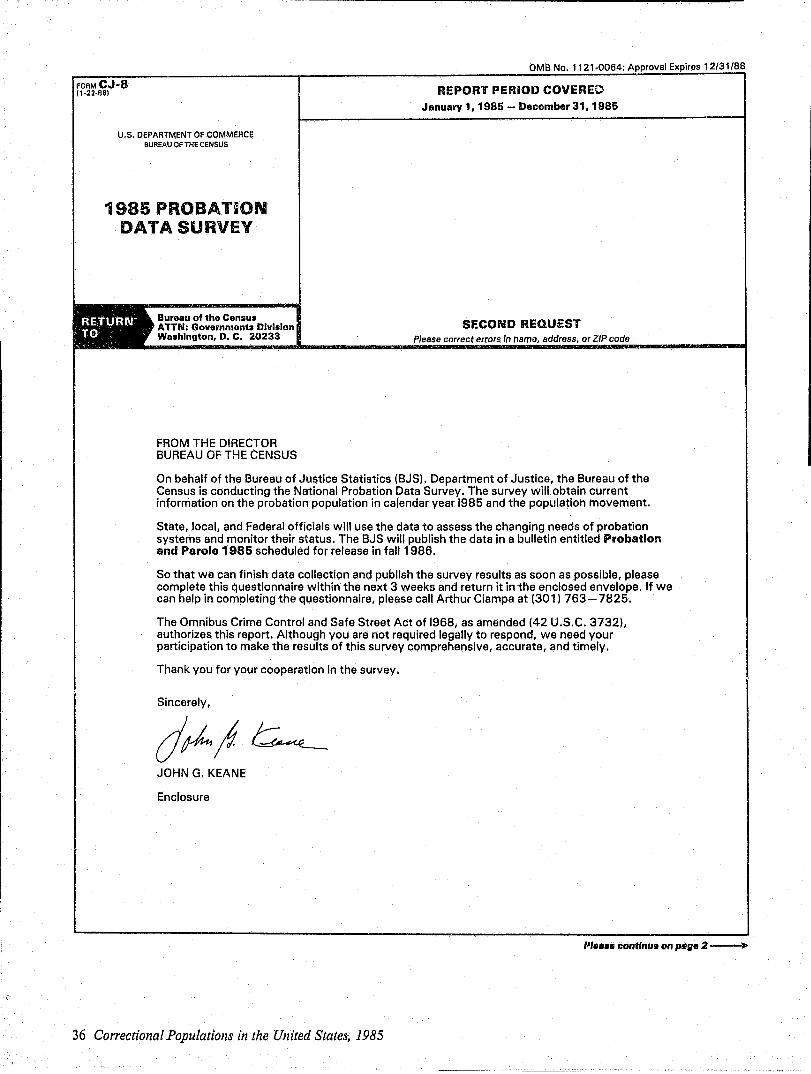


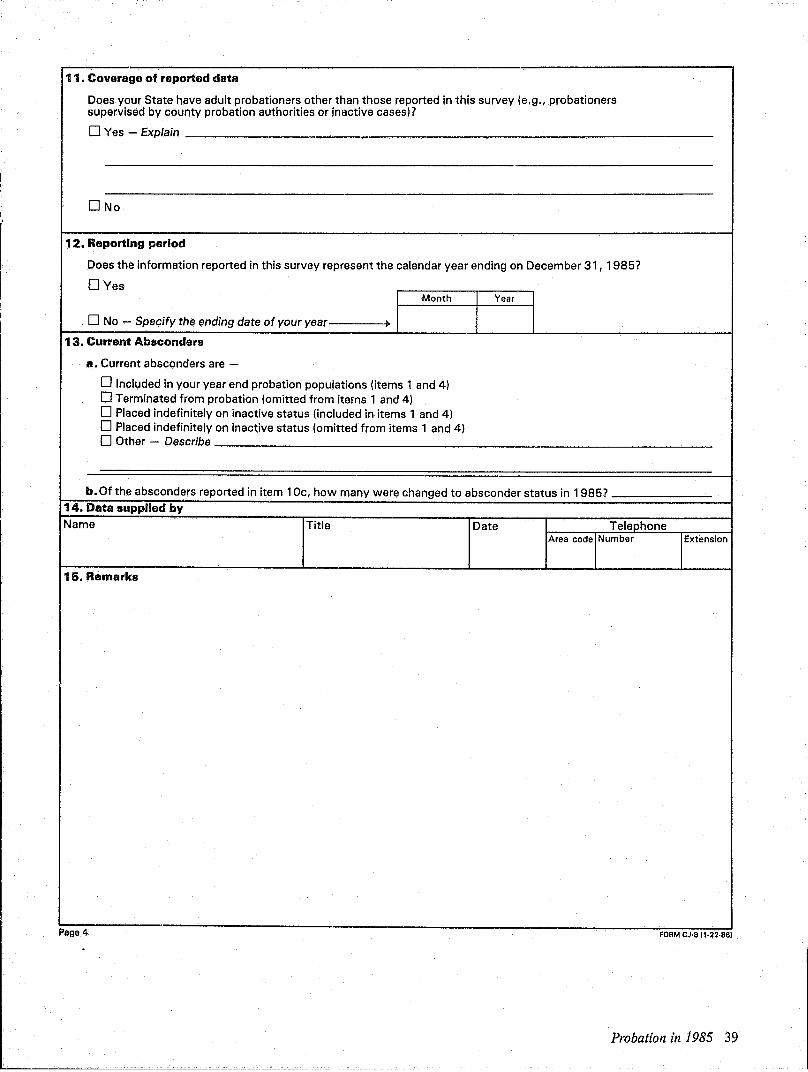
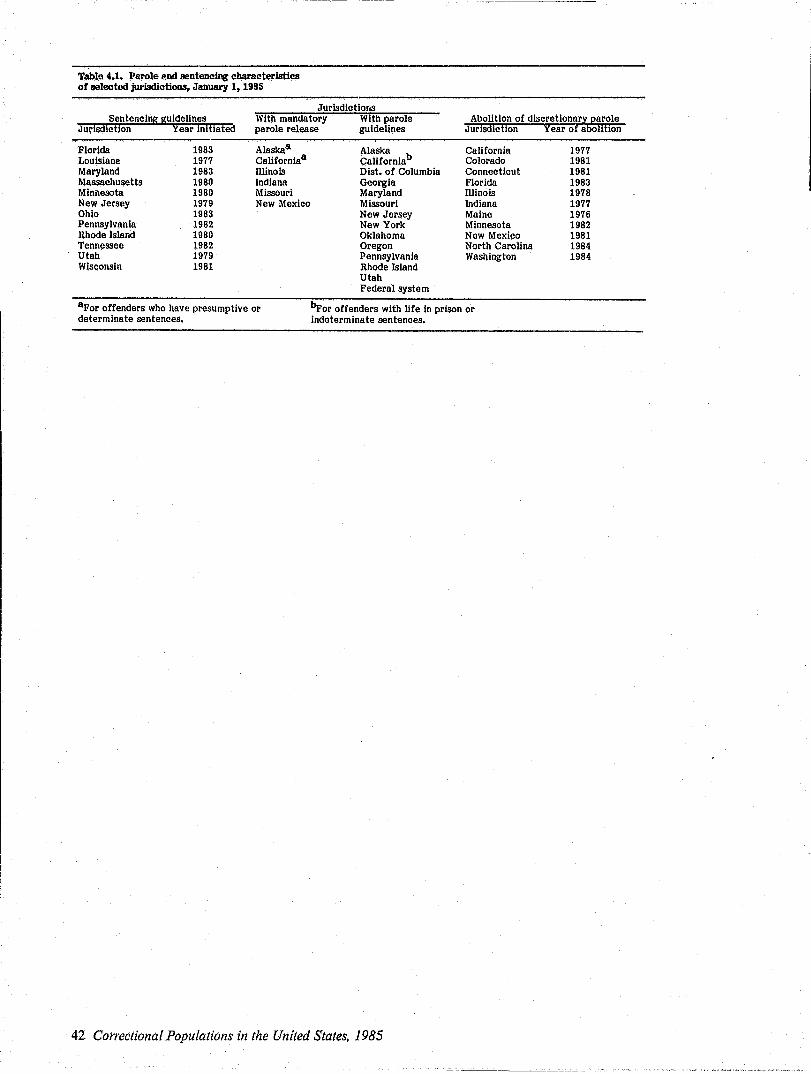
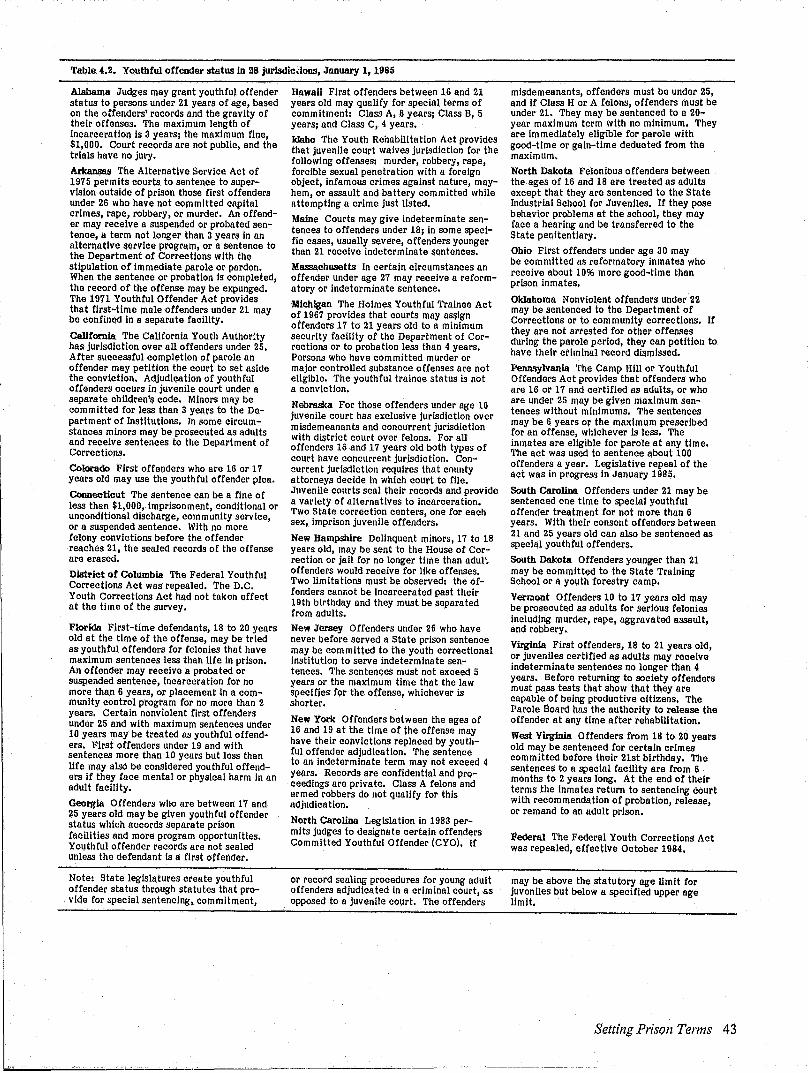
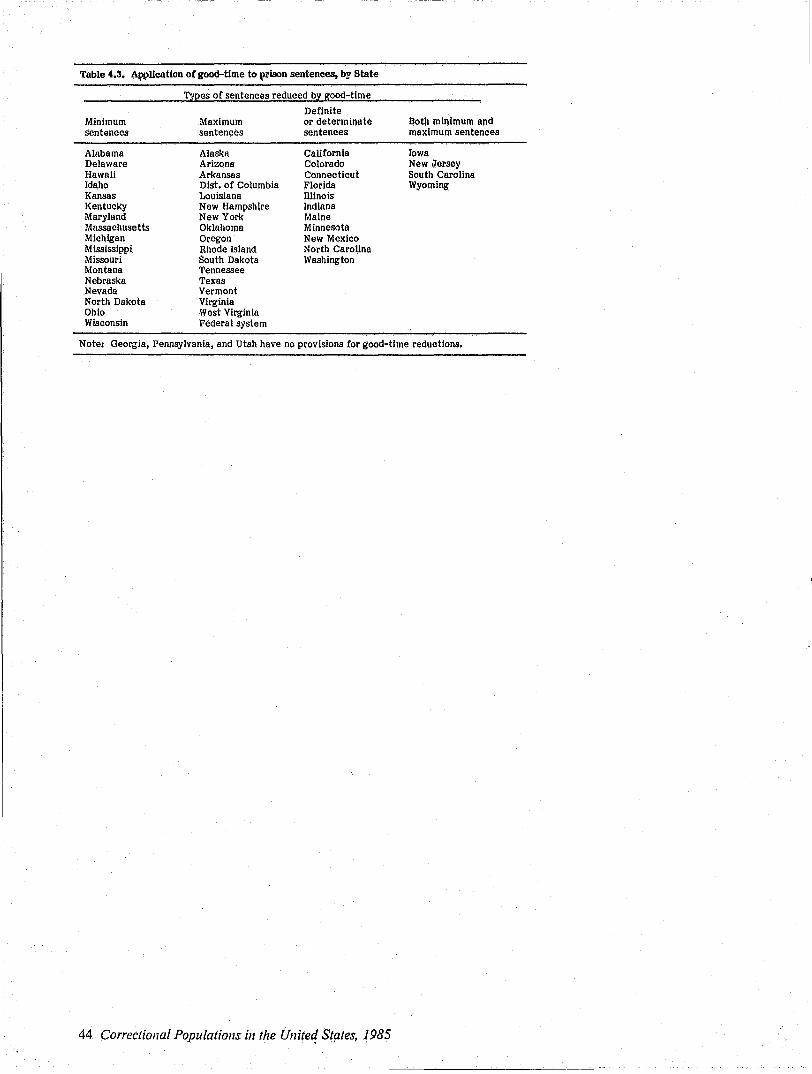

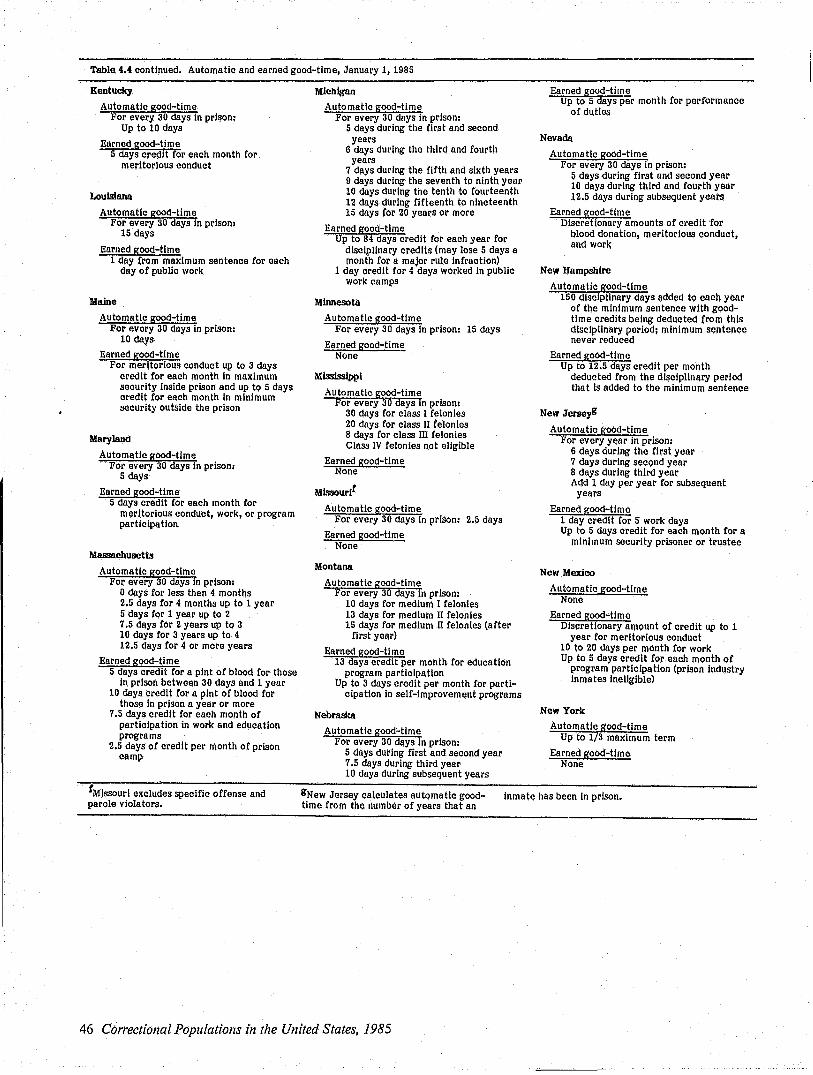
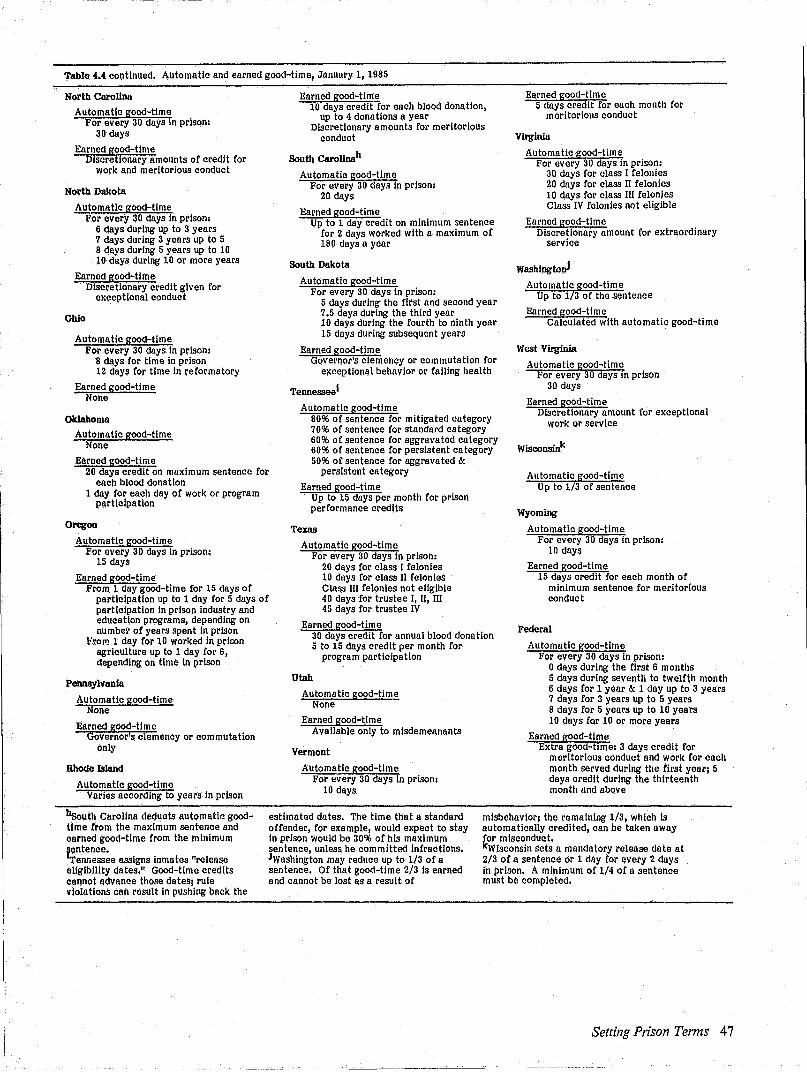
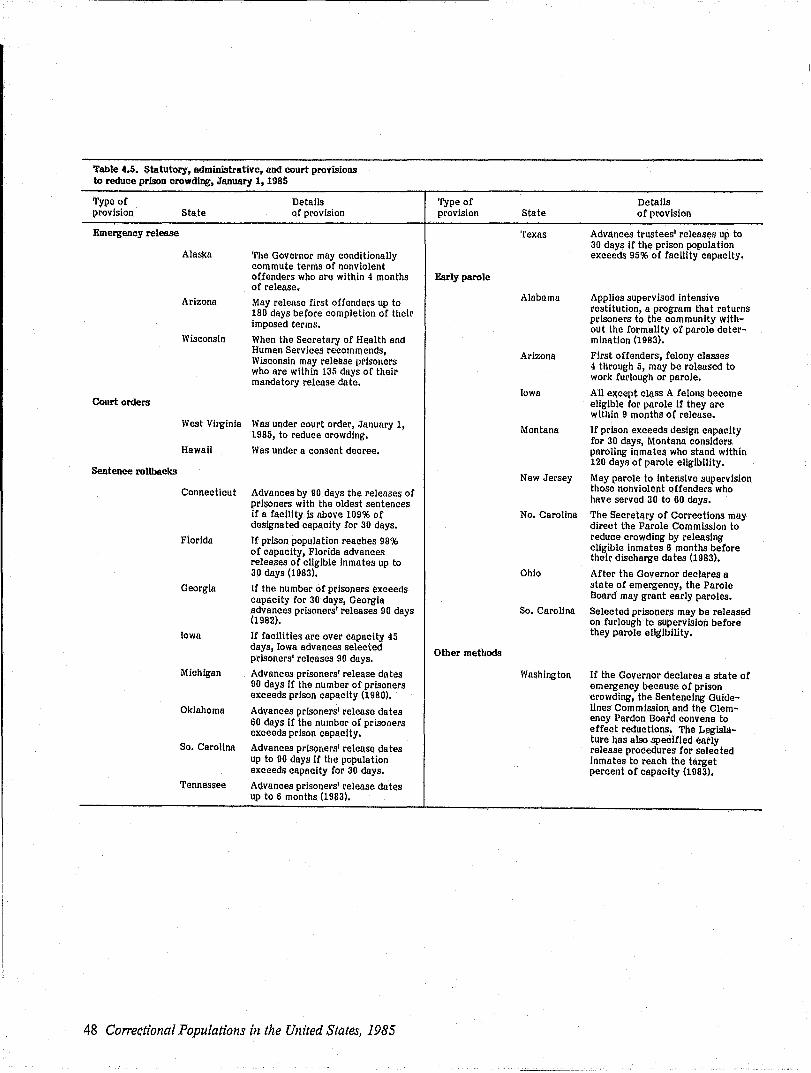


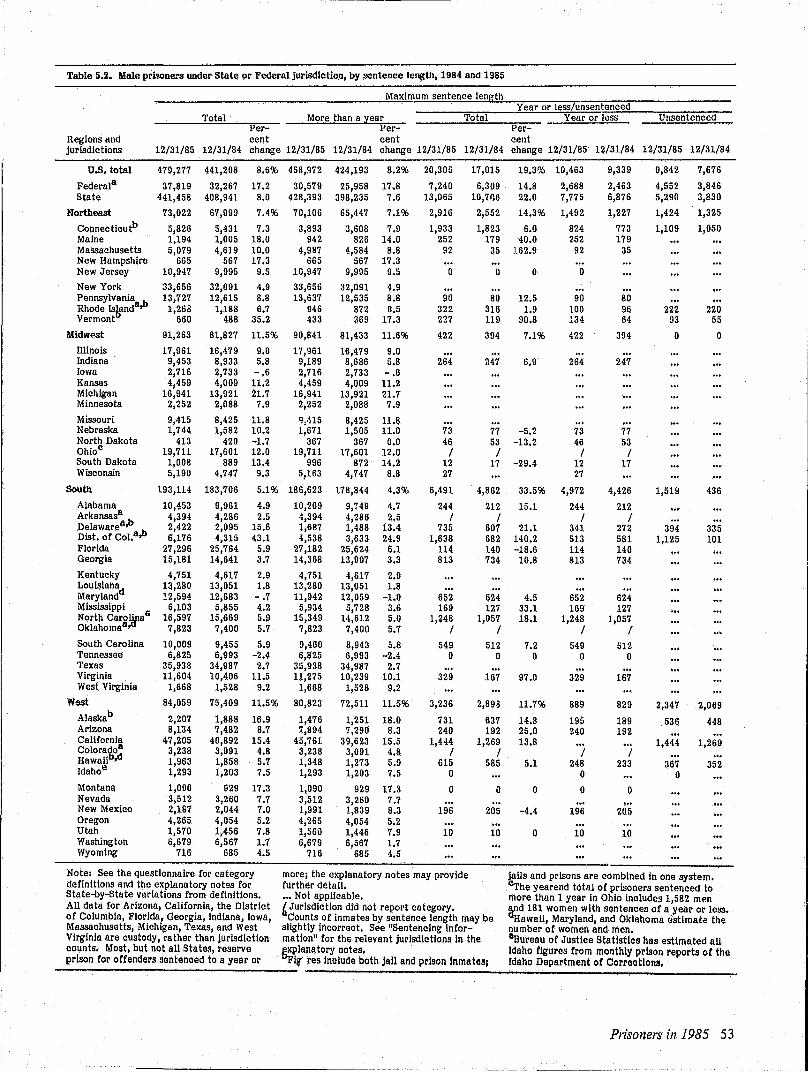

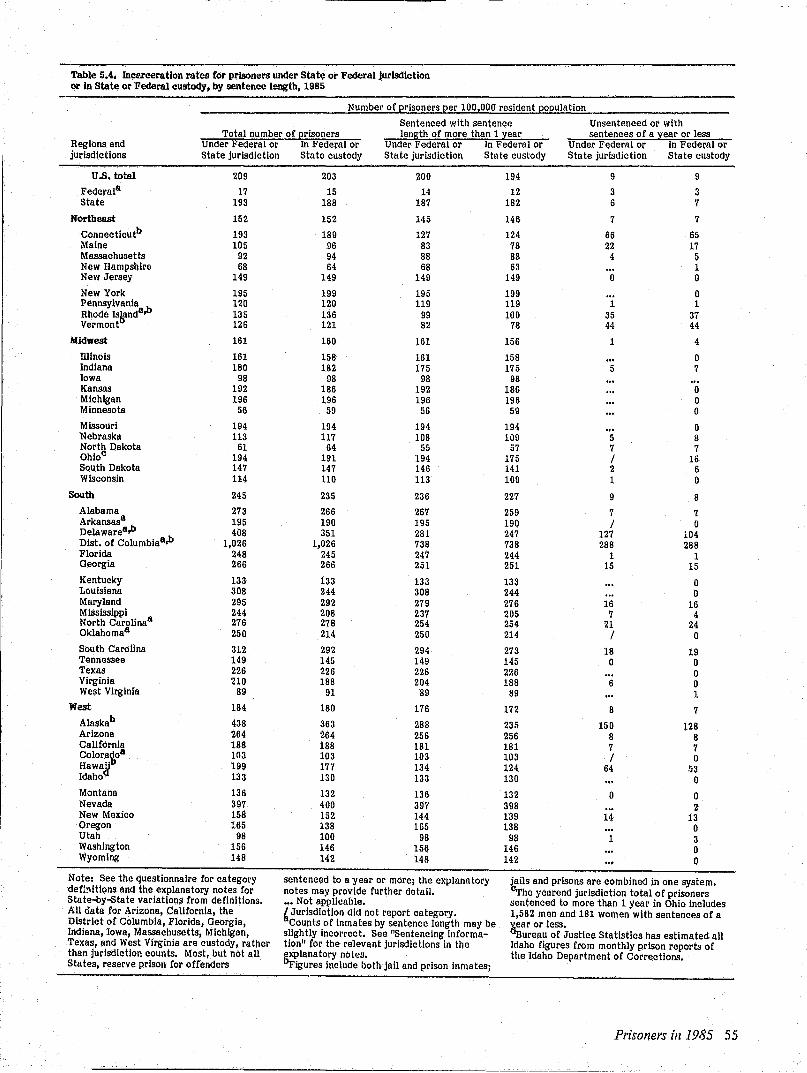
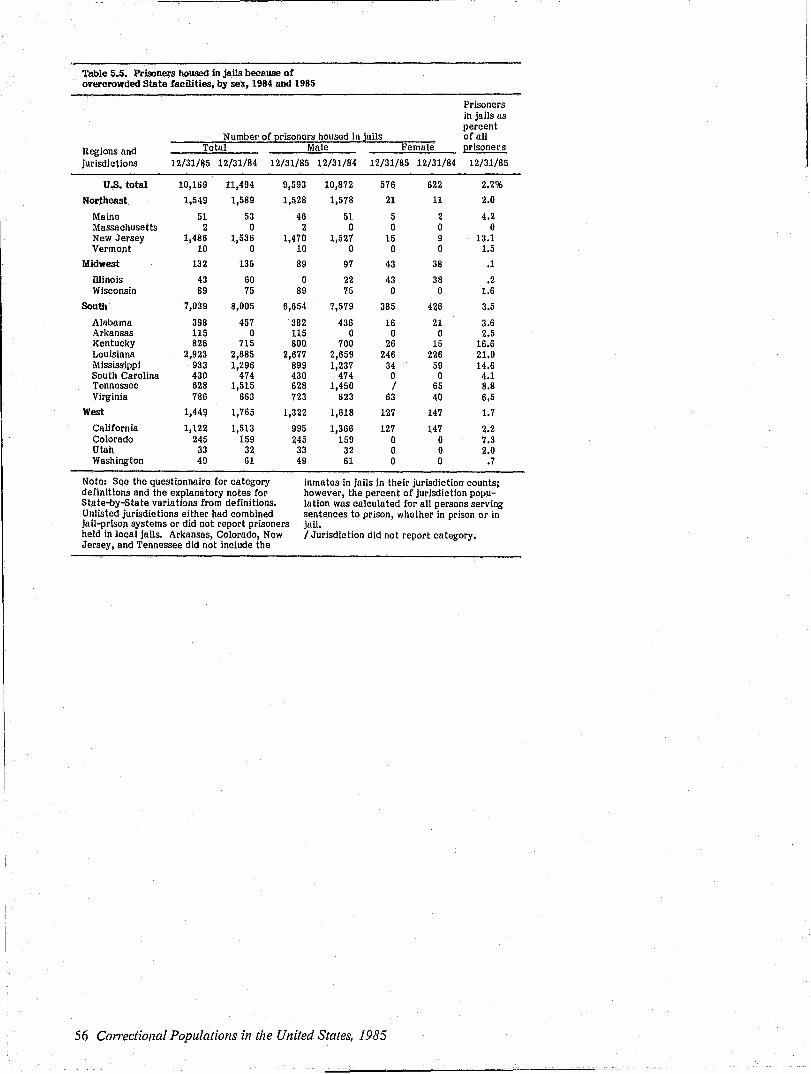
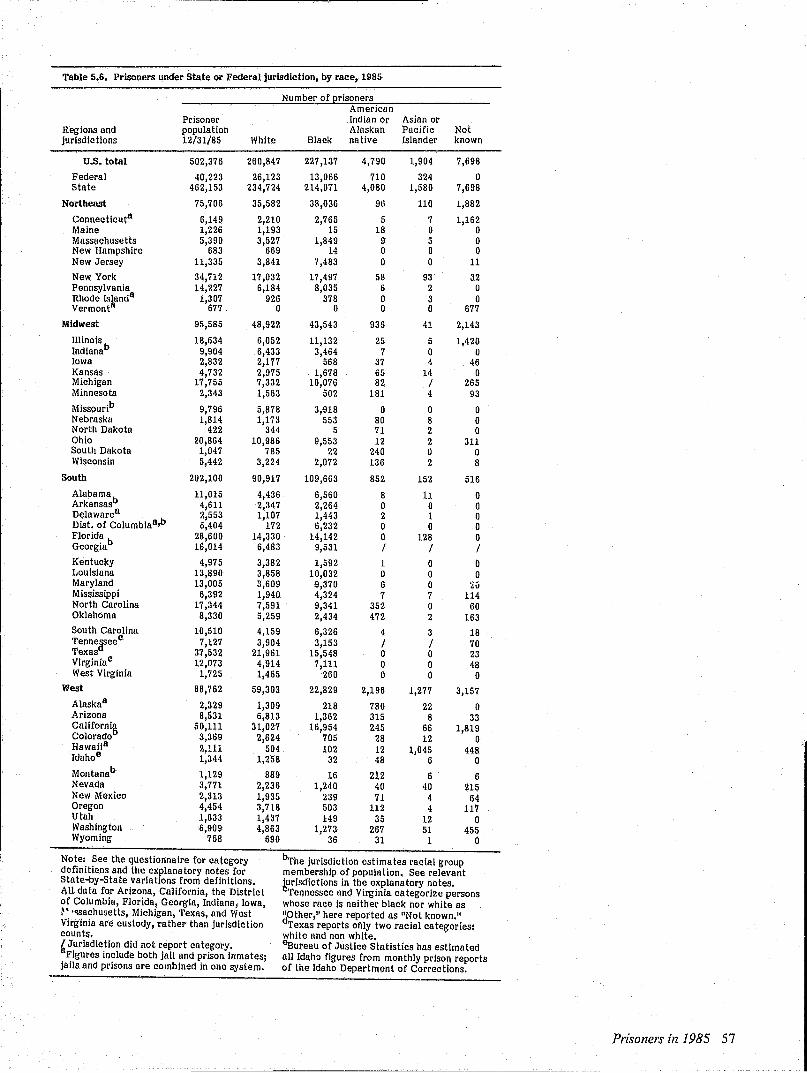
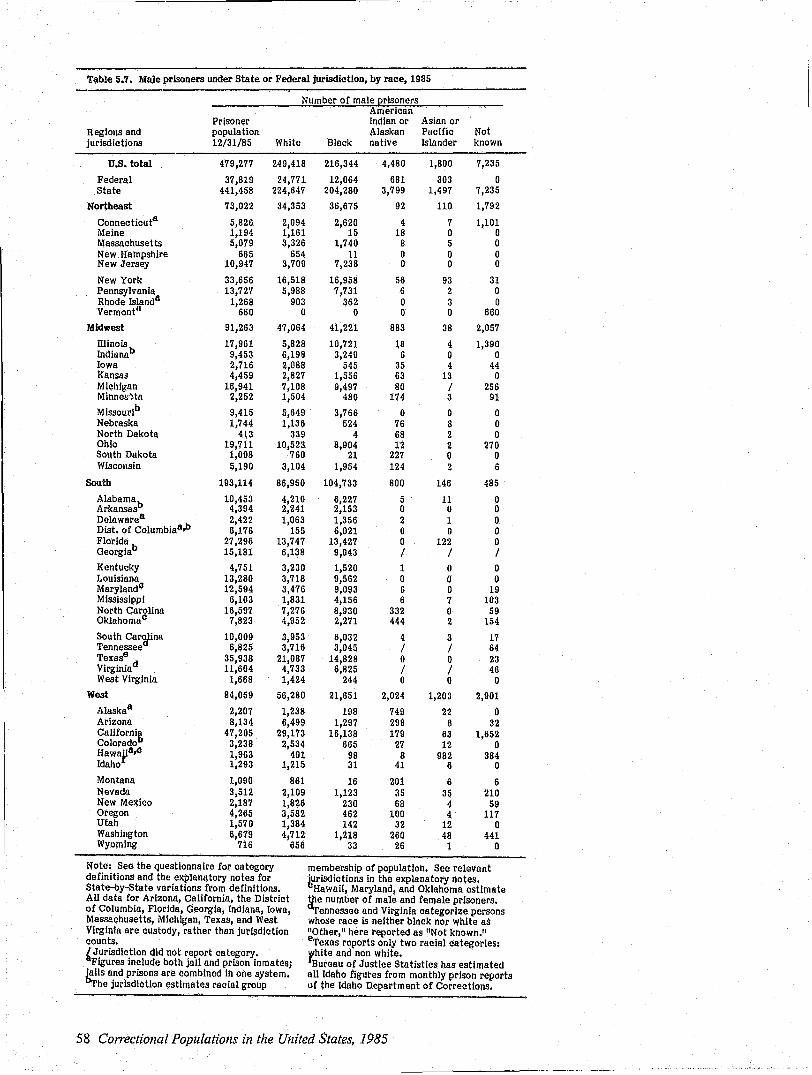
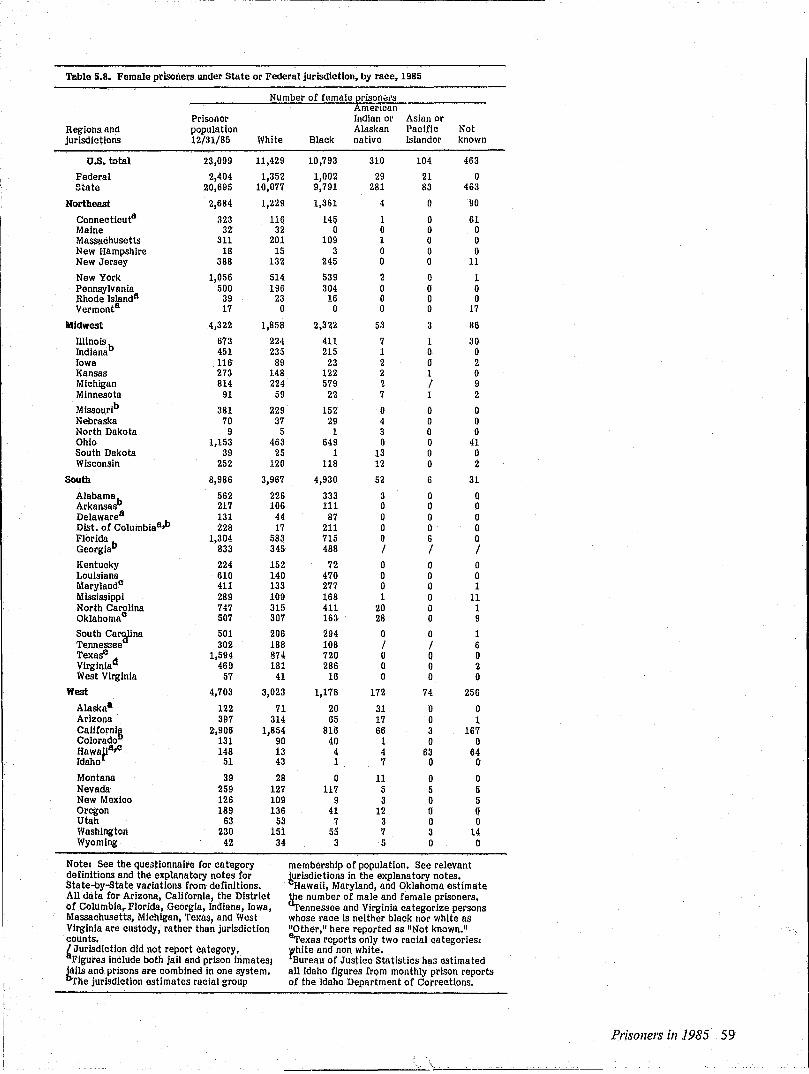
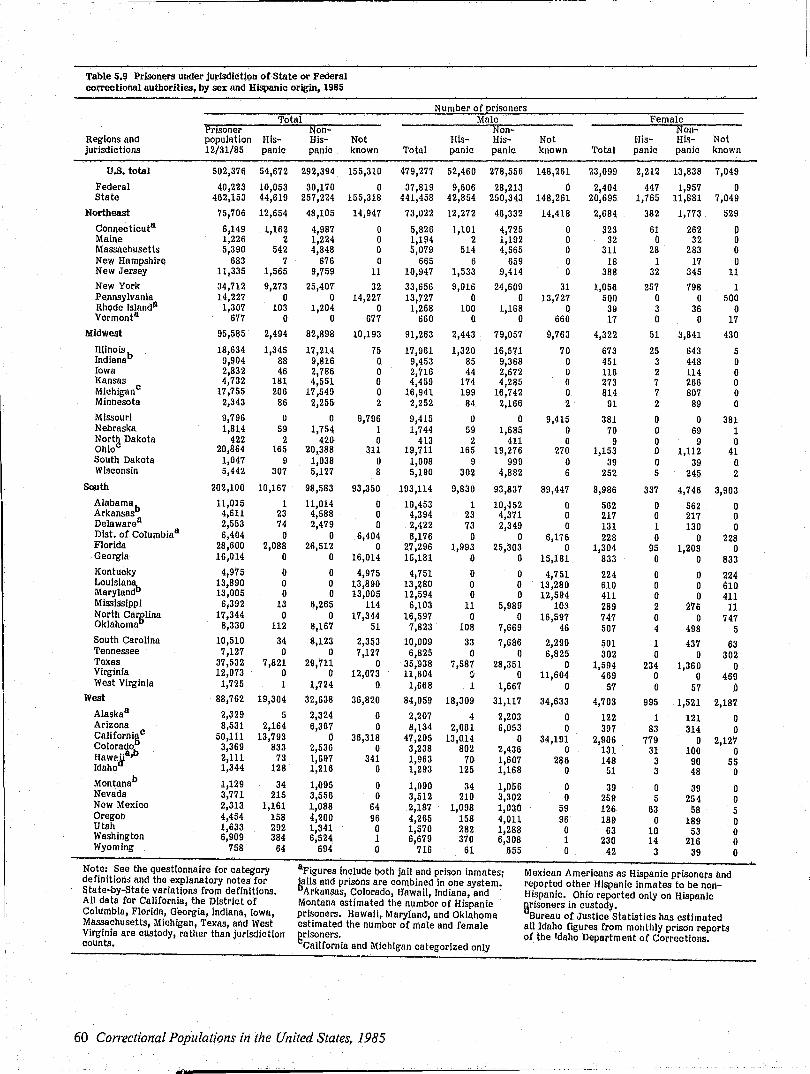

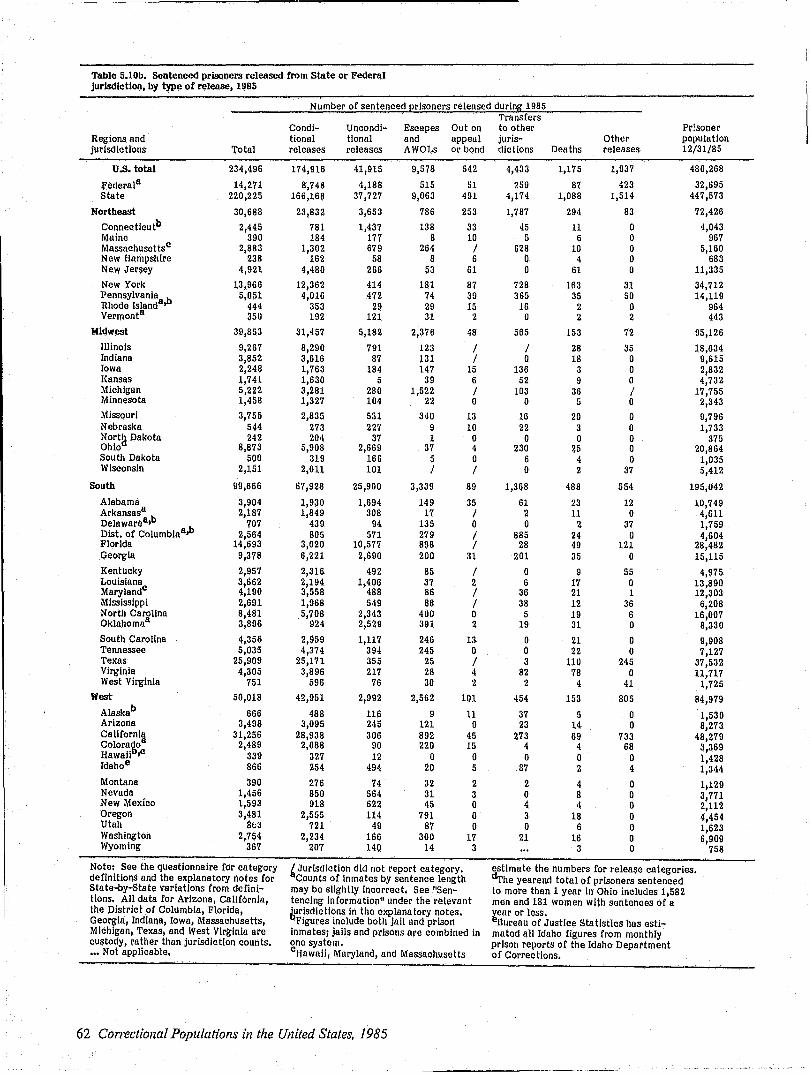
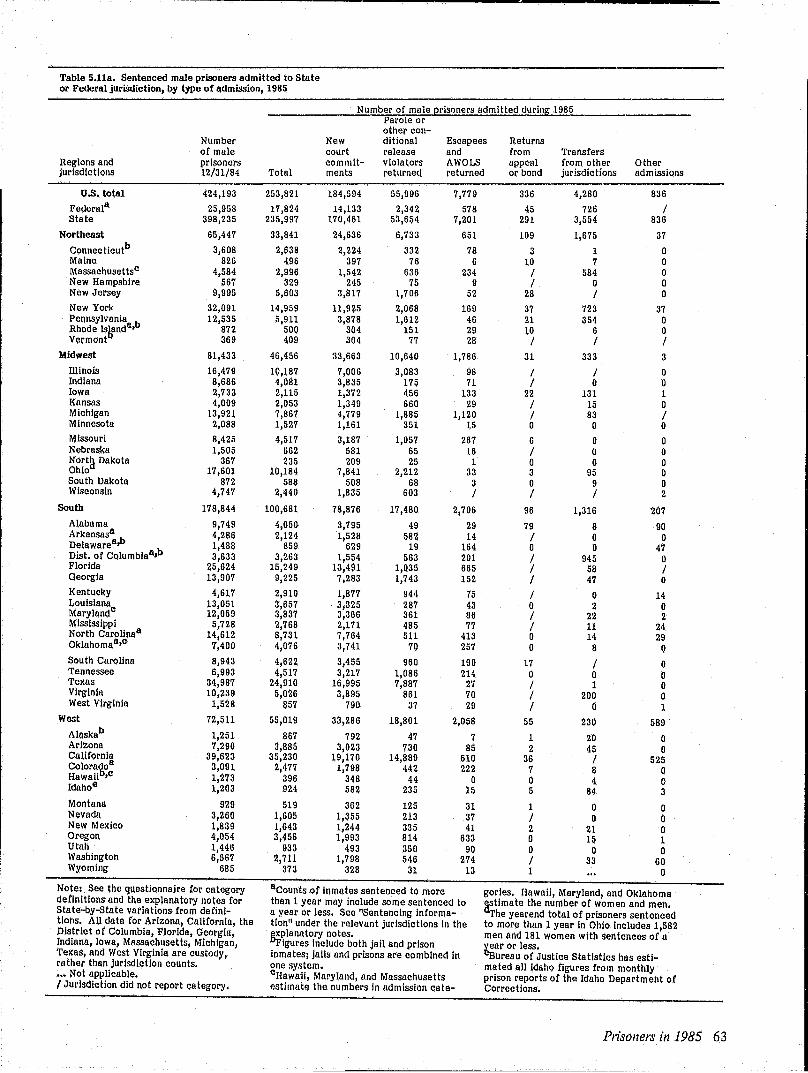
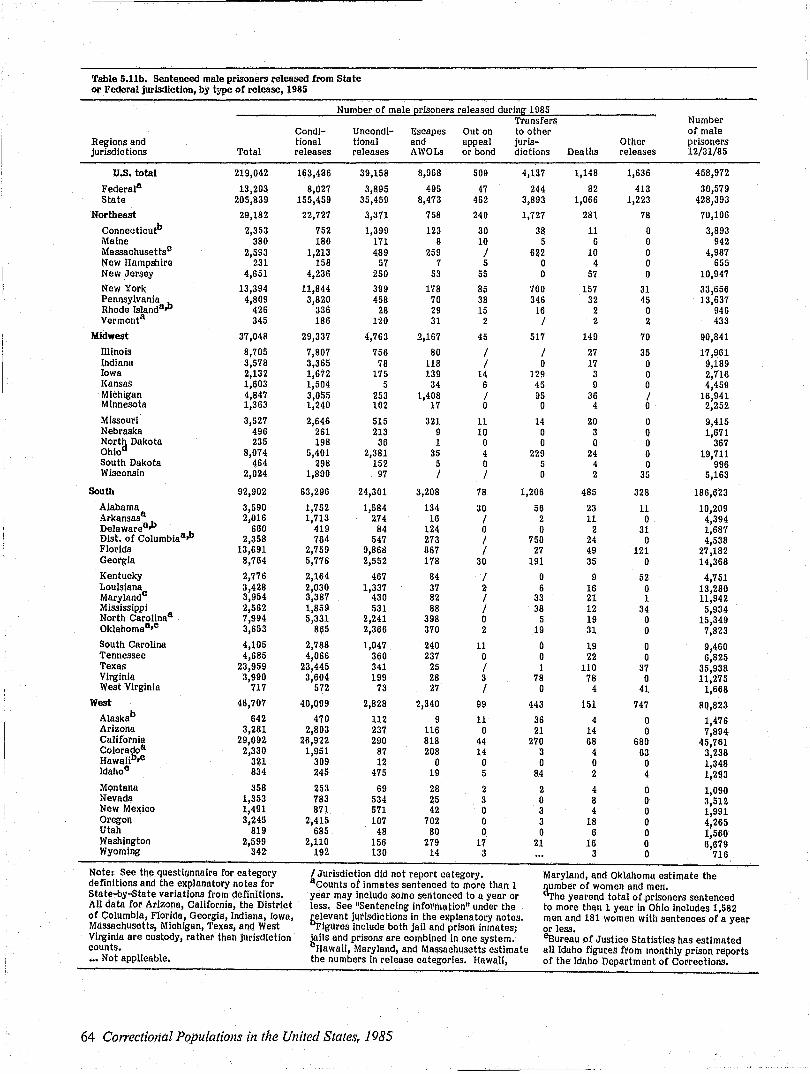
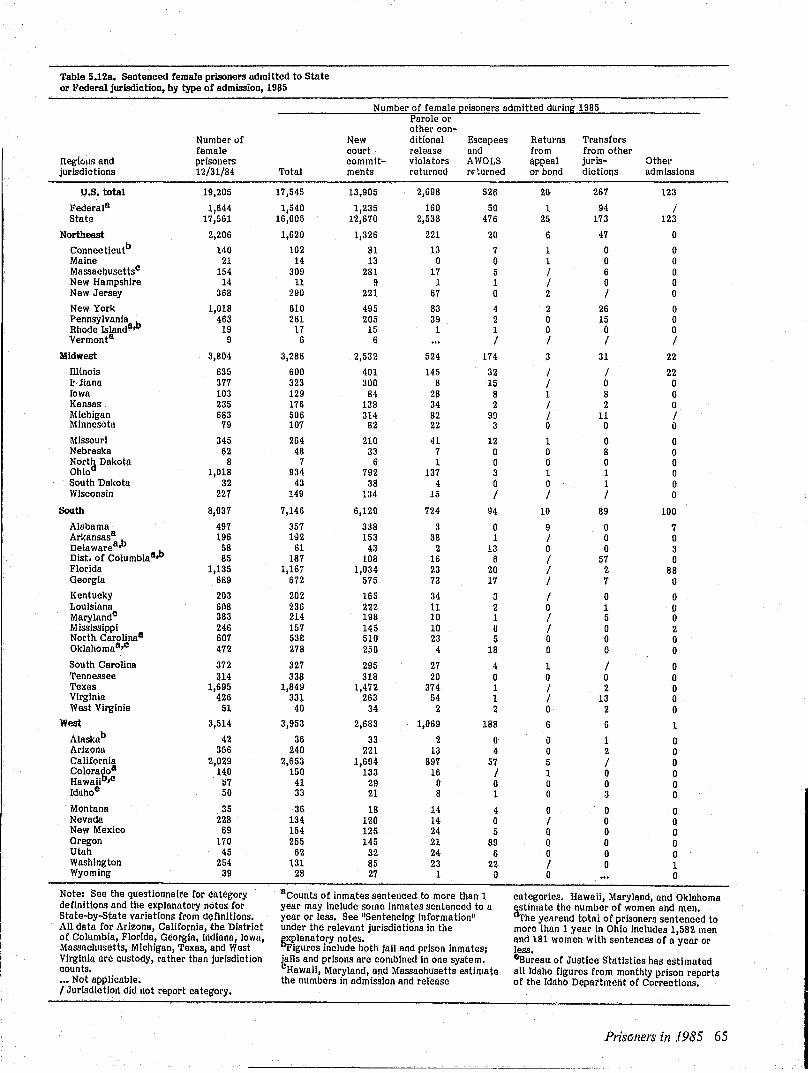
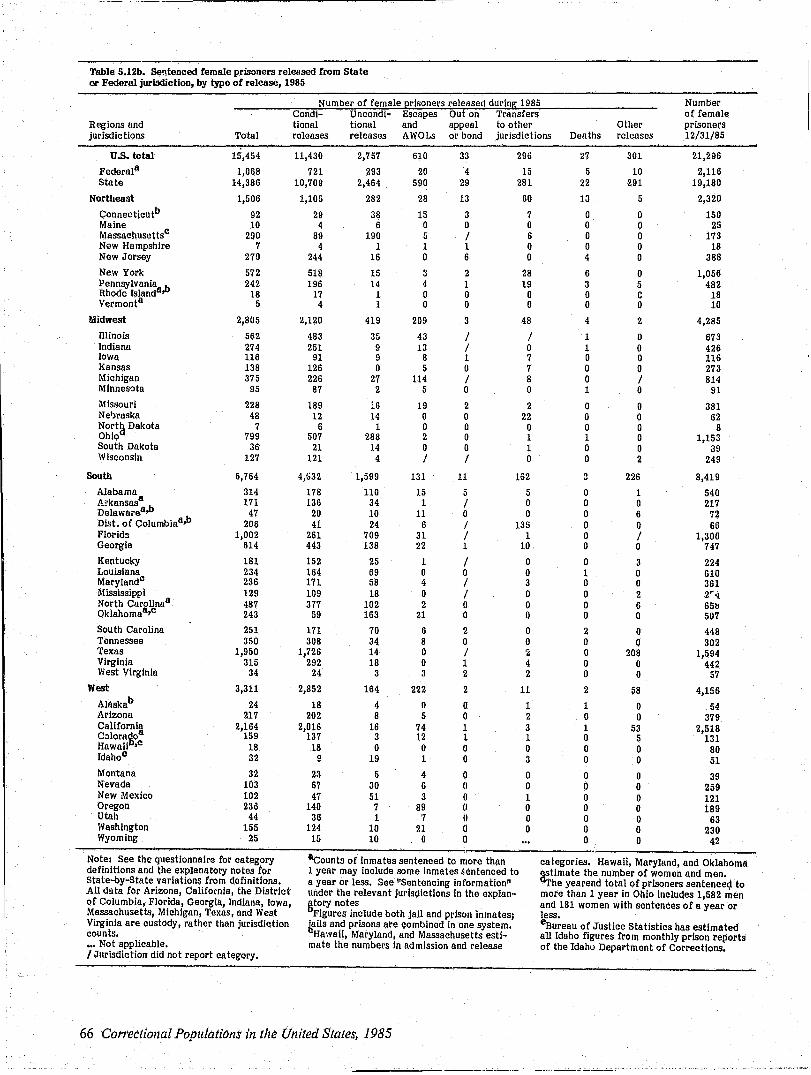
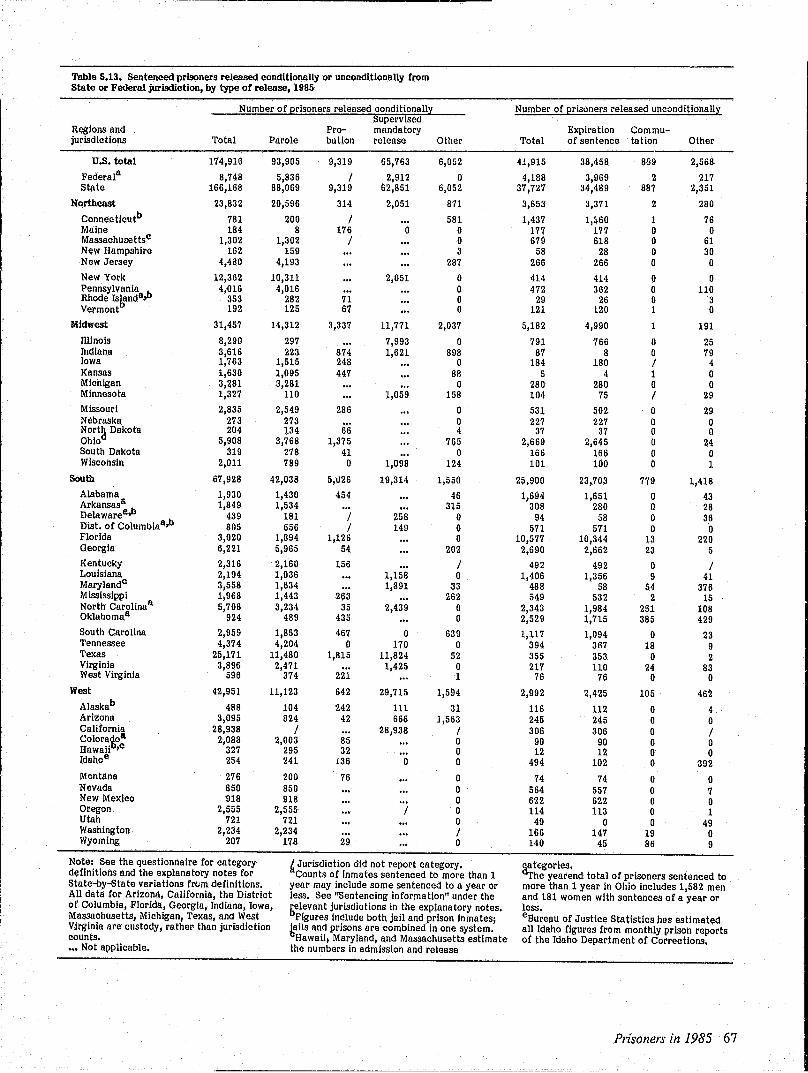
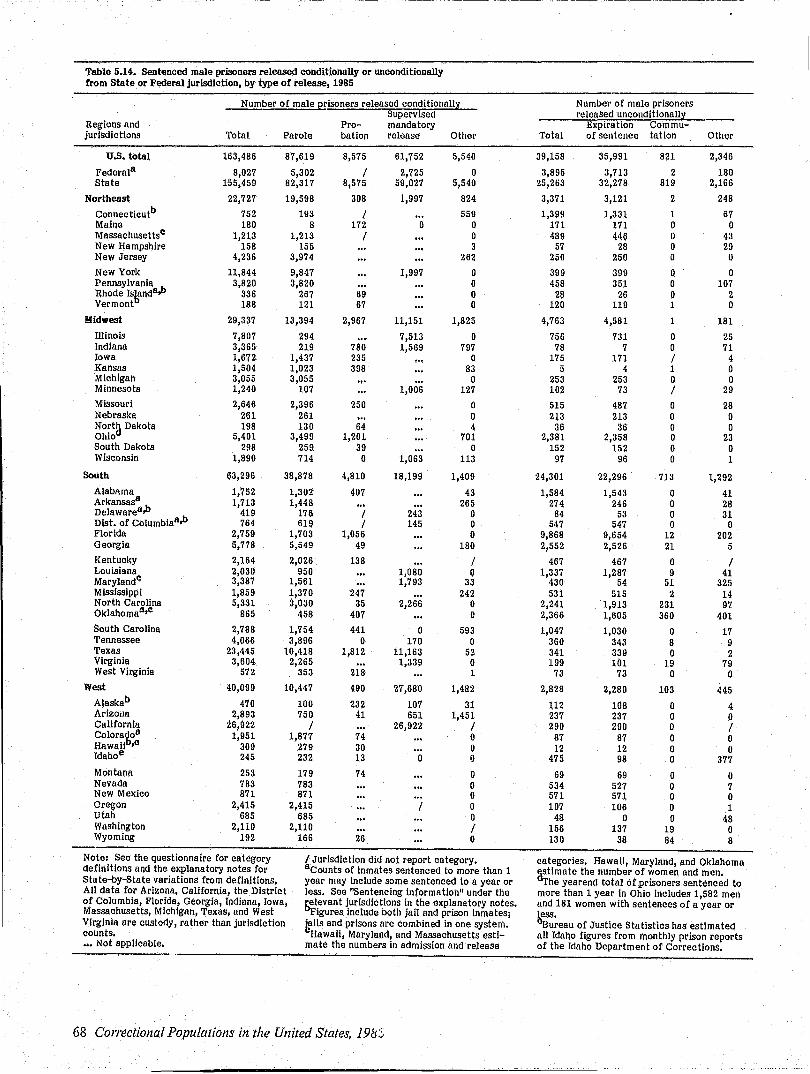

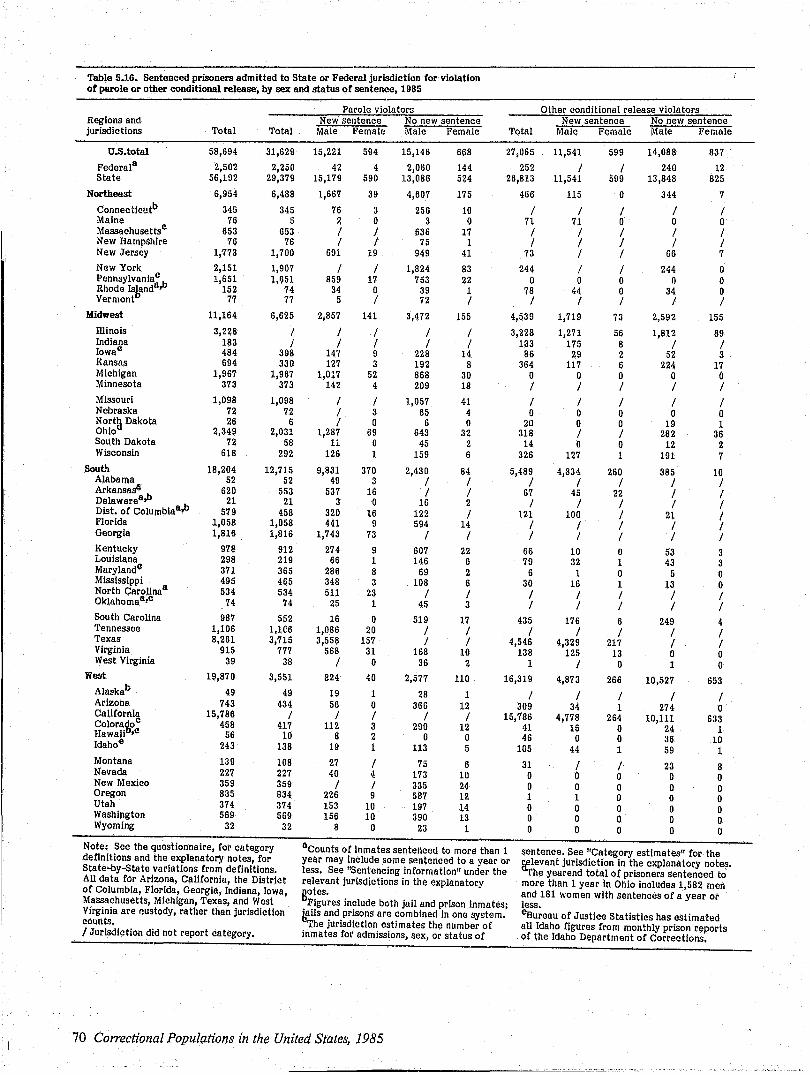
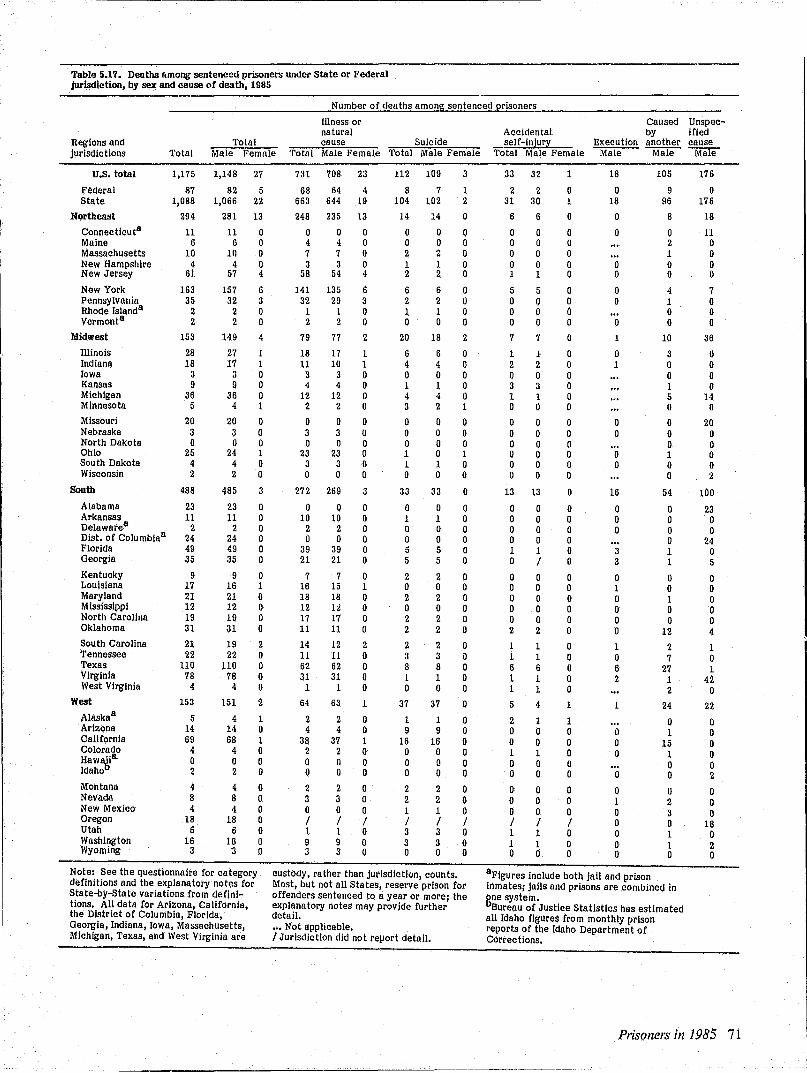
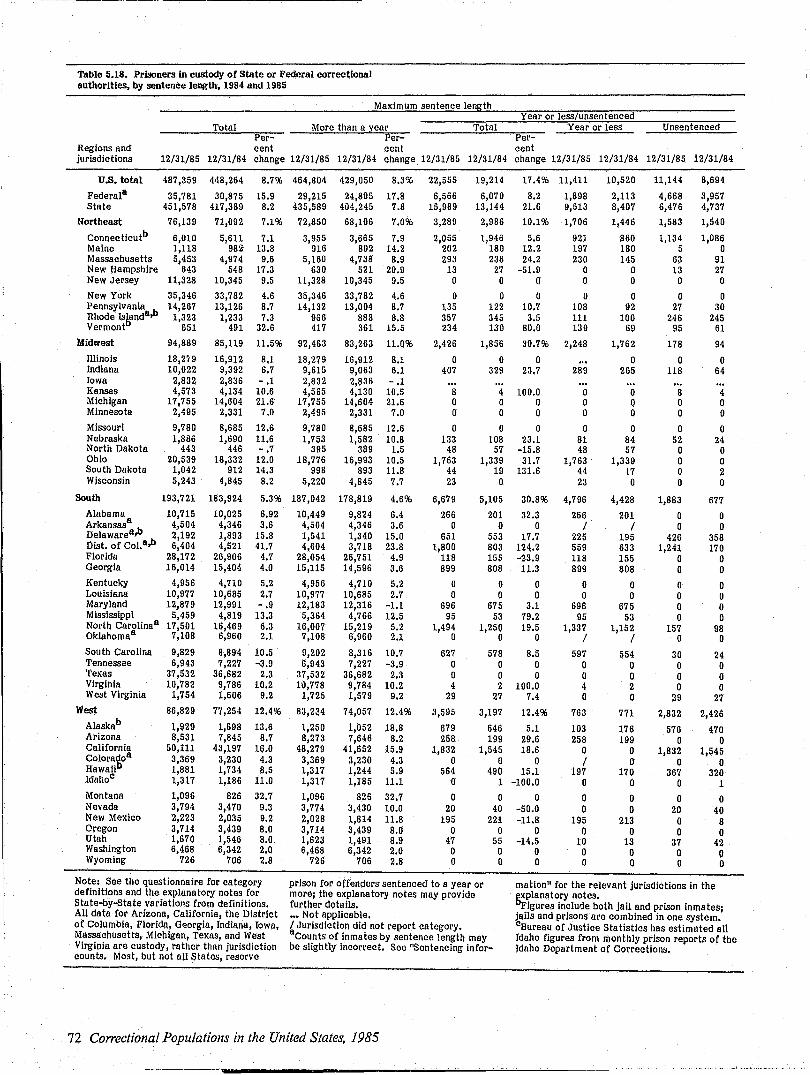
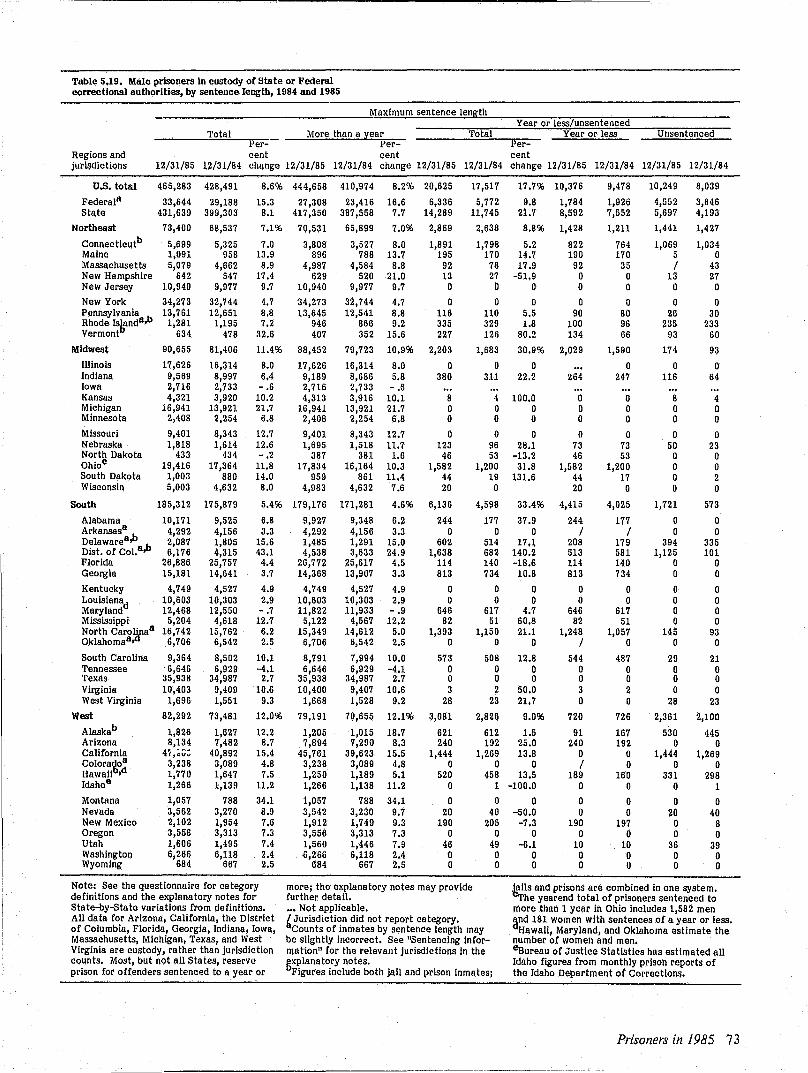

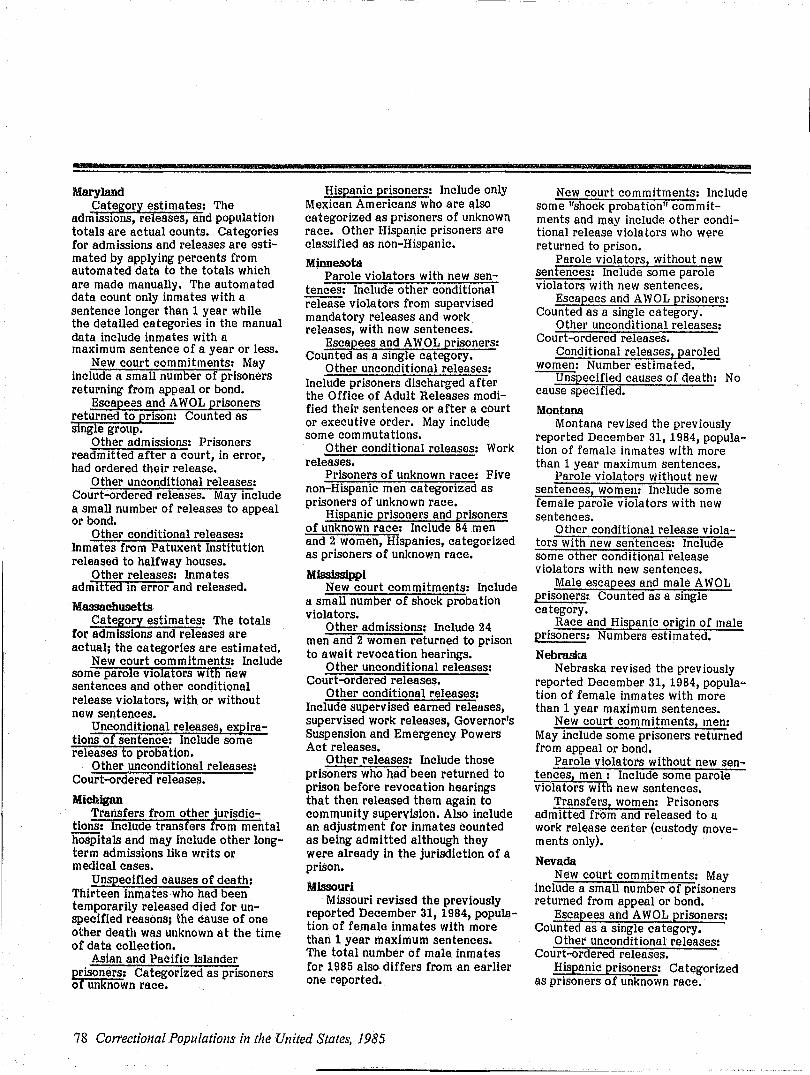
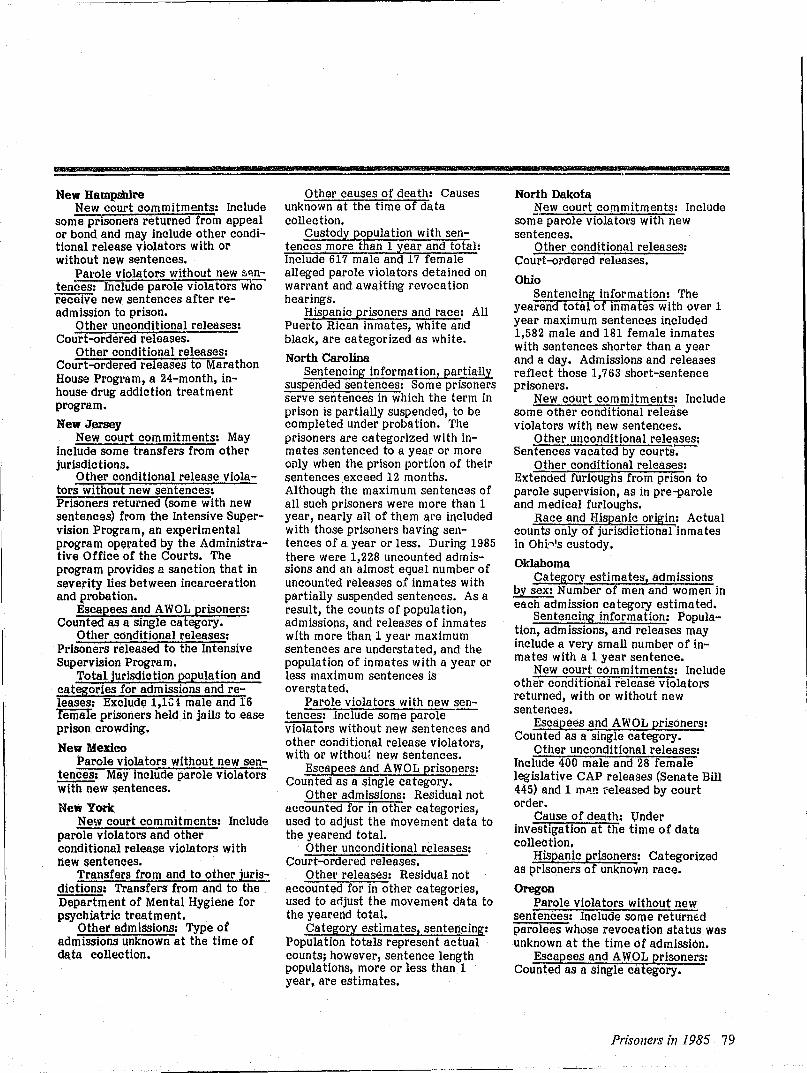


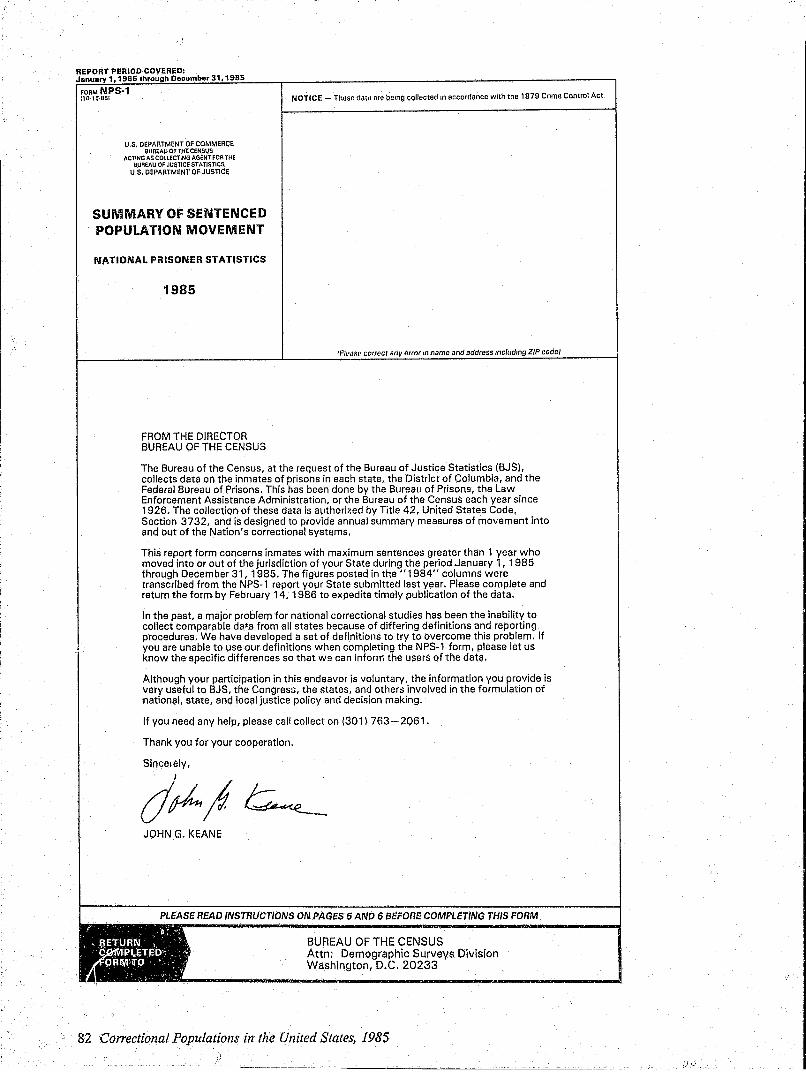

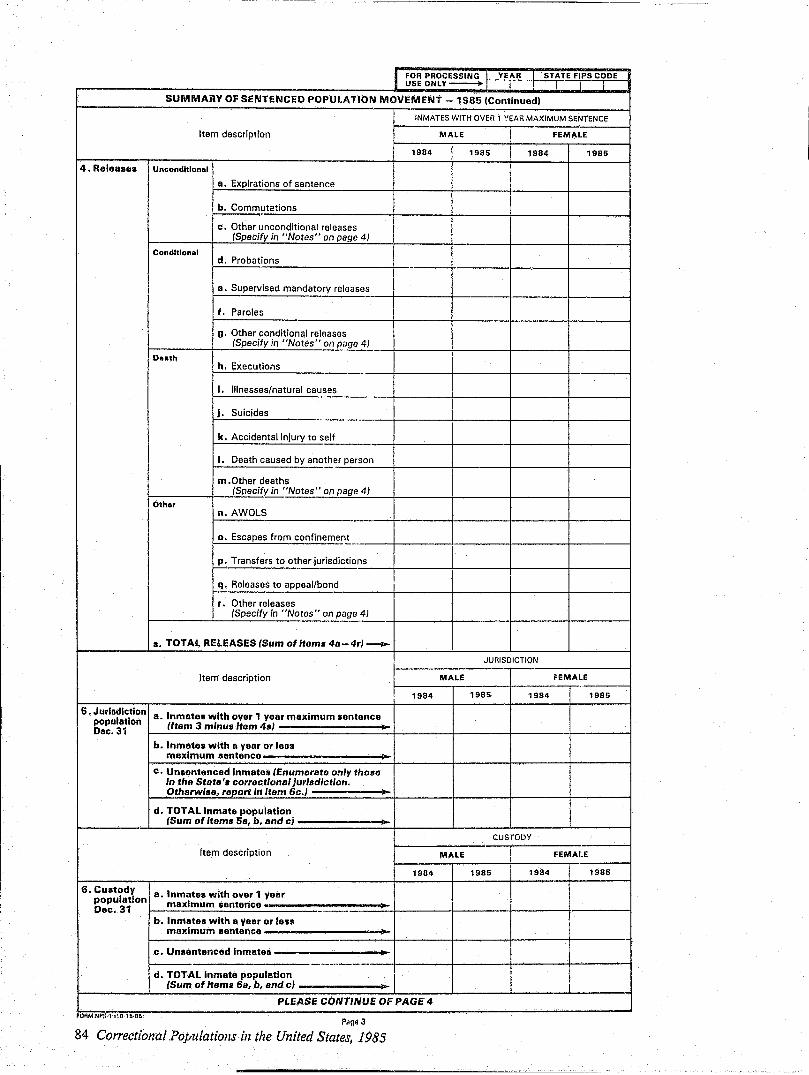

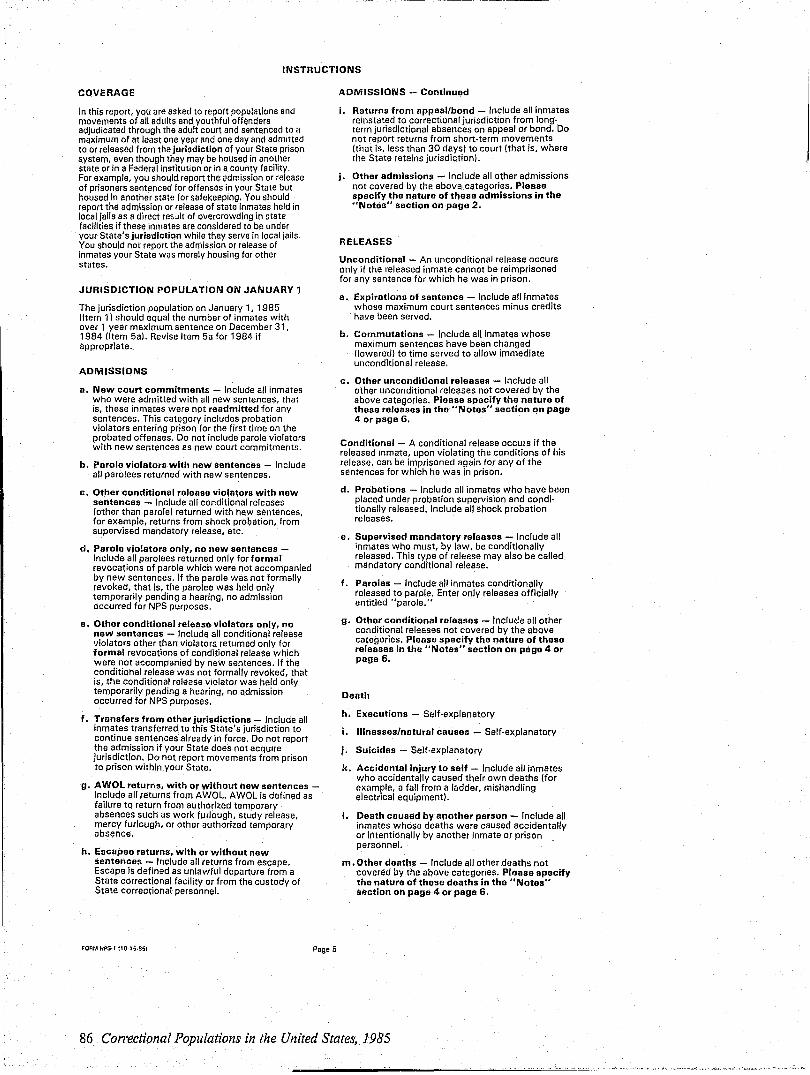

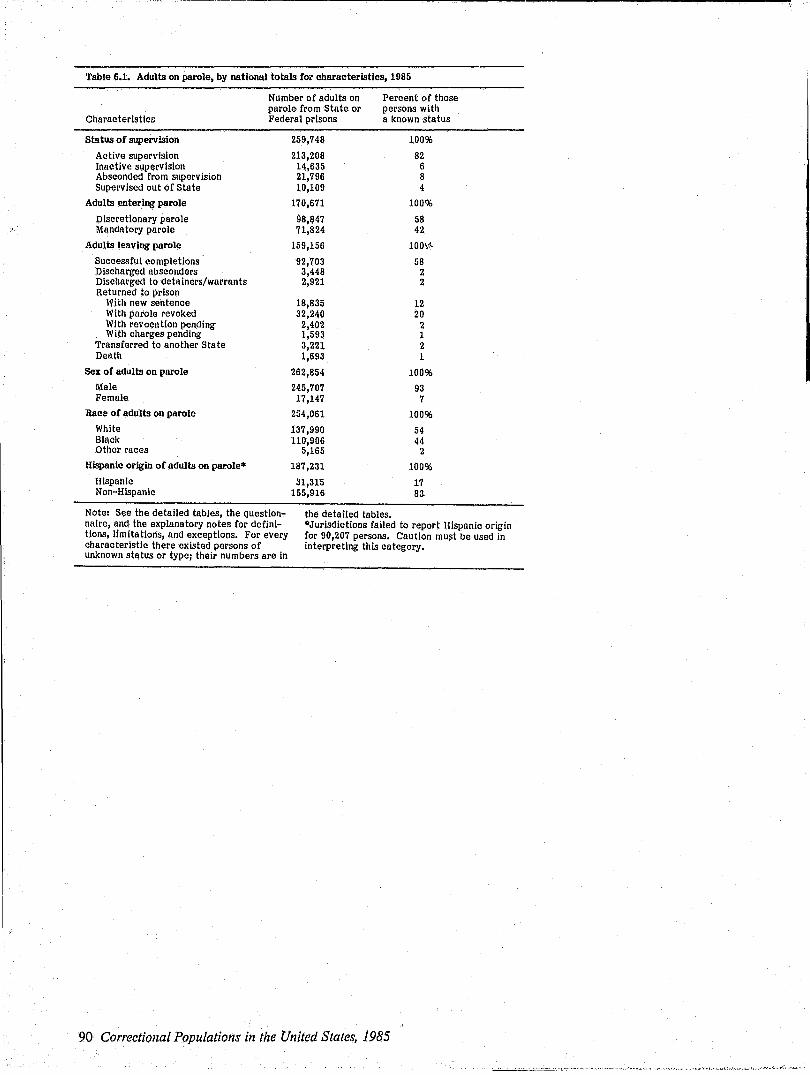
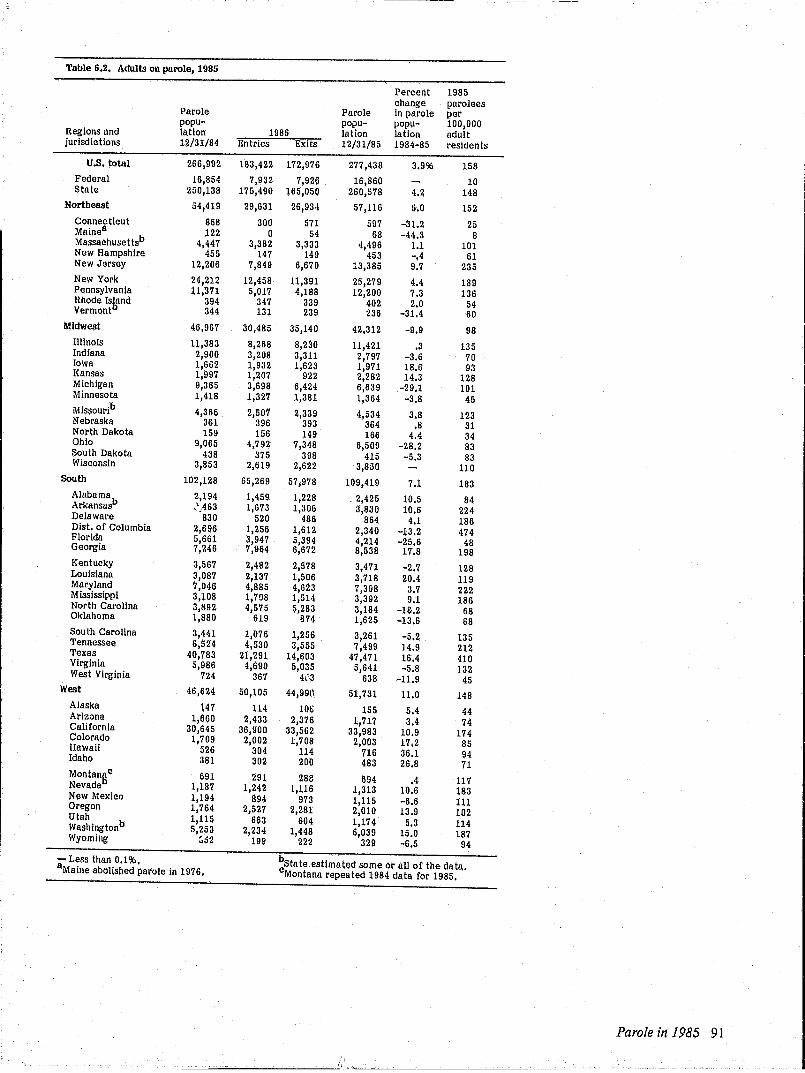
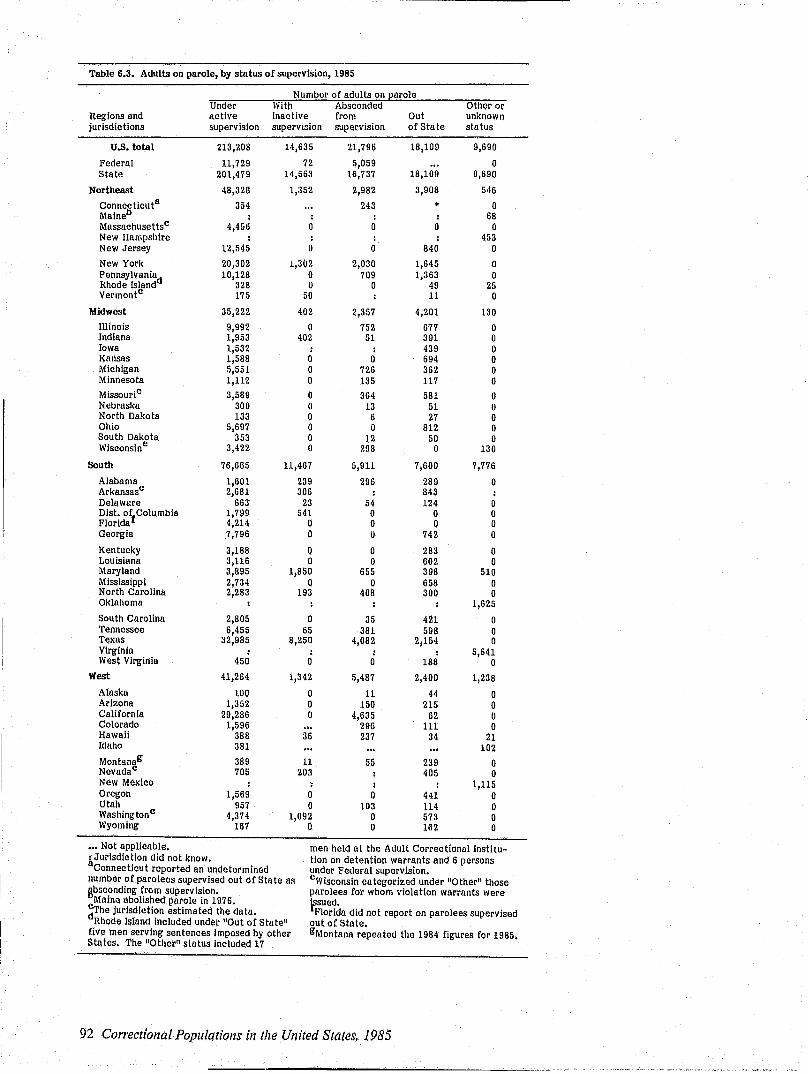
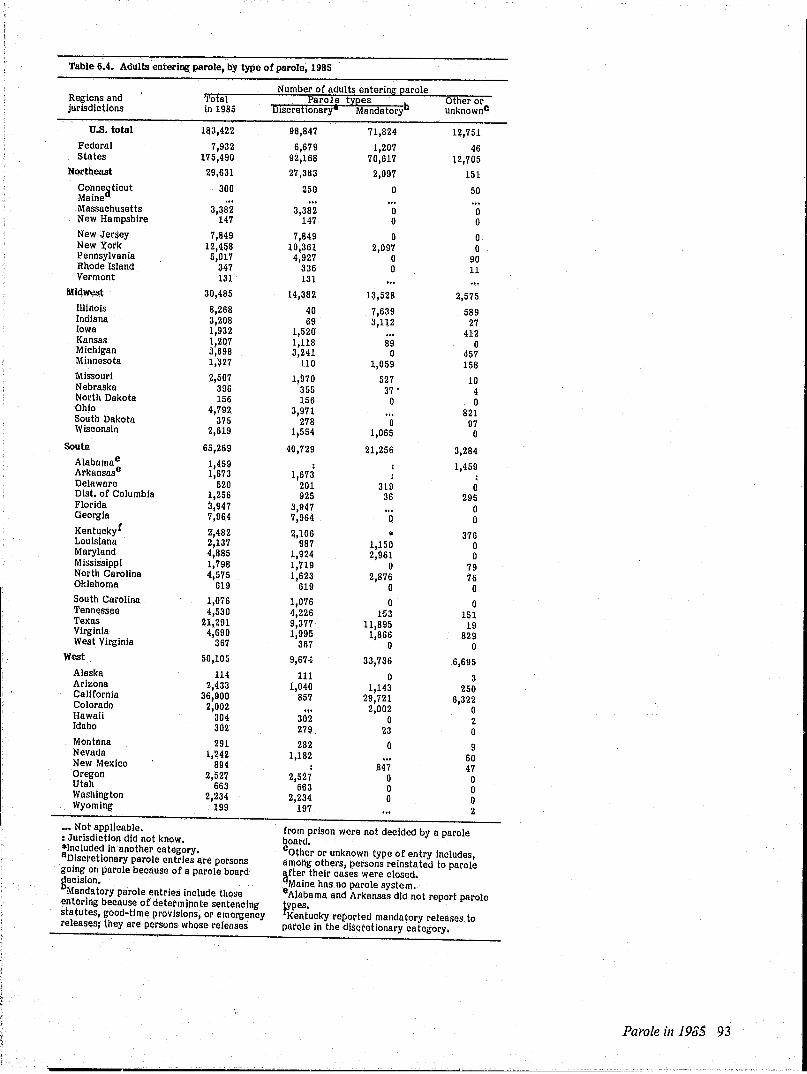
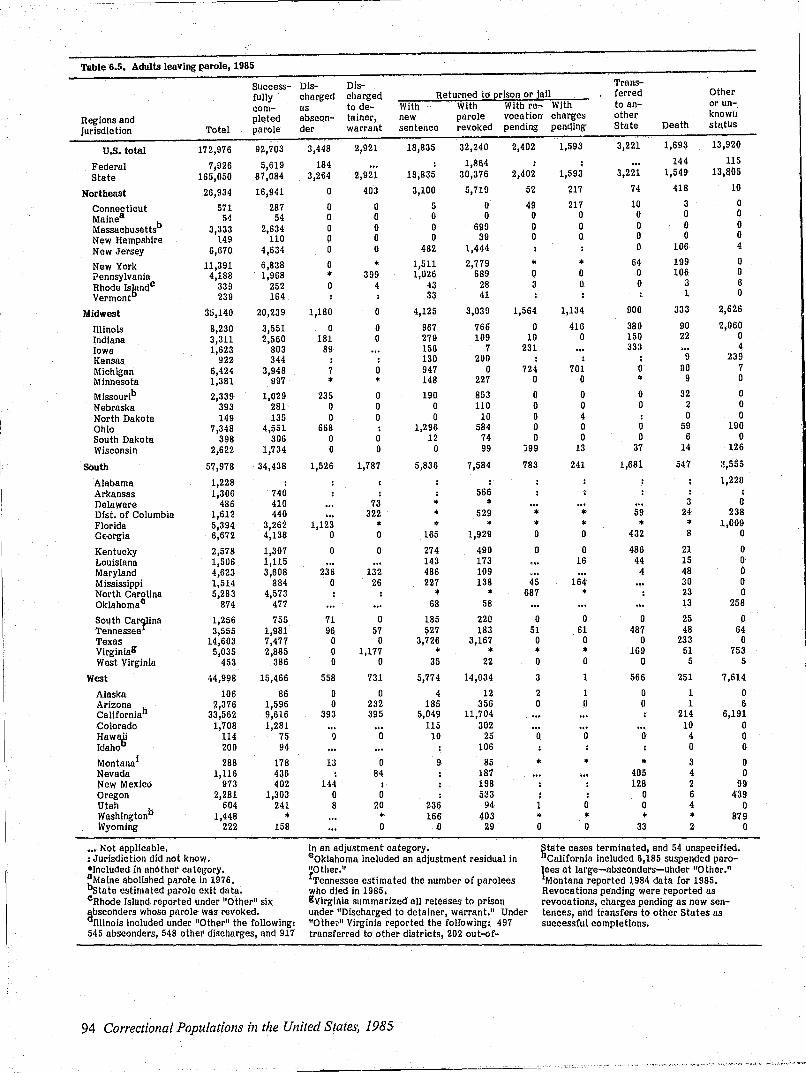


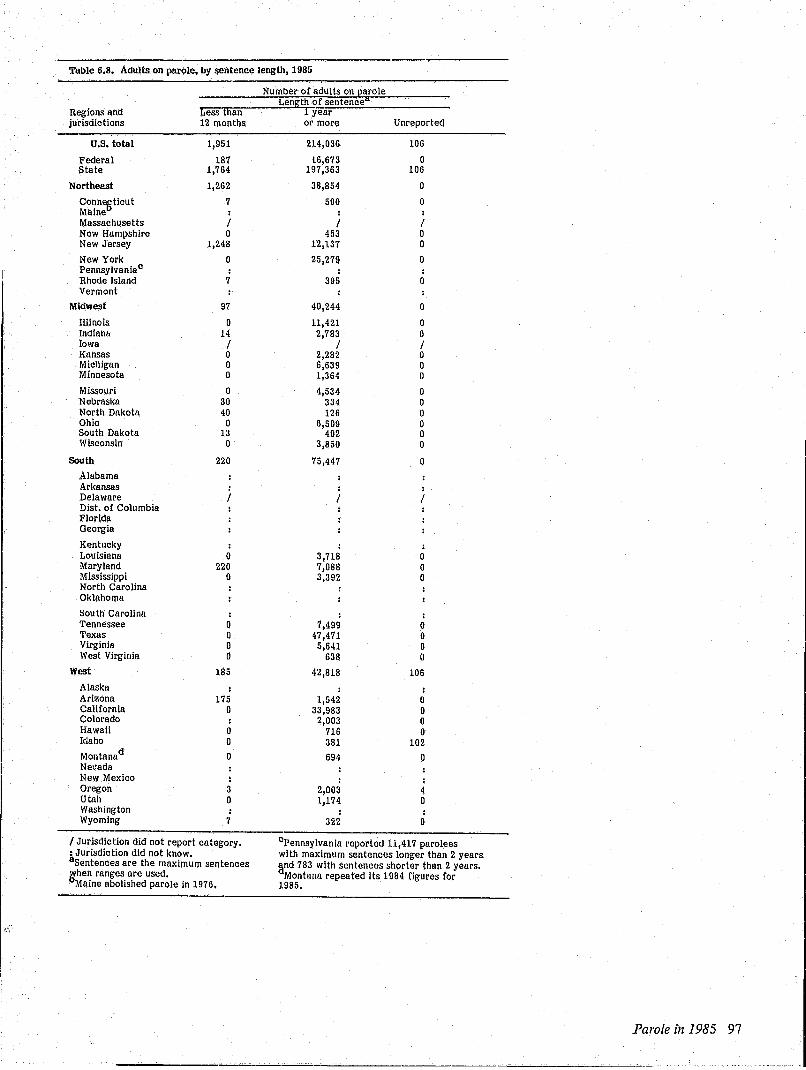

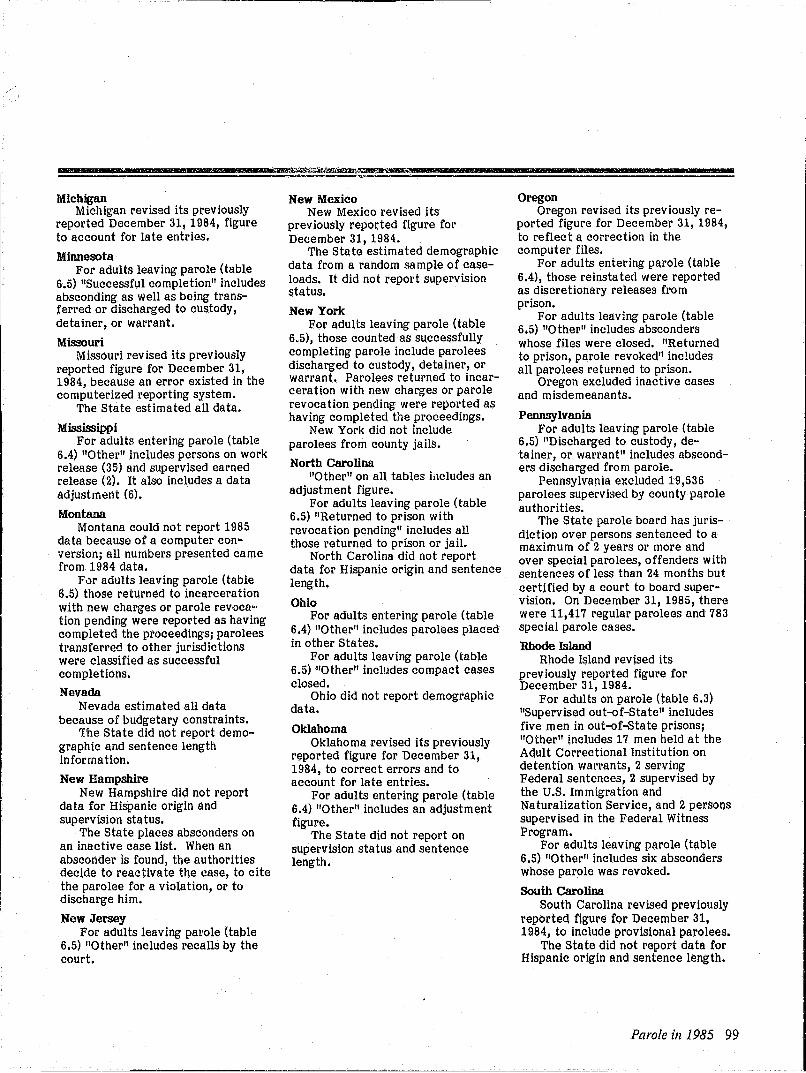

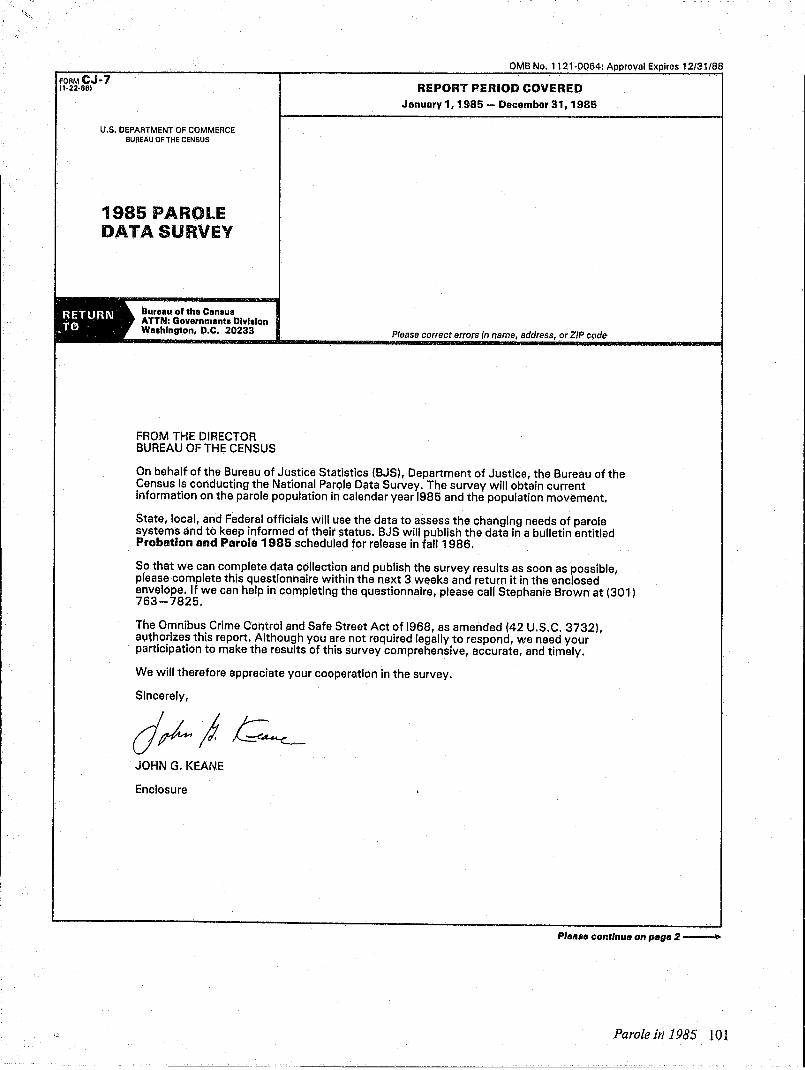
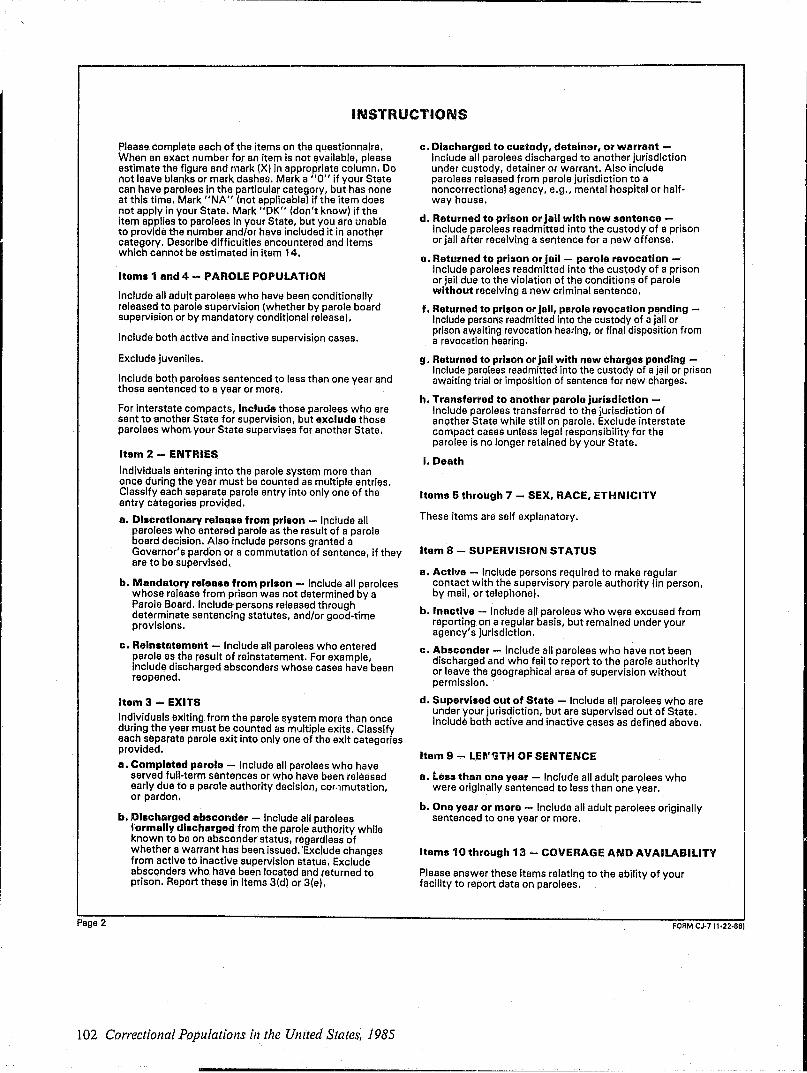

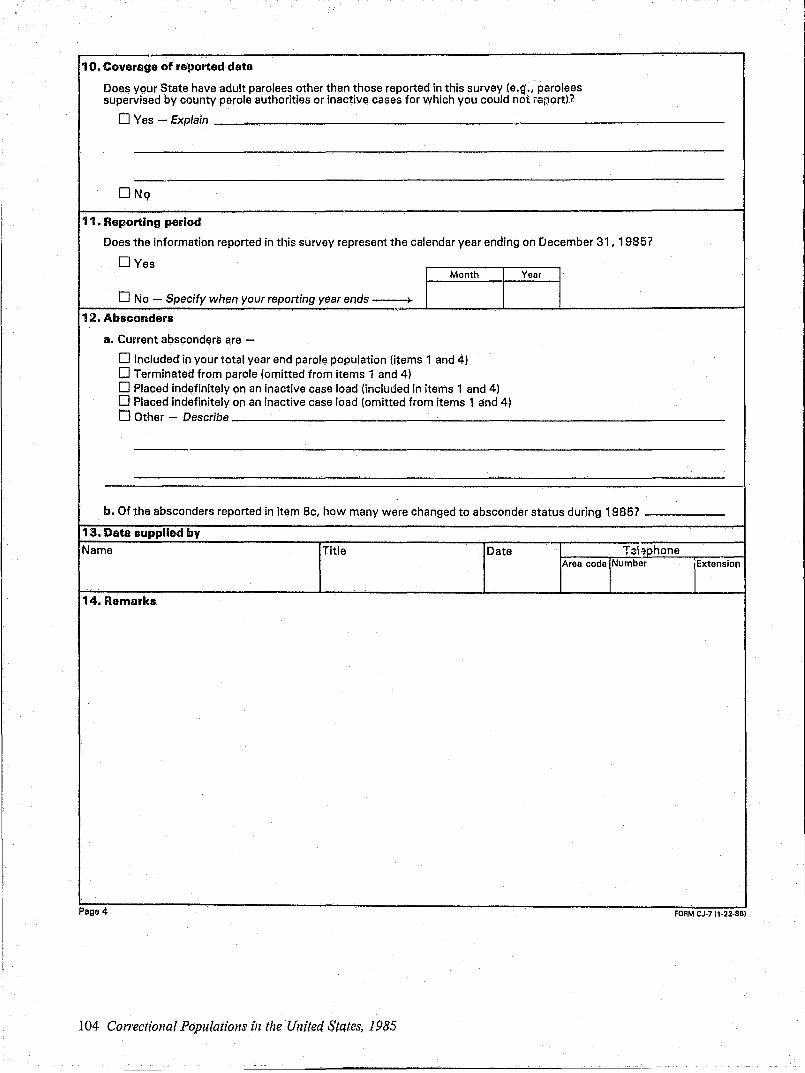
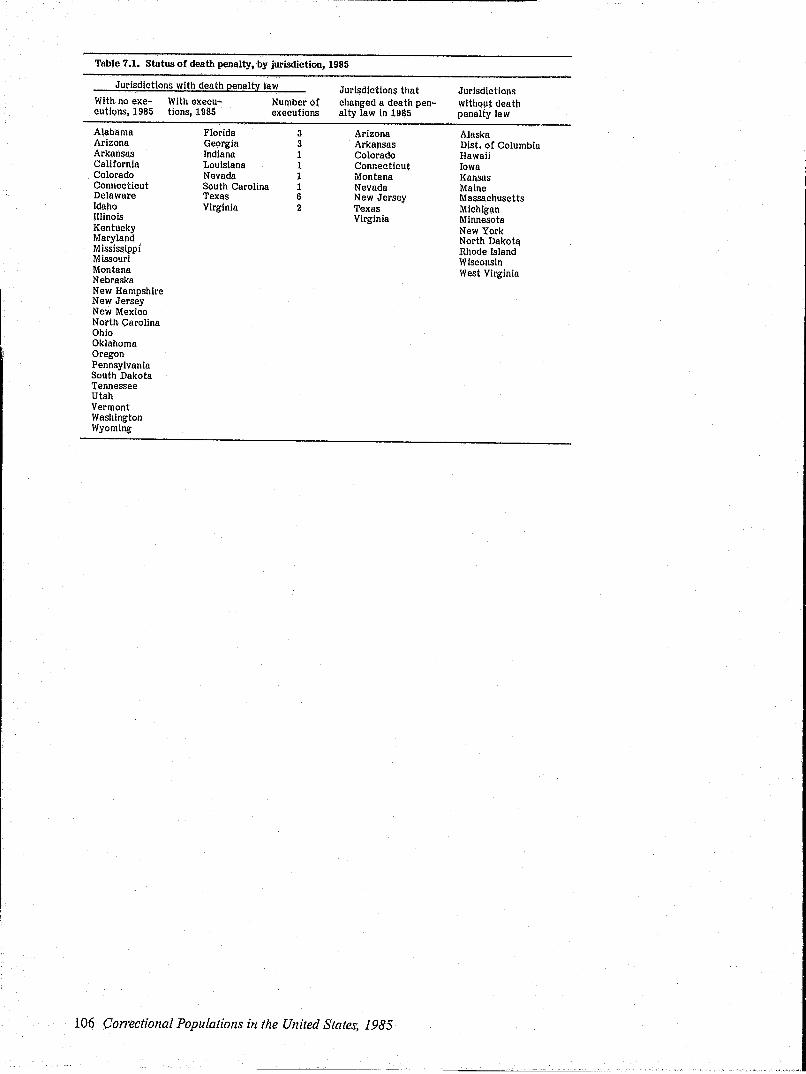


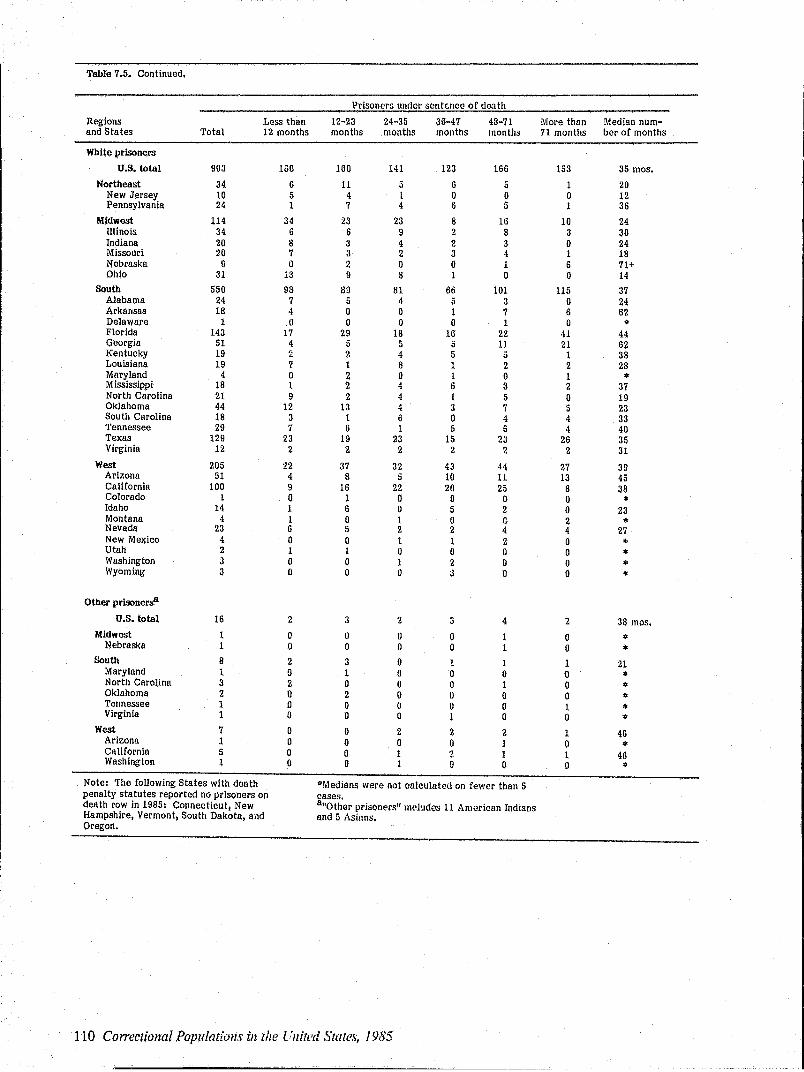

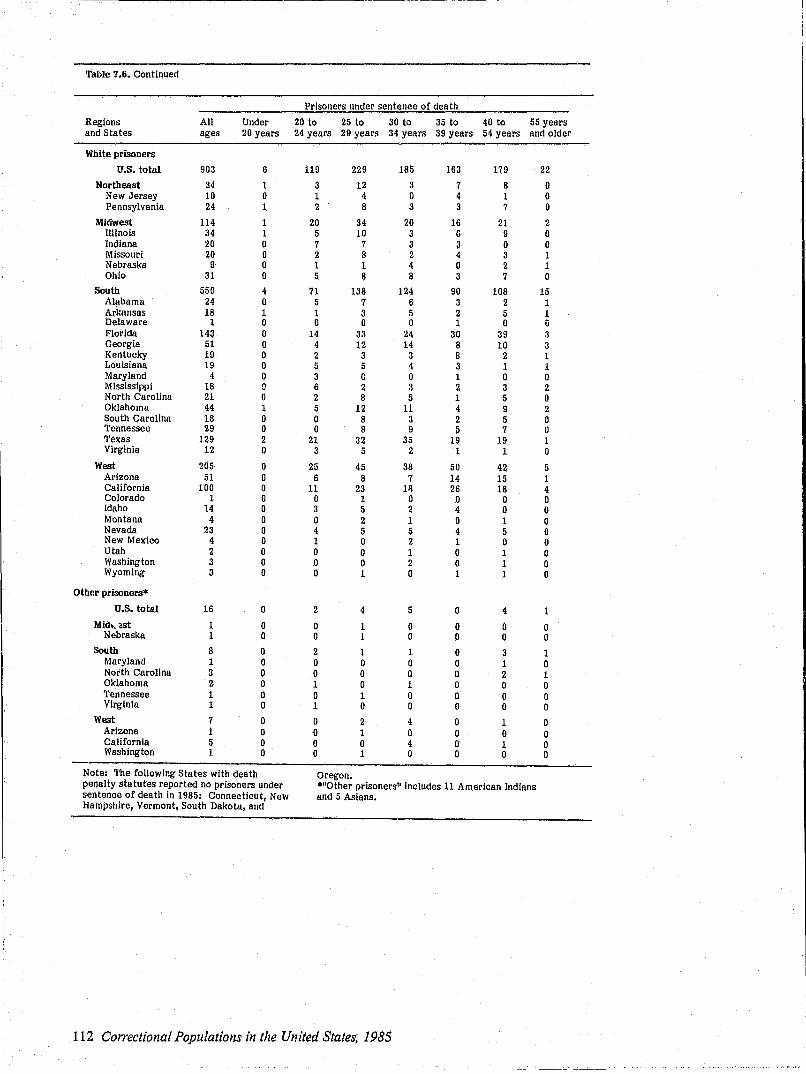
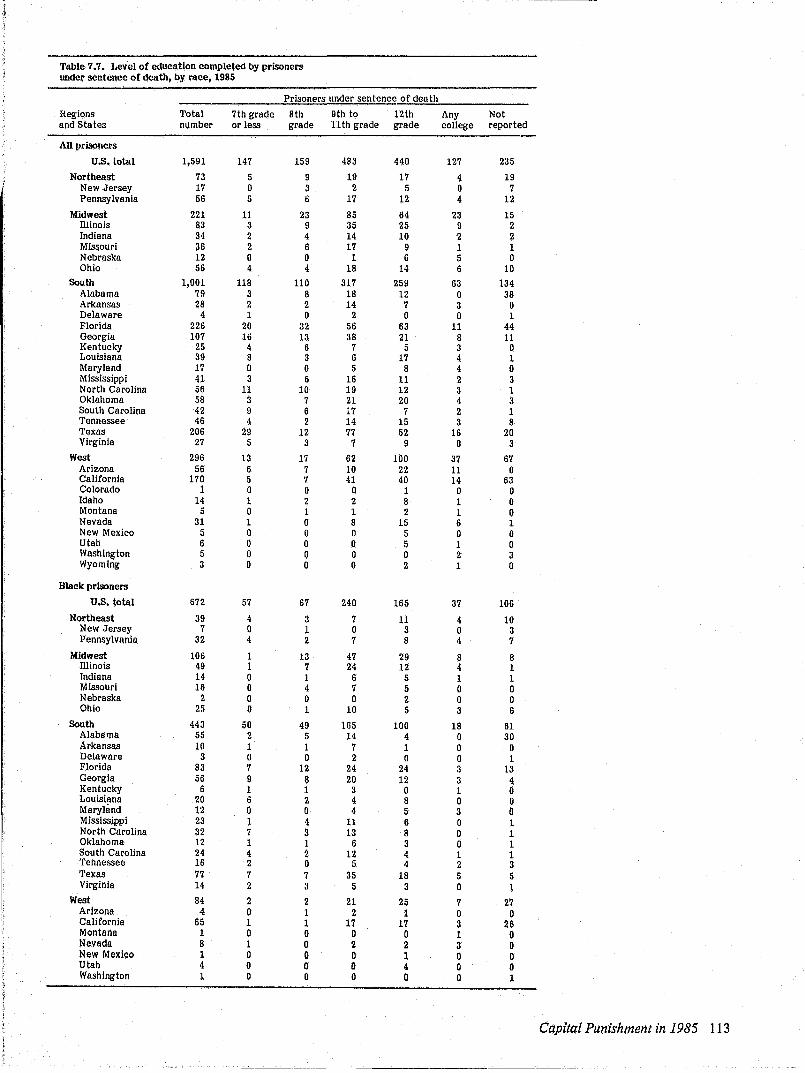
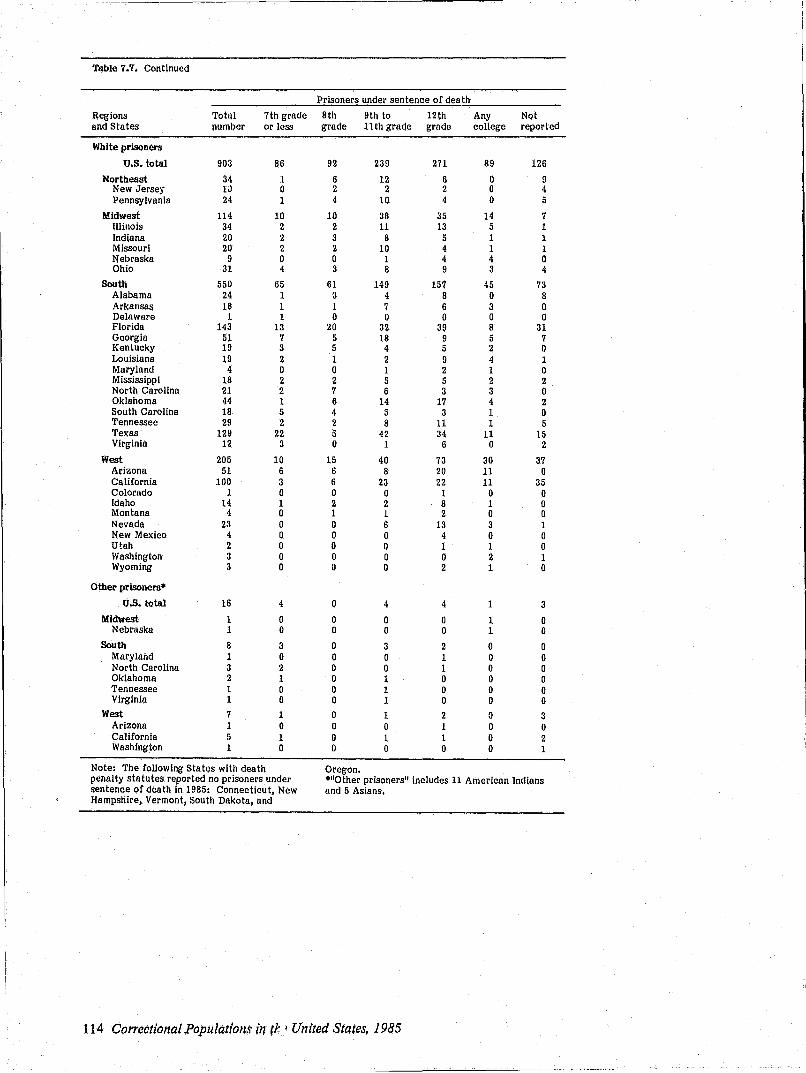

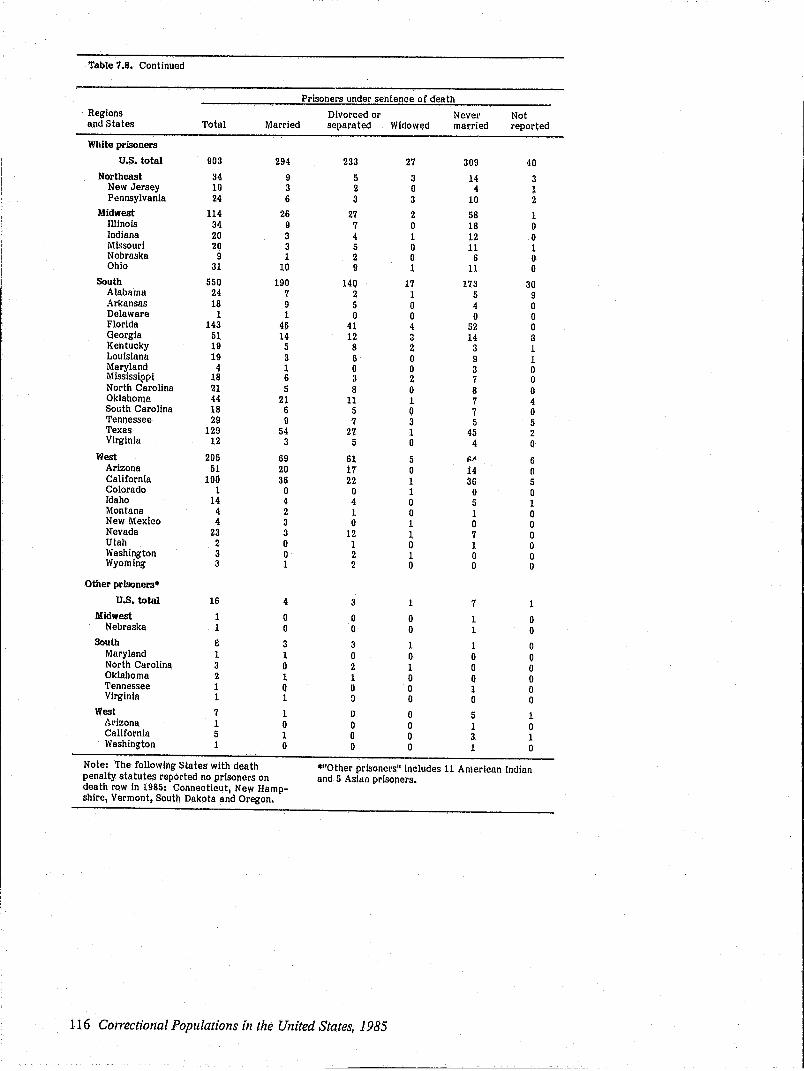


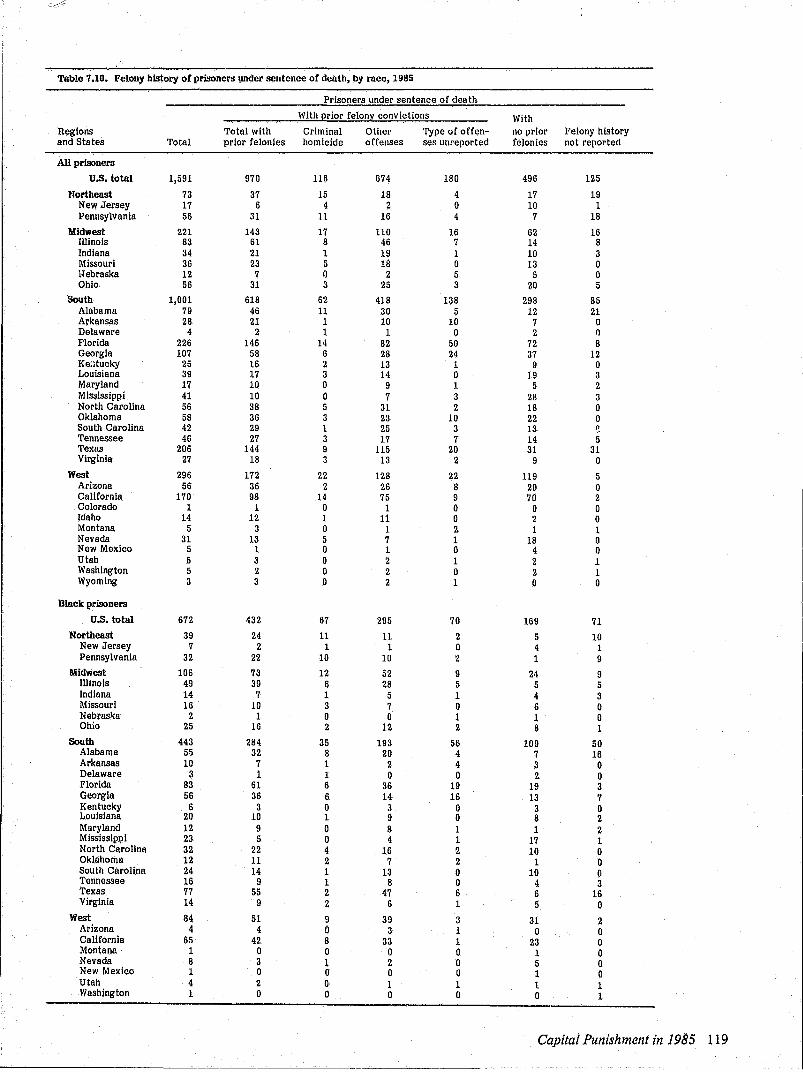


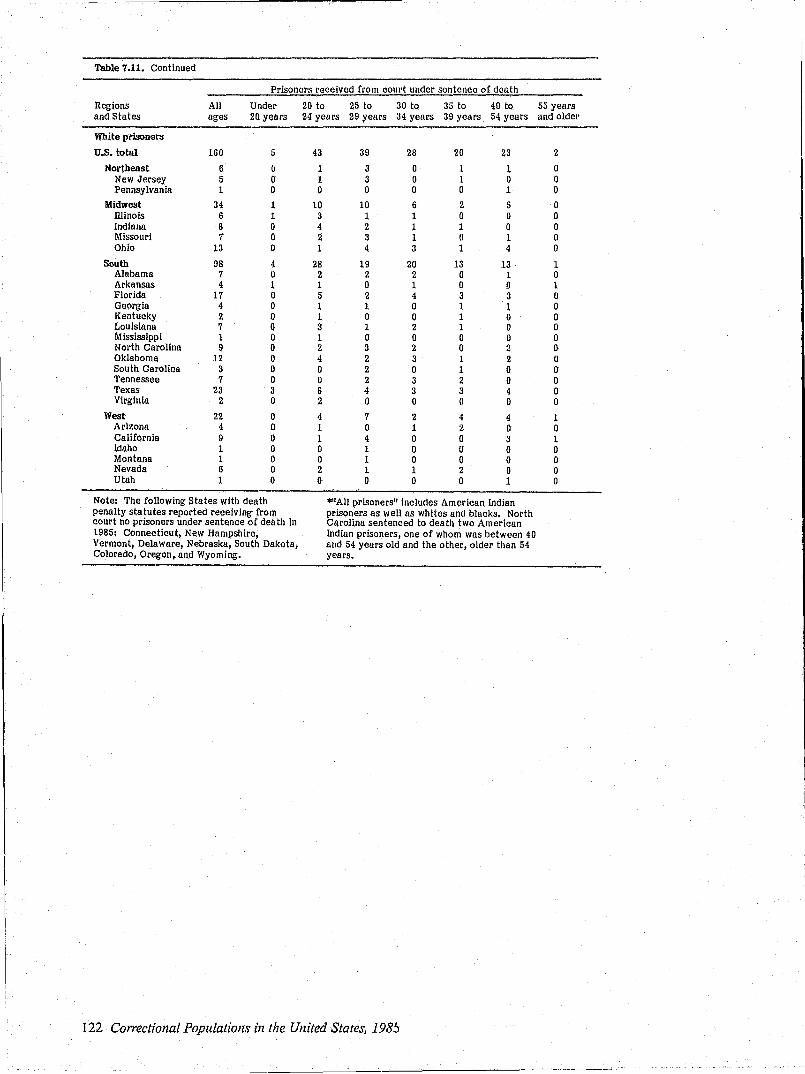
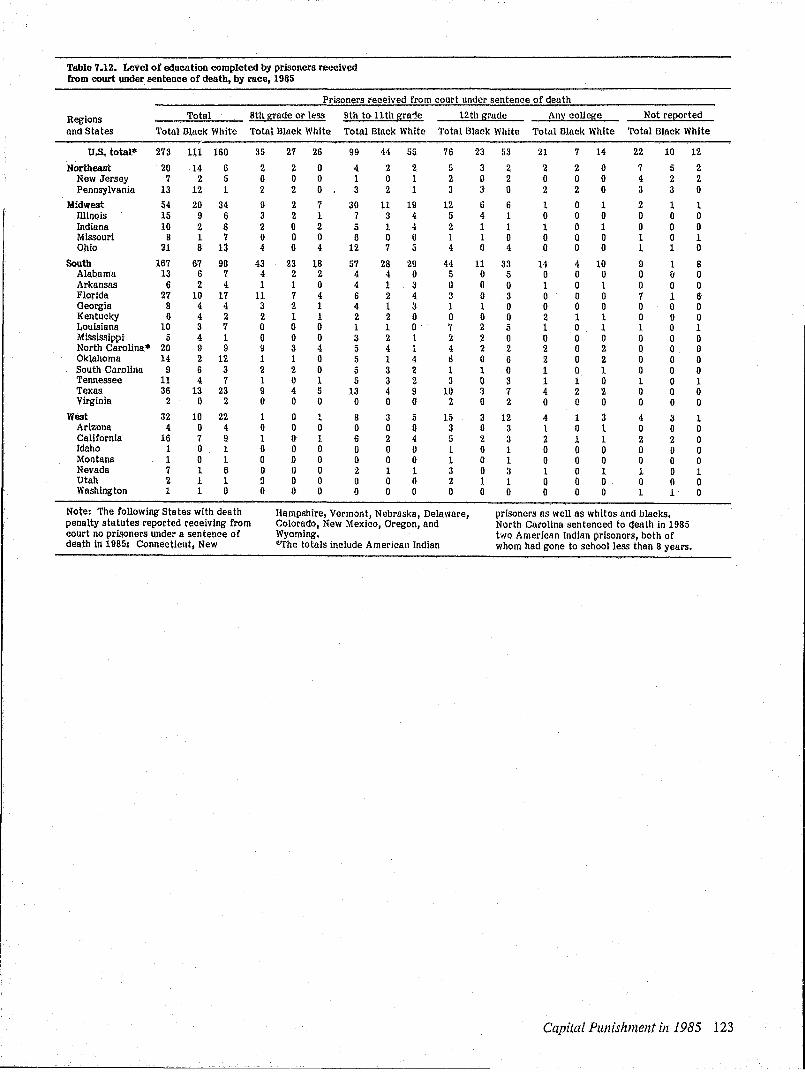

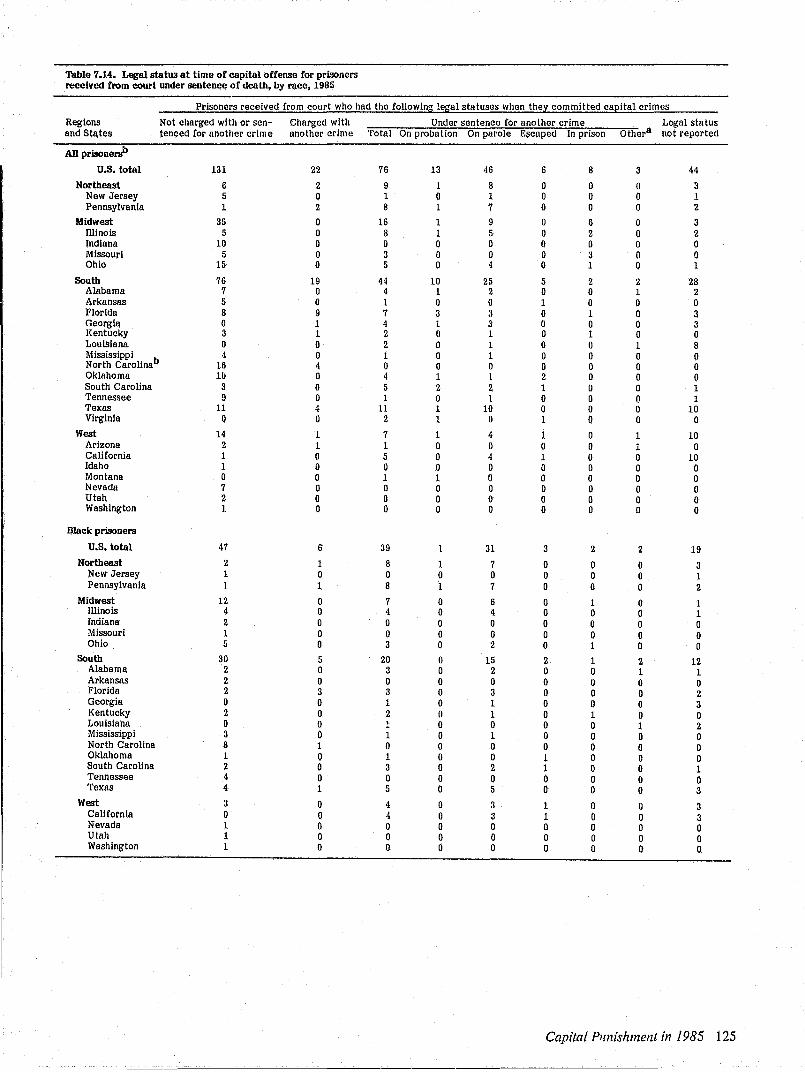
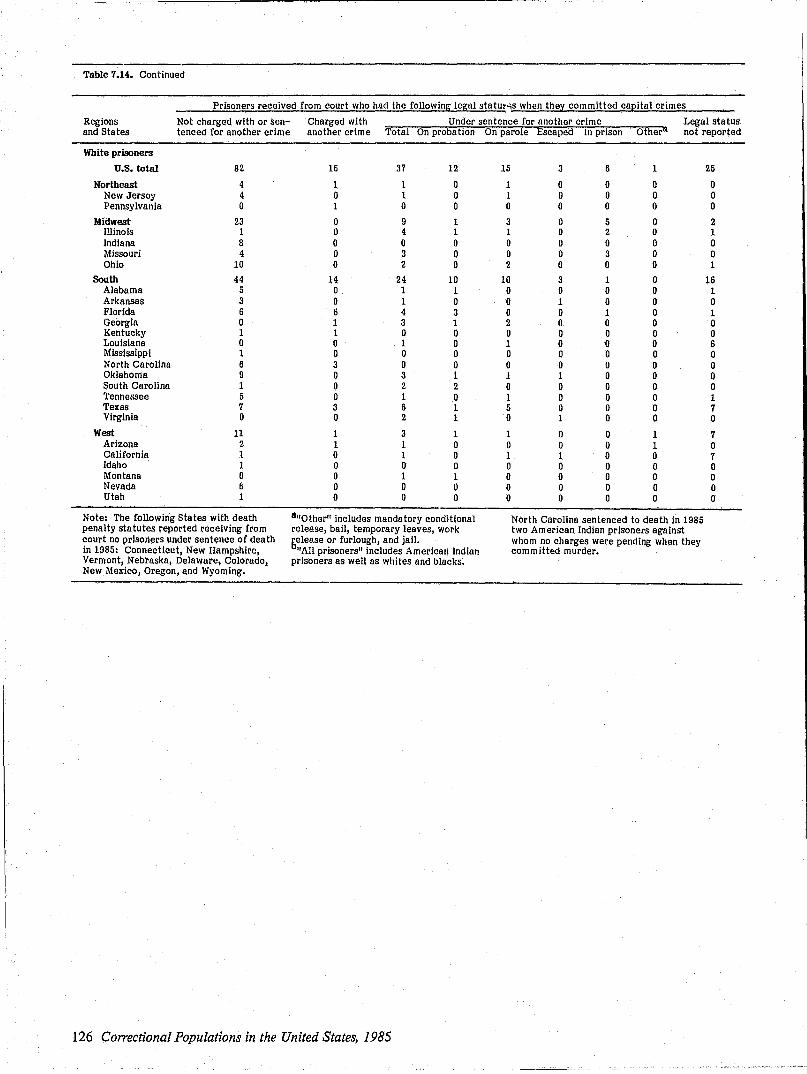
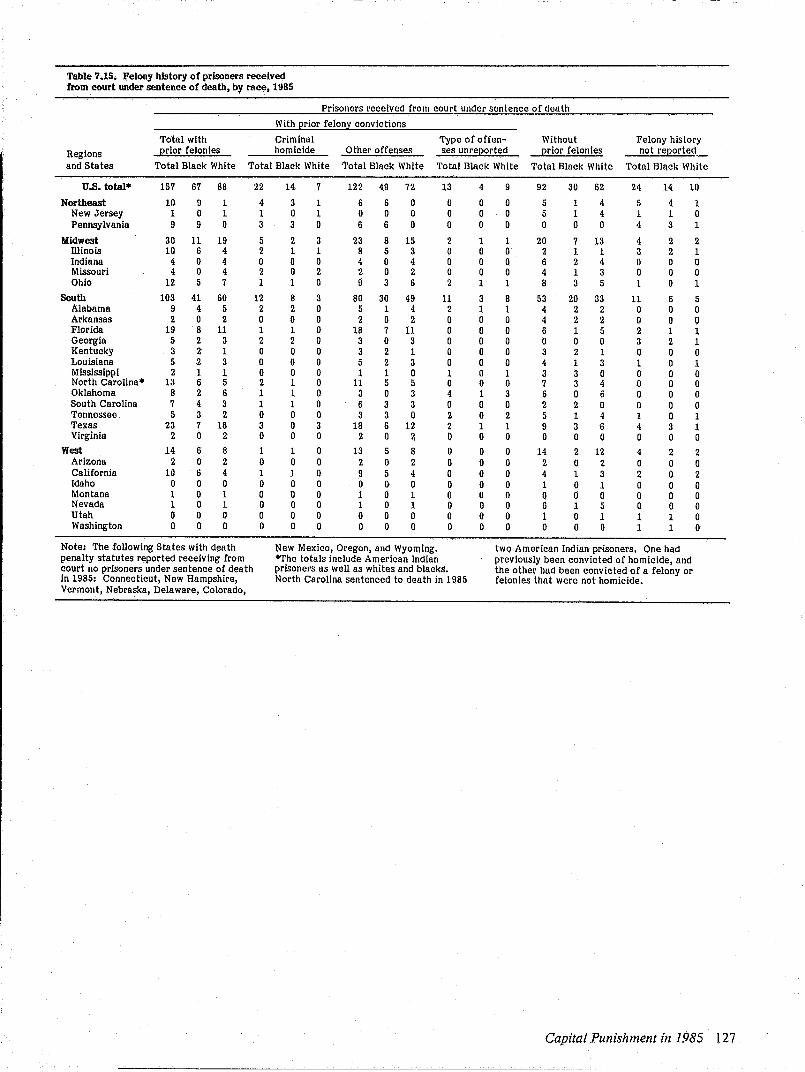
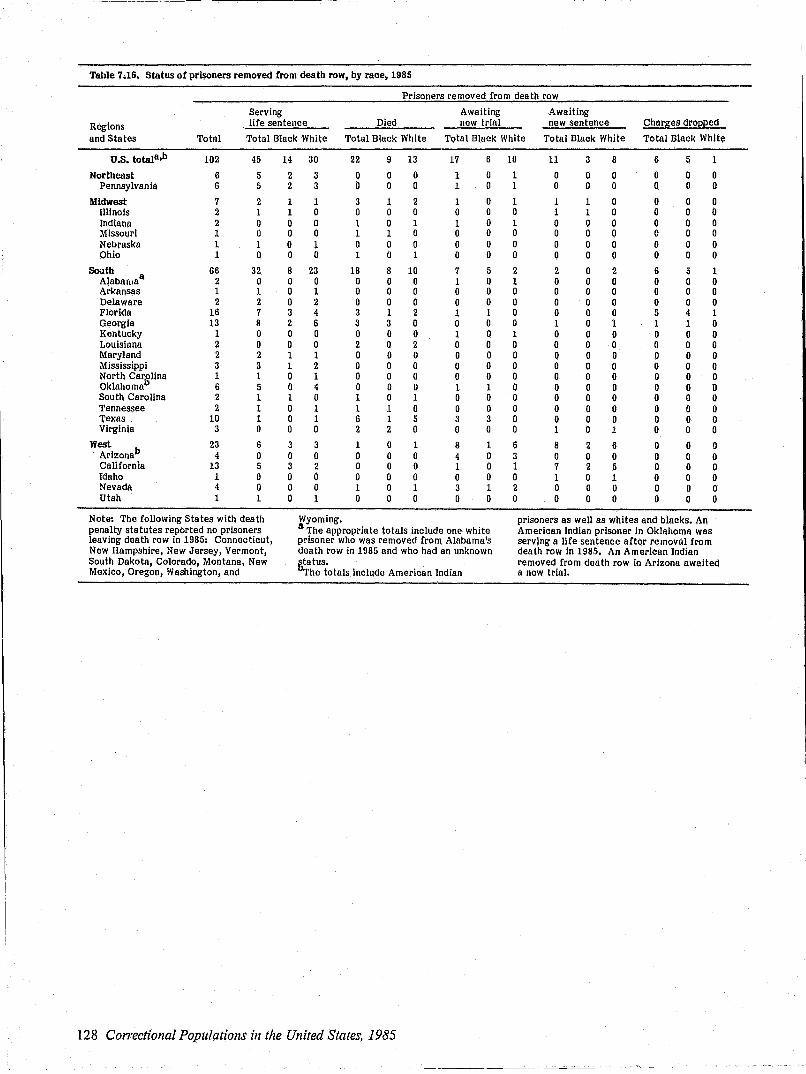
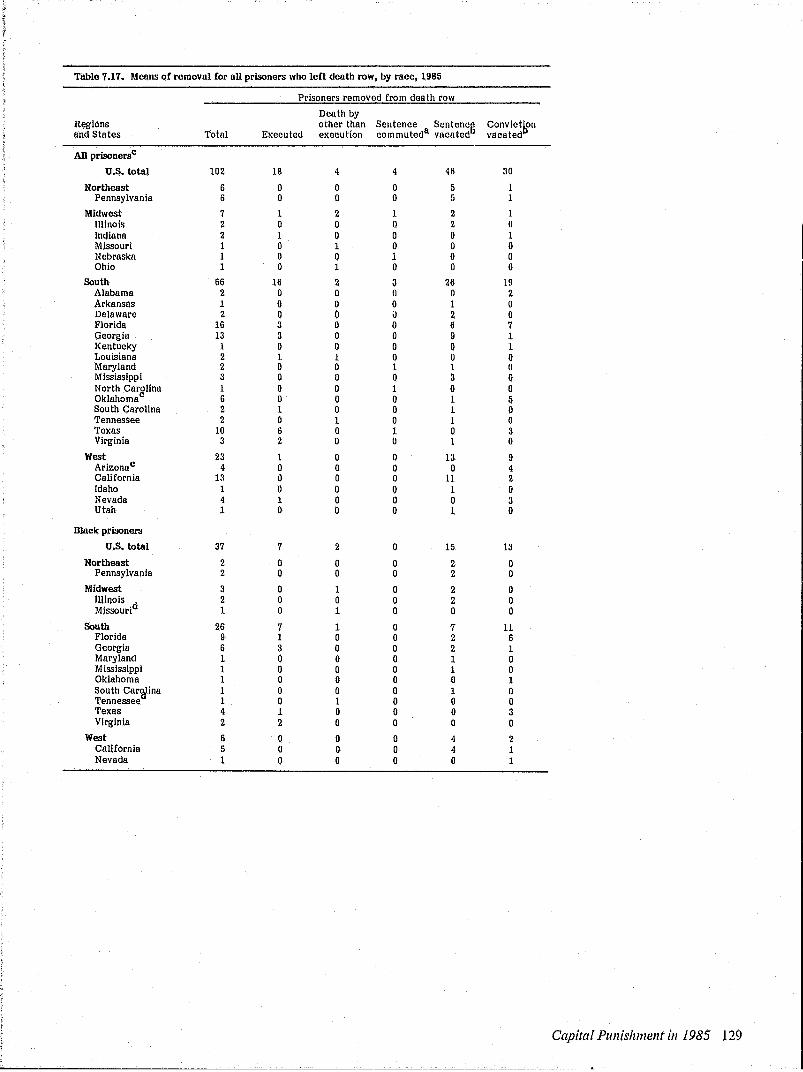
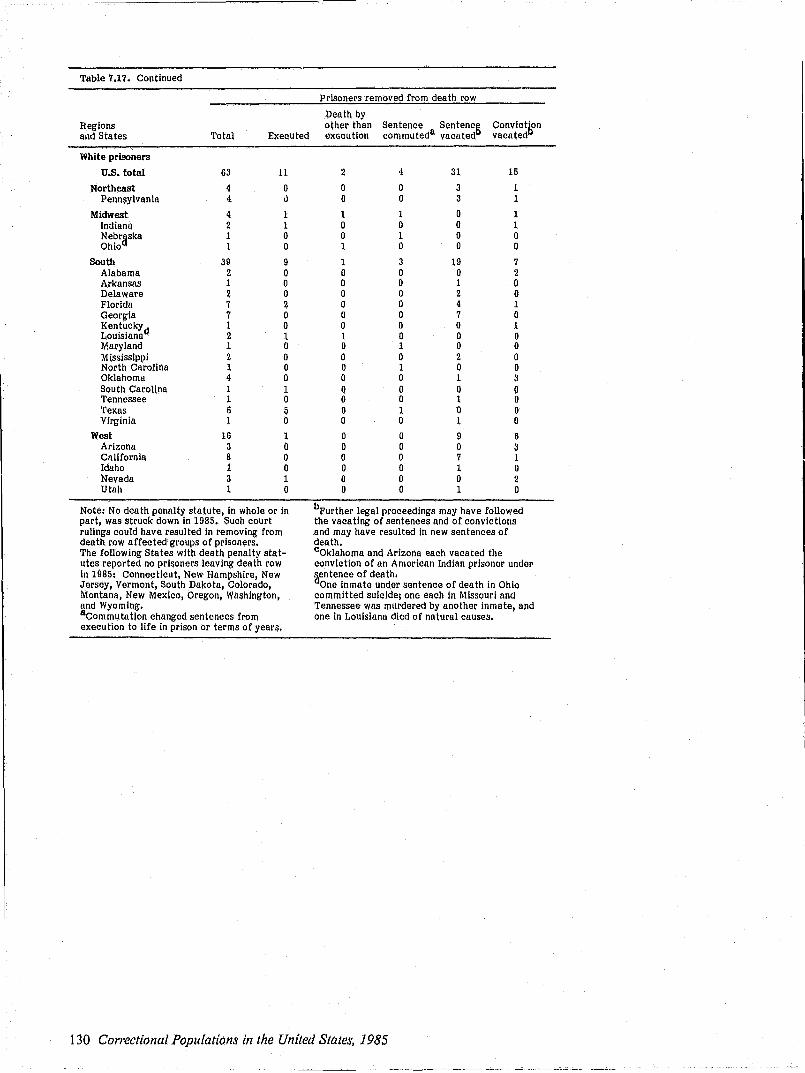
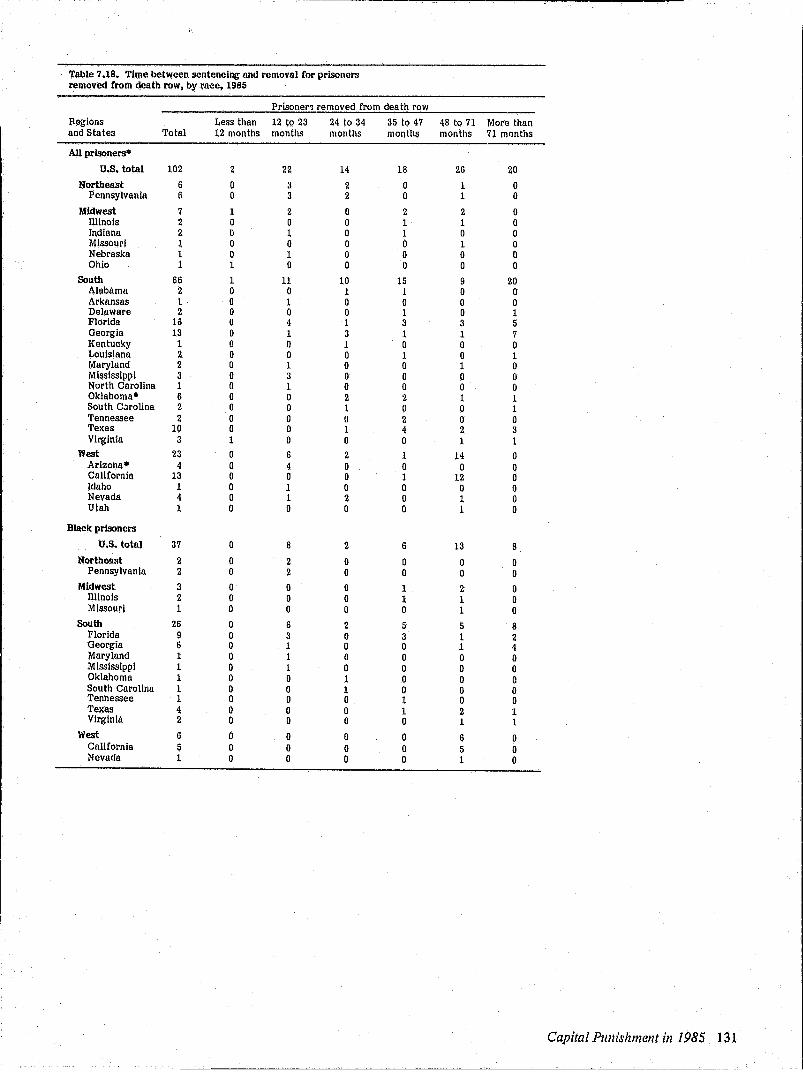
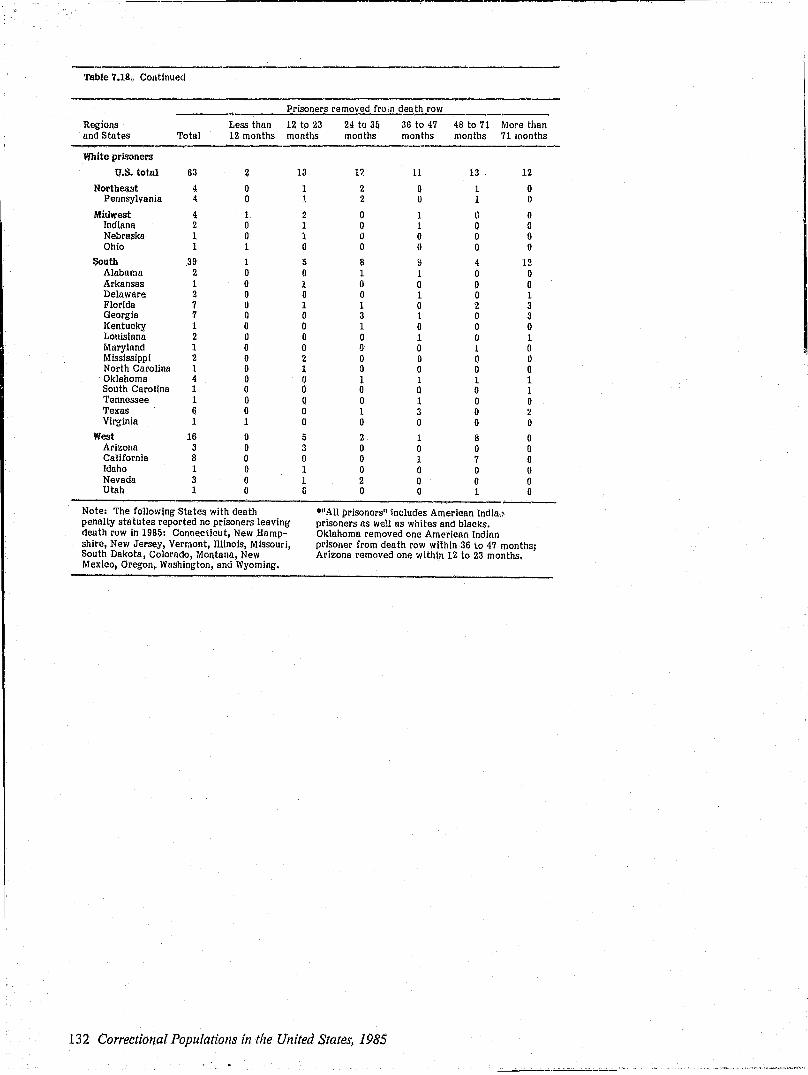
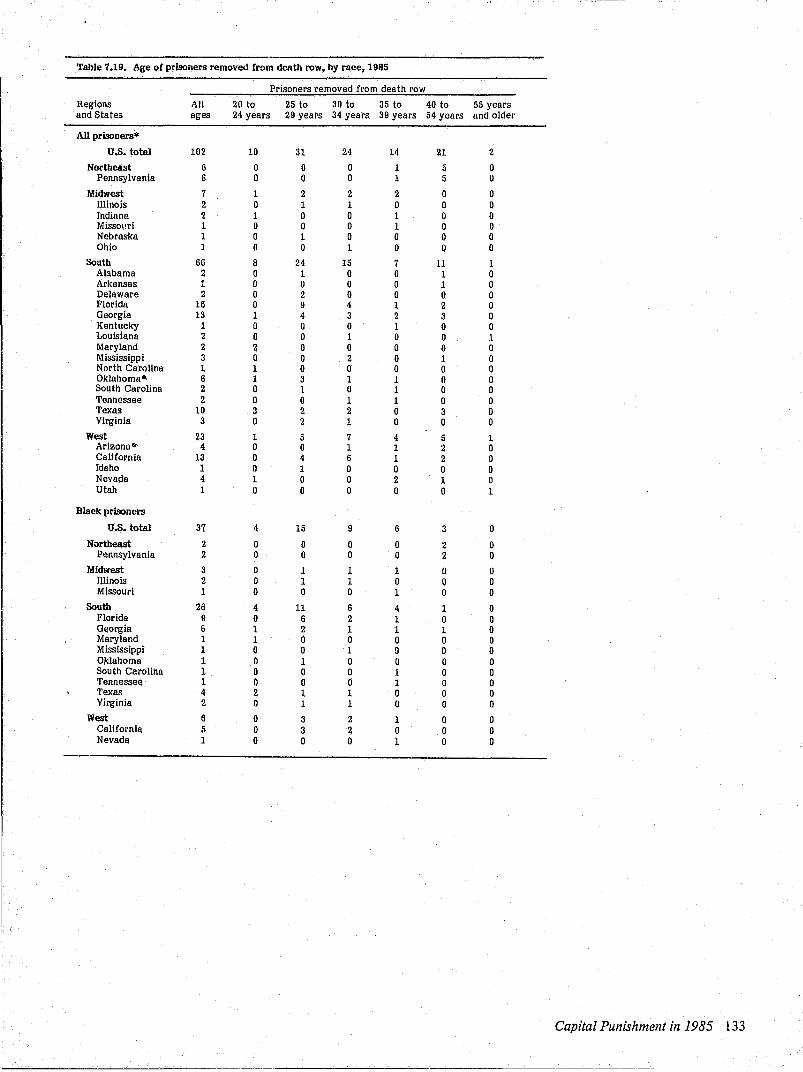

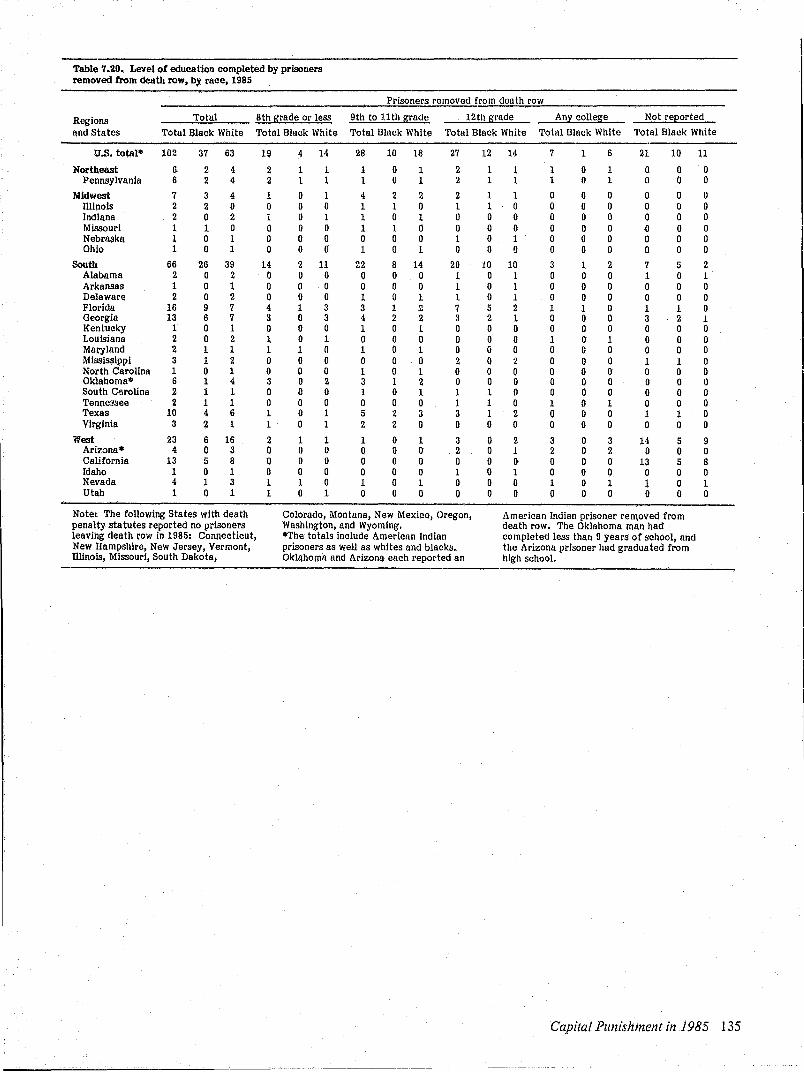
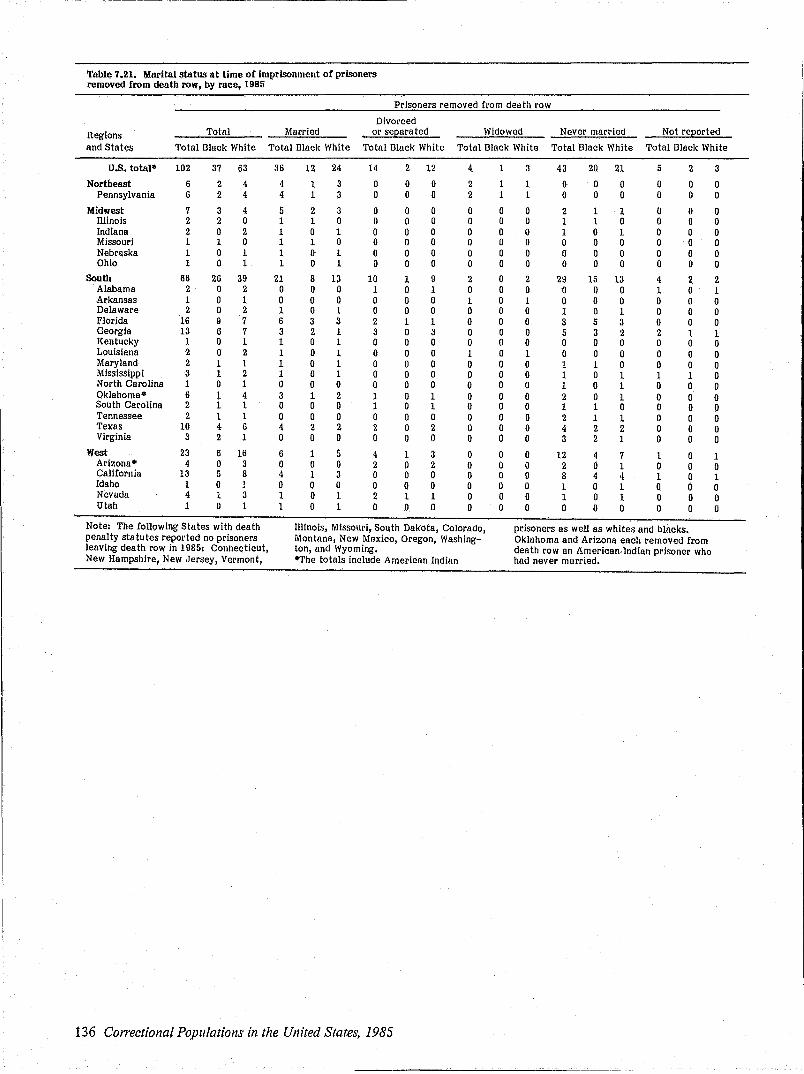
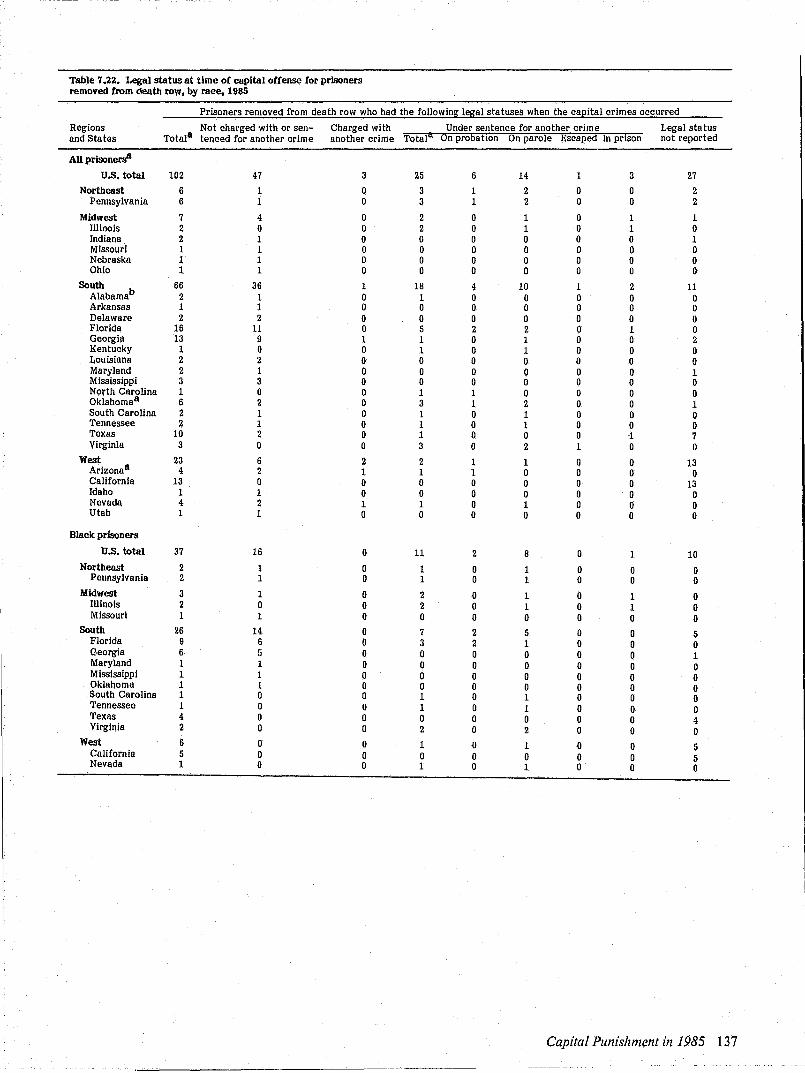

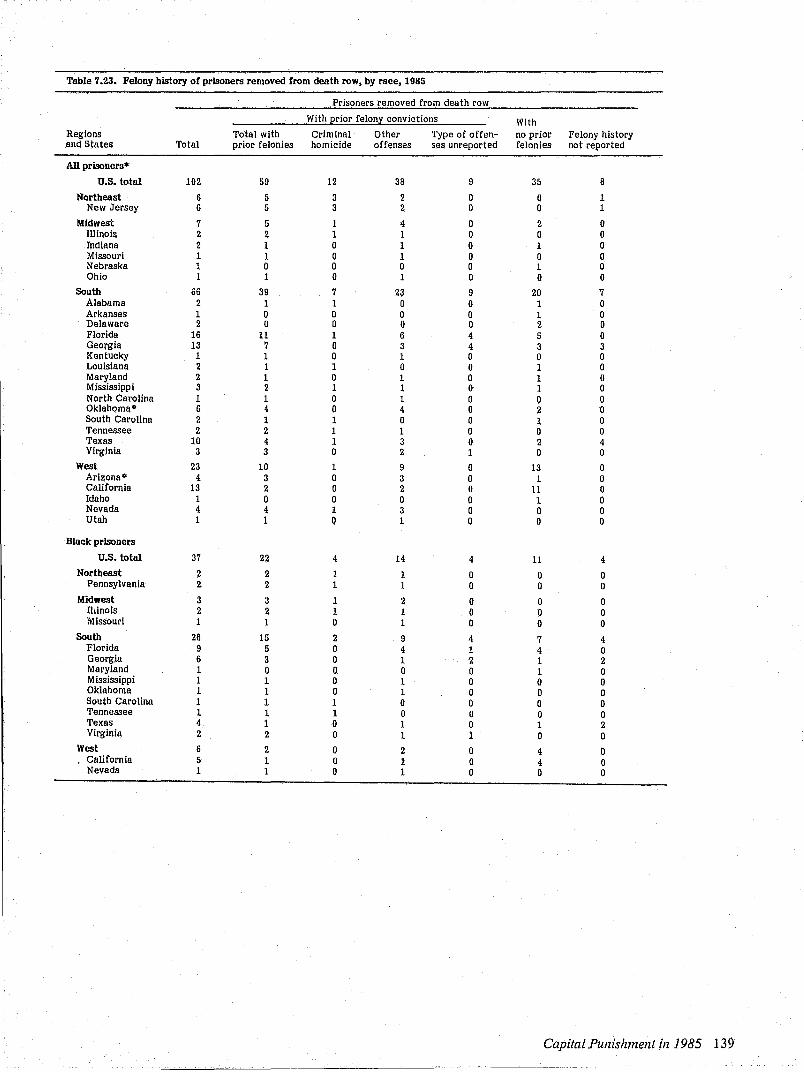
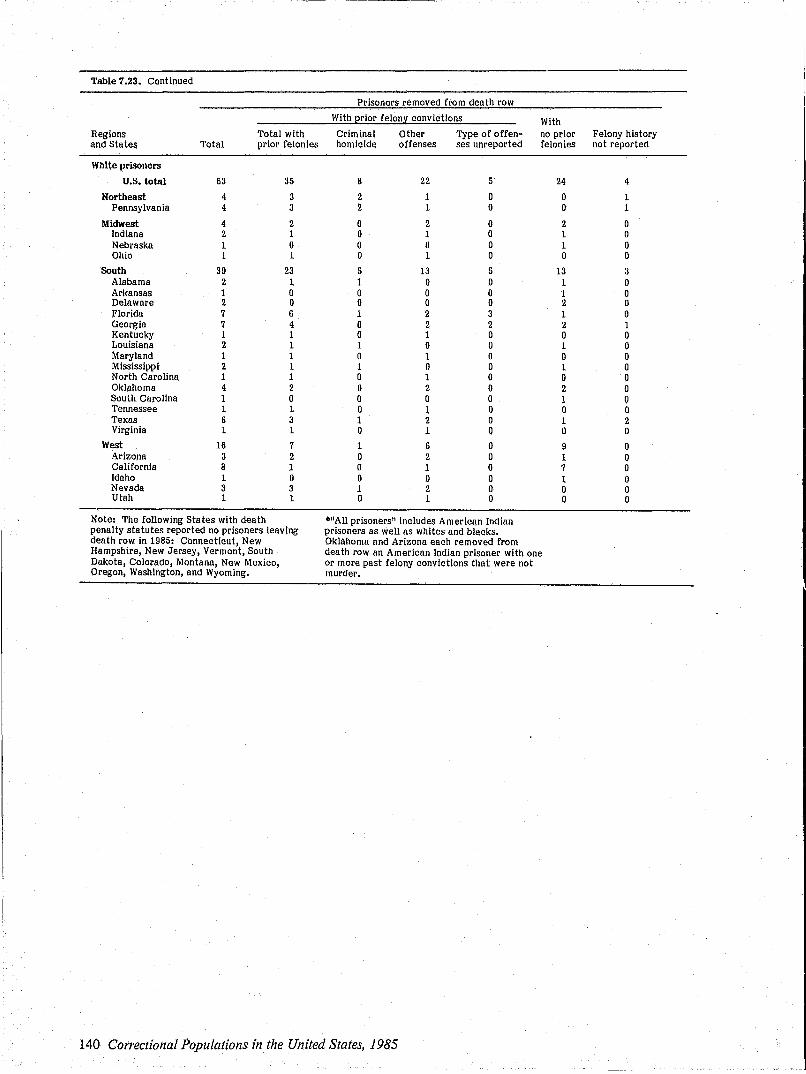
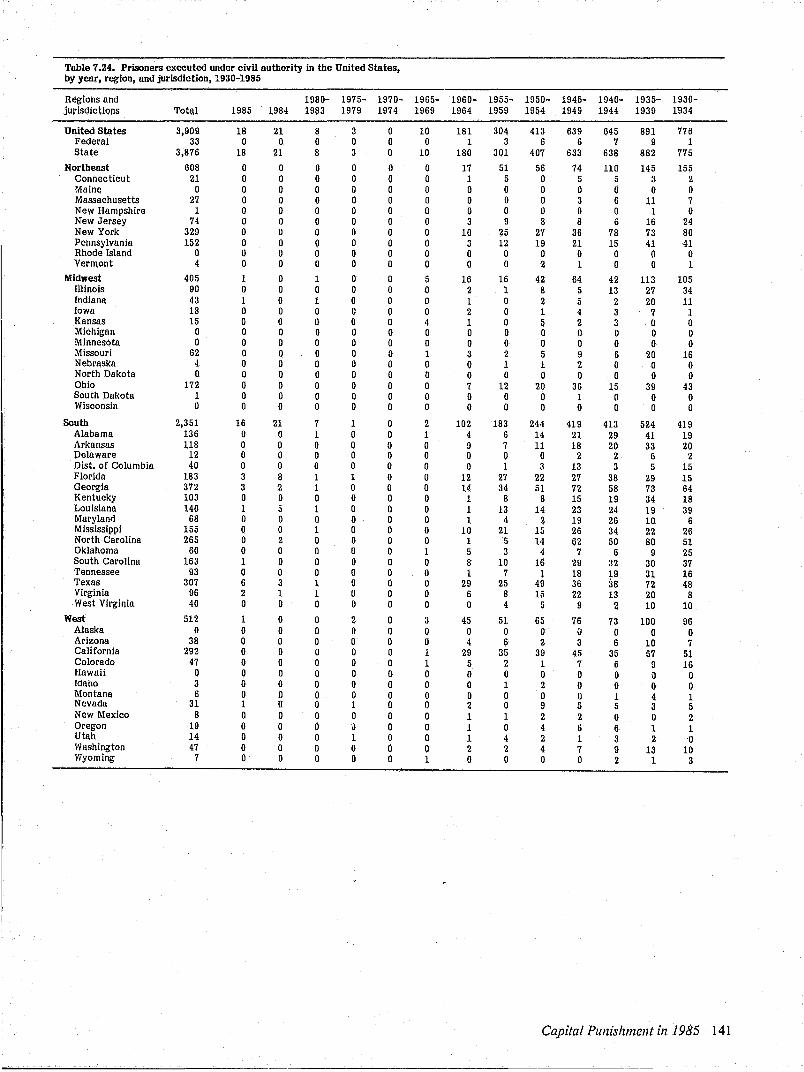
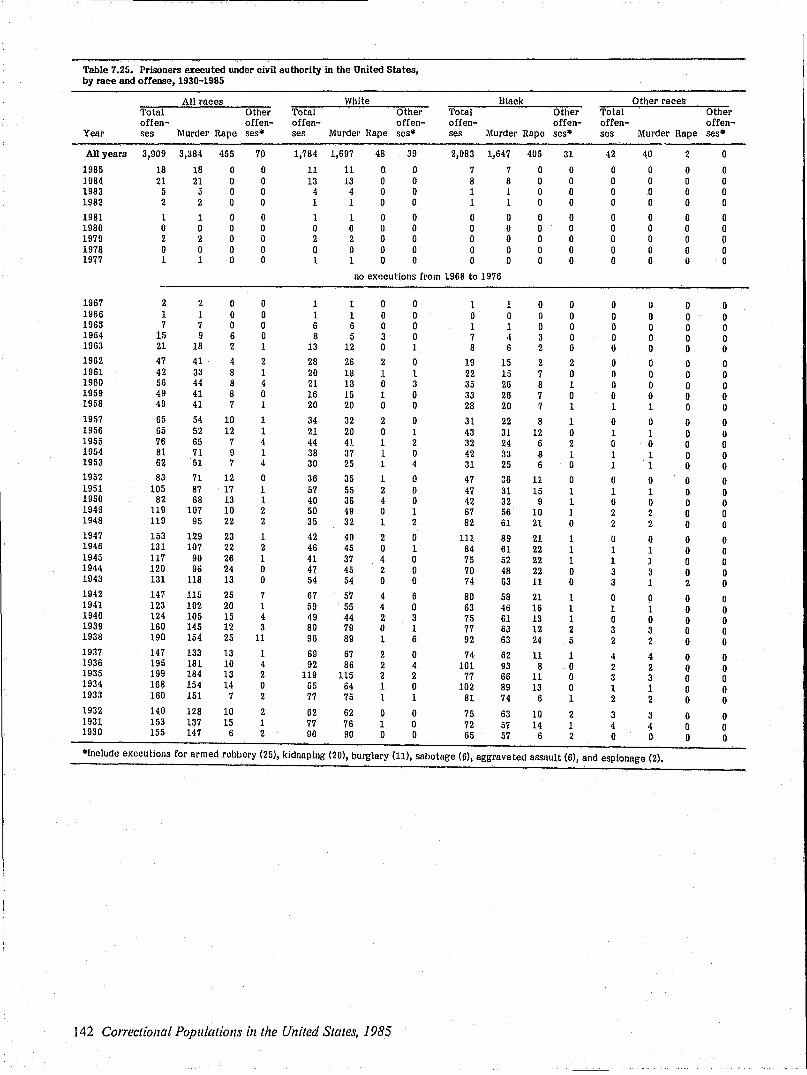
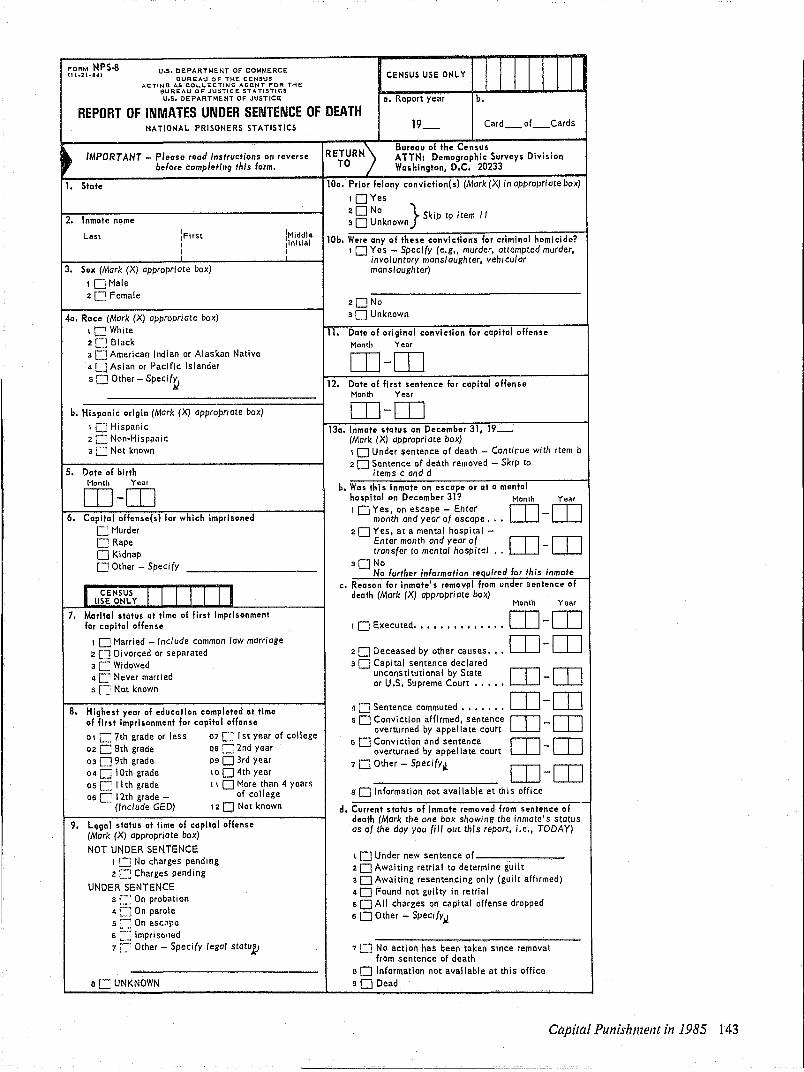
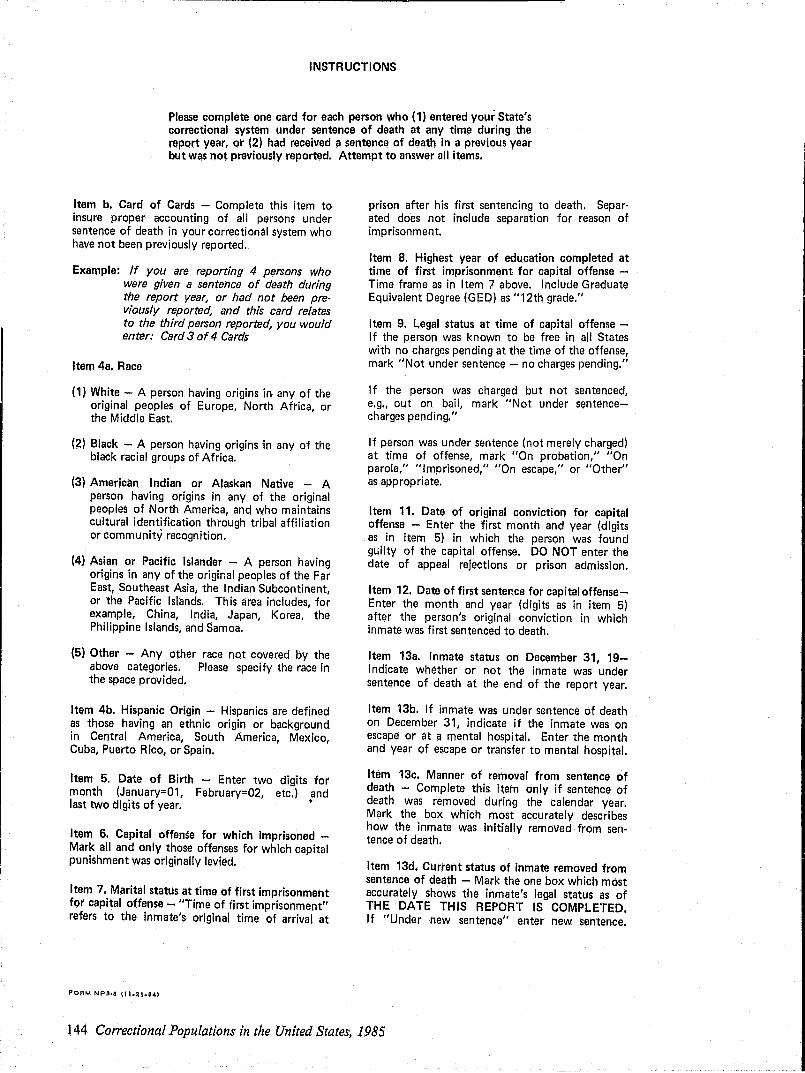
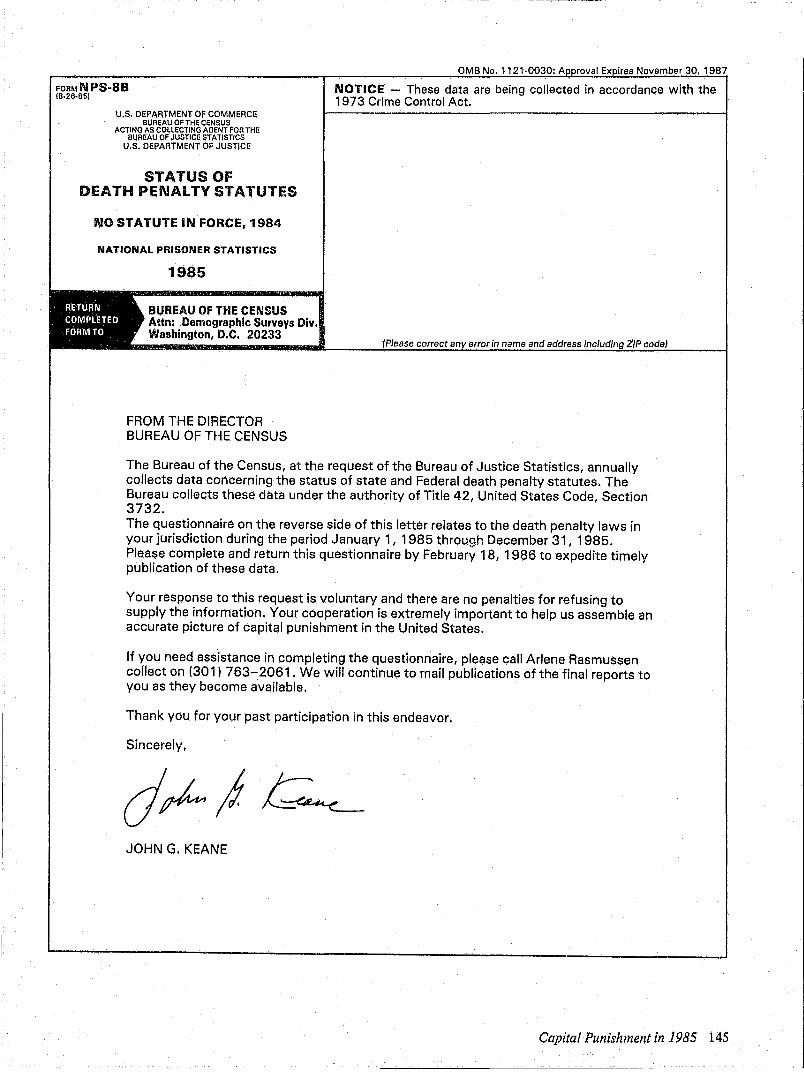
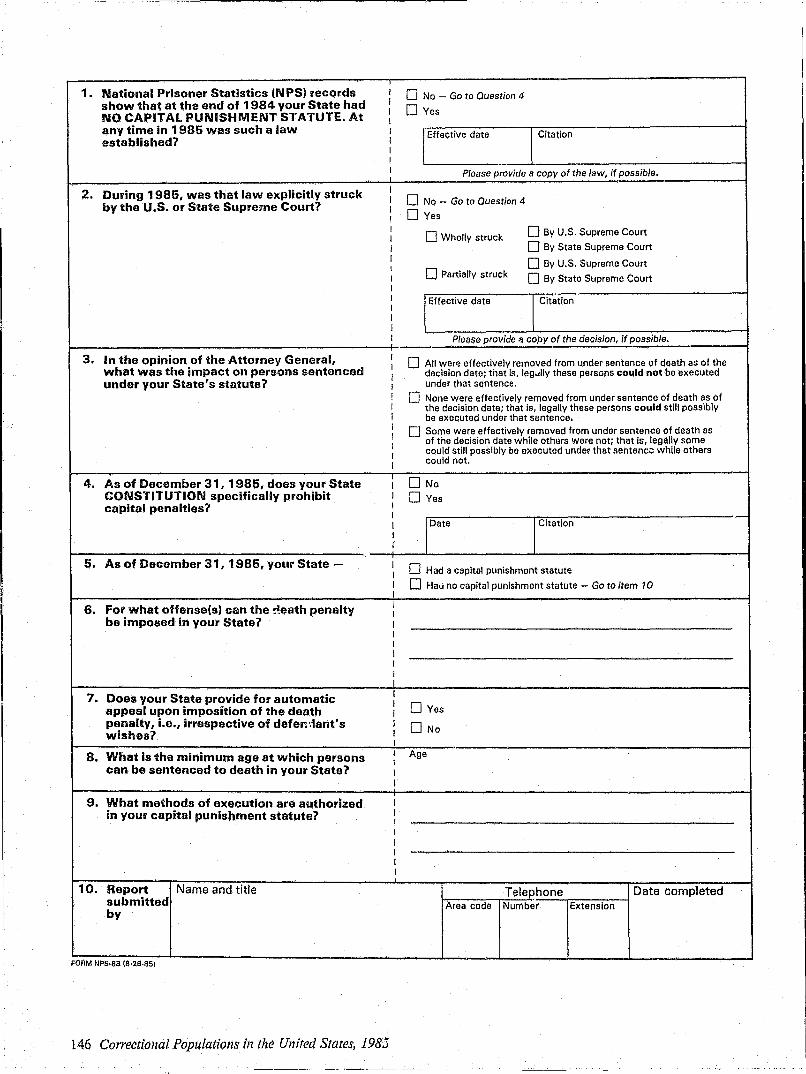
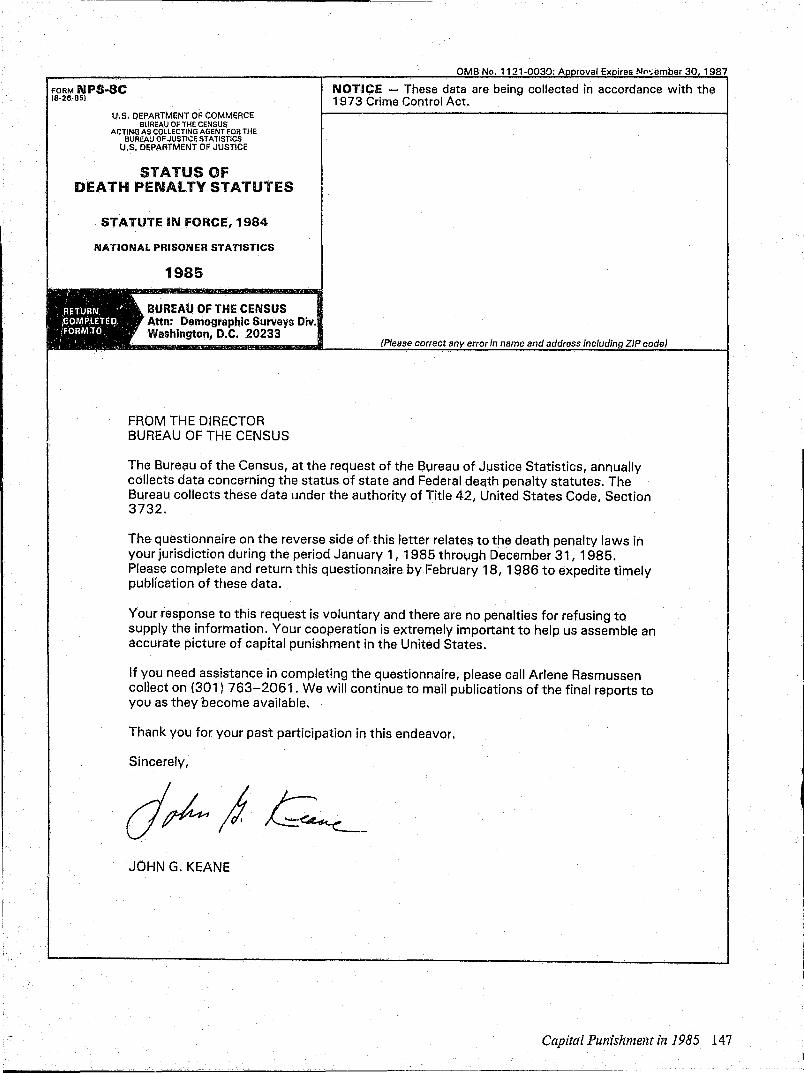

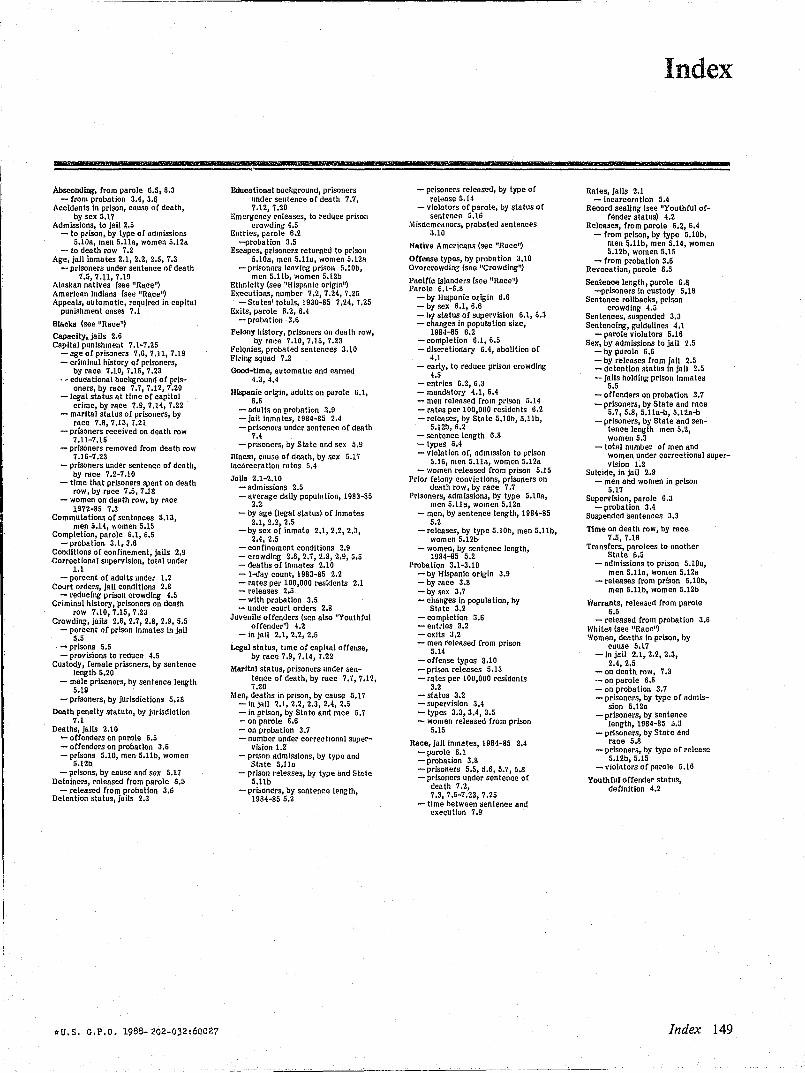
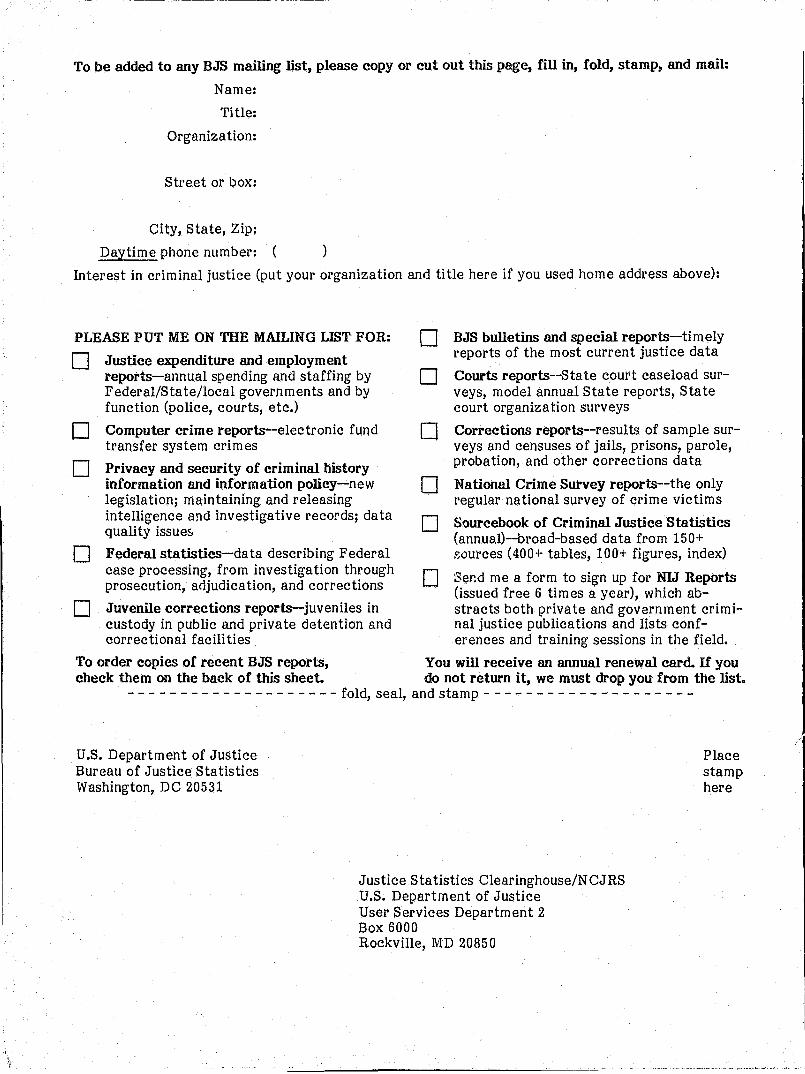


![55th NCAA Wrestling Tournament 1985 3/14/1985 to … 1985.pdf55th NCAA Wrestling Tournament 1985 3/14/1985 to 3/16/1985 at Oklahoma City ... John Fisher [8] - Michigan Mark Ruettiger](https://static.documents.pub/doc/80x56/5b4bbed37f8b9a5c278cfb08/55th-ncaa-wrestling-tournament-1985-3141985-to-1985pdf55th-ncaa-wrestling-tournament.jpg)