136
Í T
| Date post: | 01-Mar-2016 |
| Category: |
Documents |
| Upload: | valmorebocanegralond |
| View: | 228 times |
| Download: | 7 times |
7/18/2019 Correl Soils Properties Carter&Bentley
http://slidepdf.com/reader/full/correl-soils-properties-carterbentley 1/136
Í IT S

7/18/2019 Correl Soils Properties Carter&Bentley
http://slidepdf.com/reader/full/correl-soils-properties-carterbentley 2/136
c
LAT
SO L
Michaef Cárter
n
Stephen P Bentley
PENTECH
PRESS
Publishers London
7/18/2019 Correl Soils Properties Carter&Bentley
http://slidepdf.com/reader/full/correl-soils-properties-carterbentley 3/136
ref ce
E n g i n e e r s a n d g e o l o g i s t s a r e o f t e n e x p e c t e d t o
g i v e
p r e d i c t i o n s o f s o il
b e h a v i o u r
e v e n
w h e n
l i t t l e o r n o
r e l e v a n t
t e s t r e s u l t s a r e a v a i l a b l e .
T h i s
i s pa r t icu la r }
7 t r u e
o f s m a l l
p r o j e c t s
o r fo r
p r e l i m i n a r y d e s ig n s .
O u r a i m i n t h i s b o o k h a s b e e n t o g a t h e r t o g e t h e r m a t e r i a l t h a t vvou l d
b e o f
p r a c t i c a
a s s i s t a n c e t o t h o s e f a ced w i t h t h e p r o b l e m o f h a v i n g t o
e s t í m a t e
s o i l b e h a v i o u r
f r o m
l i t t l e o r n o l a b o r a t o r y t e s t d a t a .
T h e f i e l d o f s o i l p r o p e r t y c o r r e l a t i o n s is d i v e r s e a n d c o m p l e x a n d
o u r m a i n d i f f i c u l t y i n
p r o d u c i n g
th e
w o r k w a s
th e
v o l u m e
o f
m a t e r i a l
a v a i l a b l e . C o n s e q u e n t ly , w e h a v e h a d t o b e s e l ec t i v e i n o u r a p p r o a c h
a n d w e
h o p e
t h a t o u r f i n a l c h o í ce p r o v i d e s a w o r k a b le c o m p e n d i u m .
M o d e r n i n - s i t u t e s ti n g m e t h o d s
i s a
r a p i d l y d e v e l o p m g a s p ec t
o f
g e o t e c h n i c a l
e n g i n e e r in g
w h i c h
w a r r a n t s a
t e x t
to i t s e l f : t h i s a s p ec t i s
n o t d e a l t
w i t h h e r e b u t ,
w h e r e
a p p r o p r i a t e , s u i t a b l e r e f e r e n c e s
a r e
g i v e n .
T h e w o r k p r e s e n t s t y p i c a l v a l ú e s o f e n g i n e e r i n g p r o p e r t i e s fo r
v a r i o u s t y p e s
o r
c l asses
o f
s o i l , t o g e t h e r w i t h c o r r e l a t i o n s b e t w e e n
d i f f e r e n t
p r o p e r t ie s . P a r t i c u l a r e m p h a s i s i s g i v e n to c o r r e l a t i o n s w i t h
soi l c l a s s i f í c a t i on
t es t s and t o t he u se o f c l a s s i f i c a t i o n s y s t e m s .
I n c l u d e d i n t h e c o r r e l a t i o n s a r e p r o p e r t i e s t h a t a r e d i f f í cu l t t o
m e a s u r e d i r e c t l y ,
s u c h a s f ros t
s u s c e p t i b i l i t y
an d
s w e l l i n g p o t e n t i a l .
In
a d d i t i o n ,
s o m e
e x p l a n a t i o n s a re g i v e n o f t he e n g i n e e r i n g r e le v a n c e o f
th e v a r i o u s p r o p e r t i e s a n d t h e j u s t i f i c a t i o n o f t h e c o r r e l a t i o n s
be tw
;
een
p r o p e r t i e s i s d i s c u s s e d .
S u c h p r e d i c t i o n s c a n ,
o f
c o u r s e , n e v e r
b e a
s u b s t i t u t e
f o r
p r o p e r
t e s t i n g b u t w e h o p e
t h a t
th e
i n f o r m a t i o n
i n
t h i s b o o k
w i l l
e n a b l e
o p t i m u m u s e o f so i l c l ass i f íca t ion
d a t a .
S t e p h e n P B e n t l e y
C a r d i f f , W a l e s
M i c h a e l C á r t e r
C o l o m b o , S r i L a n k a
7/18/2019 Correl Soils Properties Carter&Bentley
http://slidepdf.com/reader/full/correl-soils-properties-carterbentley 4/136
Contents
CHAPTER 1 GRADING AND PLASTICITY 1
1.1 GRADING 1
1.1.1 The influence of grading on soil properties 1
1.1.2
Standard grading divisions and sieve sizes 3
1.2
PLASTICITY 3
1.2.1 Consistency Limits 6
1.2.2
Development
of the
l iquid
and
plástic
limit
tests
7
1.2.3
The shrinkage
l imit
test 8
1 2 4 Consistency limits as indicators of soil behaviour 10
1.2.5 Limitations on the use of consistency
limits
12
CHAPTER 2 SOIL CLASSIFICATION SYSTEMS 13
2.1 COMMON SOIL CLASSIFICATION SYSTEMS 14
2.2
CORRELATION
OF THE
UNIFIED
BS AND
AASHTO SYSTEMS 38
CHAPTER
3
DENSITY
39
3.1 NATURAL DENSITY 39
3.2 COMPACTED DENSITY 43
3.2.1 Compaction test standards 43
3 2 2 Typical compacted densities
45
3 2 3 Typical moisture d ensity curves 49
CHAPTER
4
PERMEABILITY
50
4.1 TYPICAL VALÚES 51
4.2 PERMEABILITY AND GRADING 51
7/18/2019 Correl Soils Properties Carter&Bentley
http://slidepdf.com/reader/full/correl-soils-properties-carterbentley 5/136
CHAPTER CONSOLIDATION AND SETTLEMENT
5 1
5 2
COMPRESSIBILITY
OF
CLAYS
5 1 1 The compressibility parameters
5 1 4
Typical
valúes
and
correlations
of com pressibility
coefiícients
5 1 5 Settlement corrections
RATE OF CONSOLIDATION OF CLAYS
5 3 SECONDARY COMPRESSION
5 4
SETTLEMENT
OF SANDS AND GRAVELS
5 4 1 Probes and standard penetration tests
5 4 2 Píate bearing tests
55
56
5 1 2 Setílement calculations using consolidation theory 58
5 1 3 Settlement calculations using elasticiíy theory 59
9
60
62
65
68
7
7
7
CHAPTER 6 SHEAR STRENGTH 76
6 1
THE CHOICE OF
TOTAL
OR
EFFECTIVE STRESS
ANALYSIS 78
6 1 1 The choice in practice 79
6 2 UNDRAINED SHEAR STRENGTH OF CLAYS 80
6 2 1
Rem oulded shear strength 81
6 2 2 Undisturbed shear strength
83
6 2 3 Predictions using the standard penetration test 89
6 3
DRAINED
AND EFFECTIVE SHEAR
STRENGTH
OF
CLAYS
89
6 4
SHEAR
STRENGTH
OF G RA N U LA R
SOILS
90
6 5 LATE RAL PRESSUR ES IN A
SOIL MASS
92
CHAPTER
CALIFORNIA BEA RING RATIO 97
7 1 THE TEST METHOD 97
7 2
CORRELATIONS WITH SOIL CLASSIFICATION
SYSTEMS
97
7 3 CBR AND
SHEAR
STRENGTH 104

7/18/2019 Correl Soils Properties Carter&Bentley
http://slidepdf.com/reader/full/correl-soils-properties-carterbentley 6/136
CHAPTER
S H RI N K A G E
AND
SW ELLING
CHARACTERISTICS
8 1 IDENTIFICATION
8 2 SWELLING P O T E N T I A L
8 2 1 Relat ion
to
o the r
proper t ies
8 3 S W ELLI N G P RES S U RE
5
5
107
107
113
CHAPTER
9
FROST SUSCEPTIBILITY
9 1 ICE S EG REG A TI O N
9 2 G R A I N S I Z E S
9 3
PLASTICITY
e f e r e n c e s
n d e x
7
9
8
7/18/2019 Correl Soils Properties Carter&Bentley
http://slidepdf.com/reader/full/correl-soils-properties-carterbentley 7/136
Chapter
GRADING
AND PLASTICITY
The concepta of grading and
p lasticity
and the use of
these properties
to iden tify classify and
assess
soils are the
oldest
and
most
fundamental in
soil mechanics. Their use
in fact pre-dates th e
concept
of
soil mechanics
itself: th e
basic ideas w ere borrow ed from
pedologists
and soil scientists by the fírst soil engin eers as a basis for
their new
science.
1 1
GRADING
It can be
readily appreciated
by
even
th e
most untrained
eye
t ha t
grave l is a
somewhat
diíferent
material from sand. Likewise
silt and
clay are different
again. Perhaps
not
quite
so
obvious
is
that
it is not
just
th e
particle size tha t
is
impor tant
bu t the distribution of
sizes th at
make up a
particu lar soil. Thus
the
grading
of a
soil determines ma ny
of its characteristics. Since it is such an o bviou s property and easy to
measure
it is
plainly
a
suitable fírst choice
as the
most fundam ental
pro perty to assess the characteristics of soil at least for coarse grained
soils.
Of
course
to
rely
on
grading alone
is to
overlook
th e
influences
of
such characteristics as particle shape mineral comp osition and
degree
of compaction.
Nevertheless grading
has been found to be a
major
factor
in determining the
properties
of
soils particularly
coarse-grained soils w here min eral compo sition
is
relatively
unim
portant.
1 1 1 The influence of grading on soil properties
During th e
early
development of
soil mechanics engineers relied
heavily on past experience and
found
it
convenient
to classify
soils
so
that experience gained
w i th a
particular type
of
soil could
be
used
to
assess the suitability of similar soils for any specific purpose and to
indícate appropriate methods of treatm ent. Thus the concept of soil
classification aróse early in the development of soil mech anics. Ev en
7/18/2019 Correl Soils Properties Carter&Bentley
http://slidepdf.com/reader/full/correl-soils-properties-carterbentley 8/136
2 CORRELATIONS O F SOIL PROPER TIES
today, despite
the
development
in
analytical techniques
which has
taken place, geotechnical engineers rely heavily on past experience,
and soil
classification
sys tems are an inva luab le aid , part icu larly
where soils are to be used in a remoulded form,
such
as in the
construct ion of e m b a n k m e n t s and filis. The use of grading in soil
classifíations
is
discussed
in
Chapter
2 .
Poorly-graded soils, typically
trióse with a
very small range
of
particle sizes, con tain
a higher
proport ion
of
voids than w ell-graded
soils,
in
wh ich
the fíner
particles
fíll the
voids between
the
coarser
grains. T hu s, grad ing iníluences the d ens ity of soils. This is indic ated
in a general w ay in Ch apter 3 Table 3.1). An oth er consequ ence of the
greater degree of packing achievable by well-graded soils is that the
proport ion
of
voids w i th in
the
soils
i s
reduced.
In
addit ion, al though
th e
proportion
of
voids
in fine-grained
soils
is
relative ly high,
the
size
of
individual voids is ex trem ely small. Since the proportion and size of
voids aíTecí íhe flow of water th rough a soil, grading can be seen ío
influence permea bil ity . The theoret ical relat ionship between grading
and
permeabil i ty
is
discussed
in
Chapter
4 and the
coefficient
of
permeabil i ty
is
related
to
grain size
in
Figure 4.1.
Since consolidation
involves the
squeezing-out
of
wa te r
from the
soil
voids, as the soil grains pack closer to geth er un de r load, it follow s
that
th e
rate
at
w hich consolidation takes place
is
controlled
by the
soil permeability. Since permeability
is, in
turn, partly controlled
by
grading
it can be
seen that grading
influences th e
rate
of
consolida-
tion.
Also,
since fíne-grained
soils
and
poorly-graded soils ha ve
a
higher proportion
of
voids,
and
tend
to be less
well-packed than
coarse-grained
and
well-graded
soils
they tend
to consolídate
more.
Thus the
consolidation properties
of a soil are
profoundly
iníluenced
by
its
grading. Since
fine-grained
soils tend
by and large to be
more
compressible
than
coarse-grained
soils
and consolídate at a much
slower rate
it is
these soils that
are of
most concern
to the
engineer.
Their gradings
are
much
too fine to be
measured
by
conventional
means and,
at
these sm all particle sizes,
th e
properties
of the
minerals
present are of more importance than th e grading. Specific correla-
tions between grading
and
consolidation chara cteristics
do
not,
therefore, exist. However,
th e
efíect
of
grading
on
consolidation
is
taken into account indirectly in some soil
classifications
which are
used
to
assess
th e
suitability
of
soils
for
earthworks
and
pavement
subgrades.
Shear strength is also
affected
by grading since grading influences
th e amoun t of interlock between particles bu t correlations between
grading and shear strength are not possible because other factors,
such as the angularity of the
particles
th e confíning pressure, th e

7/18/2019 Correl Soils Properties Carter&Bentley
http://slidepdf.com/reader/full/correl-soils-properties-carterbentley 9/136
G R A D I N G A N D PLA STIC I TY 3
compaction
and
consolidat ion history ,
and the
types
of the clay
minerals
are of
overriding importance.
The
variability
of
some
of
tríese
factors
is
reduced where
only
compacted
soils are
considered
and, with the aid of
soil
classifícation system s, the
iníluence
of grading
on shear stren gth can be given in a general way, as indicated in Table
6.2. Similarly,
the
influence
of the
g rad ing
o f
coarse-grained soils
on
their California bearing ratio
is
ind icated
in
Table
7 .2
an d ,
to
some
extent , in
Figure
7.3.
In a broad
sense, both swelling properties
and
frost susceptibility
are influenced by grading. Correlation between grain size and
frost
susceptibility
can be
seen
in
Chapter
9 but the
identifícation
of
expansive
clays, discussed
in
Chapte r
8,
relies alm ost
entirely on the
plast ici ty
properties, the only re levan t aspect of grading being the
propor t ion
of
material
finer
than 2/rni.
1 1 2
tandard grading
divisions and
sieve sizes
Although
grading, as the mo st basic of soil propertie s, is used to bo th
identify and classify
soils,
th e
división
of
soils into categories, based
on grading,
varíes
according to the agency or classifíca tion system
used.
A comparison of
some common
defínitions
used
is
given
in
Figure
1.1.
For
soil particles larger than
60¿on,
grading
is
carried
out
using
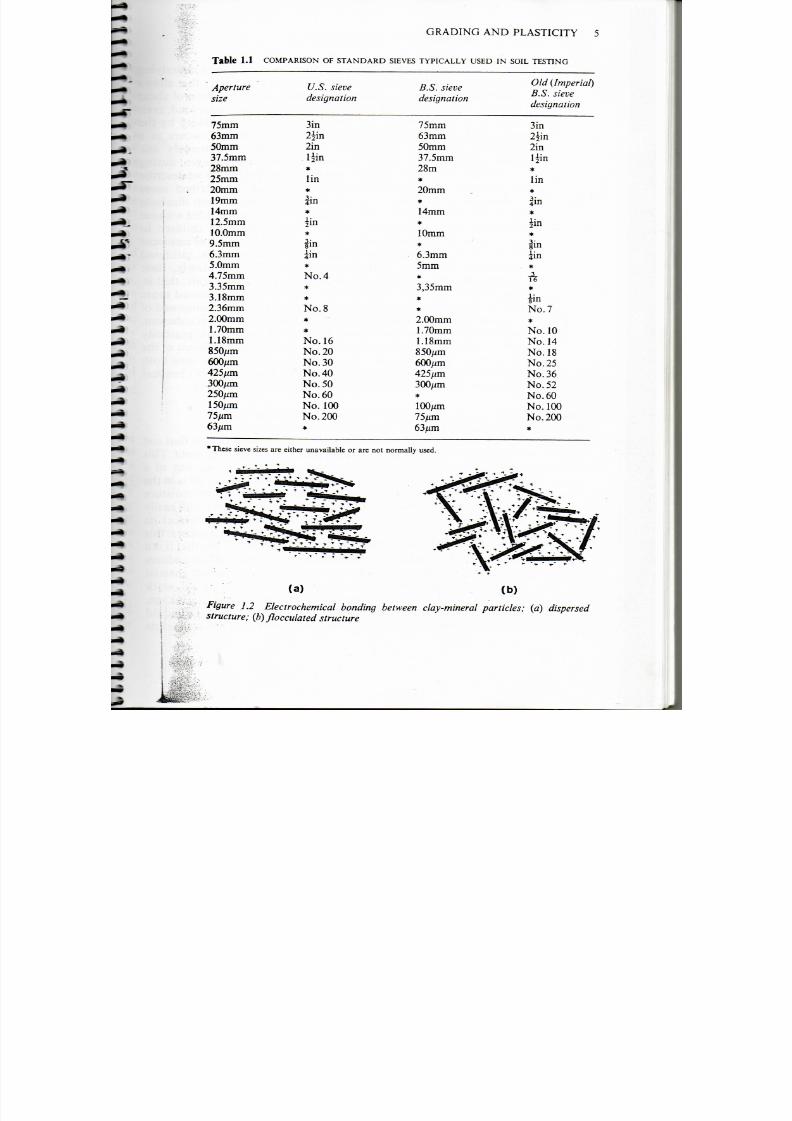
standa rd square mesh sieves. Table
1.1
shows s tandard
sieve
sizes
and
gives a
comparison between British
and
American standards.
1 2
PLASTICITY
Just
as the
concepts
of particle size and grading can be readily
appreciated for coarse-grained soils, so it is obvious that clays
are
somehow fundamenta l ly different
from
coars e-grained soils, since
clays exhibit the property of plasticity whereas sands and gravéis do
not.
Plasticity is the
ability
of a
material
to be
mou lded irreversibly
deformed)
w i thou t
fracturing.
In
soils,
it is du e to the
electrochemical
behaviour
o f the
clay minerals
and is
un ique
to
soils containing
clay-
mineral particles.
These are plate-like
structures which typically
possess a negative electrical charge on their
face
surface, brought
about by inherent flaws within the chemical lattice. In nature, this
negative
charge
is
cancelled
out by cations Na + ,
Ca+
+
etc.) present
in
the pore
water.
The
positive
to
negative attraction, between
the

7/18/2019 Correl Soils Properties Carter&Bentley
http://slidepdf.com/reader/full/correl-soils-properties-carterbentley 10/136
CORRELATIONS OF
SOIL
PROPERTIES
British Standard and MIT
clay
silt
m
c
sand
m
c
grave
m
c
cobb-
les
boulders
O OO2
O O O 6
O O2 O O6 0 2 0 6
6 2O 6O 20O
Unif ied Soil Classif¡catión System
fines silt, clay )
sand
m ] c
gravei
f
c
cobb-
les
bouiders
0.075 0.425 2 4.75
19
75
300
AST1KD422,
D653)
fines
silt,
clay
)
sand
f | m|
gravei
«Ato-
les
bouiders
O 075
0 425 2
4 75
75 300
AASHTO T88)
colloids
clay
silt
sand
f
c
gravei
bouiders
O CO 1 O O O 5
O 075 0 425
Grain size
)
LL
1 I 1 lu. S i l . |t lI I 1 lu. I it i InnI
75
_ÍL1.1_1_5
luí
i l i i
i
0.001
O.01
0.1
10
100 10OO
Figure
1.1 Some
common
dejlnitions ofsoils, classijled by
par ticle size
modified after
Al-Hussaini ,
1977)
catión and the clay mineral, pro vides a netw ork of bonds throu gho ut
the clay mass, as illustrated in Figure 1 2 Also,
because
water
molecules themselves are polarised, water molecules immediately
adjacent to the clay minerals become attracted and
bonded
(adsor-
bed) to the surface to form an adsorption com plex . Since these
electrochemical bonds act
through
the water surrounding the clay
particles,
th e
at traction
is
maintained even w hen
large deformations
take place between clay particles,
to
produce
the phe
orne ion
of
plasticity.
Plástic
soils - clays - are often described as cohesive to distmguish
them from
non -plastic
soils
-
sands and gravéis
-
which
are
described
as
granular
or
non-cohesive . Thus,
th e terms plástic and cohe-
sive are often
used synonymously. Since
all
plástic soils
a re
cohesive
and all coh esive soils are plástic this
seems
quite reasonable,
yet,
not
7/18/2019 Correl Soils Properties Carter&Bentley
http://slidepdf.com/reader/full/correl-soils-properties-carterbentley 11/136
G R A D I N G A N D PL A ST ICIT Y
Table 1 1 C O M P R I S O N
O F
S T N D R D
S I E V E S
T Y P I C L L Y U S E D
I N
S O I L T E S T I N G
Aperíure
size
75mm
63mm
50mm
37.5mm
28ram
25mm
20mm
19mm
14mm
12.5mm
lO.Omm
9.5mm
6.3mm
S.Omm
4.75mm
3.35mm
3.18mm
2.36mm
2.00mm
1.70mm
l.ISmm
850/mi
600^m
425/^m
300/zm
250/im
150¿un
75/im
63/ím
These sieve sizes are
_2 M0 «
Í/.S.
sieve
designation
3in
2^in
2in
l|in
l in
lin
U n
f in
¿in
No. 4
No. 8
No 16
No. 20
No. 30
No. 40
No. 50
No. 60
No. 100
No. 200
either unavailable or
•ww? *
B.S. sieve
designation
75mm
63mm
50mm
37.5mm
28m
20mm
14mm
lOmm
6.3mm
5mm
3,35mm
2.00mm
1.70mm
1.18mm
850/im
600/zm
425/im
300/im
100/zm
75/zm
63/ím
are not normally
used.
Oíd
Imperial)
B S sieve
designation
3in
2iin
2in
l^in
l in
|in
lin
f in
¿in
16
sin
No. 7
No. 10
No. 14
No. 18
No. 25
No. 36
No. 52
No. 60
No. 100
No. 200
„
v L
1
a b
Figure
1.2 Electrochemical bonding
between clay-mineral
par
fieles;
a) dispersed
structure
b) flocculated síructure

7/18/2019 Correl Soils Properties Carter&Bentley
http://slidepdf.com/reader/full/correl-soils-properties-carterbentley 12/136
6 C O R R E L A T I O N S
OF
SOIL P R O P E R T I E S
only are the tw o prope rties
subtly
diíferent in nature , their underlying
cause is quite different. Whereas plasticity is the property that allows
deformation w i thou t cracking, cohesión is the possession of shear
strength which allows
the soil to
maintain
it s
shape under load even
when it is not confíned. And wh ereas plast ici ty is produced by the
electrochemical nature of the
clay
particles, cohesión occurs as a
result
of
their very
small
size, which results
in
extremely
low
permeabilit ies
and
al lows pore water pressure changes during
defo rma tion tha t gives clays the shear stre ngth prope rties w e describe
as cohesive. The precise mechanism involved is described more
thoroughly in
Chap ter
6, but three
simple examples help il lustrate
these d iíferences. Firstly, althou gh sands
cannot be
moulded wi thou t
cracking, they
can
possess
a
weak cohesión, al lowing children
to
m a k e sandpies and sandcastles. This is actua lly the result of m enisc us
forces
in
partially-saturated sands,
and disappears in saturated
condit ions, Secondly, if clays
are
loaded sufficiently síowly, íheir
strength characteristics are similar to those of granular soils; tha t is ,
they
behave
like frictional
materials . Again, this
is
discussed more
fully in
Chapter
6.
Thirdly,
non -plast ic silts,
which
are
composed
of
very
small
particles of un altered
rock,
do possess a
transient cohesión,
even thou gh they are non -plastic. Thus, it can be seen tha t plasticity
and cohesión go
together
not because the y are different facets of the
same property
but
because clay particles
are at the
same time both
extremely small and co mposed of minerals, the
producís
of chem ical
alteration
that
possess
particu lar electrochemical feature s.
1 2 1 onsistency l imit s
The notio n of soil consistency limits stems from the concept tha t soil
can exist in an y of
four
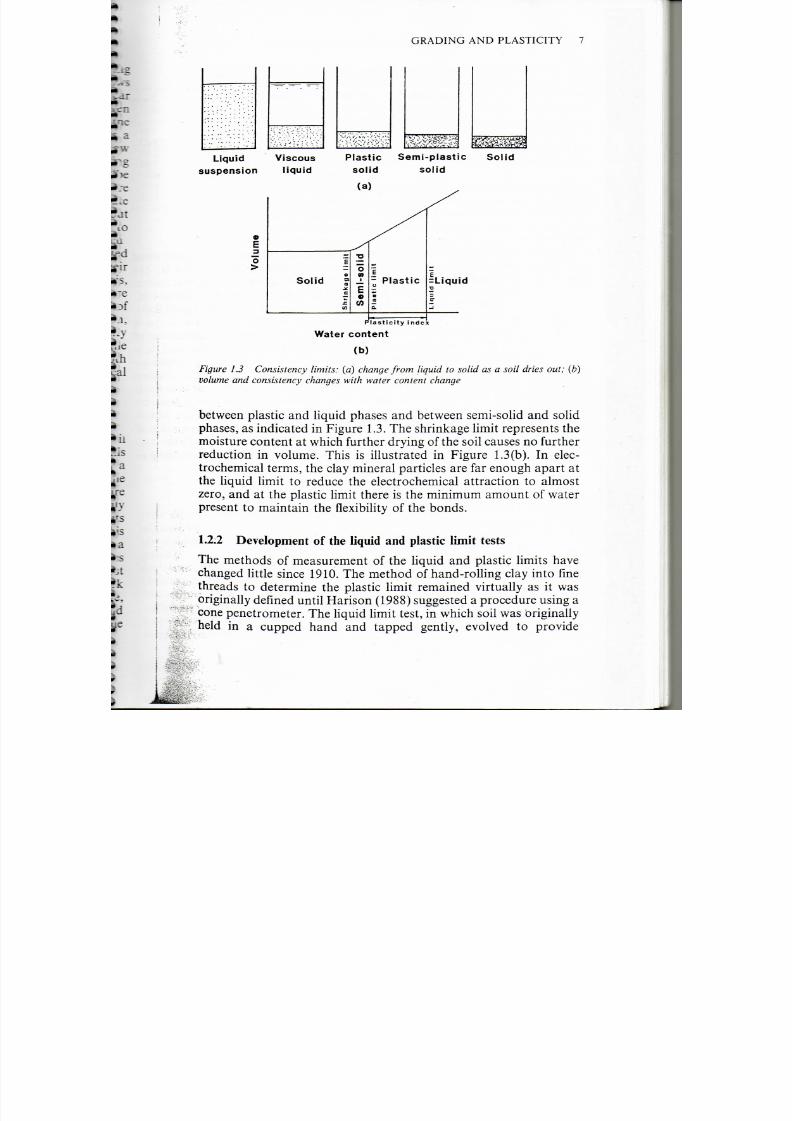
states, dep end ing on its mois ture conten t. This
is illustrated
in Figure
1.3,
where
soil
is
shown settling
out of a
suspensión in water, and
slowly
dr yin g ou t. Initially, the soil is in the
form of a viscous liquid,
with
no shear strength. As its mois tu re
content is reduced , it begins to attain som e strength but is still easily
moulded: this is the plastic-solid phase. Further drying reduces its
ability to be m oulded so that it tends to crack as
m ould ing
occurs: this
is the sem i-solid
phase. Eventual ly,
th e
soil becom es
so dry
tha t
it is a
brittle
solid. Early
ideas
on the
co nsistency concept
and
procedures
fo r
its measurement were
developed
by
Atterberg,
a
Swedish chemist
and
agricultural researcher
in
about 1910.
In his
original work
Atterberg 1911)
identifíed fíve
limits
bu t
only three
shrinkage,
plástic
and
liquid limits) have been used
in
soil m echanics.
The
liquid
and plástic limits represent the moisture contents at the borderline
7/18/2019 Correl Soils Properties Carter&Bentley
http://slidepdf.com/reader/full/correl-soils-properties-carterbentley 13/136
G R A D I N G A N D P LA S TI CI TY 7
' ''. ' .'
• -
• • . : •
; •
llfi?
Liquid Viscous
suspensión liquid
' / ' ' / ^
(' T V/-t
Plástic
solid
S
£M^¡
emi-plastic
solid
%%®® &,
Solid
a
u
m
Solid
< n
•
O
w
E
1
- Plástic
a
•• •
=Liquid
•o
W at e r ontent
b )
Figure 1.3 Consistency
limits:
o)
change
from liquid to solid as a soil dries out b)
volume and
consistency
changes wiíh
water content change
between plástic and l iquid phases and between semi-sol id and solid
phases,
as
indicated
in
Figure 1 3
The
shrinkage l imit represents
th e
moisture content at which
fur ther
dry ing of the soi l causes no
fu r the r
reduction
in
volume. This
is
illustrated
ín
Figure
1.3 b) . In
elec-
t rochemical
terms, the clay mineral part ic les are far enoug h apa rt a t
the l iquid l imit
to
reduce
the
elect rochemical a t t ract ion
to
a lmost
zero, and at the plást ic l imit there is the minimum amount of water
present to maintain the flexibility of the bonds.
1.2.2 Development of the liquid and plástic l imit
tests
The methods of measurement of the l iquid and plást ic l imits have
changed Hule since 1910 The me t hod of hand-rolling clay into fine
threads to determine the plást ic l imit remained virtual ly as i t was
originally
defined
unti l H arison 1988) suggested
a
procedure using
a
cone penet rom eter .
The
liq uid limit test,
in
wh ich soil
w as
originally
held
in a
cupped
hand and
tapped gently, evolved
to
provide
7/18/2019 Correl Soils Properties Carter&Bentley
http://slidepdf.com/reader/full/correl-soils-properties-carterbentley 14/136
8 CORRELATIONS OF SOIL PROPERTIES
Table 1 2
C O R R E C T I O N F A C T O R S F O R T H E
O N E - P O I N T
L IQUID
L J M I T
T E S T
No of
blows
15
16
17
18
19
20
21
Factor
F
0 9 5
0.96
0.96
0.97
0 9 7
0.98
0.98
No of
blows
22
23
24
25
26
27
28
Factor
F
0.99
0.99
0.99
1 0 0
1.00
1.01
1.01
No of
blows
29
30
31
32
33
34
35
Factor
F
1 0 1
1.02
1.02
1.02
1 0 2
1.03
1.03
Liquid limit = moisture contení of test specimen x factor F .
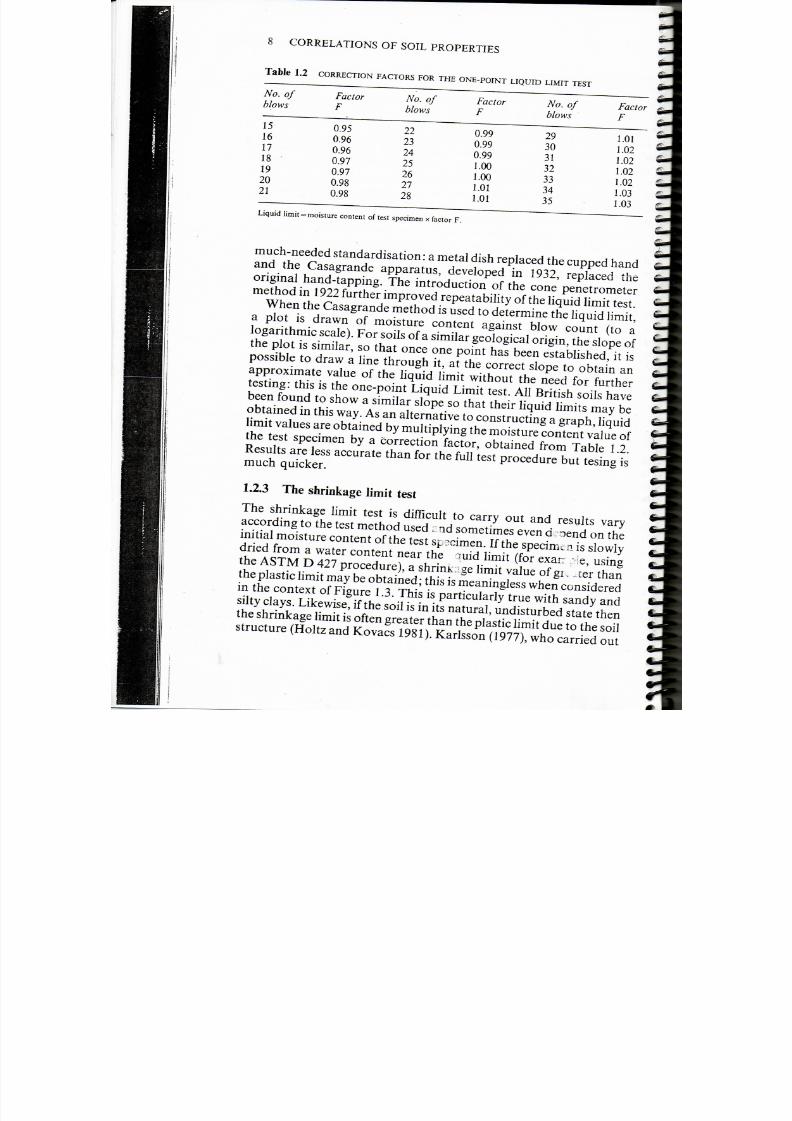
much-needed standardisation:
a
metal
dish replaced the cupped hand
and the Casagrande apparatus, developed in 1932, replaced the
original hand-tapping.
The
introduction
of the
cone penetrometer
method
in 1922 fur ther improved
repeatability
of the
liquid limit test.
When th e Casagrande method is used to determine th e liquid l imi t ,
a
plot
is drawn of moisture coníent against blow count (to a
logarithmic scale). For
soils
of a similar geológica origin, the slope of
the plot is
similar,
so
that once
one
point
has
been established,
it is
possible
to
draw
a line
through
it, at the
correct slope
to
obtain
an
approximate valué
of the
liquid limit
w i t h o u t the
need
fo r furíher
testing:
this
is the
one-point Liquid Limit test.
All
British
soils have
been
found
to show a similar slope so that their liquid limits
m a y
be
obtained
in this way. As an alternative to constructing a
graph,
liquid
limit valúes are obtained by multiplying the moisture
contení
valué of
the
test specimen
by
a
correction
factor, obtained from Table
1.2.
Results a re less accurate than for the
full
test procedure but tesing i s
much quicker.
1 2 3 The shrinkage limit test
The
shrinkage limit test
is difíicult to
carry
out and
results vary
according
to the
test method used
¿ nd
sometímes even deoend
on the
initial moisture
contení of the
test specimen.
If íhe
specimen
is
síowly
dried
from a
water
contení
near
the auid
limit (for
exarr de,
using
the ASTM D 427 procedure), a shrinkage limit valué of giv ,ter than
th e plástic limit m ay be obtained; this is meaningless when considered
in the contexí of Figure 1.3. This is paríicularly írue wiíh sandy and
silíy
clays. Likewise,
if íhe
soil
is in iís
naíural, undisíurbed
síaíe
íhen
the
shrinkage
l imií is often
greater
íhan the
plástic limit
due to the
soil
structure
(Holíz and
Kovacs
1981).
Karlsson (1977),
who
carried
out

7/18/2019 Correl Soils Properties Carter&Bentley
http://slidepdf.com/reader/full/correl-soils-properties-carterbentley 15/136
GRA DING AND PLASTICITY 9
shrinkage
limit
tests
on a
n u m b e r
of
Swedish clays,
found
t ha t
shrinkage
l im it was related to sensit ivity
discussed
in
C hap te r
6). For
clays of médium sensitivity the shrinkage limit of undisturbed
samples was about equal to the plástic l imit , whereas undisturbed
highly sensitive clays showed shrinkage limits greater
than
the
plástic
limits. Un disturbed organic clays showed sh rinka ge l imits
well
below
th e
plástic limits.
For
all
th e soils
tested,
th e
shrinkage l imits
o f the
disturbed sam ples were lower tha n thos e of the undis turbe d samples,
and below the plástic limit.
In his lectures at Harvard University, Casagrande suggested that
the ini t ia l moisture con ten í for sh rinkag e l im it tests should be slightly
above the plástic lim it, but it is
difficult
to prepare specimens to such
low moisture contents without entrapping air bubbles. It has been
found tha t for soils prepared in this way and tha t plot near the
A-line
of
a
plasticity
chart
see Figure 2.1 ,
the
shrinkage l imit
is
about
20.
If
the soil plots a n
a m o u n t
A p
vert ically abov e
o r
below
the
A-line, then
the
shrinkage limit
will be less
than
or
greater than
20 by A p.
That
is
fo r
plots
Ap
above
the
A-line
=
20-Ap
Soil B SL = 7
Soil A SL = 4
Figure
1.4 Casagrande s procedure fo r estimating th e
shrinkage limit
7/18/2019 Correl Soils Properties Carter&Bentley
http://slidepdf.com/reader/full/correl-soils-properties-carterbentley 16/136
10
CORRELATIONS
OF SOIL
PROPERTIES
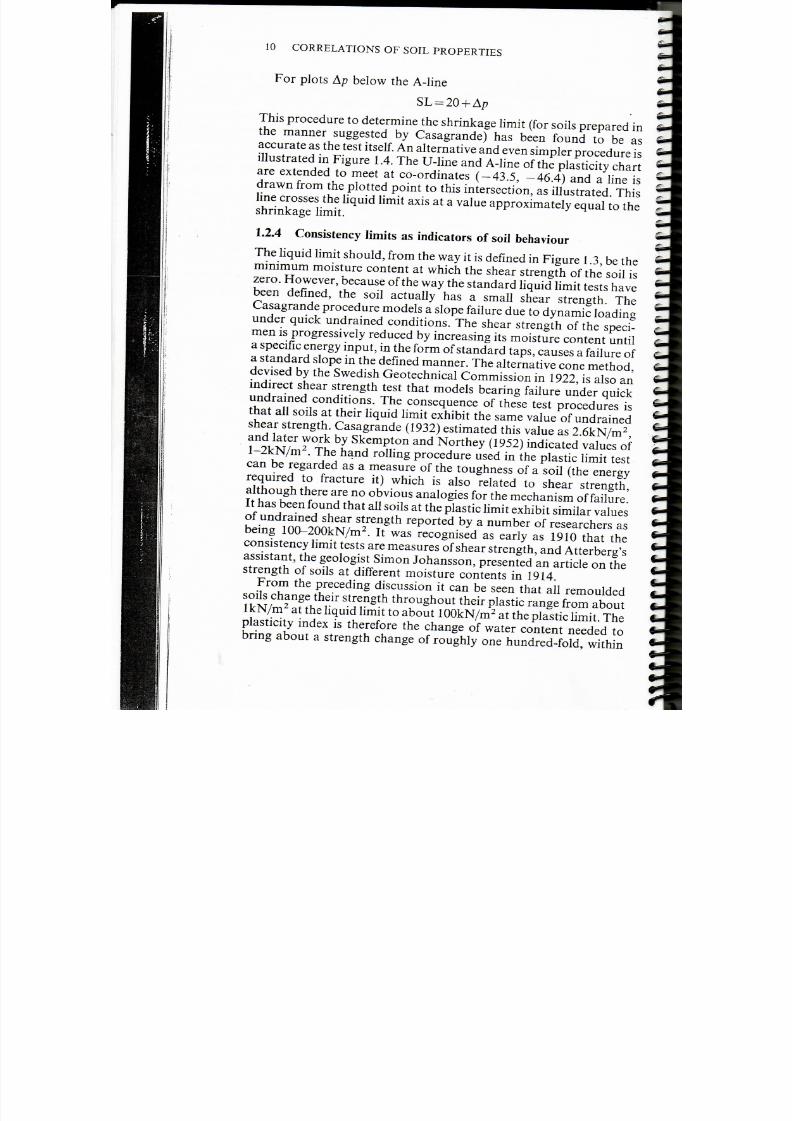
For ploís
p
below íhe A-line
This procedure
ío
deíermine
íhe
shrinkage
limií
(for
soils
prepared
in
the
manner suggested
by
Casagrande)
has
been
found
ío be as
accuraíe
as íhe íesí itself. An alternaíive and even simpler procedure is
illusíraíed
in Figure
1
.4. The U-line and A-line of íhe plasíiciíy
charl
are
exíended
ío meel ai
co-ordinaíes
43.5,
—46.4) and a line is
drawn
from íhe
ploííed poiní
ío
íhis
inlerseclion, as
illusíraíed. This
line crosses
íhe
liquid limií axis
ai a
valué approximaíely
equal ío íhe
shrinkage
limit.
1.2.4 Consistency limits as indicators of soil behaviour
The
liquid limit should, from
the way it is defined in
Figure
1
.3 ,
be íhe
minimum
moisture contení
ai
which
íhe
shear sírengíh
of the
soil
is
zero.
However, because
of the w ay the
standard liquid limit tesis have
been defíned, the soil actually has a
small
shear sírength. The
Casagrande procedure models a slope
failure
due ío dynamic loading
under quick undrained condiíions. The shear strengíh of the speci-
men is progressively reduced b y increasing iís moisíure
conlení
until
a
speciííc
energy inpuí, in íhe form of síandard íaps, causes a failure of
a standard
slope
in íhe
defíned manner.
The
alíernative cone method
devised
by íhe
Swedish Geotechnical Commission
in
1922,
is
also
an
indirecí shear sírengíh test thaí models
bearing
failure
under quick
undrained condiíions.
The
consequence
of
these
tesl
procedures
is
that
all
soils
at
their liquid limil exhibit
íhe
same valué
of
undrained
shear sírengíh. Casagrande
(1932)
eslimaled this
valué
as 2.6kN/m2
and laler work by Skemplon and Norlhey (1952) indicated valúes of
l-2kN/m2.
The hand
rolling
procedure used in íhe plasíic limil
lest
can be regarded as a measure of the toughness of a soil (íhe energy
required ío fracíure
il )
which is also relaled lo
shear
sírengíh,
although
there
are n o
obvious analogies
for íhe
mechanism
of failure.
Il has
been
found Ihat all
soils
at the
plástic limit exhibit similar valúes
of
undrained shear strengíh reported
by a
number
of
researchers
as
being
100-200kN/m2. Il was
recognised
as early as
1910
Ihal íhe
consislency limil
lesls
are measures of shear strengíh, and Atlerberg s
assislanl íhe geologisl Simón Johansson, presenled
an
árdele
on
íhe
sírengíh
of soils al
different
moisíure conlenls in 1914.
From íhe preceding discussion
il can be
seen Ihaí
all
remoulded
soils change íheir sírengíh
Ihroughoul
Iheir plasíic range from aboul
IkN/m2
al íhe liquid limil lo abouí 100kN/m2
al
the plástic limit. The
plasticiíy
índex is Iherefore íhe
change
of
waíer conlení needed
lo
bring
aboul
a
sírengíh change
of
roughly
one hun dred-fold,
within

7/18/2019 Correl Soils Properties Carter&Bentley
http://slidepdf.com/reader/full/correl-soils-properties-carterbentley 17/136
G R A D IN G AND PLASTICITY 11
the plástic range of the soil. A remoulded soil with a mo isture content
within the plástic range can be expected to have a shear strength
somewhere between these extremes and it seems
reasonable
to
assume that , for a giv en soil, it s actu al shear strength will be related to
its moisture con tent.
Also,
assuming th at the general pa ttern of shear
strength change with moisture content, across the plástic range, is
similar for all
soils,
then i t
should
be possible to predict th e remoulded
shear strength of any clay
from
a knowledge of its m oisture content
and its
liquid
and
plástic limits. Correlations
of
remoulded shear
strength an d m oisture con tent, related to the liquid and plástic
l imit,
have been obtained and are discussed in Chapter 6. With
slight
corrections
and some loss of
accuracy , these co rrelations
may
also
be
used to predict th e shear strength of undis turbed
clays.
This is
especially useful in view of the
fací that most
clays, both in their
natural state and when used in earth w ork s, are in a plástic state.
A further consequence of these concepts is that a soil with a low
plasticity
Índex
requires only a small reduction in mo isture content to
bring about a substan tial increase in shear streng th. Con versely, a soil
with a high plasticity Índex will not stabilise under load until large
moisture content changes have taken place. This implies that highly
plástic soils will
be
less stable
and
that
a
correlation
may
exist
between p lasticity
and
com pressibility. Also,
the
liquid limit d epends
on the
amounts
and
types
of
clay m inerals
present
which
control the
permeability, henee the rate of consolidation, imp lying a c orrelation
between
liquid limit
and the
coefíicient
of
consolidation. Consolida-
tion properties are discussed in Chapter 5.
The
special
property of
plasticity
in clays is a function of the
electrochemical behaviour
of the clay mine rals: soils tha t possess no
clay m inerals do not exhib it plasticity and, as their moisture content
is reduced, they pass directly from the liquid to the
semi-solid
state.
The Atterberg limits can give indications of both the type of clay
minerals present and the amount . The ratio of the p lasticity Índex to
the
percentage
of
m aterial
finer
than
2¿¿m
gives
an
indication
of the
plasticity of the purely
clay-sized
portion of the soil and is called the
activity .
Kaolinite has an activity of
0.3-0.5;
1;
ilute of
~0.9;
and
montmorillonite of greater
than 1.5. These valúes
hold
true
not
only
for th e activity of the puré clay minerals but also for coarser-grained
soils whose clay fraction is composed of these minerals. A high
activity is associated w ith those clay minerals tha t can adsorb large
amounts of water within their mineral lattice, and is related to the
chemistry
of the
clay pa rticles. This penetration
of the
clay
m inerals
by wa ter molecules causes an increase in vo lume of the clay minerals,
so that the soil swells. Th us, ac tivity is a mea sure of the prop ensity of a

7/18/2019 Correl Soils Properties Carter&Bentley
http://slidepdf.com/reader/full/correl-soils-properties-carterbentley 18/136
12 CORRELA TIONS OF SOIL PROPERTIES
clay to
swell
in the
presence
of
water
and may be
used
to i
expansive
clays.
In a less
precise manner, swelling
and
shrinkage
properties
are
also
related to the liquid limit, so that this too can be
used to help identify expansive clays. This is discussed in
Chapter
8.
In broad term s, the plasticity Índ ex reflects the ratio of clay m ineral
to
silt
and fine
sand
in a
soil, tha t
is the
proportion
of
clay m inerals
in
the fines. Since th e silt-, sand- and clay sized particles each nave th eir
characteristic angles
of
internal friction, their relative proportions
largely
determine the angle of internal frict ion,
f )
T
,
and henee to a
large exten t the angle o f
efíective
shearing resistance,
< / > )
o f clay soils.
Thus there are, perhaps surprisingly, correlations of
< p
r and
with
plasticity índex.
These
are
given
in
Chapter
6.
1 2 5 Limitations on the use of consistency limits
It
can be seen íhat,
like
grading, the Atterberg limits are poteníially
related to a w ide
variety
o f soil prop erties.
That
this has been fou nd to
be true , gives ampie just if ícation for the use of grading and plasticity
properties
in the
soil classifícation systems. However,
a l though
Atterberg l imits do enable intriguingly good predictions for some
engineering properties, certain lim itatio ns m ust be recognised. L im it
tests
a re performed on the m aterial fíner than 425jUm, and the degree
to w hich this fractio n reflects the
properties
of the soil will depend on
the
proporíion of coarse material present and on the precise grading
of the soil.
Another l imitat ion
is
that
th e
limit tests
are
performed
on
remoulded soils and the correlations are not generally valid for
undisturbed soils unless the soil
properties
do not change substan-
tially
during remoulding.
This is the
case with
m a n y
nor-
mally-consolidated
clays but the properties of
over-consolidated
clays, sensitive clays and cemented soils
often
differ markedly
from
those predicted from Atterberg limit tests.
«•
7/18/2019 Correl Soils Properties Carter&Bentley
http://slidepdf.com/reader/full/correl-soils-properties-carterbentley 19/136

7/18/2019 Correl Soils Properties Carter&Bentley
http://slidepdf.com/reader/full/correl-soils-properties-carterbentley 20/136
14 CORREL ATIONS OF SOIL PROPERTIES
In
t h i s
respect, c lassif ícat ion sys tem s are m ore applicable w here soi ls
are used in remoulded
form
tha n w here they are used in thei r na tura l
s ta te and i t i s not surpr is ing tha t the m o s t comm only used engineer-
ing soil
classifícat ion systems were
all
developed
fo r
e a r t hworks ,
highways
o r
a i rpor ts work.
2.1
COMMON SOIL CLASSIFÍCATION
SYSTEMS
Th e mo st widely used engineer ing so il c lass i f íca t ion systems thro ugh -
out the
English-speaking wor ld
are the Uniííed
system
and the
American
Asso c ia t ion o f S t a te Highw ay and T ranspor ta t ion
Offíciáis
(AASHTO ) system. Of these, the
Unified
system is the mo re generally
applicable
and
more widely used.
I t was
developed f rom
a
system
proposed
by
Casagrande (1948)
and
referred
to as the
Airfield
Classif ícaíion S ystem . Coarse-grained soi ls (sands
and
gravéis)
are
classifíed according to their grading, an d fine-grained soils (silts and
clays)
a nd
organic soi ls
are
classifíed according
to
their plast ici ty,
a s
indicated in
Table
2.1. Classifícat ion i s carried out using particle size
dis t r ibut ion data and l iquid l imit and plast ici ty índex valúes, as
shown in Table 2.2. An ingenious feature of the system is the
differentiat ion
o f
silts
and
clays
by
means
of the
plast ici ty chart ,
included in the
table.
The posi t ion of the A-line was fíxed by
Casagrande, based
on
empirical data.
Th e only
m odif ícat ion f rom
Casa grande s original proposa l is the
smal l
devia t ion a t the lower
end.
The
system
ca n
also
be
used
to
classify soils using only
fíeld
ident i f íca t ion, as
indicated
in
Table 2.3.
An advantage of the system is t h a t i t can be easily extended to
include more soi l groups, giving a fíner degree of classifícat ion i f
required.
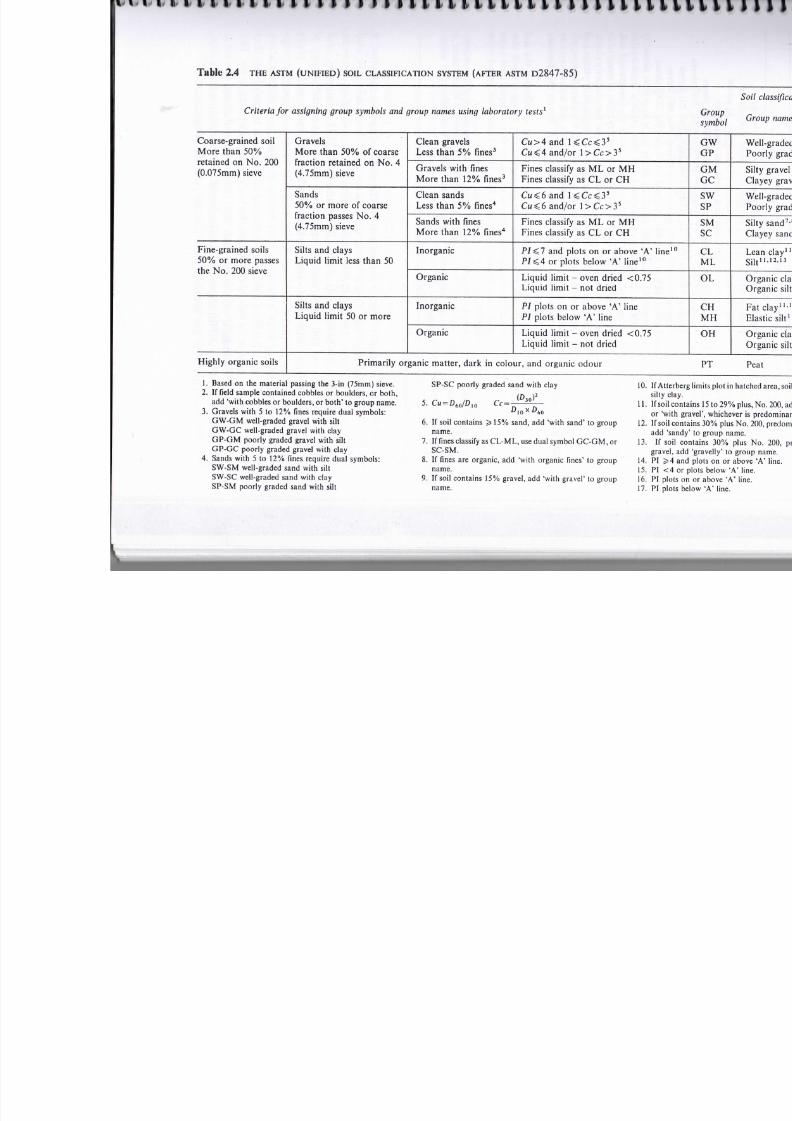
The A merican Ass ocia t ion for Test ing and M ater ia ls hav e a dopted
th e
U nified system as a basis for the ASTM soil classifícation, entitled
S tandard Test M eth od for Classifícation o f Soils for Engineering
Purposes , designation D2487. T h e p resentat ion is s omewha t
difíer-
ent
from
t h a t
o f the
U nified system
but the raethod of
classifícatio n
is
almost identical. Th e ma in differences a re t h a t th e ASTM classifíca-
tion D2487 requires classifícation tests to be rformed whereas th e
Unifíed system allows a t enta t ive classifíca; based on visual
inspection only;
and the
ASTM system gives
a
subdivis ión
of the
groups wh ich produces
a
rigidly
specifíed ñ a m e fo r
each
soil
type.
T he
main soi l classifícat ion chart
is
given
in
Table
2 .4 and the
ASTM
versión
of the
soi l plast ici ty ch art
i s
given
in
Figure
2.1.
D efíni tions
of
th e soil descriptions used are given in Table 2.5. The coefíicient of

7/18/2019 Correl Soils Properties Carter&Bentley
http://slidepdf.com/reader/full/correl-soils-properties-carterbentley 21/136
SOI L CLASSI FI CATI ON SYSTEMS 15
Table 2 1 TH E U N I F I E D S O I L C L A S S I F I C A T I O N S Y S T E M : B A S I C S O I L G R O U P I N G S
Majar divisions
jg
'o
^ S
'3
3
X
.
ftj
^J
3
•*••»
1
^j
Q
^j
Sí
e;
"S
Ijl
líl
djl
o
"a
I
•
Q
C* 3
^ s j E
"^S
'r»
^
1
s '^
a
v^ s:
»££
Su
^~*' 1\
§
§ -s:
'S
^
*
+
C^ s ^f*
^S
C
"S
-2 ^
» ^ j ^
^
V Í3 *
"^ "3
S .§
=3 - J
jf
1
y
i
~SS
J
e
•g
<í o1
1§
0 S
S
w
i
h
f
n
a
e
a
e
a
m
o
o
f
n
s
¿o ~~
"^ .§ a
^ 5 -^
g j
Highly
organic soils
Typical ñames
W e l l
graded gra vé i s , g rave l - s a nd
m i x t u r e s ,
li t t le or no f ines
Poor ly graded g ravé is , g rave l - s a nd
m i x t u r e s , little
or no f ines
Silty
g ravé i s , poor ly graded
gravel-sand-si l t
mix tures
Clayey
g ravé i s , poor ly graded
gravel-sand-clay mix tures
Wel l graded s ands , grave l ly s ands ,
little or no fines
Poor ly graded s ands , gra ve l ly
sands,
little
or no fines
Silty
s ands , poor ly graded
sand-silt mix tures
Clayey
s ands , poor ly graded
sand-clay mix tures
I no rgan i c
silts
and very f ine sands ,
rock f lour ,
silty
or clayey fine
sands with s l ight plas t ic i ty
Inorgan ic c l ays
of low to
médium
plast ici ty ,
gravel ly c lays , sandy
clays, sil ty clays, lean clays
Organic s i l t s
a nd
organ ic
silt-
clays
of low
plas t ic i ty
Inorganic s i l t s , micaceous
or
d i c tomac eous
fine
s andy
or
sil ty
soils , elastic
sil ts
Inorganic c lays of high plas t ic i ty,
fa t
c lays
Organic c lays
of
mé d i um
to
high
plast ici ty
Peat
and
other highly
organic soils
Group
symbols
G W
GP
G M
GC
SW
SP
SM
SC
M L
CL
OL
M H
CH
OH
Pt

7/18/2019 Correl Soils Properties Carter&Bentley
http://slidepdf.com/reader/full/correl-soils-properties-carterbentley 22/136
U se
grain size curve
in
identifying
th e
fractions
as
given under f ield
Identification
P l a t t l c i t y
l n d * x
.»
M U
*•
O t
0»O
*-JO
O O O O O
É
J
(^
i r*
i 1
É
~
- ,
rj
s e
*
2 N r _
Si ° * \r
O.
U
r- ^
-.
o i
» ~
o
2
r ~ ? r
— s \
O • -•--«••— ' ' 1 ' -
•
s *J
\ ^
m \
•*
\
Determine
percentages o f
gravel
a n d sand
f ro m g r a i n s i ze c u r ve . D epe
percentage of f ines ( f r a c t i o n s m a l l e r than 75/ ím sieve size) c o a r se g r a i ned
classified a s f o l l o w s:
Less than 5
G W , G P ,
SW ,
SP
More t h a n 12% GM, GC, SM, SC
5 to 12%
P * £
í3
Cr í
n >
,
S
í±
^ •í ñ
c^
^ f l >
» ^ . ^^
CT |
o cr
«. °
fD
^
1-1 rt
& > ^
3
fc—
n t
'
C . T Í
M
" S
*
-
"
o
^3 l
er o
^
1- 1 cr
p tr
rt
•-i <
W -1P
SH
la.
^ -<
C D
i- * r p > ^
3
iD
o
* -•
cr
. c cr c ^
C r ~- O f u
^
5- 3'
,
r-
^
f >
«
S
i^
5 ^
0 * ^S
-•>
P
0,8
o í
C en O.
£.'
- ^
00
C /3
S
§?
^
-4-
n >
fD
r -
tr o
TO
^™ í
D-
P
(-*
O
3
í-t
S
£.
• -i
re
3
3
e n
i— ^
O
> -i
IV D
Borderline
cases r e q u i r i n g
use of d u a l s y m b o l s
O
0
n
c
|
\^3
h -
o
X
to
Q\
C
^
3
(
I I
h*«
H« M
to to
S s §
w
^^
O
^
J
r-*-
0
t>
-t- r-f
5
3-
u ??
n
3
3
h
P
_
o\4
3
3
CL
u>
00
Í T > g
3
trt
re
5
i
^-J fi )
O
^ c 3
w ^
£ 3
E -.
C /3
H-i) ^
P cr
P
o
ft ^
> -i
n >
P ^ ? t
a
ro
» — *
^i
* £ * • 3
c r
tí í?
** ffO
w
°
1
^t)
en
^
cr
£L
nT
o"
en
¿
en <
en * t P S * > * .
*< «
^
2£
3
jD r o
^
cr
_. c ._ cr o
o ^ 5' § a
r l
»^
^J •
w
( *•
18
ir 5 fí
^Ü
e n
Sr
3 _
m 3 .
|± -
o
^
" S
^ r "
M ^ .
ftj
*-3
*C
c
w P- 2.
E - S -j
3-
O
n
o
S
S o
^
*-»•
rt i
re
r-f
fc»
•
3
O Q
Si
O Q
i~ i
C L
P
r
o
3
*- t
£
C_
i - t
re
3
3
• .
rt-
o n
i—
» ^
O
O
13
**•
to
1
O
X
0

7/18/2019 Correl Soils Properties Carter&Bentley
http://slidepdf.com/reader/full/correl-soils-properties-carterbentley 23/136
SOIL
CLASSIFICATION SYSTEMS 17
70
60
I
5
X
40
_ > .
o
30
5
<
a20
10
7
4
FOR CLASSIFICATION OF FINE-GRAINED SOILS AND FINE-GRAINED
FRACTION
OF COARSE-GRAINED
SOILS
Equation
of
.Horizontal
then PI=O.7
.Equation
oí
Vertical
at
then Pl=0.í
A--IÍ
at
Pl='
3(LL-
IT-I
LL=16
KLL-fi
CL-ML
I
ne
\
2O)
ne
to Pl
=
)
¿
í
ox
^
Lo
-25.5
y
ov,
rOL
1 j
\°*
vJ/>
^
z
,
*
v
>
s
J
X
MH
°
.
»v
0
/
or
s
OH
y
1O 2 3 4 S 6 7 8 9 1 O 11 12
Liquidlimit LL)
Figure 2.1 Soil plasticity chart used with the STM an d
Unified
soil classifi-
cation sysíems
uni formi ty ,
Cu and the
coefficient
of cu rva tu r e ,
Ce,
of the grad ing
curve ,
wh i ch
are
used
in the
classif ication,
are
defined
in
Table 2.4.
The soil
ñames used
for
each
of the
soil group s
are
defíned
in
Tables
2.6,
2.7 and
2.8.
The Bri t ish Standard classification
system
BS 5930) is , like th e
Unified system, also based
on the
Casagrande classification
but the
definitions
of sand and gravel are slightly different, to be in keeping
with
o the r
Brit ish Standards, and the f ine-grained
soils
are divided
into fíve plastici ty ranges rather than the simple
low
and high
divisions of the Unified and the original Casagrande systems. In
addi t ion, a considerable
n u m b e r
of sub-groups have been i n troduced .
The basic soil ñam es, symbols and qualifying t e rms are given in Table
2.9 and the definit ions of the soil groups and sub-groups can be
obtained
from
Table
2.10
in
conjunct ion with
the BS
versión
of the
plastici ty chart , Figure 2.2.
It can be seen that both the ASTM and, part icularly, the BS soil
classification systems subdivide the soil in to a m uc h larger num ber of
group s th an the earl ier system s. Al tho ugh
this
allows a m ore precise
classification,
it
negates
two of the
main attr ibutes
of the
Unified
classificat ion: the
system s
are no t
long er simple
and
easy
to
remem ber
but require constant reference to a table and ch a r t; and they canno t
be implemented without recourse to laboratory test ing.

7/18/2019 Correl Soils Properties Carter&Bentley
http://slidepdf.com/reader/full/correl-soils-properties-carterbentley 24/136
18 CORRELATIONS OF SOIL PROPERTIES
ble 2 .3 TH E
U N I F I E D S O I L C L A S S I F I C A T I O N S Y S T E M : F I E L D I D E N T I F I C A T I O N
Field identiflcation procedures
(Excluding par ti
cíes
larger than 75mm and basing fractions on
estimated weights)
t
1
i~
-Ü *
^
'3
.2
¿
í I 'S
lis
i
2^5= °
?í|l
2 J a
8
•* =
a e
3
J**
Ib
.O
o
:s
ís
o
o
Ui
«I
O.
W )
ü
13
o
u
.n
3
O
ja
«
^ .< £
1 .s
1
X
«,
S
V,
— .N U
Í3
O
o;
'55
2 £ S E
« o -S i
= * •
. 1
«
£
¡>t
j j
< * x ¡ o f _
ia C
;
S -s
c
^
§
•«
S u
f
^ < ¿
£ a ^3
, I
•- _ ^ . s ^
Q1
^ 5j
-C
1%I«
s -
2 • * = < - . £
s
J a
£ .u -S
-5 .0 - s; .
H f l
5
•*
S
M
o
h
h
o
c
f
r
a
o
s
s
m
e
h
4
7
m
m
s
e
o
r
v
s
u
c
a
c
o
h
e
v
e
o
e»
1§
|o?
§ ^ ^ .
•5; :
{ j -^
-c: ^-
= - - ' < = •
n <ú í- 5C aj
1*11*
3
-a
o
JU
^ 0 3
a
« j
,a
g^^
J
*-.
o -S
-«
-2:^
.•S -c o ^ ^
- ^ . .a ^ -
-^
¿
^
c 2
1 4 I H
o _g Q
W i d e r an g e i n g r a i n s i z e an d s u b s t an t i a l
a m o u n t s o f a ll
i n t e r m e d í a t e
particle sizes
Pred om ina ntly one s ize or a range of s izes
w i t h
s o m e i n t e r m e d í a t e s i z e s m i s s i n g
N o n - p l a s t i c fines ( f o r
id e n t i f lc a t io n
p r o c e d u r e s ,
s ee ML b e l o w )
Plás t ic f ines (for id e n t i f ic a t io n p r o c e d u r e s , s e e C L
b e l o w )
W i d e r an g e in grain sizes a n d s u b s t a n t i a l
a m o u n t s o f a ll
i n t e r m e d i ó t e pa r í ic le
sizes
P r e d o m i n a n t l y o ne size o r a range o f s i z es w i t h
s o m e i n t e r m e d í a t e
size
m i s s i n g
N o n - p l a s t i c
f i nes
( f o r
id e n t i f ic a t io n
p r o c e d u r e s ,
s ee
M L
b e l o w )
Plás t ic f ines (for id e n t i f ic a t io n procedures , see CL
b e l o w )
Identification procedures on fraction smaller íhan 425um sieve
h's;
- ¿ l l
§:s-s
a.|.g
§ ~ "
^
o
E * -
0
3
-.3 -.
G .g J
li|
Í3
Q
:
« u
o,
Highly
organic soils
Dry sírength
(crushing
charac-
teristics)
None
to
s l ight
M é d i u m
to
high
Slight to
m é d i u m
Slight to
m é d i u m
H i g h to
very high
M é d i u m
to
high
Dilatancy
(reaction
to shaking)
Q u i c k to
s low
None to
very
s l o w
Slow
Slow to
n o n e
None
N o n e
to
very slow
Toughness
(consistency
near plástic
limit)
None
M é d i u m
Slight
Sl ight to
m é d i u m
H i g h
Slight
to
•sdium
R e ad i l y
identif ied
b y c o l o u r, odou; p o n g y
feel
a n d
f r e q u e n t l y
b y f i b r o u s
t e x t u r e
Group
symbols
G W
G P
G M
G C
SW
S P
S M
SC
M L
C L
O L
M H
CH
O H
Pt
7/18/2019 Correl Soils Properties Carter&Bentley
http://slidepdf.com/reader/full/correl-soils-properties-carterbentley 25/136
7/18/2019 Correl Soils Properties Carter&Bentley
http://slidepdf.com/reader/full/correl-soils-properties-carterbentley 26/136
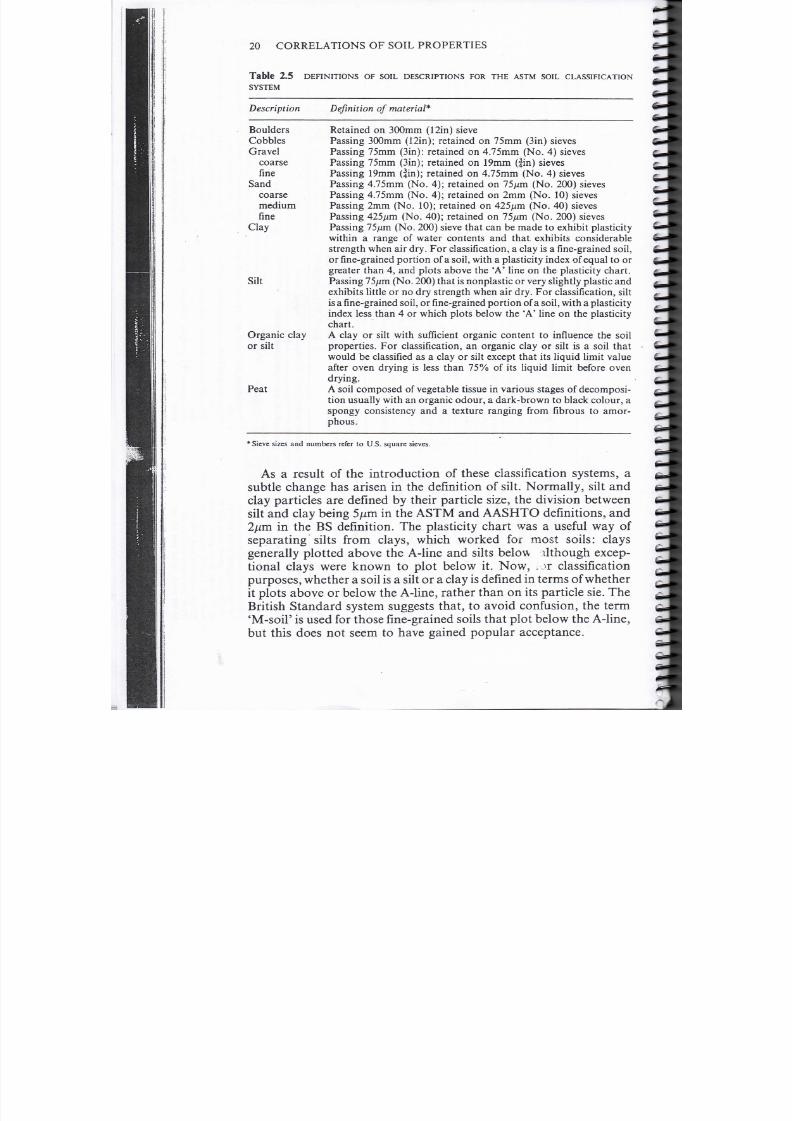
20 CORRELATIONS OF SOIL PROPERTIES
ble 2.5
SYSTEM
DEFINITIONS OF SOIL DE SCRIPTIONS FOR THE ASTM SOIL CLASSIFICATION
Description
Defm ition of
material
Boulders Reta ined on
300mm
(12in)
sieve
Cobbles Passing 300mm (12in); retained on 75mm (Sin) sieves
Gravel Passing 75mm (Sin): reíained on 4.75mm (No. 4) sieves
coarse Passing 75mm (Sin); retained on 19mm
(|in)
sieves
fine Passing 19mm
(|in);
retained on 4.75mm (No. 4) sieves
Sand Passing 4.75mm (No. 4); retained on 75/zm (No. 200) sieves
coarse Passing 4.75mm (No.
4);
retained
on 2mm
(No.
10)
sieves
médium
Passing
2m m (No. 10); retained on 425/mi (No. 40) sieves
fine
Passing
425/¿m
(No. 40); retained
on 75/¿m
(No. 200) sieves
Clay
Passing 75/mi
(No. 200) sieve that
can be
made
to
exhibit plasíicity
within
a range of water contents and that , exh ibits considerable
s t rength when
air
dry .
F or
classification,
a
clay
is a
fine-grained
soil,
or fine-grained
port ion
of a
soil, w ith
a
plasticity
índex
of
equal
to or
greaíer than 4, and ploís above íhe
A line
on íhe plasíicity charí.
Silt Passing 75/^m (No. 200) that
is
nonplastic
or
ve ry slightly plástic
and
exhibits little or no dry strength when a ir dry. For classification, silt
is
a fine-grained
soil,
or fine-grained
portion
of a
soil, w ith
a
plasticity
Índex
less than 4 or which ploís below th e A line on the plasticity
charí .
Organic
clay A clay or sill with sufficient organic conlent to
influence
íhe soil
or sill properlies. For classification, an organic clay or silt is a soil that
would be classified as a
clay
or silí
excepl
Ihat ils liquid limil
valué
afler oven drying
is
less Ihan
75 of ils
liquid limií before oven
drying.
Peat
A soil
composed
of vegetable tissue in
various
stages
of
decomposi-
lion usual ly w ilh an organic odour , a dark-brow n lo black colour, a
spongy consislency
and a
lexture ranging
from fibrous lo
amor-
phous .
*
Sieve sizes
and numbers refer to
U.S.
square
sieves.
As a
result
of the introduction of
these classification systems,
a
subtle change
has
arisen
in the defmition of
silt. Normally, silt
and
clay particles are
defíned
by their particle size, the división betw een
silt
and clay being 5/rni in the ASTM and AASHTO
defmitions,
and
2/mi
in the BS
defmition.
The
plasticity chart
was a
useful
way of
separating silts from clays, which worked for mosí soils: clays
generally plotted above
the
A-line
and
silts
below üthough
excep-
tional clays were known to plot below it. Now, ,
r
classification
purposes,
whether
a
soil
is a silt or a
clay
is defíned in terms of
w hether
it plots above
or
below
the
A -line, rathe r than
o n its
particle sie.
T he
British Standard system suggests that, to avoid confusión, the term
M-soil
is used for those fine-grained soils that plot below the A-line,
but this does not
seem
to ha ve gained popular acceptance.
7/18/2019 Correl Soils Properties Carter&Bentley
http://slidepdf.com/reader/full/correl-soils-properties-carterbentley 27/136
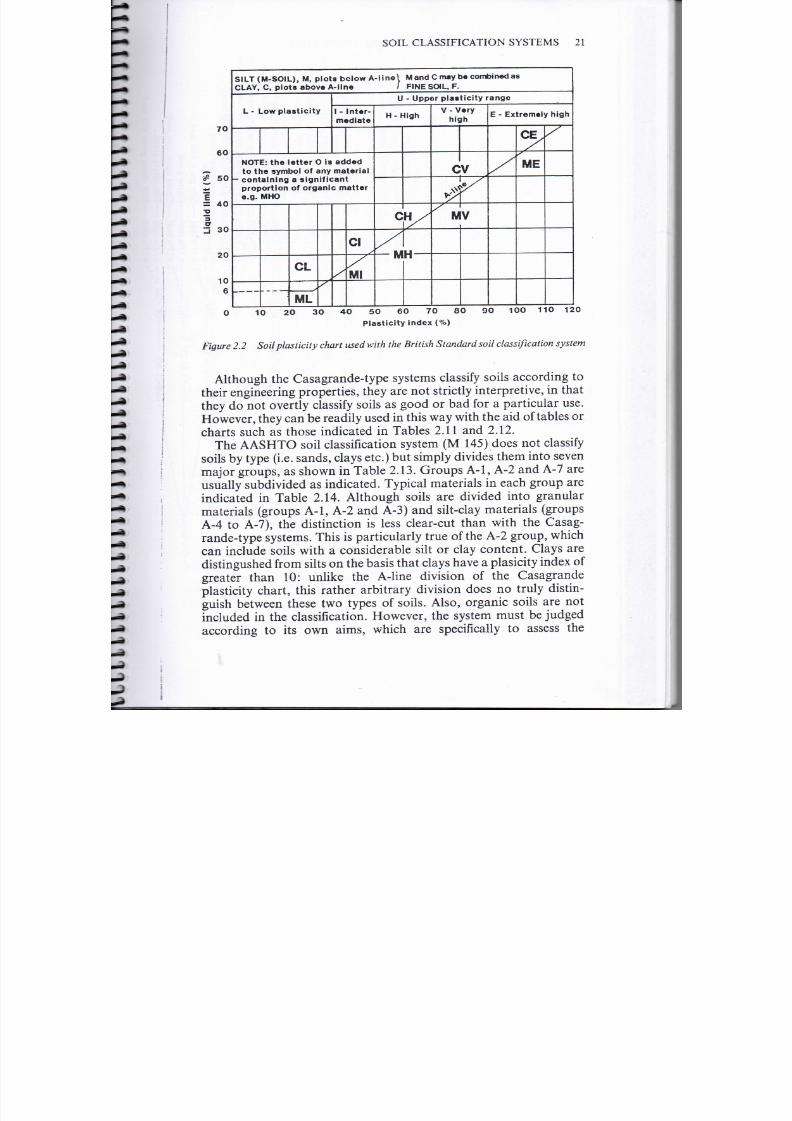
SOIL CLASSIFICATION SYSTEMS 21
70
6
= 4
2
er
3 3
20
10
SILT M-SOIL), M, plots bolowA-line\y becombinedas
CLAY C, plots above
A-line
/ FINE SOIL, F.
L - Low
plasticity
U
- Uppor
plasticity rango
i
Inter-
medíate
NOTE: the
letter
O is added
to the symboi of any
material
-
containing
a
significant
proportion
of
organic
mat ter
e.g. MHO
CL
ML
x
Cl
MI
H -
High
CH X
-
M«J
m
V -
Very
high
C
:V
MV
E - Extremely
high
x
°>
ME
O 1 2 3 4O 5 6 7 8 9O 1 11 12
Plasticity indox ( )
Figure
2 2
oilplasiicity
chart used with the British Standa rd so il
classification
system
Although the
Casagrande- type systems c lassify
soils
aceo r d ing
to
the i r e ng inee r ing prope r t i e s ,
t h ey
are no t s t r ic t ly inte r pre t ive , in that
they
do not over t ly
classify soils
as
good
or
bad
for a
part icular use
How eve r , they can be re adi ly used in th is way with the a id of tables or
charts such
as
those indicated
in
Tables 2 11
and
2 12
The AASHTO soi l classif ication system M 145) doe s not classify
soils by type i .e . sands, clays etc .) but sim ply divides them into seve n
major groups, as shown in
Table
2.13. Groups A-1, A -2 and A-7 are
usually
subdivided as indicated.
Typical
mate r ia ls in
each
g ro up a r e
indicated in Table 2 14 Although soils are divided into granular
mate r ia ls groups A-1, A-2 and A-3) and
silt-clay
mate r ia ls groups
A-4
to A-7), th e dist inct ion is
less
c lear-cut than with the Casag-
rande-type systems. This i s part icularly t rue of the A-2 group, which
c an
include soils with
a
considerable sil t
or clay
content . Clays
are
dist ingushed f rom silts
on the
basis tha t c lays have
a
plasicity Índe x
of
greate r than 10: unlike th e A-line división of the Casagrande
plasticity
char t , th is ra the r arbi t rary divis ión does
no
truly dist in-
guish between
these tw o
types
of
soils.
Also,
organic soils
are not
included in the c lass i f icat ion. However , the system must be judged
aceording to its own aims, which ar e
specifically
to assess th e

7/18/2019 Correl Soils Properties Carter&Bentley
http://slidepdf.com/reader/full/correl-soils-properties-carterbentley 28/136
b le 2 6
F L O W C H A R T
F O R
C L A S S I F Y I N G C O A R S E - G R A I N E D S O I L S ( M O R E T H A N
s o
R E T A I N E D
O N
is^m S I E V
<5 fines
and
an d / o r l>Cc>3
G R A V E L
% grave l>
%san d
^5-12% fines
and
Cu<4
and/or l>Cc>3
12 %
fines
fines-ML
o r MH
fines-CL, CH,—
(o r C L - M L )
f ínes-ML or M H
f ines-CL
or C H ,
(or C L - M L )
f ines-ML
o r MH
fines CL or CH
f ínes-CL-ML
> G W - G M
> G W - G C
+ G P - G M
> G P - G C
*G M
< 15% s a n d -
S í l 5 % s a n d -
< 1 5% s a n d -
>
15%
s a n d -
<
15% sand
-
5=15% sand
- » < 1 5 % s a n d -
> 1 5 % s a n d -
< 1 5 % s a n d
> 1 5 % s a n d -
< 15%
sand
*G C
> G C - G M
15%
sand
-
^
15%
s a n d -
->
< 15% s a n d -
^
>
15% s a nd -
< 1 5%
s a n d -
' 5= 15% s a nd -
>W
'We
>Po
> P o
>W
>W
>W
>W
>Po
>Po
>Po
»Po
Si
» S i l
••Cl
>Cl
v S i l
> S i l

7/18/2019 Correl Soils Properties Carter&Bentley
http://slidepdf.com/reader/full/correl-soils-properties-carterbentley 29/136
•• • • •
n n n
• •
B
1 1 E 1 1 1 1 I I I» »
SAND
,<5 fines
5-12
fines
Cu
6 and 1
< Ce <
3
Cu<6 and/or 1
>Cc>3
Cu^óand l<Cc<3
, T
J
* fines-ML
or MH —
X
ines-CL, CH,
(o r CL-ML)
— ovv
- ^
> S T p
—
+SW-SM
-:
—
»sw-sc
'-^- 1J 70 giavci
~^
15 gravel
l jf*1 1 AOTIVPl
•> 15
grave l
—
—
> <
15
gravel
^ 15%
gravel
:—
-» < 1 5 gravel
>15 gravel
Cu<6
and/or
l>Cc>3x,
>12
fines
,
fines-ML or MH >SP-SM
fines-CL or
CH >SP-SC
(or CL-ML)
fines-ML or
MH -S M
fines-CL-CH
> SC
fines L ML
->SC-SM
15 g r a v e l -
' ^15 g r a v e l -
» <
15
g r a v e l -
' ^ 1 5 grave l -
< 15
grave l
15
grave l
< 15 gr ave l
<15 g rav e l -
15
grave l
•
W
W
» P
>
»W
*
»W
»W
*P
••
••
- >
- >
-*
->
-*
->

7/18/2019 Correl Soils Properties Carter&Bentley
http://slidepdf.com/reader/full/correl-soils-properties-carterbentley 30/136
Table 2 . 7
F L O W
C H A R T F O R C L A S S I F Y I N G I N O R G A N I C F I N E - G R A I N E D
S O I L S
( 5 0 % O R M O R E P A S S E S
7 5 / « n
S I E V
GROUP SYMBOL
I n o r g a n i c
L L < 5 0
P I > 7 a n d
plo t s o n o r above
'A ' - l ine
4<PI<7
a n d
>C L - M I
p lo t s on or a b o v e
'A ' - l ine
PI<4
o r
p l o t s -
be low 'A ' - l ine
/ LL- ove rd r i e d
Orgahic — . ,<0.75
1 LL-not
d ne d
<3Q
plus
N o . 200^< 1 5
p lus
N o. 200
\5-29 p lus N o . 2C
sand grave l
15-29 p lus N o . 2 0 0 - x — > % sand >
sand
<
p lus No . 200<f
sand
< g r a v e l «
< 1 5
grav
5*15 grav
< 1 5 s a n
l^\5 san
,<30% p l u s
N o .
200<-»<15 p l u s
N o . 200-
sand
N. t
grave l
•
'15-29
p l u s
No. 2(Kk^»
sand
^
/ o
sand <
<15 grav
p lus
No. 200<(
* ^
1 5
g r a v
sand < g r a ve l v^ <
15
san
15 sand
,<30% plus No . 200^-* < 15 p lus No . 200-
15-29% plus No. 200 sand
>
sand <
sand ^% g r á v e l a —
15
g r a
^ 15
g r a
s a n d
<% g r a v e l ^ — + < 15
san
^ 15 s a n
> S e e T a b l e 2 . 8

7/18/2019 Correl Soils Properties Carter&Bentley
http://slidepdf.com/reader/full/correl-soils-properties-carterbentley 31/136
vi t i i i i i i i i »
M
I J I » » » V V I f t f t i i
ft}11Il
Inorganic
PI plots on
or >C H
above
'A'-line
PI
plots below
> M H
'A'-line
/LL-overdried
Organic —
—-j<0.75
—»OH
1
LL-not
dned
<30 plus No.
200^-»<15
plus No. 200
N
5-29
plus
No. 2(XK^
sand
sand
<
30
plus
No
,
sand
gravel
N ,
sand
<
gravel
< 15 grav
\5
grav
< 15 sand
^
15 san
,<30
plus No. 200 -> < 15 plus No.
200
15-29
plus
No. 2(Xk-*
sand
^
sand <
sand < gravel -^— >< 15 gra
15
grav
í
30
plus
N o.
sand < gravel
:15
sand
15
sand
> S e e T a b l e 2.8

7/18/2019 Correl Soils Properties Carter&Bentley
http://slidepdf.com/reader/full/correl-soils-properties-carterbentley 32/136
ble
2 . 8
F L O W C H A R T
F O R
C L A S S I F Y I N G O R G A N I C F I N E - G R A I N E D S O I L S (5 0
O R
M O R E P A S S E S 7 5 /i m S I E V E )
GROUP
SYMBOL
and
plots on
or
above
'A' - l ine
PI<4 or plots
below 'A'-line
OH
Plots on or
above 'A'-line
Plots below,
'A ' - l ine
<30 plus
No. 200-
5 = 3 0 %
plus No. 200
<30 plus
No.
200
S s 30% plus No. 2
<30
plus
No.
200-
Ss 30 plus No. 200
,<30% plus No. 200-
•> 30 plus No. 2
<15 plus No. 200-
15-29 plus No.
200-=
sand
>
graveé
sand < g r a v e l -
> < 1 5 % plus No. 200
15-29 plus No. 20(k
sand
^
gravel -
sand
< gravel
> < 1 5 % p lus No. 200
'15-29
plus
No. 200-
sand ^
grave l
•
sand
<
grave l .
•<15 plus No. 200-
'15-29 plus No. 200-
sand
>
grave l -
sand
<
gravel
sand
gravel
'
sand < grave l
< 15 gravel
5* 15% g rave l
-»<15 sand
• > 1 5 %
sand
sand
¿t
gravel
% sand < % gravel
< 15 gravel
>15 g r a v e l —
<15
sand
Sil5
sand
sand
5s
gravel
sand < gravel
K15
gravel
•>15 gravel
-*<15
sand
1 5 %
s a n d —
-» sand
^
gravel
sand < gravel
<
15
gravel
15 %
gravel —
<15
sand

7/18/2019 Correl Soils Properties Carter&Bentley
http://slidepdf.com/reader/full/correl-soils-properties-carterbentley 33/136
SOIL CLASSIFICATION SYSTEMS 27
Table
2 9
Ñ M E S AND D E S C R I P T IV E L E T T E R S FOR G R D I N G AND P L S T I C I T Y
H R TERISTI S
escriptive ñame Letter
Main íerms
Qualifying terms
Main terms
Qualifying terms
Main term
Qual i fy ing
term
G R A V E L
SAND
Well graded
Poorly
graded
Uniform
Gap
graded
FINE SOIL, FINES
m ay
be differentiated in to M or C
SILT (M-SOIL)
plots below A-line
of plasticity chart
(of restricted
plástic
range)
CLAY
plots abo ve A-line
(fully
plástic)
Of
lo w plasticity
Of
intermedíate
plasíicity
Of high plasticity
Of very high plastisity
Of extremely
h igh
plasticity
Of
upper
plasticity
range*
incorporating groups
I, H, V and E
PEAT
Organic
may be suffixed to any
g roup
G
S
W
P
Pu
Pg
F
M
C
L
I
H
V
E
U
Pt
O
This term
is a
useful guide when
it is not
possible
or not required to desígnate the range of
l iquid l imit more closely,
e.g. during the rapid
assessment
of soils.
suitabili ty of
soils
fo r
pavement
subgrades; the
higher group num bers
being progressively less suitable.
In
this way the system is more
restricted yet more interpretive than the Casagrande-type systems,
since
it not
only
classifíes
soils into groups
o f
similar properties
but
also passes ju dgem ent abou t the qua lity or suitab ility of the soils in
each group.
A
further
refínement of the
AASHTO system
in
this
respect is the use of a
group
Índex , to ev alúa te subgrade quality . It is
calculated from
the
formula :
Group
index =
( JF-35)[0.2 + 0.005(LL-40)]-
r
-0.01(F-15)(P/-10)
where
F is the
percentage passing 0.075mm sieve, expressed
as a
and
whole
number .
This
percentage
material passing
th e
75mm sieve
LL
is the
liqu id limit
PI is the plasticity Índex.
is based only
on the
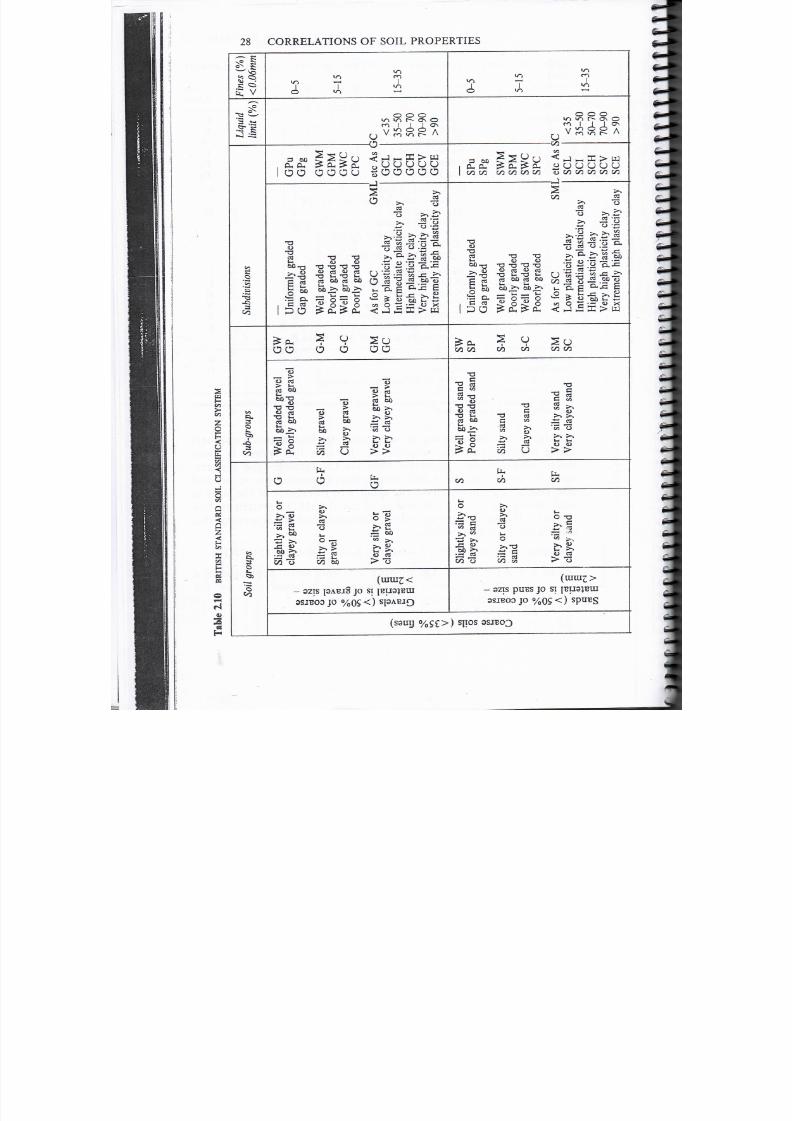
7/18/2019 Correl Soils Properties Carter&Bentley
http://slidepdf.com/reader/full/correl-soils-properties-carterbentley 34/136
oarse
soils
(<35% fines)
Sands (>50% of coarse
material is of
sand size
-
<
2mm)
— <
P E?. 2- E £
1
«5* £ |£2
0.0 o.s-
« < o
1-t
C/3
S
0 ^
<
<-
n oo
*o
<•
0
rt
— — 0
*í
22
p
£?
X
<*
*•< v<«
*•<
í CS
fD O3 *"~*
t
P*
£ w 3
oci
P
«< ve; p Q -i Q
o a p n
*< g o. 0.0.
0.
a
"
. . . • . o.
00 00 00 00 OO 00
í||¡ ¡¡
£3 jy i
y C J
*
t
(JQ
«
CJ Q OQ M
n c i Q ' S r o ^ ' c / 3 ( r o P o o P 3
CT tr «
S-.
^_ O 3 a
g o. o
fj*
O £^
t-*-
O^ Q p. ("L
Q
CÍ* (TQ
*J-
p*
J
J5-
CB
Cu
>-t
u
i-
1
§ •
S
<<
0_
p 00
***
s
1
—
1
O O O O O O O O O O O ) O O O O O O O O O O O O
OOOQOo
^ fl ^'TS
V
--J
V
t>J
A
pp
v
A
v o T T I
w
0O0
> —
*
vi O
v />
I
[
>— V
U> V
Gravéis (> 50% of
coarse
material is of gravel size -
>2mm)
o.
<
OQ oo o. oo
~ í
M
2-
o << d
lf ale.
is .
3
w;
o
§ O O
•TI
< <
O
y
V
33 s r ^ g
«;
O
w
f»*
-Í"«f
o? § »
3
o> p « P n
oí
3
i
~ ȣ*
Í£L
w S
- .
si P «
i"*
o
o 9 9
«5"3"c«9tS3-^
TiO-'-iD.
g-J
^ p- P CT.
v
J p
rj
n3 o» «~-
3 Tj¿.
o JJ D. O. D- O. Q. O.([q
C y Q P ^ °i t
v^
p) p^ p
> J
i:
g . i* g
If I
t
*
°
o o o o o
« •
nooo oo
onnoo" J^^^^^^
\
--J
V
OJ A
O
V
p o vi A
«o T T
1
u>
O
^¿>
*—l V V
OO0
>— V
P
y» - l T
1 >— V
U)
V
V
C/3
O
«Ci
o
00
o
Oo
1
•** t
i1
A 3
tf
;
z
D
>
O
P
O
1
s
ñ
H
¡
I
SHIIÍÍ3cIOHcI IOS
HO
SMOI V 3HHOD

7/18/2019 Correl Soils Properties Carter&Bentley
http://slidepdf.com/reader/full/correl-soils-properties-carterbentley 35/136
SOIL CLAS SIFICATION SYSTEMS 29
000
v vi r~ — o\D
f>
1 1
Os
W «0
00A
rmV^ ¡
*/•} t-
A
r
^J
c/ 3
o
H-]
2 PC >
W
•su uu
uu
1
—
> ->
|3
' 5 -2
:§
"ale
n
'£ *
.2
tí
ft
> -.
,_
"a |
" S - ' - S E
Q ¡_, r* ^_
gJ
^-» ¡>
<u
£Q
j^y
~ i
w o
•g ;-
u x
•<
—
t_ x í>
w
O
o
Su
ü
«s
'« *o
?
"«3 *4J
rt
o 3
6o
Ü
UH
0
*-
?".
rs o s
co •-
1—
í*
rt >
a M
(ssuy %S9~S£)
sXep pire
sjiis
ípuBS Jo
/ÍUSABJQ
o o o
V
V
C*- O"\>
r* }
C T N
oo
v
—
A
U U
"U
us tn «j
<
<<
£££uuuuu
l/J t/J _ J
us
•*-*
>> |o
'Q
Ü
O S43
O
O '-S
•-
tí
js
^
U U U
J2
S
- -SP"
O O O '
i— i
r^
-^^
c*-<
tfc-i (*_,
^ j > pj
^««O ^Ox
<-<-<i_ih-.lx;,>tU
00 00
—
«
"o
>-. >->
•o-a
>,
c c > > a
cd cd
rzn
r^?
í/3 </3 t/3 U
C /2
IX U.
kH
0
* >.
•S
^-2
W 3 O
"c *°*
°
03 rrt rz3
C /D u3 C/2
(S3UU
°/ 5 9 )
S
^ - ^ I D pu^
^ns
(S3UIJ %g£<) SITOS 3UIJ
3
O
JH
C X
t_
o
E
03
i—
Q
^3
o
E
2
>. c
vi U
3 C
0= ¿ o 3
^
•*•*%
«
J ?*O
3 J*0
Cl Cl
i— J5 *
O
Q J • J
3 _ 0 f l c
eÍ<—
c °"S
a Z
a
2.H
« Ij's
I
S
*-"
^ *
o
3 | "3
o
'°
^
^
^
i
*5»
S
utoü >_ »
iJ«i AH
O
C
t
CU *
•?
_>
oc
o «
O Cu
1
C
cd
5
S?
A
¡s
•a
B
CS
Wl
u
_ N
35
1
«
13
'C
u
M
E
U
S2
cd
S
o
A
Ít3
'B
>
O
•
3
c
_0
e i
u
c c
•— o
E
-
« ^
-
S
E
•—
C
•
•o
-¿ C
o - S
O.
o
•
u
•-; C
§ - 8
u •- O
ü
o <"
i
3
cr
O —
C
.. c
c c
o *
? S? ü
'
•3
U
O
,
H
_ u c
§
C
r™1
o J
IIs">í
-2
t T / n
« ¡_ U 0
c
15
y
O
O
§.«
l.§
o o —
L ñ "O
-=
o o .y
o.
M
..
E
O
TT
ce a
o o
«
'
u c 5o -=
^
* > .,
t a w E Z o r i E - S S
— .
o
w
*3
rt
Ü
3 O
~ §
— ü
o
••3 EOU

7/18/2019 Correl Soils Properties Carter&Bentley
http://slidepdf.com/reader/full/correl-soils-properties-carterbentley 36/136
Table
2 11
E N G I N E E R I N G P R O P E R T IE S
O F
C O M P A C T E D
S O I L S ,
C L A S S IF IE D A C C O R D I N G
T O T H E
U N I F I E D
S Y S T E M
Ty ÍCal
ames
ofsoil
groups
Important
engineering properties
Relative desirability
No.
1 is
consid
Rolled
Earthfill
dams
Canal
seclions
Group
symbols
Shear
Permeabili ty strenglh ibility
when
compacted when
compacted
an d
compacted
salurated
saturated
Workability Homo-
as a qeneous
,
conslruclion embank-
material mení
Core Shell
Com-
Erosión S
pacled .
resist-
i
earth
anee
l
lining
Well-graded gravéis,
g rave l -sand mix tures ,
little
or no fines
GW
Poorly graded gravéis,
GP
gravel-sand mix tures ,
l i t t le
or no fines
Sil ty
gravéis , poorly G M
graded gravel -sand-si l t
m i x t u r e s
Clayey gravéis ,
poorly G C
graded grave l -sand-c l ay
mixtures
Wel l -graded
sands
S W
gravel ly
sands
l i t t le
c1
no f ines
Poorly g raded sands , S P
gravelly sands
l i t t le or
no f ines.
Perv ious Exce l l en t Neg l ig ib l e Exce l l en t —
Very Good
pervious
Semiperv ious
Good
to i rnperv ious
I m p e r v i o u s Good
to
fair
Negl igible Good
Negl igible Good
V ery lo w Good
2
Perv ious Exce l en t Negl ig ib l e Exce l l en t — —
Pervious Good Very lo w
Fair
3
If
6
gravel ly
4 7
I f
If
gravelly g rave l ly
2
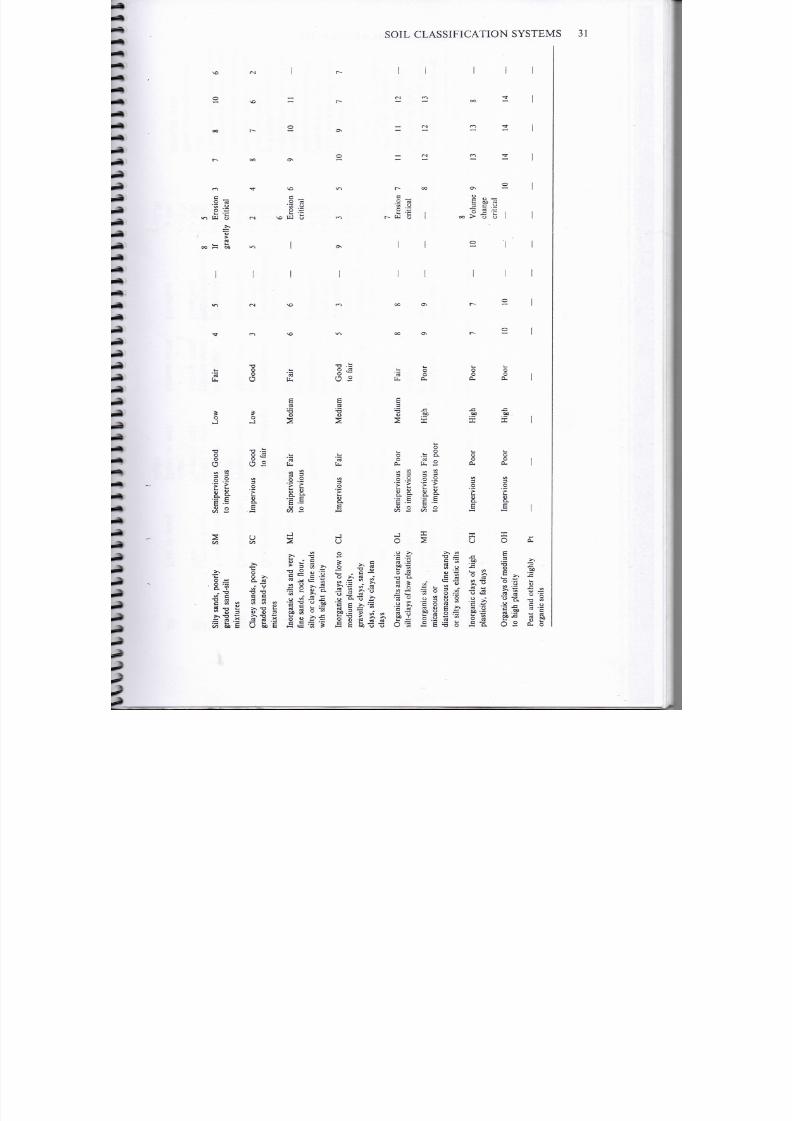
7/18/2019 Correl Soils Properties Carter&Bentley
http://slidepdf.com/reader/full/correl-soils-properties-carterbentley 37/136
SOIL
CLASSIFICATION SYSTEMS 31
ÍN r^
2
o
• < ñ
o
s
s
• W
o
O 3
u
o
—
r
ÜJ
c
o
c oo ca
2.
•-
oc ¡>
o u
1*
'«
bu
0
?
O
0
v
o
.§ •
»
c /5
C
tfl
•o
1
¡55
Vi
3
_0
>
S
E
o
?
T3
S s
8
3
2
-|
e c
E
0
o
a
o
3 3
cS
2
VI
3
.2
B
u
ai
C
l
a
s
p
y
g
a
s
n
c
a
m
i
x
u
e
i*
3
U
E
3
•3
4>
S
1
3 3
o .2
> £ ;
II
Ji
S
j
S
§
s
• g á
r t _ ^ j
a
g
.-*
w
V
•al
c u 5
00 S
i— < tS
05
TJ
d
4J 'Q
C • —
S , s
g o.
a
_
0 Jj
o S
'1
O
-5 5
áS
E
3
-3
U
S
UH
2
3
O
8.
E
U
o
I
n
g
n
c
c
a
o
o
w
m
é
d
u
m
p
a
ü
y
g
a
y
c
a
s
n
c
a
s
y
c
a
e
n
c
a
i_ i
a
t
E
3
'•o
u
•
l_
O
£
v
o
.1
1
u
0
0
O
r
g
n
c
s
s
a
n
o
g
to
3
,O
>
(_r
8.
.§
o
-^
to
H .
_ o
to
C8
o
vi
O
O
c u
J2
00
s
'3
U.
v
o
.1 -
U
2
I
n
g
n
c
s
s
k i
o
o
D.
0
r
v
o
S.
_ §
o
m
c
u
o
O
d
a
o
m
a
f
n
s
n
05
ío
o
«
_r t
u
o
«
*¡o
IM
O
M
o
o
O.
oo
X
w
o
VI
3
_ O
E
U
00
2
°
S,
C3 *J
o < 2
— >i
S t¡
« o
00 • —
ll
o
o
B U
00
X
b .
0
o
CU
to
_ o
8.
a
o £
O
r
g
n
c
c
a
o
m
e
d
u
t
o
h
g
p
a
c
y
P
a
n
o
h
h
g
y
o
g
n
c
s
o
s
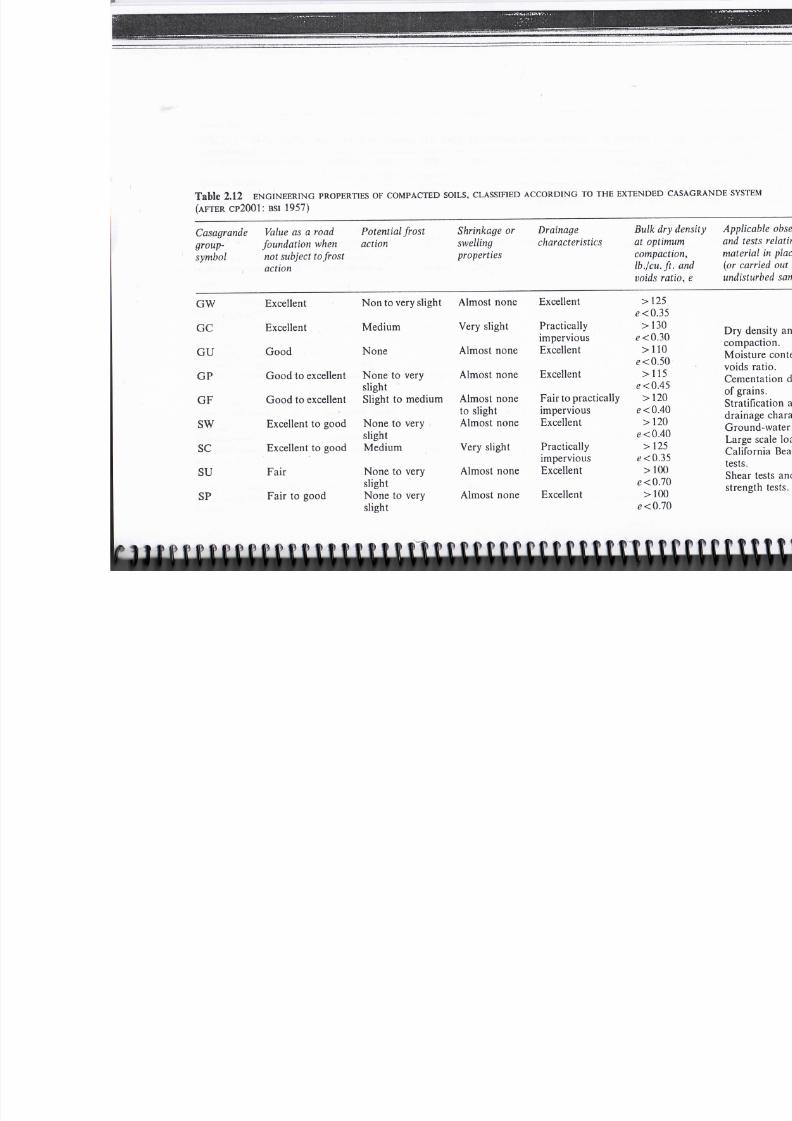
7/18/2019 Correl Soils Properties Carter&Bentley
http://slidepdf.com/reader/full/correl-soils-properties-carterbentley 38/136
Table 2.12 E N G I N E E R I N G P R O P E R T IE S O F C O M P A C T E D S O I L S , C L A S S I F IE D A C C O R D I N G T O T H E E X T E N D E D C A
A F T E R CP2001: B S I 1957
Casagrande
group-
symbol
G W
GC
G U
GP
GF
S W
S C
S U
SP
Valué
as a
road
foundation when
not subject tofrost
action
E x c e l l e n t
Exce l l en t
Good
Good
to
excellent
Good to excel lent
E x c e l l e n t
to
good
E x c e l l e n t to good
Fair
Fair to
good
Potential frost
action
Non to v ery s l ight
M é d i u m
N o n e
on to very
slight
S l ight
to
médium
N o n e
to
v e r y
_t
•
i
4.
c
i gh t
'- 'o
M é d i u m
N o n e to
very
i • i
slight
None
to
very
slight
Shrinkage or
swelling
properties
Almos t none
V e r y s l ight
Almos t none
Almos t n o n e
A l m os t n on e
to slight
A l m os t n on e
V e r y s l igh t
A l m os t n on e
Almost n o n e
Drainage
characteristics
Excel l en t
Prac t i ca l ly
i m p e r v i ou s
E x c e l l e n t
Excel lent
F a i r
to
pract ical ly
i m p e r v i ou s
Exce l l en t
P rac t i ca l ly
i m p e r v i o u s
Exce l l en t
Excel lent
Bulk
dry
at opt imu
compactio
Ib .
/cu .
f t
voids
rati
> 1 2 5
< ? < 0 . 3 5
> 1 3 0
e<0 30
e<0 50
e<0 45
> 1 2 0
e < 0.40
> 1 2 0
f\
r\ <Ü
>125
e < 0 . 3 5
>100
0.70
>100
e
< 0.70
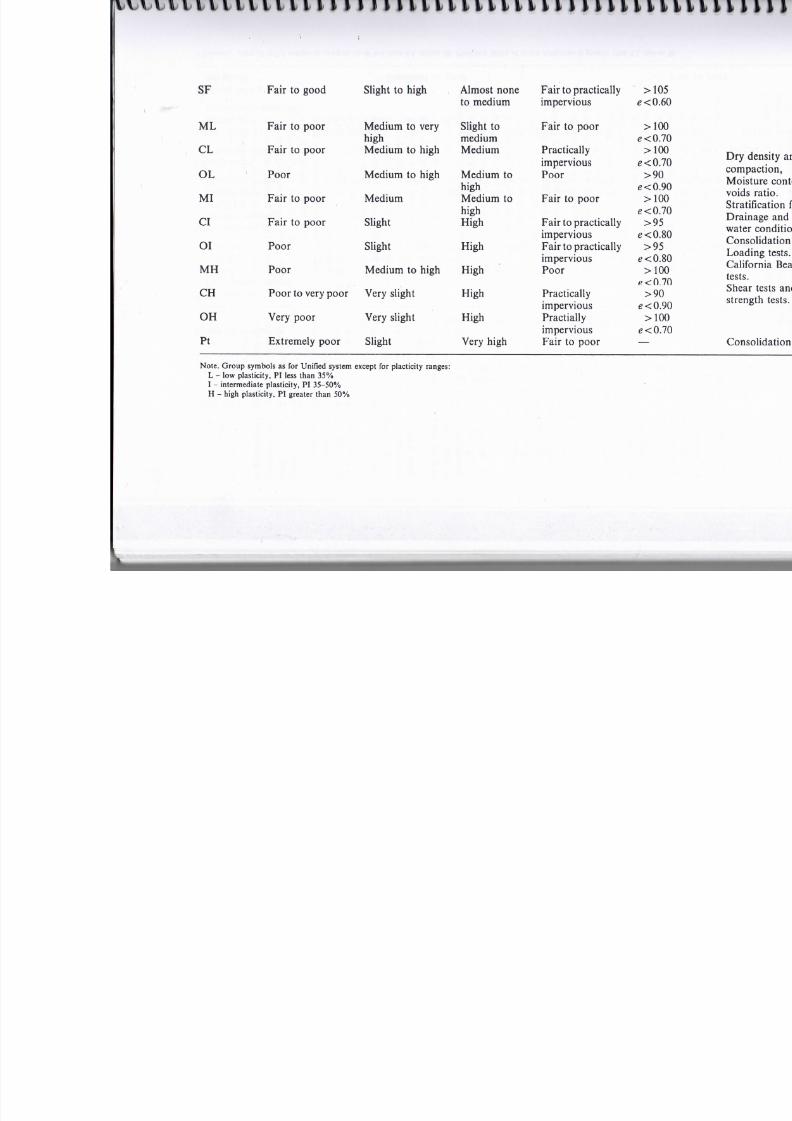
7/18/2019 Correl Soils Properties Carter&Bentley
http://slidepdf.com/reader/full/correl-soils-properties-carterbentley 39/136
SF
M L
CL
OL
M I
CI
Oí
M H
CH
OH
Pt
Note .
L -
I-
H
-
Fair
to good
Fair to poor
Fair
to poor
Poor
Fair to
poor
Fair to
poor
Poor
Poor
Poor to very póor
Very poor
Extremely
poor
Group symbols as for Unif ied system
low plastici ty ,
P I
less than
35
intermedíate plastici ty , PI
35-50%
high plastici ty ,
P I
greater than
50
Slight to high
Médium to very
high
Médium to high
Médium to high
Médium
Slight
Slight
Médium to high
Very slight
Very slight
Slight
except
fo r
plactici ty ranges:
b
Almost n o n e
to médium
Slight
to
médium
Médium
Médium
to
•
v
high
Médium to
1 1
high
High
High
High
High
High
Very
high
Fair
to practically
impervious
Fair to poor
Practically
impervious
Poor
Fair to
poor
Fair to practically
impervious
Fair to practically
impervious
Poor
Practically
imperv ious
Practially
impervious
Fair to poor
-
> 105
e
0.60
i o o
e<0.70
i o o
e<0.70
>90
e 0.90
i o o
e 0.70
>95
e
0.80
>95
e
0.80
> 1 00
>90
e < 0 . 9 0
i o o
e
0.70
—

7/18/2019 Correl Soils Properties Carter&Bentley
http://slidepdf.com/reader/full/correl-soils-properties-carterbentley 40/136
• • . . . .
Table
2.13
A A S H T O S O I L C L A S S I F IC A T I O N S Y S T E M M
145)
,-, , , . ~
Granular materials
General
classmcatwn
,->cn/
• T C \
or
less passing /jum
4-7 4-3 4-2
Group classification
A l a A l b 4-2-4 4-2-5 4-2-6 4-2-7
Sieve analysis:
Percentage passing:
2 m m 5 0 m a x — — — — — —
425/rni 30 max 50 max 51 min — — — —
75/¿m 15 max 25 max 10 max 35 max 35 max 35 max 35 max
Charater ist ics of
f rac t ion passing
425/im:
Liquid
l imit — — 40 max 41 min 40 max 41 min
Plast ici ty índex 6 max NP 10 max 10 max
11
min
11
min
Group índex
-
typical valúes 0 0
0 4 max
Usual
types of
Stone
f r agment s Fine Silty or clayey
gravel
and sarid
significant
gravel
and
sand
s a n d -
c on s t i t u e n t materials
. • .
.
Genera l r a t ing as
subgrade Excel l en t
to
good
Si
(More
A-4
36 min
40 max
10
max
8 max
Silty
Fa
* Plast ici ty
Índex
of A -7 -5 s u b g r ou p is e q u a l to or less t h a n LL m i n u s 30 . Plast ici ty índex of A -7 -6 s u b g r ou p i s g rea te r t h a n LL m i n u s 30 .
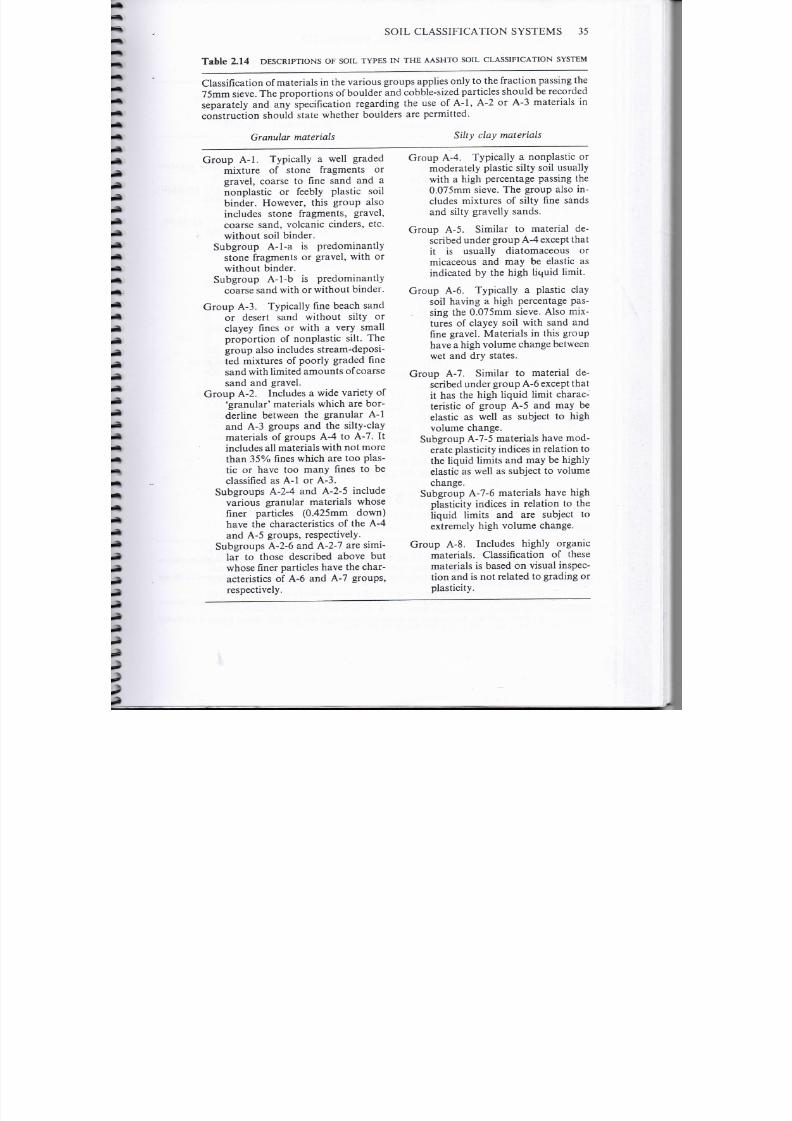
7/18/2019 Correl Soils Properties Carter&Bentley
http://slidepdf.com/reader/full/correl-soils-properties-carterbentley 41/136
SOIL
CLASSIFICATION
SYSTEMS 35
Table 2 14
D E S C R I P T I O N S O F S O I L T Y P E S I N T H E S H T O S O I L C L S S I F I C T I O N
S Y S T E M
Classification
of
materials
in the
v arious groups applies
only to the
fract ion passing
th e
75mm sieve. The proportions of boulder and cobb le-sized particles should be recorded
separately
and any specification
regarding
the use of A - l , A-2 or
A-3 materials
in
construction
should
state
whether
boulders are
permitted.
ranular
materials
Silty clay
materials
Group A-l. Typical ly
a well
graded
mixture o f
stone fragments
or
gravel, coarse to fine sand and a
nonplas t ic or
feebly
plástic
soil
binder .
However ,
this g roup
also
includes stone fragments , gravel ,
coarse
sand, volcanic cinders, etc.
wi t hou t
soil binder.
Su b g rou p
A-l-a is
p re d ominan t l y
stone
fragments
o r
gravel ,
with
or
w i t h o u t
binder.
Subgroup A-l -b
is
predominant ly
coarse sand with or w i tho ut b inder .
Group
A-3. Ty pically fine beach sand
or
desert sand without
silty or
clayey fines or with a very small
proport ion of nonplast ic s i l t . The
group also includes stream-deposi-
ted mixtures of poorly graded fine
sand with limi ted amoun ts
of
coarse
sand
and gravel.
Group
A-2. Includes a w ide varie ty of
granular materials which are bor-
derline between the granular A-l
and A-3 groups and the silty-clay
materials
of
groups
A-4 to
A-7.
It
includes
al l
m aterials with
not
more
than
35 fines
which
are too
plás-
tic or have too m a n y fines to be
classified as A-l or
A-3.
Subgroups A-2-4 and A-2-5 include
various granular materials whose
finer
particles (0.425mm down)
have íhe characteristics
of the A-4
and A-5
groups , respectively.
Subgroups A-2-6 and
A-2-7
are simi-
lar to
those
described above but
who se finer particles have the ch ar-
acteristics of A-6 and A-7
groups,
respectively.
G rou p A-4. Typically a nonplast ic or
modera te ly plástic silty soil usual ly
with a high
percentage passing
th e
0.075mm sieve. The group also in-
cludes
mixtures
of
silty
fine
sands
and silty gravelly sands.
Group A-5. Similar to material de-
scribed
under group
A -4
except tha t
it is usually diatomaceous or
micaceous
and may be
elastic
as
indicated
by the
high l iquid
limit.
Gr ou p A-6. Typical ly
a
plástic clay
soil having a high percentage pas-
sing th e
0.075mm sieve. Also m ix-
tures of clayey soil with sand and
fine gravel .
Materials
in
this group
have a high volume change between
wet
and dry states.
Group A-7. Similar
to
material
de-
scribed
under
group
A-6
except tha t
it has the
high liquid limit
charac-
teristic
of group A-5 and may be
elastic
as
well
as
subject
ío
high
volume change.
Subgroup A-7-5 materials have m od-
érate plasticity Índices in relation to
the liquid limits and may be
highly
elastic
as
well
as
subject
to
volume
change.
Subgroup
A-7-6 materials
have high
plasticity
Índices in relation to the
liquid limits
and are
subject
to
extremely high volume change.
Gro up A-8. Includes highly organ ic
materials. Classification
of these
materials is based on visual inspec-
tion
and is not
related
to grading or
plasticity.

7/18/2019 Correl Soils Properties Carter&Bentley
http://slidepdf.com/reader/full/correl-soils-properties-carterbentley 42/136
36
C O R R E L A T I O N S
O F
SOIL PROPERTIES
Table 2 15 C O M P R I S O N
O F
S O IL G R O U P
I N
U N I F I E D S Y S T E M
Group
G-F
GF
S
S-F
SF
FG
FS
F
Pt
S system
Subgroup
Subdivisión
GW
GP
G-M
G-C
GM
GC
sw
SP
S-M
S-C
SM
SC
MG
CG
MS
CS
M
C
GPu
GPg
GW M
GPM
GWC
GPC
SP u
SPg
SW M
SP M
SW C
SPC
MLG,
MIG
MHG, MVG,
M EG
CLG, CIG
CHG, CVG,
CEG
MLS, MIS,
MHS, MVS,
M ES
CLS,
CIS
CHS, CVS, CES
M L, M I
M H ,
MV, ME
CL,
CI
CH, CV, CE
Comparable soil group
in n i f i e d system
Most probable
Possible
GW
GP
GP
GW-GM
GP-GM
GW-GC
GP-GC
GM
GC
SW
SP
SP
SW-SM
SP-SM
SW-SC
SP-SC
SM
SC
ML, OL (3 )
M H ,
OH
(3 >
CL'
4
'
CH
(4)
M L, OL
(3)
M H , OH'
3
'
CL (4 >
CH'4'
ML, OL
(3 )
M H , O H (3 )
CL'4'
CH'
4
'
Pt
SW'2'
Sp 2
GW'1'
SP'
2) SW'1 2'
SW-SM'2'
GW-GM'1', SP-SM'2',
SW-SM'
1
2
'
SW-SC'2'
GW-GC'1',
SP-SC'
2
',
SW-SC'1 2'
SM'2'
SC'
2
'
SW'1'
SW-SM'1'
SW-SC'1'
GM<
2)
, SM'2 5'
GC'2', SC'2 5'
SM'5'
SC'5'
-
Notes:
(1 ) These p ossibilities
arise
because soil that is udged to be gap-graded using the BS system may
satisfy
the criterion
Cc=(D30):z/(D10xí)60) =
between
1 and 3 used in the Unified
system.
(2) These possibilities
arise
because
of diflerences in the
definitions
of
sand
and gravel
sizes
between the BS and
Unified
systems.
(3)
Soil
will
be classified into these
groups
if the BS symbol is
suffíxed
with the letter
'O'.
(4 ) Soil will b e
classified into these
groups if it
plots above
the A
line, even
if the BS
symbol
is suffixed
with
the
letter
'O'. However, this will rarely happen.
(5) These possibilities arise because fine soiis are defined as havin g at least 50 fines (< 4 25¿ im) in the Unified
system
bu t
having
at least 35 fines in the BS
system.
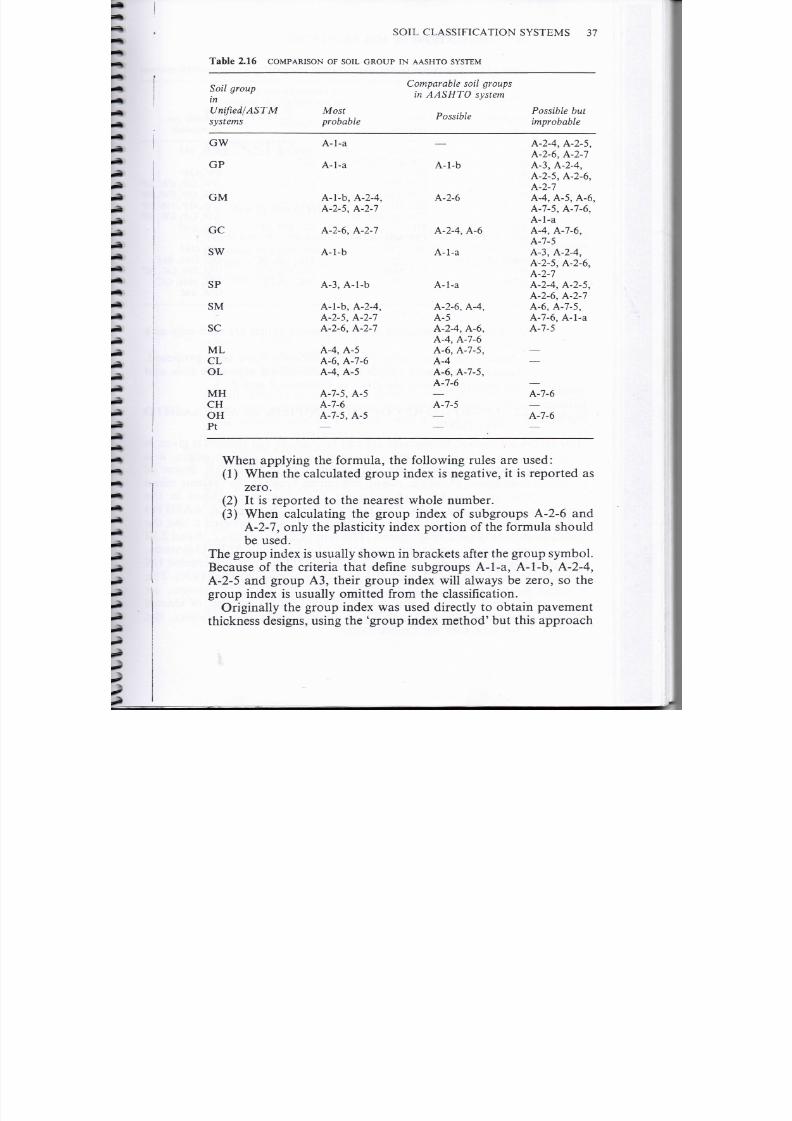
7/18/2019 Correl Soils Properties Carter&Bentley
http://slidepdf.com/reader/full/correl-soils-properties-carterbentley 43/136
SOIL CLASSIFICAT ION SYSTEMS 37
Table 2 16 C O M P A R I S O N
O F
S O I L
G R O U P I N
A A S H T O
S Y S T E M
Soil
group
in
Umfied ASTM
systems
GW
GP
Most
probable
A - l - a
A - l - a
Comparable
soil groups
in SHTO system
Possible
A - l - b
Possible
but
improbable
A-2-4, A-2-5,
A-2-6,
A-2-7
A - 3 A-2-4,
A-2-5, A-2-6,
A - 2 - 7
GM
GC
SW
SP
SM
se
M L
CL
OL
MH
CH
OH
Pt
A-l-b, A-2-4,
A-2-5,
A-2-7
A-2-6,
A-2-7
A- l -b
A - 3
A - l - b
A-l-b, A-2-4,
A-2-5,
A-2-7
A-2-6, A-2-7
A - 4
A-5
A - 6
A-7-6
A - 4
A -5
A-7-5, A-5
A - 7 - 6
A-7-5, A-5
—
A - 2 - 6
A-2-4, A-6
A - l - a
A-l -a
A-2-6,
A-4 ,
A -5
A-2-4, A-6,
A-4, A-7-6
A-6, A-7-5,
A -4
A-6, A-7-5,
A - 7 - 6
—
A - 7 - 5
—
—
A-4, A -5, A-6,
A-7-5, A-7-6,
A- l - a
A - 4
A-7-6,
A - 7 - 5
A-3, A-2-4,
A-2-5, A-2-6,
A - 2 - 7
A-2-4,
A-2-5,
A-2-6, A-2-7
A - 6
A-7-5,
A-7-6, A- l - a
A-7-5
—
—
—
A-7-6
—
A-7-6
—
When applying the formula, the following rules are used:
1 )
When th e calculated group Índex is negative, it is reported as
zero.
2) It is reported to the nearest
whole
number .
3)
When calculating the group
índex
of subgroups A-2-6 and
A-2-7, only
the
plasticity índex port ion
of the
formula should
be used.
The g roup Índex is usually show n in brackets after the group symbol.
Because of the criteria
that
define subgroups A-l-a , A-l-b , A-2-4,
A-2-5
and
group
A 3,
their group índex will always
be
zero,
so the
group índex
is
usually omitted from
th e classification.
Originally the group
índex
was used directly to
obtain
pavement
thickness designs, using th e
group
índex method but this approach
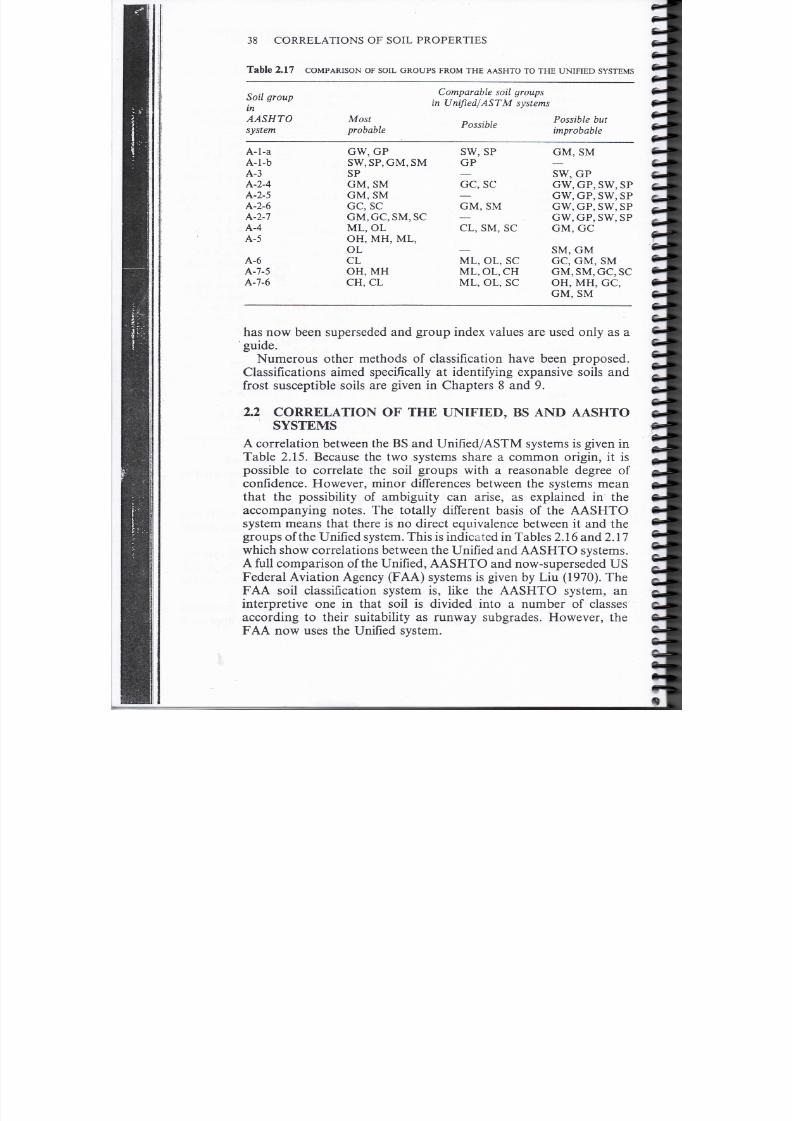
7/18/2019 Correl Soils Properties Carter&Bentley
http://slidepdf.com/reader/full/correl-soils-properties-carterbentley 44/136
38
CO RRE L A T I O N S OF SOIL PROPERTIES
Table
2 1 7 C O M P A R I S O N OF S O I L GROUPS F R O M TH E A A S H T O TO THE U N I F I E D S Y S T E M S
Soil group
in
S TO
system
A l a
A l b
A-3
A-2-4
A-2-5
A-2-6
A 2 7
A-4
A-5
A-6
A-7-5
A-7-6
Comparable soil
groups
in
Unified ASTM systems
Mos t
probable
G W , G P
S W , S P , G M , S M
SP
G M, SM
G M , SM
GC, SC
G M , G C , S M , S C
ML, OL
O H , M H , M L,
OL
CL
O H , M H
CH , CL
Possible
SW , SP
GP
—
G C, SC
—
G M , S M
—
CL, SM, SC
—
ML, OL, SC
M L , O L , C H
ML, OL, SC
Possible but
improbable
G M , S M
—
SW ,
G P
G W ,
G P, SW, SP
G W , G P , S W , S P
G W ,
G P, SW, SP
G W , G P , S W , S P
G M ,
G C
SM ,
G M
G C, G M , SM
G M , S M , G C , S C
O H ,
M H , G C ,
G M , SM
has now been
superseded
and group índex valúes are used
only
as a
guide.
Numerous other methods of classification have been proposed .
Classifícations aimed specifically at
identifying
expansivo soils and
frost
susceptible soils are
given
in Chapters 8 and 9.
2.2 CORRELATION OF THE
UNIFIED
BS AND AASHTO
SYSTEMS
A correlation between
the BS and
U nified/ASTM systems
is
given
in
Table
2.15. Because
the two
systems
share a common
origin,
it is
possible to correlate the soil groups with a reasonable degree of
confidence. H owever, minor
differences
beíween the systems mean
that the possibility of ambiguity can arise, as explained in th e
accompanying
notes. The totally
different
basis of the A A S H T O
system means that there
is no
direct equivalence between
it and the
groups of the
U nified
system . This is indi cate d in Tables 2.16 and 2.17
which show correlations betw een the U nifíed and AA SH TO systems.
A full comparison of the U nified, AASHTO and now-superseded U S
Federal A viation Agency FA A ) system s is given by Liu 1970). The
FAA soil classification system
is ,
like
the
AASH TO sys tem,
an
interpretive
one in
that soil
is
divided into
a
number
of
classes
according to their suitability as runway subgrades. H owever , the
FA A now uses the U nified system.

7/18/2019 Correl Soils Properties Carter&Bentley
http://slidepdf.com/reader/full/correl-soils-properties-carterbentley 45/136
Chapter 3
NSITY
3 1
NAT URA L DENSITY
There are two measures of soil density; bulk density which mcludes
th e mass
of
both soil
and
pore water
and dry
density which ignores
th e
efíect
of the
contained water.
The
relationship betw een bu lk
and
dry
densities
is:
where p¿ is the dry density
p
is the
bulk densiíy
and
wn
is the moisture contení .
Bulk density
is
usually
of
prima ry consideration wh ere density
valúes are used directly; to calcúlate earth pressures b ehin d retainin g
walls
or
basements
fo r
exam ple since
it is the
com bined mass
of
soil
and
water that determines th e pressure.
Probably
a
more common
u se of
density
is as a
measure
of the
state
of
packing
of
soil particles and
fo r this dry
density
is a
m o r e
appropriate measure. Where density measurements are used in this
way a high dry density is usual ly sought .
Al though
high density is
not
of itself an important characteristic it implies that
oíher
properties
of the
soil
will
be
desirable
from
th e
engineering poiní
of
view.
A n increase in soil packing is accompanied by an increase in
sírength a decrease in
com pressibility
and a decrease in perm eability
which in
t u rn
can
lead
to
reduced
shrinkage/swell
problems.
Typical valúes
of
natu ral density
are
given
fo r
various
soil
types
in
Table 3.1.
T h r o ugho u í the chapter densi íy valúes ar e given in kg /m 3 ;
to
convert to unit weighís in kN/m
3
íhe mulíiplying factor is
0.009806.
For
g ranu la r
soils the
relative densi íy
is often
considered
to be
39

7/18/2019 Correl Soils Properties Carter&Bentley
http://slidepdf.com/reader/full/correl-soils-properties-carterbentley 46/136
40
C O R R E L A T I O N S OF SOIL PROPERTIES
T a b J e 3 1 T Y P I C L V L Ú E S O F N T U R L D E N S I T Y
Natural
density
(kg/m
3
)
Material
Sands and gravéis: very
loóse
loóse
médium dense
dense
very
dense
Poorly-graded sands
Well-graded sands
Well-graded sand/gravel mi x t u r e s
Clays:
unconsol idated mu d s
soft,
open-síructured
typical,
normally
consolidaíed
boulder clays (overconsol idated)
Red tropical soils
Bulk density
1700 1800
1800 1900
1900 2100
2000 2200
2200 2300
1700 1900
1800 2300
1900 2300
1600 1700
1700 1900
1800 2200
2000 2400
1700 2100
Dry density
1300 1400
1400 1500
1500 1800
1700 2000
2000 2200
1300 1500
1400 2200
1500 2200
900 1100
1100 1400
1300 1900
1700 2200
1300 1800
1 Assumes
saturated
or nearly saturated condit ions.
more important than the absolute density. This is defíned as:
relative density
=
•
dr
— •
m x
m n
Par
Par,
where
p¿, p
dmax
and p
d m i n
a re the dry den sities in the fíeld and at the
densest and loosest síates of com paction
and
e,
e
max
and e
m
-
m
are the
corresponding void s ratios, respectively.
Because
of the difficulty of
measuring
fíeld
densities
in
sands
and
gravéis, valúes are usually estimaíed from standard peneíration test
results.
A
classifícation
of
relative densiíy
and SPT
iV-values,
although
widely used, has
received
repeated criticism.
Work by
Gibbs
and
Holtz
(1957) indicated that the relationship
beíween relative density and SPT valúes depends on the character-
istics of sand, w hether it is dry or saturated, and on íhe overburden
pressure. This
led to the
suggestion that correction factors
(C
N
) for
overburden pressure should be applied in the determination of
relative density and for f oun dation calculations.
Recommendations, from a
num b e r
o f
sources
are
given
in
Table
3.2. C orrected N valúes (A
r1
)
are
obtained using
th e formula:
=
CNJV
For
clarifícation
purposes ií should be noted that alího ugh the
interpretador
of
Terzaghi
and
Peck's (1948) classifícation, which
led

7/18/2019 Correl Soils Properties Carter&Bentley
http://slidepdf.com/reader/full/correl-soils-properties-carterbentley 47/136
D E N S IT Y 41
ble
3 .2
S U M M R Y
O F
P U B L I S H E D C O R R E C T I O N F C T O R S
D f
Reference
~ f „ ,
orrection
factor
C N )
Units
of
overburden
l
¿OÍ4
K
Gibbs and Holtz 1957)
[equation by Teng 1962]
Peck and Bazaraa 1969)
Peck, Hanson and
Thornburn 1974)
ee 1976)
Tokimatsu and
Yoshimi
1983)
Q=
10 <
4
3 .25 0.5a;
2 0
C
N
= l-1.251og10cr;
1.7
^
0 7 a v
psi
ksf
kg/cm
2
or tsf
kg /cm 2 or tsf
n 2 or tsf
Liao and W h i íma n 1986)
kg/cm
2
or tsf
Skempton
1986)
C
N
=
1.7
0
For fine sands
of
médium
D r
For dense,
coarse sands
when normal ly
Consolidated
For overconsolidated
fine sands
kg/cm2
or tsf
to this particula r correction,
originated with
Gibbs and Ho ltz 1957),
the actual equation for the correction f acto r can be attributed to T eng
1962) .
A l t hough SPT correction fac tors we re discussed at some length by
Liao and W hitm an 1986), the
deímitive
work on the
subject
is that of
Skem pton 1986) . Ske m pton points
ou í
tha t
in
carrying
out the SP T
test the energy delivered to the sampler, and therefore the
blow
count
obíained in any given sand deposit at a particular effective over-
burd en pressure, can still vary to a
signifícan t
extent depending on íhe
m e t h o d
of releasing th e h a m m e r , on the type of
anvil
and on the

7/18/2019 Correl Soils Properties Carter&Bentley
http://slidepdf.com/reader/full/correl-soils-properties-carterbentley 48/136
4 2 C O R R E L A T I O N S O F SOIL P R O P E R T I E S
ble
33 S U M M A R Y OF ROD E N E R G Y R A T I O S A F T E R S K E M P T O N 1986)
Hammer
Reléase
ER
ERJ60
Japan
China
USA
UK
D o n u t
D o n u t
Pilcon type
D o n u t
Safety
D o n u t
Pilcon Dando
oíd
standard
T o mb i
2 turns of
rope
Trip
M a n u a l
2 turns of rope
2
turns
of
rope
Trip
2
turns
of
rope
78
65
60
55
55
45
60
50
1.3
1.1
1.0
0.9
0.9
0 . 7 5
1.0
0.8
length of rods, if less than lOm. H is suggest ion is that N valúes
measured by any particular method should be normalised to some
standard
rod energy
raíio
ER
T
), and a
valué
of 60 is
proposed.
A
summary of rod energy ratios for a range of h a m m e rs and reléase
methods (wiíh
ro d lengths >
l O m )
is
given
in
Table 3.3 . N valúes
measured w iíh
a
k n o w n
or
est imated
ER
T valué
can be
normalised
by
the conversión:
60
where A represents other correction factors detailed in Table 3.4.
Skempton (1986) síates thaí th e Terzaghi-Peck limits of blow
coun t
for
various grades
of
relative density,
as
enumerated
by
Gibbs
and Holtz , appear to be good average valúes for normally con-
solidated natural sand deposits, provided that blow counts are
corrected for ov erbu rden pressure
N1
) and norm alised to a 60 rod
energy ratio C/Vj )^ ) ,
se e
Table 3.5.
Table 3.4 A P P R O X I M A T E C O R R E C T I O N S (A) TO M E A S U R E D N
V A L Ú E S A F T E R S K E M P T O N 1986)
R od
lengíh:
>10m
6-1 O m
4-6m
3^m
Standard sampler
U S
sampler wiíhouí
liners
Borehole diameíer: 65-115rnm
150mm
200mm
1.0
t.95
0.85
0.7
1.0
1.2
1.0
1 . 0 5
1 . 1 5
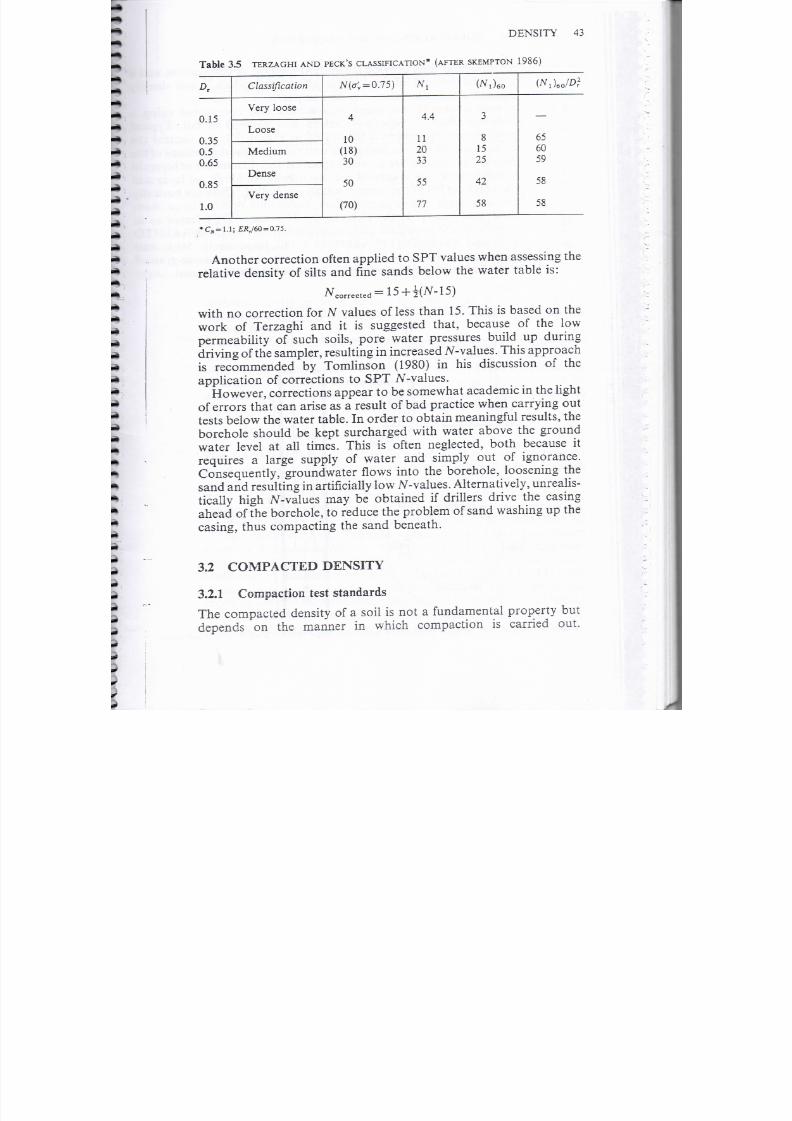
7/18/2019 Correl Soils Properties Carter&Bentley
http://slidepdf.com/reader/full/correl-soils-properties-carterbentley 49/136
DENSITY 43
Table 3.5 T E R Z A G H I A N D P E C K S C L A S S I F IC A T T O N * ( A F T E R
S K E M P T O N
1986)
D
t
0 15
0 35
0.5
0 65
0 85
1.0
lassification
V e r y loóse
Loóse
é ium
Dense
Ver y dens e
NK-0.75
4
10
( 1 8 )
30
50
( 7 0 )
4 4
1 1
20
33
55
77
Ní 60
3
g
15
25
42
58
NiW
65
60
59
58
58
*CW=U; £Rr/
Another correction
often
applied to SP T valúe s wh en assessing the
relative density
of silts and fine
sands below
th e
water table
is :
with no correction for N v alúes of less tha n 15. This is based o n the
work of Terzaghi and it is suggested that, because of the lo w
permeability
of
such soils , pore water pressures
build up
d u r i n g
driving of the sam pler, resulting in increased . /V - valúes. This ap proach
is rec o mmen d ed by Tom linson 1980) in his discussion of the
application of corrections to SPT JV-values.
However, corrections
appear
to be somew hat academic in the
l ig ht
of
errors that can arise as a result of bad practice when carrying out
tests below the water table. In order to obtain
meaningful
resulís, the
borehole should be kept surcharged
with
wa ter a b o v e th e g ro u n d
wa ter
level
at all times. This is
often
neglected, both because it
requires
a
large supply
of
water
and
simply
out of
ignorance.
Consequently, groundwater
flows
into th e borehole, loosening th e
sand and resulting in
artificially
lo w
JV -values.
A lternatively, unrealis -
íically
h igh N - value s
may be obíained if drillers drive th e casing
ah ead of the borehole, to reduce th e problem of sand washing up the
casing, thus compacting
th e
sand beneath.
3 2 COM PACTED DENSITY
3.2.1 Compaction
test
standards
T he compacted density of a
soil
is not a
f undam e nt a l
p r o p e r t y but
de pe nds on íhe m a n n e r in which compaction is carried o u t .

7/18/2019 Correl Soils Properties Carter&Bentley
http://slidepdf.com/reader/full/correl-soils-properties-carterbentley 50/136
44
C O R R E L A T I O N S OF SOIL P R O P E R T I E S
Compaction tests provide a s tandard m ethod of compact ion and a
standard
a m o u n t
of compacíive efíbrí to produce a soil density
against
which
site
valúes
can be com pared .
Soil is usually contained in a
mou ld
and compacíed using a
h a m m e r which
is
repeatedly raised
and
a l lowed
to
fall. Typical
compact ion equ ipment
is
illustrated
in
Figure 3.1.
To
cont ro l
íhe
compactive
effbrt -
the energy
per
uni t volume
- the
dimensions of
the
m ould and ram m er are precisely specifíed and the num be r of layers in
which
com paction is carried ou t , t he num ber of
b lows
per layer and
the height of
fall
of the ram m er are
al l
controlled. T here are basically
tw o
s tandards of com pactive eífort, commonly referred to as
stan-
dard
and heavy in the U .K. In the U.S. these are referred to as
s tandard and
modified
and are
detailed
in
A STM-D698/AA SHTO
T-99
and
ASTM-D 1557/AASHTO T-180, respecíively. Most tests
use
a special mould of abou t 1 litre capacity but for coarse-grained
soiís the larger California Bearing Ratio (CBR) mould is
used.
Slighí
s
oll r
ould
se
Rammer
1
V
es
Figure 3 1 Typical compaction
mould
and hand
rammer used incompaction tests

7/18/2019 Correl Soils Properties Carter&Bentley
http://slidepdf.com/reader/full/correl-soils-properties-carterbentley 51/136
D E N S IT Y
45
Table
3 6
C O M P A R I S O N
O F E Q U I P M E N T SIZES, N U M B E R O F
R A M M E R
B L O W S A ND
N U M B E R
O F
L A Y E R S
O F
SOIL USED
IN V A R I O U S
C O M P A C T I O N T ES TS . D I M E N S I O N S
d , f A N D h A N D
WEIGHT W ARE SHOWN IN FIGURE 3.1
Test
designarían
BS 1377:1975
Test
12
Test 12 (modified)
Test
13
Test 13 (m odified )
AASHTO
T145
TI
80
TI 80 (m odified)
Mould
volume
d
1.0
2.32
1.0
2.32
0.94
0.94
2.32
Mould
día d
( m m )
105
152
105
152
101.5
101.5
152
Mould
ht h
( mm)
1 1 5 . 5
127
1 1 5 . 5
127
1 1 6 . 4
116.4
127
Rammer
wt W
k g )
2.5
2.5
4.5
4.5
2.50
4.54
4.54
R a m m e r
ll
m m )
300
300
45 0
450
304.8
457.2
457.2
Number
of
layers
3
3
5
5
3
5
5
Blows
per
layer
27
62
27
62
25
25
56
The modified forras of the test use a CBR mould and are su i t ab le fo r coarser
soils.
differences exist between British and Ame r i can
S tandards ,
as in-
dicated
in
Table 3.6, which g ives mould
and
rammer s izes
for the
var ious
tests.
With sands a nd gravéis, th e ramm er tends to displace th e mater ia l
ra the r
t han
compací i t so that the densities obtained in the
compaction test
a re
unr ealisíically low when co mpa red wi th wha t
ca n
be achieved on site. To overeóme this, a v ibra t ing h am m e r can be
used
instead
of the
r am m er . V ib r a t io n
is
typically carried out
for 60
seconds
per
layer
und e r a
constant
forcé o f
30 40kg.
3.2.2 Typical
compacíed densities
The com pacted den sity achieved for a soil depends on the soil
type ,
its
mois íure
contení
and the compactive effort used. Table 3.7 shows
typical valúes of máximum
d ry
densi ty (MDD) and optimum
moisture coníení
fo r
soil classes, using
íh e
Unified classifícation
sysíem,for soils
compacíed
to A A SH TO or BS s tandard
compaction:
A A S H T O
T99
(5.51b
r a m m e r m e t h o d )
or BS
1377:1975 Test
12
(2.5kg ram m er m ethod) . The valúes given are b ased on typical valúes
given by Krebs and Walker (1971) and the U.S. A rm y Engineer
W a íe rways
Exper iment
S ta t ion (1960),
and on the
a u tho r s
ow n
experience. A similar set of valúes but r elated ío íhe A A SHT O soil
classifícaíion system, is given in Table 3.8. These a re based on íhe
above valúes
and the
re la t ionship between
the
A A SH TO
and
U nified
soil classifícation systems, and on va lúes sugge sted by G regg (1960).
I t should be noted that clean sands often show no clear o p t imum
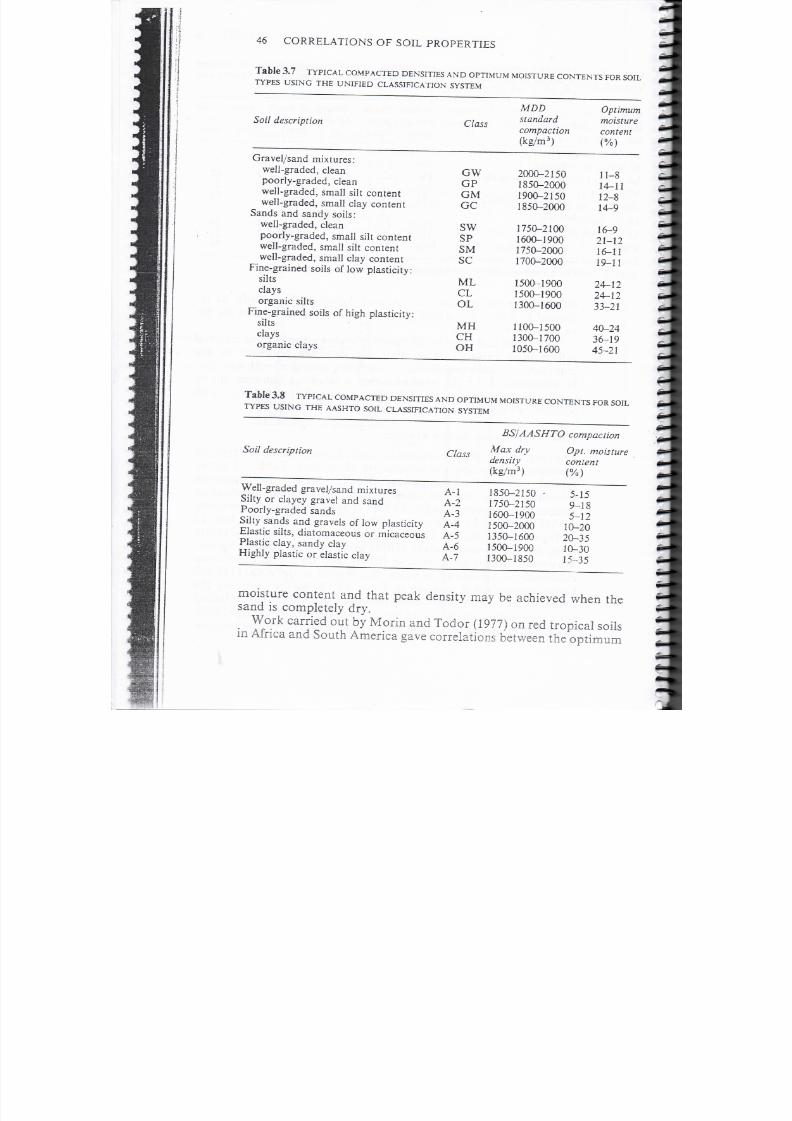
7/18/2019 Correl Soils Properties Carter&Bentley
http://slidepdf.com/reader/full/correl-soils-properties-carterbentley 52/136
4 6 CO RRELA TI O N S OF SOIL PRO PERTI ES
Table
3 7
T Y P I C A L C O M P A C T E D D E N S I T I E S
A N D
O P T I M U M M O I S T U R E C O N T E N T S
F O R
S O I L
TYPES
USING
THE UNIFIED CLASSIFICATION SYSTEM
Soil
description
Gravel/sand mixtures:
well-graded, clean
poorly-graded, clean
well-graded, small silí
content
well-graded, sm all clay co ntent
Sands
and
sandy
soils:
well-graded, clean
poorly-graded, small silt content
well-graded, small silt contení
well-graded, small clay content
Fine-grained soils o f l o w p last icity:
silís
clays
organic silís
Fine-grained soils of high plasticity:
silts
clays
organic clays
Class
GW
GP
G M
GC
SW
SP
SM
se
M L
CL
OL
MH
CH
OH
M D D
standard
compaction
(kg/m
3
)
2000 2150
1850-2000
1900-2150
1850-2000
1750-2100
1600-1900
1750-2000
1700-2000
1500-1900
1500-1900
1300-1600
1100-1500
1300-1700
1050-1600
Optimum
moisture
content
( )
11-8
14-11
12-8
14-9
16-9
21-12
16-11
19-11
24-12
24-12
33-21
40-24
36-19
45-21
Table 3 8 T Y P I C A L C O M P A C T E D D E N S IT IE S AND O P T IM U M M O I S T U R E C O N T E N T S FOR S O I L
TYPES USING THE AASHTO SOIL CLASSIFICATION SYSTEM
Soil description
Well-graded gravel/sand mixtures
Silty or
clayey gravel
and
sand
Poorly-graded sands
Silíy
sands
an d
gravéis
of
lo w
plasíicity
Elastic
silts diatomaceous or micaceous
Plástic
clay, sandy clay
Highly plasíic or elastic clay
Class
A -l
A-2
A-3
A-4
A-5
A-6
A-7
BSIAASHTO
Max dry
densiíy
(kg/m
3
)
1850-2150 •
1750-2150
1600-1900
1500-2000
1350-1600
1500-1900
1300-1850
compaction
p í moisture
contení
( )
5-15
9-18
5-12
10-20
20-35
10-30
15-35
moisture content and that peak densiíy may be achieved when íhe
sand
is
completely dry.
Work carried out by Morin and Todor (1977) on red tropical soils
;orrelations betvveen the opt imurn
n
África
and Sou th Am erica gave

7/18/2019 Correl Soils Properties Carter&Bentley
http://slidepdf.com/reader/full/correl-soils-properties-carterbentley 53/136
DE NS I T Y 47
4
Plástic limit -
(a)
Opíimum
moisture
contení -
(b)
Figure 3.2 Relationships of optimum moisíure contení wiíh
plástic
limií and with
áx u
dr y
density
for red
tropical soils
after
Morin
and Todor,
1977)
mois ture conten í
and
plasíic limií
and
be íween opí imum mois íure
conten í a nd m á x i m u m d ry densi íy as indicated in Figu re 3.2. M orin
and odor also produced a relaíionship beíween opíimum mo isíure
coníent
and íhe
perceníage
of
paríicles
f íner than 2¿um buí
íhis
showed too wide a scal ter to be of use and has noí been included.

7/18/2019 Correl Soils Properties Carter&Bentley
http://slidepdf.com/reader/full/correl-soils-properties-carterbentley 54/136
8 CORR ELATIONS OF SOIL PROPER TIES
1 55
6 8 10 12 U 16 18 20 22 24 26 28 30 32 34 36 38 40
Moisture
contení - of dry
w ight
Figure 3.3 Typical moisture-densüy curves modified
after
Woods and Liíehiser, 1938
and Joslin, 1959)
7/18/2019 Correl Soils Properties Carter&Bentley
http://slidepdf.com/reader/full/correl-soils-properties-carterbentley 55/136
DENSITY 49
3 3
Typical moisture density curves
Work
carried out by
W oods
and
Litehiser 1938)
in
Ohio indicated
tha t , fo r Ohio soils, nearly al l m oisture-d ensi ty curves
have
a
characteristic shape. On the basis of o ver 10,000 tests 26 typical
curves
were produced,
as
shown
in
Figure 3.3.
Use of the
curves
allows the m áxim um dry densi ty and op t imum m oisture content to be
estimated f rom a single po int on the curve, greatly reducing time and
eífort.
I t should be noted that the curves are plots of bulk densi ty ,
instead of the more usual dry density, against moisture content. The
inset
table gives íhe corresponding m áx im um dry density and
optimum moisture content
for
each curve. When used with rapid
mois ture
content determinations,
these
curves provide quick and
fairly accurate estimates. They have been found to be applicable in
many
áreas though minor
modifications
have sometimes been
necessary. Accuracy
is
improved
if the
moisture content
of the
test
specimen
is
cióse
to
optimum
and
preferably
o n the dry
rather
than
the wet side. The curves are not valid for unusual materials such as
uniformly graded sand, highly micaceous soils, diatomaceou s earth,
volcanic
soils
or
soils
in
which
the specific
gravity
of the
solids
diífers
greatly from 2.67.

7/18/2019 Correl Soils Properties Carter&Bentley
http://slidepdf.com/reader/full/correl-soils-properties-carterbentley 56/136
Chapter
PERMEABILITY
The coefncient of permeabil i ty is defíned as the quan t i t y of flow
through uni t área o f soil un de r a unit pressure g radient. T his assum es
a l inear reíationship between the pressure gradient and quan t i t y o f
f low, q,
which
is the
basis
fo r
Darcy s
l a w :
4J
where k is the coefficient of perm eabií i ty
A
is the
área
of flow
and i is the hyd raulic pressure gradient.
If the vo lume of f low q is divided by the área A
then
the veloc ity of flow
v i s obíained and Equa t ion (4.1) can be w ri t ten :
*-?
i
(4.2)
From this,
it can be
seen thaí
th e c oefficient of
perm eabil i ty
can be
thought
of as the
veíociíy
of flow
that results f rom
a
unit pressure
gradient. Since pressure is usually measured as head o f w ater an d
pressure
is
loss
o f
head
per
unit distance, i typically
has the
dimensions m/m so thaí
k
has the units of veíociíy; typically m/s
Ho wev er, i í sho uld be remem bered that área A is the to tal
área
of soil
being considered
but
parí
o f
íhis
área
will
be
occupied
by solid
partióles so íhe
área
of flow wilí be less. This means íhaí veíociíy u is
only a no íional valué, used for calculaí ing vo lum es of f low, and íhe
true average veíociíy of flow u will be greater:
l
e
n
where
e
an d
n
are the
vo ids rat io
and
porosi ty
of íhe
so il, respectively.
T he
permeabil i ty
o f a
soil
is
s írongly iníluenced
by its
mac r o-
50

7/18/2019 Correl Soils Properties Carter&Bentley
http://slidepdf.com/reader/full/correl-soils-properties-carterbentley 57/136
P E R M E A B I L I T Y 51
s t r uc t u r e : clays coníaining físsures or fine bands of sand will have
permeabilities which are many times that of the clay material itself.
Also,
since
flow
tends
to follow th e
line
of
least resisíance, stratiñ ed
soils
often
have horizontal permeabilit ies which are m a n y times the
vertical permeability and the overall perm eabil ity
will
be approxi-
mately equal to the horizontal permeability.
Because
of the sm all size
of labor atory specimens
and the w ay they are
obtained
and
prepared,
large-scale
features are absent and test results do not
give
a t rue
indication
of fíeld
valúes
in
soils w ith
a
pronounced
macro-structure.
Moreover,
laboratory tests usually constrain w ater
to flow
vertically
th rough
the specimen whereas the horizontal permeability
m ay
be
much greater , and henee of
overriding
importance so far as
site
conditions
are
concerned. Field tests overeóme
these shortcoming,
bu t , since íhe pattern of w a ter flow from a well can
only
be guessed,
iníerpretation of íhe test results is
diííícuíí
and uncerta in. Thus, one
set of
problems
is exchanged fo r
another
4 1 TYPICAL VALÚES
The íypical range of valúes encounfered is indicaíed by
Table
4.1,
which is based on
informalion
originally presented by Casagrande
and
Fad um 1940). Superimposed
on íhe
charí
are
íypical valúes
fo r
compacíed soils,
classifíed by íhe U nifíed
sysíem. These
re late to
soils
compacíed using
the heavy
compaction
slandard:
AASHTO
T-180
lOlb r a mmer ) or BS 1377:1975, Tesí 13 4.5kg rammer). Typical
permeabiliíy valúes for highw ay matería ls , suggested by Krebs and
Walker 1971),
are
given
in
Table 4.2. A ddiíional
informaíion on the
influence of voids ratio in differení soil types is given by Mitcheíl
1976).
4 2 PERMEABILITY AND GRADING
A
theoreíical
equaíion relaíing the coefíícient of permeability ío íh e
soil and permeaní properíies was
developed
by
Táylor 1948). This
gave:
e
wfaere
k
is the
coefficient
of perme ability
D
s is
some effective paríicle diameíer

7/18/2019 Correl Soils Properties Carter&Bentley
http://slidepdf.com/reader/full/correl-soils-properties-carterbentley 58/136
Table
4 .1
T Y P I C A L
P E R M E A B I L IT Y V A L Ú E S
F O R
S O I L S
Coefficient of
permeab i l i ty
lo g scale)
Drainage
c o n d i t i o n s :
Typical soil
g roups:
10
II 0-10 1Q 9
1 8 io - 7
i .
10
6
I
i o 5
I
m /s
109
10
10
7
1 0
10
1 0
cm/s
10
1
f t / s
io-
3
i
10
2
9
10 10
6
10 ~ 5
10
10
MH
MC-CL
Practically
i mp e r me a b l e
Very low
L ow
M é d i u m
Pract ica l ly
im per m eab l e
Poor
G C — • G M —
CH SC
S M
SM-SC
SW-K
SP->
Soil types:
H o m o g en eo u s
c lays
be low
the zone of
w e a t h e r i n g
Silts,
fine sands, sil ty sands ,
glacial t i l l , strat i fied c lays
Cl ean
sand
a n d
grave l
Fissured and weathered clays and c lays
modified by the eflects of vege ta t ion
Note:
th e
rrow dj cent
lo
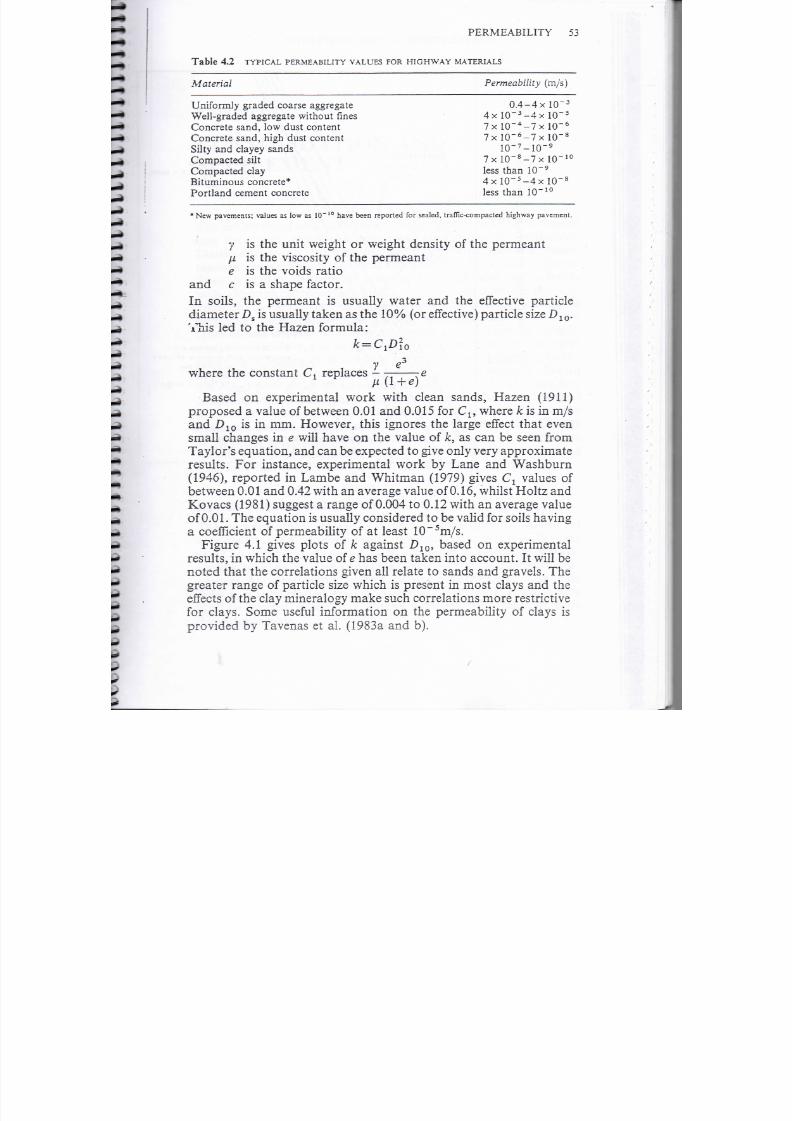
7/18/2019 Correl Soils Properties Carter&Bentley
http://slidepdf.com/reader/full/correl-soils-properties-carterbentley 59/136
P E R M E A B I L I T Y
53
ble
4 2
T Y P I C A L P E R M E A B I L I T Y V A L Ú E S
F O R H I G H W A Y
M A T E R I A L S
Material
Permeability
(m/s)
niformly graded coarse aggregate 0 .4-4
x 10 ~
3
Well-graded aggregate w i t h o u t fines 4x 10~3-4x 1 0 ~
5
Concrete sand,
lo w
dust content
7x 10~
4
-7x
1 0 ~
6
Concrete
sand, high dus t c on te nt 7 x l O ~6 - 7 x l O ~ 8
Silty
an d
clayey
sands
10~7-10~9
Compactad silí 7x 10 8-7x 1 0 ~1 0
Compacted clay less tha n 1 0 ~9
Bi t u mi nou s concrete*
4x
10~5-4x 10 ~8
Portland cemen t concr ete less th an 1 0 ~1 0
* New pavements ; va lúes as lo w as
1 0 ~1 0
have been reported fo r sealed,
traf l íc-compacted
h ig hw a y p a v e m e n t .
y is the uni t we igh t or weight density of the permeant
\i
is the
viscosity
of the
permeant
e is the void s ratio
and c is a shape factor.
In soils, the permeant is usual ly water and the efíective particle
d iamete r D s
is
usually taken
as the 10 (or eífective)
particle size
D
10
.
Yhis
led to the
Hazen fo rmula :
y
e3
where the constant C, repíaces - —
Based
on
experimental work wi th
clean
sands, Hazen (1911)
proposed a valué of betw een 0.01 and 0.015 for C15 where k is in m/s
and Z > 1 0 is in m m . However, this ignores the
large
efíect that even
small
changes
in
e will have
on the
valué
of
k
as can be
seen from
Taylor's
equat ion, and can be expected to give only very appro ximate
resuíts. For instance, experimental work by Lañe and W a s h b u r n
(1946), reporíed in Lambe and Wh itma n (1979) gives
l
valúes of
beíween 0.01
and
0.42 wit h
an
average valué
of
0.16, w hils í Hol tz
and
Kovacs (1981) suggesí a range of 0.004 ío 0.12 with an average valué
of 0.01.
The
equat ion
is
usu aíly considered
ío be
valid
for
soils hav ing
a coefficient of permeability of at
least
10~
5
m/s.
Figure 4.1 gives ploís of k againsí D
10
, based on experimental
results , in w hich the valué
o í e
has been taken into acc ou nt. It
will
be
noted
tha t
the
correlaíions given all relate
to
sands
and
gravéis.
T he
greaíer ran ge of particle size wh ich is present in m ost clays and íhe
effecís
of the clay mineralogy m ake such correlations m ore resíricíive
fo r
clays. Some useful
informat ion
on the permeabil i íy of clays is
provided
by Tavenas et al. (1983a and b),

7/18/2019 Correl Soils Properties Carter&Bentley
http://slidepdf.com/reader/full/correl-soils-properties-carterbentley 60/136
5 CORRELATIONS
OF SOIL PROPERTIES
0.05
w
X
E
o.01
O.OO5
o
c
o
© O OO1
o
ü
O O O O 5
O O O O 1
Burmister
Cu= 1.5, e = 0.75
Cu
= 3, e = 0.7
Mansur
Mississippi
ríver
sands
Cu
=2 - 3
e = 0.9 - 0.6 ,
- field tests
- Icb
tests,
Í
V
Hazen
formula
Limited to D-0= 0.1 — 3mm,
Cu<5
USNavy
Correlation oí lab test valúes
of various materials
Cu
= 2 — 1 2
íower
Cu valúes are
associated with higher e vaiues )
Liirited to D10/Dg less than
1.4
D1O/DS>1.4 cr C
u
?12
lie in a
tange
of
tower permeabilities
NOTE: correlations
shown are for remolded
compacted
sands and sand-grave mixtures
Cu = cc«í í ¡cieni oí
ufiiíOírnity
e
= vo ids r a t i o
O.1
0 5 1
Grain size, D10 -
mm
10
Figure 4 1 The
permeability
of sands and
gravéis

7/18/2019 Correl Soils Properties Carter&Bentley
http://slidepdf.com/reader/full/correl-soils-properties-carterbentley 61/136
Chapter
5
CONSOLID TION ND
SETTLEMENT
The
settlement
of
soils
in
response
to
loading
can be
broadly
divided
into
tw o
types: elastic settlement
and
time-dependent settlement.
Elastic
settlements
are the simplest to
deal
with; they
are
instan-
taneous, recoverable,
and can be
calculated
from
linear elastic theory .
Time-dependent settlements
occur in both
granular
and
cohesive
soils,
although
the response time for gran ular soils is usua lly sh ort. In
addition
to
being time-dependent, their response
to
loading
is
non-linear
and deformations are only partially
recoverable.
Two
types of time-dependent settlement are recognised. Primary consoli-
dation results from the
squeezing
out of water from the soil voids
under
th e influence of
excess pore w ate r pressures, g ene rated
by the
applied loading. Secondary compression occurs essentially
after
all
the
excess
pore
pressures have been
dissipated
that
is ,
after
primary
consolidation
is
substantially com plete,
but the
mechanisms
involved
are not fully understood. The
settlement
of
granular soils
is
more
difficult to
predict with
any
accu racy, largely because
o f the difficulty
of
obtaining and testing und isturb ed soil samples, and settlements are
usually estimated
by
indirect methods.
Alteraatively,
píate
bearing
tests
m ay be
used
but
their results
are difíicult to
interpret.
5 1
COMPRESSIBILITY
OF CLAYS
The compressibility of
clays
is
usually
measured by means of
oedometer consolidom eter) tests,
or
similar method s see Tave nas
and
Leroueil 1987). Results
may be
expressed
in a
number
of ways,
leading
to a,
sometimes
conftising,
variety
of
compressibility
par-
ameters. As indicated in F igure 5.1, either am pie thickn ess, h or voids
ratio
e may be
plotted
againsí
consolidation
pressure, p which may
itself be
plotted either
ío a natural scale or,
more usually,
to a
logarithmic
scale.
55

7/18/2019 Correl Soils Properties Carter&Bentley
http://slidepdf.com/reader/full/correl-soils-properties-carterbentley 62/136
56
CORRELATIONS OF SOÍL
PROPERTIES
V i r g i n
c omp r e s s i o n c u r v e
O
O
2 4 6 8 1O
o
Consolldation prossur* , p MN/m
a)
OverconsoJidation
pressure
= C
b.
O
Unloading
Recompression
O 01 O t
1 10
Consoüdation prsssura, p - MN/m
í
Figure
5 1
Typical
ploís of compressibiliíy t st
results
5.1.1 The compressibility parameíers
The process of compression on a soil can be usefully ill-.otrated by
means of íhe
model soil sample
as illusírated in Pigure 5.2.
Recognising thaí compression íakes
place by a
reduction
in
the
volume of voids with virtually no change in íhe volume of íhe solid
paríicles compressibiliíy was originally defíned by íhe eoeffkie í of
compressibiliíy
a
which
is íhe
change
in
voids
ratio per
unií increase
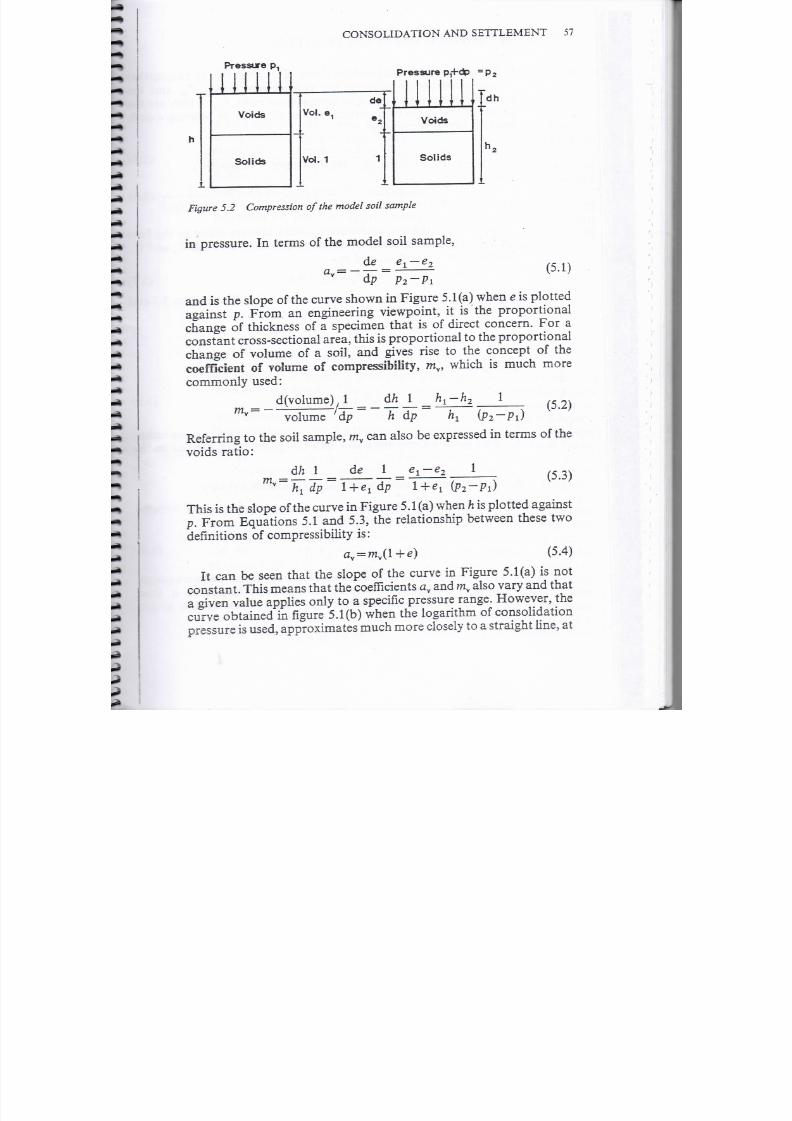
7/18/2019 Correl Soils Properties Carter&Bentley
http://slidepdf.com/reader/full/correl-soils-properties-carterbentley 63/136
CONSOLIDATION A ND SETTLEMENT 57
Pressure p1
l l lí
Voids
Solías
Pressure
Pffdp
=
de
Vol e
Vol 1
Yoids
oii s
dh
Figure 5.2 Compression of the
model soil
sample
in
pressure.
In terms of the
model soil
sample,
de e
e >
y ~™~
P2~Pi
5.1)
and is the
slope
of the
curve shown
in Figure
5.1
a)
when e
is
plotted
against p . From an
engineering
viewpoint, it is the proportional
change of thickness of a specimen
that
is of direct concern. For a
constant
cross-sectional área
this is
proportional
to the
proportional
change
of volume of a soil an d gives rise to the concept of the
coefíiclenl
of
volunie
of
compressibility
m
v
,
which is much more
commonly used:
d volume) 1 dh 1
v volunie dp h áp
Refemng
to the soil sample, m
v
can also be expressed in terms of the
voids
ratio:
dh 1
1
5.3)
This is the slope of íhe curv e in Figure 5.1 a)
when
h
is plotted against
p.
From
Equations
5.1 and
5.3,
th e
relation ship between these
tw o
deímitions of
com pressibility
is :
av
=
my l+e) 5.4)
It can be
seen thaí
the
slope
of the
curve
in
Figure
5.1 a) is not
con stant. This m eans that
th e coefficients
a
v an d
m
v
also var y
and
that
a
given
valué applies only to a
specific
pressure range. However, the
curve obtained in
figure
5.1 b) when the logarithm of consolidation
pressure is used, approxim aíes m uch m ore closely ío a
straight line,
at

7/18/2019 Correl Soils Properties Carter&Bentley
http://slidepdf.com/reader/full/correl-soils-properties-carterbentley 64/136
5 8 C O R R E L A T I O N S
O F
SOIL
P R O P E R T I E S
least
on the
v irgin comp ression curv e. This gives
rise to two fur ther
measures of compressibility, the
compression
índex, C
c
, and th e
modifíed
compression
índex or
compression ratio,
CC£, which are the
slopes of the
virgin compression cu rves obtained
by
plotting
e
or
h,
respectively, against
l o g p :
áe
dh
d logp) logpa-logp logípa/pi
de 1 e -e 1
C
C£
-
-
T
/d logp)-
~
1 Iog p
2
/
Pl
)
5.5)
5.6)
Note
that,
for these
evaluations, logarithms
are
taken
to the
base
10. From equations 5.5 and 5.6, íhe relationship between C
c
and C
ce
foliows that between
a
v
and
m
v
:
C^CJl+eJ 5.7)
O f
th e
two,
c is
much m ore comm only used. From
equations 5.3 and
5.5, it can be relaíed to mv:
1
v
givmg
5.8)
For the
com pression parí
of the
curve,
the
terms
recompression
índex, ,
C
r5
and modiíled recompresslon Index,
C
r£
, are used,
defined
in the
same ways as
Cc
and C
C£
, respectively.
5.1.2
Setíleinení calcóla
tions
using consolida
tion theory
Returning
to íhe
basic defíniíion
of the
coefficient
of volume
compressibility, given
in
equ ation 5.2:
áh 1
iri
h áp
5.9)
li can be
seen t ha t, once
my is
k n o w n
for a
particular pressure range,
th e compression,
dh,
of a
layer
of íhickness, h, due to a
load
increment, dp,
can be calculated by simply
íurning
th e above
equation
a round:
áh

7/18/2019 Correl Soils Properties Carter&Bentley
http://slidepdf.com/reader/full/correl-soils-properties-carterbentley 65/136
CONSOLIDATION A N D SETTLEMENT 59
since dh is normally thoughí of as íhe setílement, p and áh is the
applied pressure increase,
< j
this becomes:
p
= Ham,
(5.10)
where
specimen íhickness,
h
is now replaced by íhickness,
H
of
íhe
compressible síraíum. The
average valué
of a
across
a
compressible
layer, due lo some applied loading, is usually calculaíed using
elaslicity theory. Allhough nol strictly valid
fo r soils, ií gives
sufficienlly
acc uraíe valúes. Selílemenl
is Ihen
oblained using consoli-
daíion theo ry by w ay of Eq uatio n 5.10.
W here valúes o f
C
c are obtained, m
v
valúes may be calculated from
Equation 5.8, using
th e appropriale
valúes
of
consolidaíion pressure
and
voids
ratio. Alternaíively, Equalions 5.8 and
5.10
may be
combined and seíílemenl calculated direcíly from
C
c valúes:
Iog(p 2/Pi)
l e p-
givmg
= C
l e
5.1.3 Settleoiení
calculations
using elasticity theory
An alterna
ti ve approa ch is to calcúlate d isplacem ents (seíílements)
directly using elasticiíy the ory , thus reducing
t h e tw o
sepárate stages
in
th e
seítlement calculation
ío one, and
obviaíing
the
need
to
calcúlate average valúes
of
consolidaíion pressure across
soil layers.
Numerous solutions, for
both
síresses and displacements, have been
produced,
man y
of wh ich ha ve been
presented
by
Poulos
and Da
vis
(1974).
The
problem
wiíh
usin g elastic soluíions
ío
calculaíe seíílernenís
is
thaí ií requires the evaluation of Young's m odulus , E and Poisson s
raíio, v, neither of which are
measured,
or are strictly meaningful, fo r
soil
consolidaíion
problems. Considering
Equation
5.9, since
the
raíio áh/h can be
íhoughí
of as a
sírain,
m y is sírain/síress,
w iíh units
I/stress; íypically
m
2
/kN
or m2/MN. Thus, ií is by defíniíion akin ío
íh e reciprocal of Young's modulus , £, and whereas E can be
envisaged simplisíically as íhe síress req uired ío do uble íhe length o f
an object, mv can be envisaged as an área of soil wh ich,
if
subjecíed to
a
unit load,
will
jus t disappear
Of course,
such absurdiíies
do noí
occur
in
realiíy because
íhe relationships are not
valid
fo r íhese
extremes. Addiíionally,
íhe
relationship beíween E
and
mv
is not a
simple
reciprocal
one because E is defíned for a specirnen wiíh
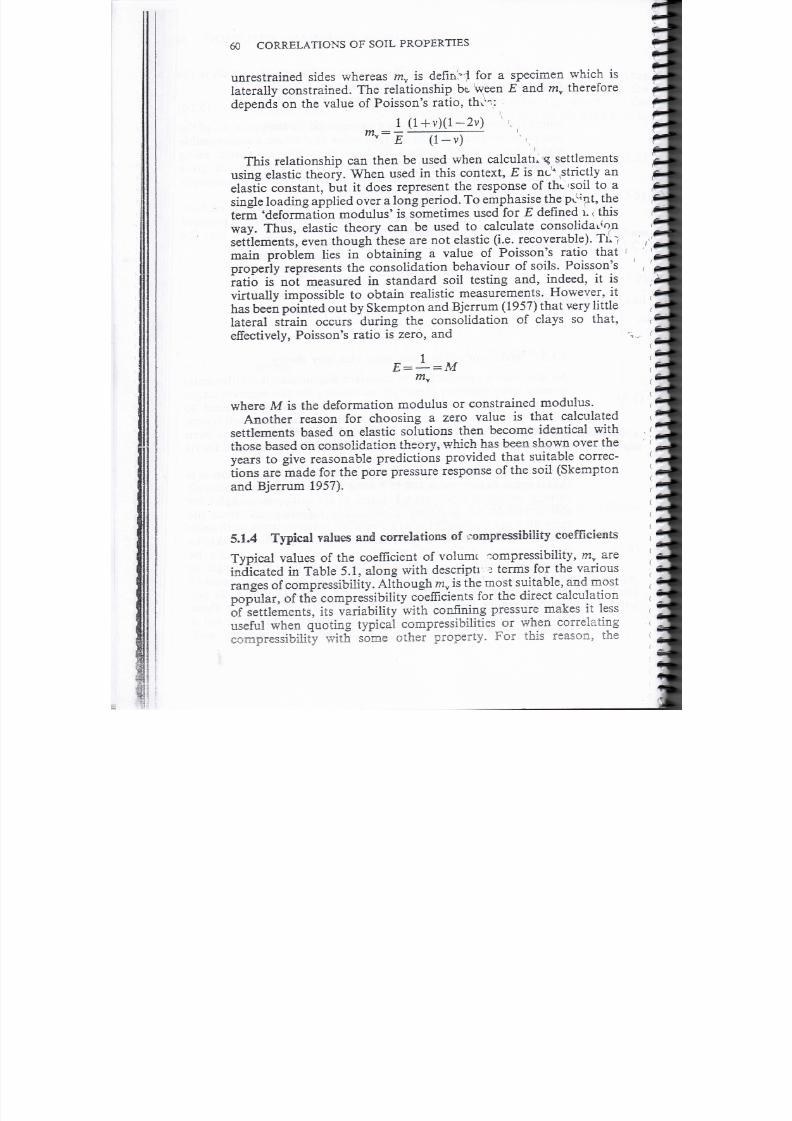
7/18/2019 Correl Soils Properties Carter&Bentley
http://slidepdf.com/reader/full/correl-soils-properties-carterbentley 66/136
60
CORRELATIONS OF SOIL PROPERTIES
unrestrained sides whereas m
v
is
definH
for a
specimen which
is
laterally constrained. The relationship
bt
ween and
m
y therefore
depends on the valué of Poisson s ratio, t h \ . > £ \
1 (l + v ) ( l- 2 v )
-
This
relationship can then be used when calcúlate lg settlem ents
using
elastic
theory.
When used in this context, is nc>
^strictly
an
elastic constant,
but it
does represent
the
response
of
thc soil
to a
single loading applied over a long
period.
To emphasise the p¿*nt, the
term deform ation m odulus is sometimes used for defined L this
way. Thus, eíastic theory
can be
used
to
calcúlate
consolidaron
settlem ents, even thoug h these are not elastic (i.e. recoverable). T¿ 7
main problem lies in obtaining a valué of Poisson s ratio that
properly represents the consolidation behaviour of soils. Poisson s
ratio is not m easured in standard soil testing an d, indeed, it is
virtually im possible to obtain realistic m easure m ents. Howev er, it
has been po inted out by Skem pton and Bjerrum (1 957) that very little
lateral
strain
occurs
during the
consolidaíion
of clays so
that,
efíectively, Poisson s ratio is zero, and
•-,-;—a
where M is the defonnaíion m odulus or constrained m odulus.
Another reason
fo r
choosing
a
zero valué
is
that calculated
seítlem ents based on elastic solutions then becom e identical w iíh
those
based on consolidaíion íheory, which has been shown over the
years to give reasonable predictions provided that suitable correc-
tions are
m ade
for the
pore pressure response
o f the
soil (Skem pton
and Bjerrum 1957).
5 1 4 Typical
v alaes and
correlatioos
of eom pressibiüty
eoeffkients
Typical valúes of the coefficient of
volumc
com pressibiliíy, mv are
indicated in
Table
5.1, along with
descripti
?
íerms
for the
various
ranges of com pressibility. Althoug h m y is the m ost suiíable, and m ost
popular, of the
com pressibility coefficients
for the
direct
calculation
of settlem ents,
its
variabiiity with
confining
pressure m akes
it
less
useful
when
quoting typical conipressibilities
or
when correlating
compressibñity with some other property. For íhis reason, the
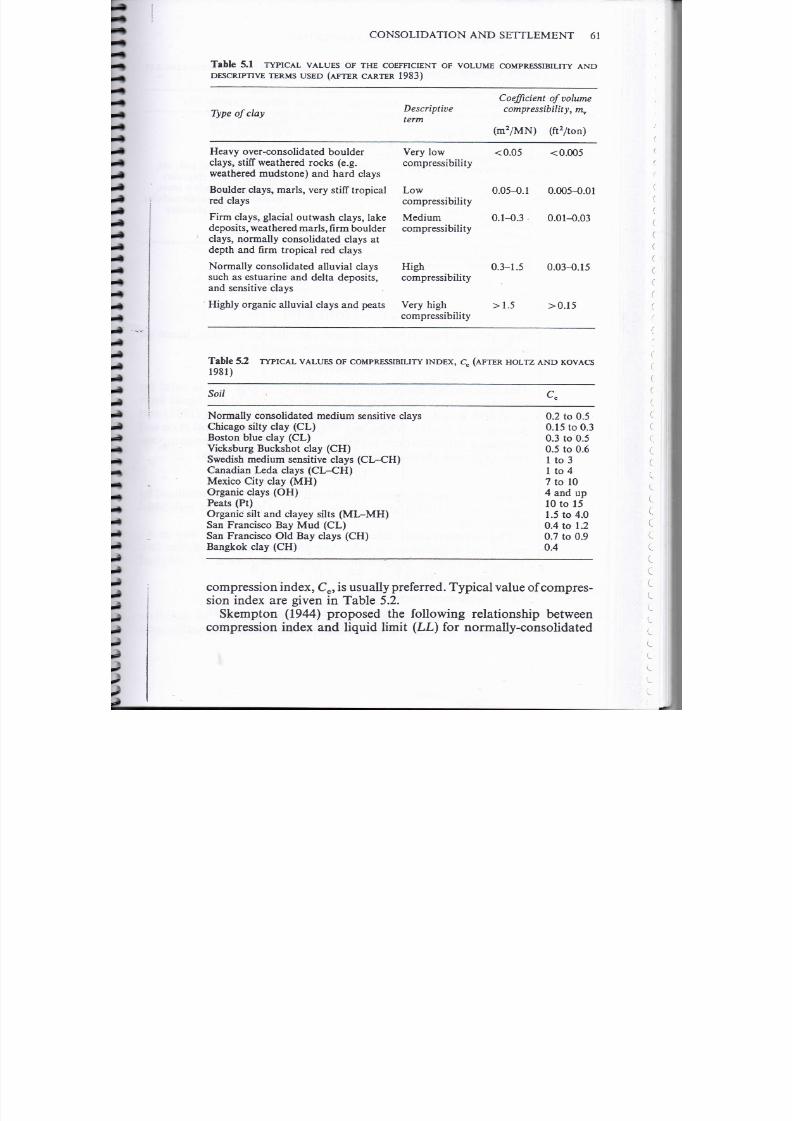
7/18/2019 Correl Soils Properties Carter&Bentley
http://slidepdf.com/reader/full/correl-soils-properties-carterbentley 67/136
CONSOLIDATION AND SETTLEMENT 61
Table
5 1
T Y P I C L
V L Ú E S
O F T H E
C O E F F I C I E N T
O F
V O L U M E C O M P R E S S I B I L I T Y
A N D
DES CRIP TIVE
T E R M S
U S E D
A F T E R C Á R T E R 1 98 3)
Type o f clay
Descriptive
t erm
Coefficient o fvolume
compressíbili ty, /nv
m
2
/MN)
f t
2
/ t o n )
H e a v y
over-consolidated
boulder
clays, stiff weathered rocks e.g.
weathered mudstone)
and hard
clays
Boulder clays, marls, very stiff tropical
red
clays
Firm
clays, glacial outwash clays,
lake
deposits, weathered marls, firm boulder
clays,
normally
Consolidated clays
at
depth and firm tropical red clays
N ormally Consolidated alluv ial clays
such as estuarine and delta deposits,
and sensitivo
clays
Highly organic alluvial clays and peats
Very lo w
compressibility
L ow
compressibility
M é d i u m
compressibility
High
compressibili ty
Very
high
compressibility
<0.05
0.3-1.5
< 0.005
0.05-0.1
0.005-0.01
0.1-0.3 0.01-0.03
0.03-0.15
>0.15
Table
5.2
1981)
T Y P IC A L V A L Ú E S
O F
C O M P R E SS IB IL IT Y I N D E X , Cc A F T E R H O L T Z
A N D
K O V A C S
Soil
Normally Consolidated médium sensitivo clays
Chicago silty clay CL)
Boston blue clay CL)
Vicksburg Bucksho t clay CH )
Swedish médium sensitive clays
CL-CH)
Canadian
Leda clays
CL-CH)
México City clay M H )
O rganic clays O H )
Peats Pí)
Organic silt
and
clayey
silts
ML-MH)
San Francisco Bay Mud
CL)
Sa n Francisco Oíd Bay clays CH )
Bangkok clay CH )
0.2 to 0.5
0.15 to 0.3
0.3 to 0.5
0.5 to 0.6
1
t o3
1 to4
7to 1 0
4 and up
10tol5
1.5 to 4.0
0.4 to 1.2
0.7 ío 0.9
0.4
compression Ín dex,
C
c
,
is
usually preferred. T ypical v alué
of
com pres-
sion
índex
are
given
in Table 5.2.
Skempton 1944) proposed th e
folio wi n g
relationship between
compression
índex
and liquid limit
LL)
fo r normally-consolidated

7/18/2019 Correl Soils Properties Carter&Bentley
http://slidepdf.com/reader/full/correl-soils-properties-carterbentley 68/136
62 CORRELATIONS OF
SOIL
PROPERTIES
Table 5 3 S O M E P U B L I S H E D C O R R E L A T I O N S F O R C O M P R E S S IO N Í N D I C E S A F T E R A Z O U Z E T
A L .
1976)
Equation
Regions of
applicability
Cc=0.007
(LL-7)
Ce,=0.208e0+0.0083
Cc
= 17. 66xKT5 > v j
Cc=1.15(e0-0.35)
Cc=0.30(e0-0.27)
=
l.15x10
2
Cc
= 0.75(e0-0.50)
€« = 0.1566
C = O . O l H >
3 wn-1.35x10
-1
Remoulded
clays
Chicago
clays
Chicago clays
All clays
Inorganic,
cohesive
soil; silt,
some clay; silty clay; clay
Organic
soils-meadow
mats,
peats, and organic silt and clay
Soils of very low
plasticity
All clays
Chicago
clays
As
summarised by A zzouz, Krizek, and Corotis (1976).
Note: w0
=
natural water
contení.
clays:
C =
0.007(LL-10).
Terzaghi and Peck (1967) proposed a similar relationship, based on
research with clays of low and médium sensitivity:
CC = 0.009(LL-10).
This
relationship
has a
reliability range
of
+30
and is valid for
inorganic clays
of
sensitivity
up to 4
(see Chap ter
6) and
liquid
limit
up to 100. Based on the work of Skempton and Northey (1952) and
Roscoe et al (1958), W ro th and Wood (1978) used critical sta te soil
niechanics
considerations
to deduce a relationship between cornpres-
sion
índex and
plasticity índex (PI)
for
remoulded clays:
where
Gs is the
specific
gravity of the soil solids. Table 5.3 produced by
Azzouz
et al (1976) gives
a
summary
of a
number
of
published
correlations.
The recompression índex, C
r
, is
defined
in the same way as C
c
except tha t it applies to the unlo,?ding phase of the cons M idation test.
Typical valúes of
C
r
range from 0)15 to 0 .35 (Roscoe ei
¡ I
1958) and
are often
assumed
to be
5-10
of
Cc.
5 5 ettlement
corrections
If the results of oedometer tests are used directly to calcúlate
settlements, the valúes obtained tend to ov er-estimate the settlements
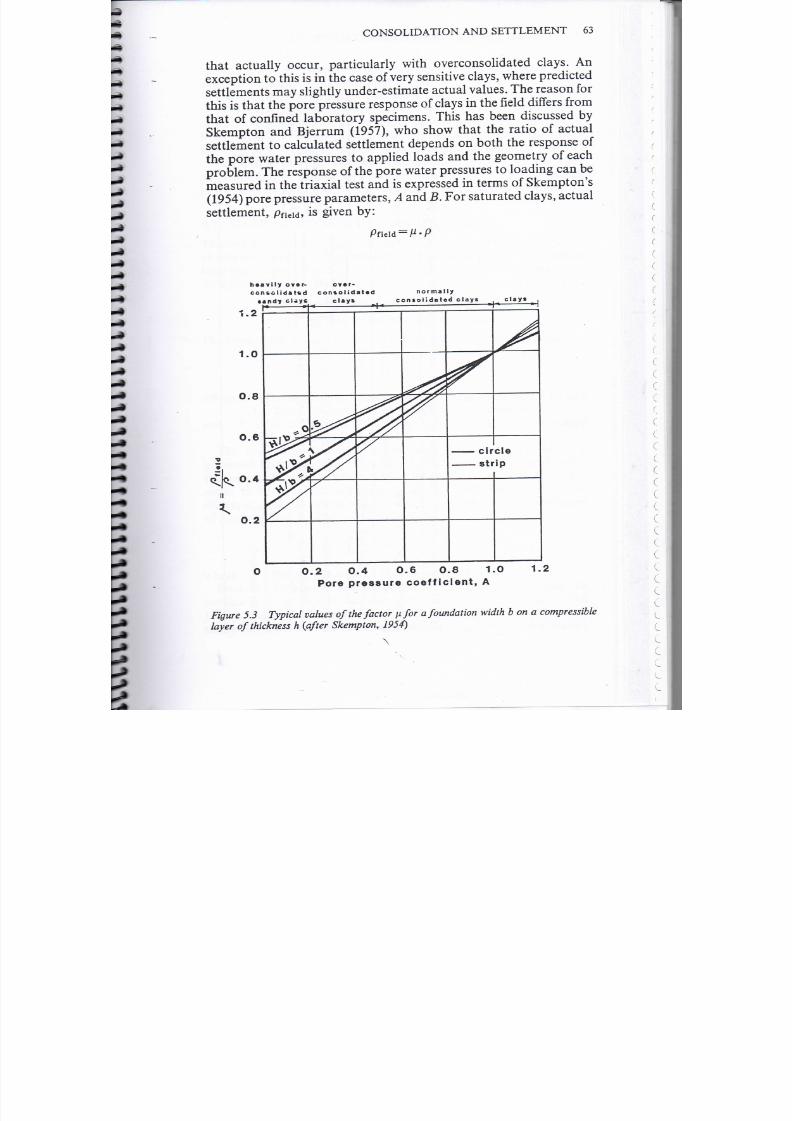
7/18/2019 Correl Soils Properties Carter&Bentley
http://slidepdf.com/reader/full/correl-soils-properties-carterbentley 69/136
CONSOLIDATION
AND
SETTLEMENT
63
that actually occur, particularly wi th
overconsolidated
clays. An
exception
to
this
is in the
case
of very
se nsitive clays, wh ere predicted
settlements m ay slightly und er-estim ate actual valúe s. Th e reason for
this is that the p ore pressure response of ciays in the fíeld differs from
that of
confined laboratory specimens. This
has
been discussed
by
Skempton
and
Bjerrum (1957),
w ho
show that
th e
ratio
of
actual
settlement to calculated settlement depends on both th e response of
th e
pore water pressures
to
applied
loads and the
geom etry
of
each
problem.
The
response
of the
pore w ater pressures
to
loading
can be
measured in the triaxial test and is expressed in terms of Skem pton s
(1954) pore pressure
parameters A
and
B
For saturated clays, actual
settlement
p f ie id, is given by:
h«av¡ly ovar- over -
een so I ¡ di
f d onsolidated normally
•nd? clays
clayí consolida t d
clays
clay
1 2
0 2 0 4 0 6 0 8 1 0 1 2
Pore pressure
coefficient,
Figure
5.3
Typical
valúes of the factor
\ifor afoundaíion
width b on a compressible
layer of
thickness
h afíer
Skempton, 1954)
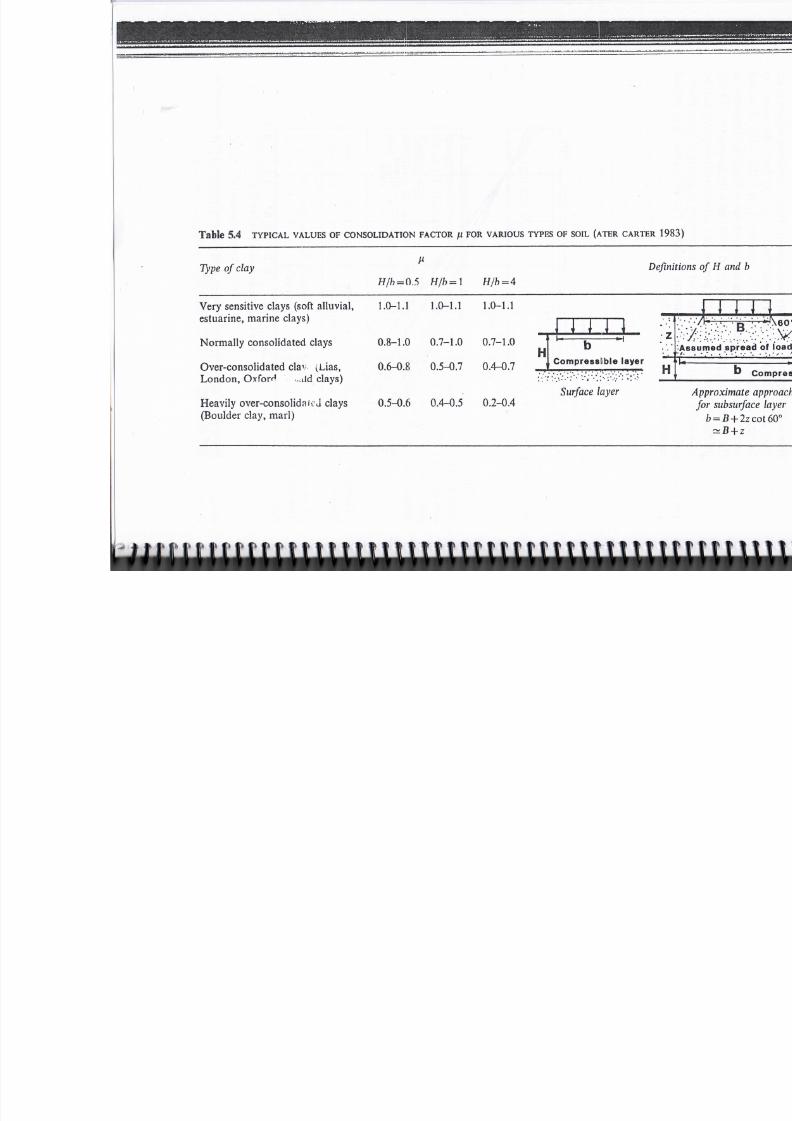
7/18/2019 Correl Soils Properties Carter&Bentley
http://slidepdf.com/reader/full/correl-soils-properties-carterbentley 70/136
Table 5 4 T Y P I C A L V A L Ú E S
O F
C O N S O L I D A T I O N F A C T O R
n F O R
V A R I O U S T Y P E S
O F
S O IL A T E R C Á R T E R 1983
Ty pe o f clay
Definiti
=
0 5
H b=l
V e r y
sensitive clays
soft al luvial ,
e s t u a r i n e , ma r i n e c l a y s )
N o r m a l l y
Consol idated c lays
O v e r -con so l id ate d clav
Lias,
L o n d o n , O x f o r H , ,i ld clays)
H e a v i l y over-consol idaí v-J
clays
B o uld e r c lay , m ar l )
1.0-1.1 1.0-1.1 1.0-1.1
0.8-1.0 0.7-1.0 0.7-1.0
0.6-0.8
0.5-0.7 0.4-0.7
0.5-0.6 0.4-0.5 0.2-0.4
1
1
j
b
tompresslble layer
Surface
la yer
•
•

7/18/2019 Correl Soils Properties Carter&Bentley
http://slidepdf.com/reader/full/correl-soils-properties-carterbentley 71/136
CONSOLIDATION AND SETTLEMENT 65
where p is the
calculated oedometer settlement
and
¡
is a
factor which
depends on the pore pressure parameter.
The distr ibution of
stresses across
a
layer
of
soil depends
on the
ratio
of
w id th , b of
a foundat ion to
thickness, H
of the
layer. Valúes
of
^
can be
obtained
for
given valúes
o f
pore p ressure parameter,
A
from
Figure 5.3. Valúes
of
parameter
A are not
normally measured
in
the laboratory tests commonly used for foundation design but they
are found to
depend
on the
consolidation history
of the clay,
particularly
the
degree
of overconsolidation. For
most practical
purposes
it is suffícient to use
valúes
of \i
selected from Table 5.4.
5.2
RATE
OF CONSOLIDATION OF
CLAYS
The
rate
of
set t lement
of a
saturate d soil
is
expressed
by the
coefflcient
of
consolidation,
c
v
.
Theoretically, consolidation takes
an
infínitely
long time to be completed and it is usual to calcúlate the time taken
for a
given degree
of
cons olidation, U
to
occur, w here U
is defined
by :
Consolidation
settlement after a given time,
r
Final consolidation settlement
The
time,
í for a
g iven degree
of
consolidation
to
occur
is
given
b y:
where d is the máximum length of the drainage path
equal
to half
the
layer thickness
for
drainage
top and
bottom)
and 7 ^ , is called the basic time facto r. Valúes of T
v
for various valúes
of U are given in Table 5.5.
The
rate
of
settlement
of a
soil,
an d
henee
th e
valué
of cv, is
governed
by two
factors:
th e
amount
of
water
to be
squeezed
out of
th e
soil
and the rate a t
w hich that water
can flow
out.
The
amount
of
water to be squeezed out depends on the coeñlcient of compress-
ibility,
mv,
and the
rate
at
which
it
will
flow
depends
on the
coefficient
of
permeability,
k.
The relationship between
c
v
,
m
v
and
k
is :
m
v
* v /
W
w
where y
w
is the weight density unit weight) of water .
Because
of the
wide range
of
permeabilities that exist
in
soils,
th e
coefficient of
consolidation
can itself
vary widely, from
less
than
Im2/yr
for
clays
of low
permeability
to
1000m
2
/yr
or
more
for
very
sandy clays, fissured clays and w eathered rocks. Some typical valúes

7/18/2019 Correl Soils Properties Carter&Bentley
http://slidepdf.com/reader/full/correl-soils-properties-carterbentley 72/136
A n y p ressure d i s t r i bu t ion ,
dra inage
t o p a nd
bo t tom
Decrea sing pressure, drain age
a t
bo t tom on ly
Table
r r
0.1
0.2
0.3
0.4
0.5
0.6
0.7
0.8
0.9
5.5 V A L Ú E S OF
TIME
Casel
0.008
0.031
0.071
0.126
0.197
0.287
0.403
0.567
0.848
T ,
Case
2
0.047
0.100
0.158
0.221
0.294
0.383
0.500
0.665
0.940
:
'
F A C T O R , Tv
• •
J
Drainage condit ions an d pressure distrib
Case
3
Casel Case
2
0003 . . - . - . . - . ; • - . . .
• •
: : • • •
: • : • • .
:: :•.••::••
- 6 ií 4 < « < > s í í? s X s a i « S ^ i » » < > i x .
0.009
0.024
0.048
0.092
0.160
0.271
0.440
0.720 ; . . ' • . i . ; . : . - . . ..:.'.... . . . - .
i - 1
..
,
. .
.
i- ¡•.•'.•'.-••V;'."..-.
• • ? . ' . ' •
* Case 1 m a y b e used fo r un i f orm pre s sure d i s t r ibut ion wi th d r a i n a g e a t top o r b o t t o m o n l y .

7/18/2019 Correl Soils Properties Carter&Bentley
http://slidepdf.com/reader/full/correl-soils-properties-carterbentley 73/136
CONSOLIDATION
AND
SETTLEMENT
67
Table 5 6 T Y P I C A L V A L Ú E S O F T H E C O E F F IC I E N T O F C O N S O L I D A T IO N
v
Soil
cm2/sxl T4)
m2/yr)
Boston
blue
clay
CL)
Ladd and
Luscher, 1965)
Organic silt OH)
Lowe, Zaccheo, and Feldman, 1964)
Glacial lake clays CL)
Wallace
and
Otto, 1964)
Chicago
silty
clay CL)
Terzaghi and Peck, 1967)
Swedish médium
sensitive
clays CL-CH)
Holtz
and Broms, 1972)
1. laboratory
2. field
San Francisco B ay Mud CL)
México City clay MH)
Leonards an d Girault, 1961)
40
+ 20
2-10
6.5-8.7
8.5
0.4-0.7
0.7-3.0
2-4
0.9-1.5
12±6
0.6-3
2.0-2.7
2.7
0.1-0.2
0.2-1.0
0.6-1.2
0.3-0.5
1-1OO
Undisturbed
samples
C v in ra n g o of virgin c o m p re s s i o n
Cy in ranga of
r
«compres
s
¡ en
lies
above this lower l i m i t
Completeiy
remoi e s mples
lies below
this upper limit
4
60 8O 100 120
Liquid limit -
140 160
Figure 5.4 Approximate correlations between
coefficient
of
consolidation
and liquid
limit
after US
Navy, 1988

7/18/2019 Correl Soils Properties Carter&Bentley
http://slidepdf.com/reader/full/correl-soils-properties-carterbentley 74/136
68 CORRELATIONS
OF
SOIL PROPERTIES
fo r clays a re given in Table 5.6 and an a ppro xima te corre lat ion with
liquid limit is
shown
in
Figure 5.4.
5 3 SECOND ARY COMPRESSION
Secondary compression is a vólume change under load that takes
place
at
constant efíective stress; that
is , after th e
excess pore water
pressure
has
dissipated.
It
is
thought
to
result f rom compression
o f
the co nstituent soil
particles
at a
microscopic
or molecular
scale
and
is particularly
signifícant in
organic soils.
Coefficients of
secondary
compression may
be
defíned
in a way
tha t
is
analogous
to the
definitions o f co mpression Índex and modified compression Índex,
except that the índices are related to time instead of pressure. Thus,
th e
secondary compression índex,
C
a is :
de
~ d ( l o g í )
(5.11)
where
de
is the change in voids ratio o ver a time interval , di f rom time
í
x to time
í2:
see Figure 5.5. Similarly, the modified secondary
compression Índex, C a£ is :
dh/h
d( log í )
(5.12)
o
>
O
su
e
o
e
Primary
con
«oí ¡dat
ion
Secondary compression
Log time t
Figure
5 5
lotting
an d
calculation
of
secondary compre ssion

7/18/2019 Correl Soils Properties Carter&Bentley
http://slidepdf.com/reader/full/correl-soils-properties-carterbentley 75/136
ONSOLID TION
ND SETTLEMENT 69
where e
p is the
voids ratio
at the
start
of the
linear portion
of the
e-logp or áh — logp curve. The modified secondary compression
Índex
is sometimes also
referred
to as the secondary compression
ratio or the rate of secondary compression.
Calculations o f secondary compression are obtained by rearrang-
in g Equation
5.12:
specimen com pression
dh
becomes secondary
settlment,
p
c
;
specimen thickn ess, h , becomes layer thickness, H; and
the time is taken over a specifíc interval, from í to
í2:
pc
=
CMHlog(t2/í1)
or
For the purpose of secondary settlement calculations, secondary
settlement is assumed to start when primary settlement is substan-
tially complete. Thus, if primary settlements were substantially
complete in 12 years, the valué of
í would be 12. The valué of í
2
depends
on the
assumed lifespan
of the
structure under
consideration.
Valúes of
C
a or CZ£ are obtained from e —
logp
o r
áh— log
p plots,
as indicated in Figure 5.5.
Ca
is usually assumed to be related to Cc,
with
valúes o f
CJCC
typically in the range 0.025-0.006 for inorganic
soils and 0.035-0.085 fo r organic soils. Some typical
valúes
a re given
in Table 5.7. M esri
1973)
obtained a relationship between
C
aE and
natural moisture content, given in Figure
5.6.
Table
5.7
Soil
J
Organic silts
0.035-0.06
Amor phous
and fibrous
peat
0.035-0.085
Canadian muskeg . 0.09-0.10
Leda
clay (Canadá)
0.03-0.06
Post-glacial
Swedish
clay
0.05-0.07
Soft
blue clay Victoria,
B.C.) 0.026
Organic
clays and
silts
0.04-0.06
Sensitive clay, Portland, ME 0.025-0.055
San
Francisco Bay Mud 0.04-0.06
New Liskeard (Canadá) varved clay 0.03-0.06
México City clay
0.03-0.035
Hudson River silt 0.03-0.06
New Haven
organic
clay silt 0.04-0.075
*
M odified
after
Mesri
and Goldlewsk'(197 -

7/18/2019 Correl Soils Properties Carter&Bentley
http://slidepdf.com/reader/full/correl-soils-properties-carterbentley 76/136
70
CORRELATIONS
OF SOIL
PROPERTIES
10O
ü
M
X
»
TJ
c
o
c o
a
o
u
a
•
c
o
«
o
TJ
•
o
10
1
0 1
10
i i III lili I I I I I I I I I
i i r
r M I
O O
i
f i
i
1
Natural
moisture contení -
Figure 5.6 Correlation between
modified
secondary
compression
índex and
natural
moisture contení
after
Mesri ,
1973)
5 4
S TTL M NT
OF SANOS AND
GRAVELS
5 4 1 Probes and standard penetrador tests
As
mentioned
in the
introductory
re rks to
this chapter
th e
near-impossibility of
obtaining
and
testing
imdisturbed
samples
of
granular soils means that consolidation testing
is not
possible.
Instead settlements are usually estimated from insitu
test
results
most comm only using
th e
standard penetration test althoug h
the use
of
probes
in the form of
static
or
dynamic cones
has
become more

7/18/2019 Correl Soils Properties Carter&Bentley
http://slidepdf.com/reader/full/correl-soils-properties-carterbentley 77/136
CONSOLIDATION AND SETTLEMENT 71
widespread in recent years ESO PT, 1982;
INSITU
1986; ISOPT
1988). A useful review of the interpretaron of some penetration tests
for sands is given by Rober t son and Campanel la
1985).
The most commonly-used correlat ions for set t lement
estímales
in
sands, based
on SPT
results,
are those
established
by
Terzaghi
and
Peck 1967), sho w n
in
Figure 5.7. Terzaghi
and
Peck point
out tha t
the correlations show wide scatter and shou ld not be regarded as
anything more than
a
rough-and-ready guide.
Considering the
practical problems of obtaining me aningfu l SPT results, especially in
sands below the water table, and the disagreements over various
corrections to be applied to the results, th e correlations a re o f dub ious
valué in
many
cases. Yet settlement estimates are of crucial import-
ance for the determination of allowable f ou nda tion p ressures on
granula r
soils,
whose high
u l t ímate
bearing capacity means that
ruu
6OO
CM
E
H
5OO
•
3
S 40O
a
c
OO
0 •
S
200
<
100
—
— —
\
\
•*•».
—
—
e
—
—
ry
den
••^—
— —
se
^
^
s Dense
X
Med
V
íí 30
um d <
S5o
Loóse
.
•••• i»
snse
—
—
—™— —
• -—
• i
••
i.
70
6O
50
4O
«
x
e
c
30 o
4-1
2O
10
O 2 3 4 5 6
Footing width m
Figure 5.7 Chart fo r estimating
allowable bearing pressures
on
sands
using
standard
penetration test results based on 25mm
settlement.
Continuous Unes are based on the
original
chart
by
Terzaghi
an d
Peck
1967);
broken
Unes are iníerpolations
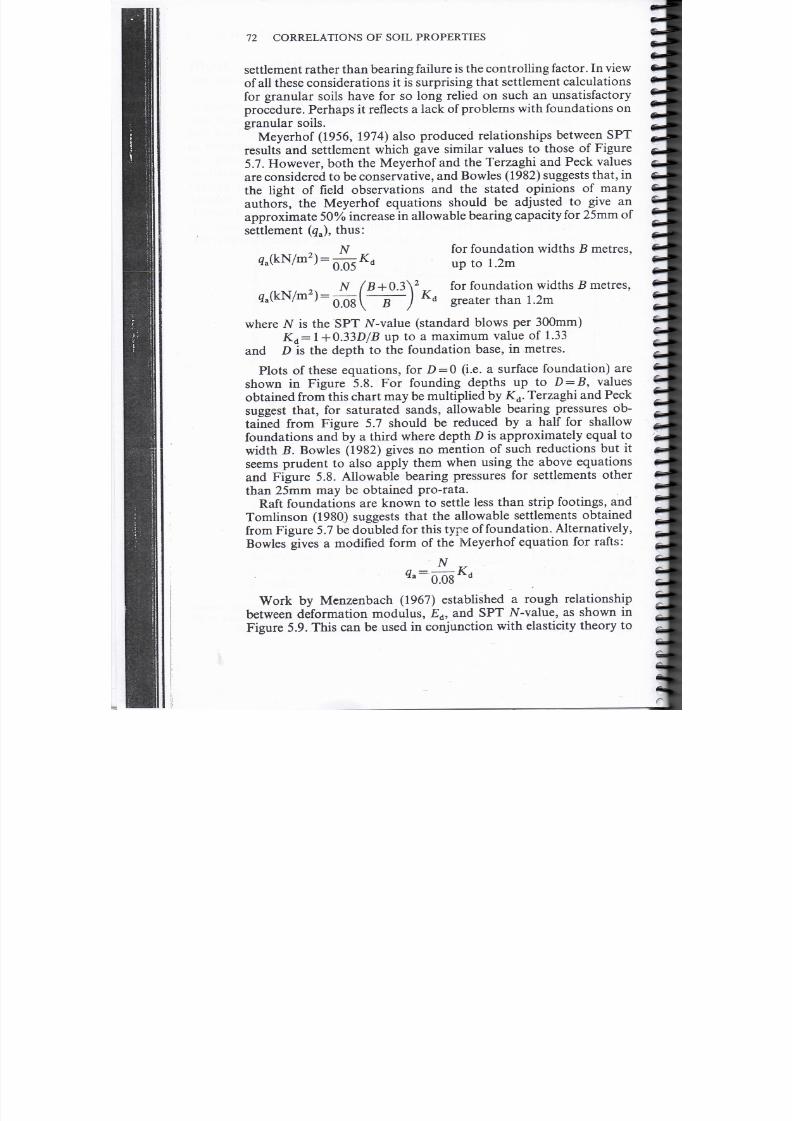
7/18/2019 Correl Soils Properties Carter&Bentley
http://slidepdf.com/reader/full/correl-soils-properties-carterbentley 78/136
72 CORRELATIONS OF SOIL PROPERTIES
settlement rather
than bearing
failure is the controlling factor. In
view
of all
these considerations it is surprising that settlement calculations
fo r granular
soils have
for so long
relied
on
such
an
unsatisfactory
procedure. Perhaps it
reflects
a
lack
of problems
w ith foundat ions
on
granular soils.
Meyerhof
1956, 1974) also produced relationships between
SPT
results and
settlement which gave similar valúes
to
those
o f
Figure
5.7. However, both
th e
Meyerhof
and the
Terzaghi
and
Peck valúes
are considered to be conservative, and Bowles 1982) suggests that, in
th e
light
of field
observations
and the
stated opinions
o f many
authors, th e Meyerhof equations should be
adjusted
to
give
an
approximate
50 increase in allowable
bearing
capacity for 25mm of
settlement qa), thus:
for foundation w id ths
metres,
up
to
1.2m
05 d
4
a
(kN/m
2
)
=
N
fo r
foundation widths
metres,
greater
than
1.2m
.08
where N
is the SPT N-valué standard blows per 300mm)
K
á
=
1 +0.33D/5 up to a máximum valué of 1.33
and D is the
depth
to the
foundation base,
in
metres.
Plots of
these equations,
for
D
= 0
i.e.
a surface
foundation)
are
shown
in
Figure 5.8.
For
founding
depths
up to
D
=
B
valúes
obtained from this chart
may be
multiplied
by
K
á
. Terzaghi
and
Peck
suggest that,
fo r
saturated sands, allowable bearing pressures
ob-
tained from Figure 5.7 should be reduced by a half for shallow
foundations
and by a
third where depth
D is
approximately equal
to
width B.
Bowles 1982) gives
no
mention
of
such reductions
but it
seems
prudent to also
apply
them when using th e above equations
and Figure 5.8. Allowable bearing
pressures
for settlements other
than 25mm
may be
obtained pro-rata.
Raft
foundations are known to settle
less than strip
footings, and
Tomlinson 1980) suggests that
the
allowable settlements obtained
from Figure 5.7 be doubled for this type o f foundation. Alternatively,
Bowles gives
a mo dified
form
of the
Meyerhof equation
for rafts:
N
Work
by
Menzenbach 1967) established
a
rough relationship
between deformation modulus, E¿ and SPT
N-value,
as shown in
Figure 5.9. This can be used in conjunction with
elasticity
theory to

7/18/2019 Correl Soils Properties Carter&Bentley
http://slidepdf.com/reader/full/correl-soils-properties-carterbentley 79/136
CONSOLIDATION AND
SETTLEMENT
73
8
1 2 3 4
Footirvg width
m
Figure 5.8
Allowable
bearing pressure fo r
footings
founded ai surface level, for
settlement limited
lo approximately
25mm
after
Bowles, 1982)
obtain sett lem ent
predictions. For
instance
for a strip
foundation
o f
width B,
loading
intensity
q
settlement p
is
given
by:
2 25
where
Poisson s
ratio v is usu ally taken as 0.15 for sands. Valúes of
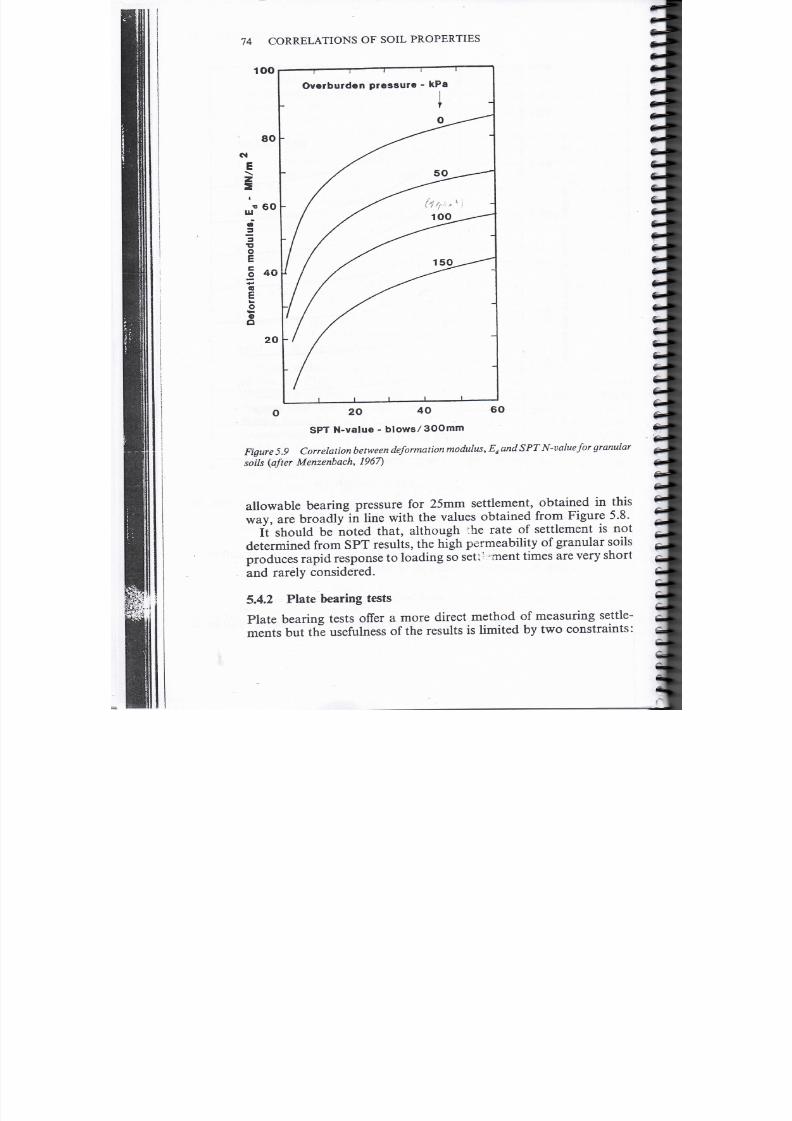
7/18/2019 Correl Soils Properties Carter&Bentley
http://slidepdf.com/reader/full/correl-soils-properties-carterbentley 80/136
74 CORRELATIONS
OF SOIL
PROPERTIES
8
6
•o
O
40
2
l
Overburden pr ssur kPa
2O 40
SPT
N value b l o w s / S O O m m
60
Figure 5.9
Correlation
between
deformation
modulas,
E
d and SPT
N-value
for granular
soils after
Menzenbach, 1967
allowable bearing pressure
fo r
25mm settlement obtained
in
this
way
a re
broadly
in
line
with
the
valúes obtained
from
Figure 5.8.
It should be noted that although the rate of settlement is not
determined from SPT results the high permeability of granular soils
produces rapid response to loading so
seti-
ment times a re very short
a nd rarely considered.
5 4 2 Píate bearing
t sts
Píate bearing tests offer a more direct method of measuring settle
ments but the usefulness of the results is limited by tw o constraints:

7/18/2019 Correl Soils Properties Carter&Bentley
http://slidepdf.com/reader/full/correl-soils-properties-carterbentley 81/136
CONSOLIDATION
AND SETTLEMENT 75
1) the depth of sand stressed by a píate is
only
a fraction of that
stressed
by a
full-sized foundation,
and
2) settlement predictions require knowledge of the scale effects
between
the settlement of a píate and that of a full-sized
foundat ion.
The
most
commonly-used
correlation
fo r
scale
effects
between
píate
and
fou ndation settlements
is
that given
by
Terzaghi
and
Peck
1967):
where
p is the settlement of a square foundation o f side B ft, and
pt
is the settlement of a 1-foot square píate
If th e foundat ion width is measured in metres, this becomes:
2B
0 3
A n alternative, and more general, relationship was derived by
Menard and Rousseau 1962):
P i =
P2
where pí
and
p
2 are the
settlements
of the
píate
and
footing
B±
and
B
are
the ir respective w idths
and a depends on the soil type. Ty pical a valúes are:
Sands and gravéis to ^
Saturated
silts
Clays and dry
silts
§ to
Compacted fu l 1.
7/18/2019 Correl Soils Properties Carter&Bentley
http://slidepdf.com/reader/full/correl-soils-properties-carterbentley 82/136
hapter
SHE R STRENGTH
It is usually assumed that the shear stren gth of soils is governed by the
Mohr-Coulomb
failure
criterion:
s = c +
< 7
tan >
6.1)
where s is the shear stress i failure along
any
plañe
a is the normal stress on that plañe
and c and f ) are the shear strength parameters; cohesión and
angle
of
shearing resistance.
This is sho wn graphically on the
Morir
diagram given in Figure 6.1.
A complication arises because th e norm al stresses within a soil are
c rried
pa rtly b y the soil skeleton itself and p artly by water within th e
soil voids. Considering only th e stresses
within
th e soil skeleton,
equation
1)
is
modifíed
to
or
s = c
+
a
tan
>
where u is the pore water pressure
a
=
(a—u),
th e
effective norm l stress
on the
soil skeleton)
and c an d < / > are the shear strength parameters related to effective
stresses.
Th us wh en considering the shear strength of soils, ther e is a cho ice:
either th e total, combined reponse of the soil and pore rater can be
considered Eq uation 6.1);
or the specific
response
o f the
s « l skeleton
can be separated from the pore water pressure by
considen - . effective
stresses Eq uation 6.2).
The
effective stress appro ach gives
a
truc
measure
of the
response
of
th e soil skeleton to the loads imposed on it. Perhaps th e
simplest
case
is that of a load applied to a saturated soil that is allowed to drain. If
the rate of application of the
lo d
is
sufficiently
slow,
pore water
76

7/18/2019 Correl Soils Properties Carter&Bentley
http://slidepdf.com/reader/full/correl-soils-properties-carterbentley 83/136
S H E A R
STRENGTH
77
Figure
6.1 Mohr diagram representing th e
g eneral Mohr-Coulomb failure
criterion
ire t
str ss
Figure 6.2 Mohr diagram for a normally-cons olidated clay for effective s tresses
pressures will
not
bu ilt
up and the
tota l stresses will equ al
the
effective
stresses Fo r drained conditions, or in terms of effective stresses, it is
found
that the shear strength of
soils
is principally a frictional
phenomenon, with
c = 0, as
ülustrated
in
Figure 6.2. This does
not
appear to b e the case f or ov erconsolidated clays which have a
bu ilt-in
pre-stress
(see Singh et al. 1973),
or for
partially saturated clays
in
which
th e particles are
drawn together
by
surface
tensión
effects,
giving them some cohesión.
When soil
is
loaded,
th e
increase
in
confming pressure within
th e
soil skeleton squeezes the particles closer together, reducing the
volume of the voids. However, in a saturated clay this cannot take
place unless some of the pore water can drain f rom the voids.
Thus ,
for
a saturated clay in c onditions of no d rainage, an increase in
confining
pressure cannot be carried by the soil skeleton but results
instead in an equal increase in pore water pressure. Since shear
strength depends on the effectiv e stresses, trans m itted by interparticle
contacts, and
these
remain unchanged
irrespective
of the applied
confining pressure, it follows that undrained shear strength will also
be independent of confining pressure. Because of this, samples of
saturated clay tested
in a
quick undrained triaxial test
give Mohr s
circles
of co nstant diameter and an apparent c ohesión v alué as
shown
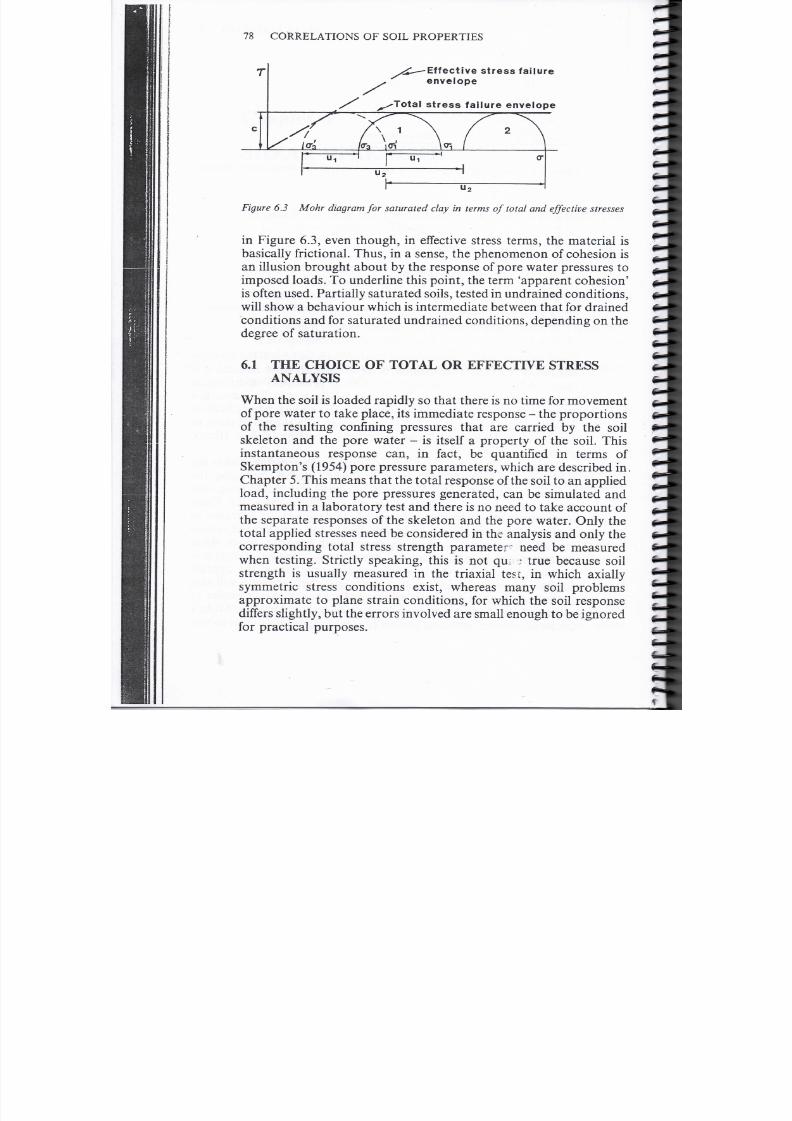
7/18/2019 Correl Soils Properties Carter&Bentley
http://slidepdf.com/reader/full/correl-soils-properties-carterbentley 84/136
78 C O R R E L A T IO N S
OF
SOIL PROPERTIES
xjjl---Effective
s t r e s s failure
e n v e lo p e
Total stress f i lu re enve lope
Figure 6.3 Mohr diagram for s tur ted clay in terms of tot l an d effective síresses
in Figure 6.3, even though, in effective stress terms, the material is
basically
frictional.
Thus ,
in a sense, the phenomenon of cohesión is
an illusion brought abouí
by
the response of pore
water
pressures to
imposed
loads.
T o
underline
this poin t, the term apparent cohesión
is often
used. Partially saturated soils, tested in undrained co nditions,
will show a behaviour whic h is intermedíate between that for drained
co nditions and f or saturated und rained co nditions, depending on the
degree of
saturation.
6 1
THE CHOICE OF TOTAL OR EFFECTIVE STRESS
ANALYSIS
When the
soil
is
loaded rapidly
so
that there
is no
t ime
for
movement
of pore w ater to tak e place, its imm ediate response - the proport ions
of
the resulting confining pressures that are carried by the soil
skeleton and the pore water - is itself a property of the soil. This
instantaneous response can,
in
fací ,
be quantifíed in
terms
of
Skempton s 1954) pore pressure parameters, which are described in.
Chapter 5 . This m eans tha t the total response of the soil to an applied
load, including
th e
pore pressures generated,
can be
s imulated
and
measured
in a
laboratory test
a nd
there
is no
need
to
take account
o f
the
sepárate responses of the
skeleton
and the pore
w ater.
Only the
total applied stresses need be considered in the analysis and only the
corresponding total stress strength parameter~ need be measured
when testing.
Strictly
speaking, this
is not
qui
;
true because soil
strength is usually measured in the triaxial
test,
in which axially
symmetric
stress conditions exist, whereas many soil problems
approximate to plañe strain conditions, for which the soil response
diíiers slightly,
but the
errors involv ed
are
small enough
to be
ignored
for practical purposes.

7/18/2019 Correl Soils Properties Carter&Bentley
http://slidepdf.com/reader/full/correl-soils-properties-carterbentley 85/136
SHEAR STRENGTH 79
The equilibrium
pore water pressures that
are
eventually estab-
lished
are,
unlike
the imm ed iate response, not a pro perty of the soil
but depend on the surrounding conditions. Long-term pore water
pressures cannot therefore be simulated in the laboratory must be
considered separately. Henee, efíective stress analysis must
be
used
where
long -term
stability
is
important .
In
testing,
the
response
of the
soil skeleton can be
measured
either by allowing drainage of the
specimen so tha t no m ore pressures build up or by measuring the pore
water pressure within the specimen. In either case, tests must be
carried
out
slowly enoug h
to
allow c omp lete dissipation
or
equalisa-
tion
of
excess
pore
water pressures within
the
test specimen.
6 1 1
he
choice
in
practice
Foundations impose both shear stresses
and
compressive stresses
confining pressures) on the und erlyin g soil. The shear stresses m ust
be
carried
by the
soil skele ton
but the
com pressive stresses
are
initially
carried largely by the resulting increase in pore w ate r pressures. This
leaves
th e effective
stresses little changed, which implies that
th e
foundat ion
loading
is not
accompanied
by any
increase
in
shear
streng th. As the excess pore pres sures d issipate, the soil
consolídales,
and
effective
stresses increase, leading to an increase in shear str en gth .
Thus,
for
foundations,
it is the
short term co ndition
the
imm ediate
response of the
soil
that is mo st critical.
This
is the justifícation for
the use of quick undrained shear strength tests and
total
stress
analysis
for
foundation design.
W ith excavations, com pressive stresses are reduced by removal of
soil but shear stresses are imposed on the sides of the exca vation
owing
to removal of lateral
support.
Initially, th e reduction in
compressive stresses
is
manifested within
the
soil mainly
as a
reduction
in
pore water pressures, with little change
in
eífective
stresses so th at , as with foun da tion s, soil shear strength remains little
aífected
by the changed loading. Ev entua lly, wa ter flows into the soil
that
forms
the excavation sides, restoring th e
pore-water
pressures.
This reduces the
effective
stresses, causes swelling and reduces shear
strength. Thus,
for
excavations, long-term conditions
are the
most
critical. Since long-term pore pressures depend
on
drainage condi-
t ions and can not be simulated by soil tests, an eífective stress analysis
must be used so that pore water pressures can be
considered
separately from stresses
in the
oil skeleton.
During embankment construction, additional layers of material
impose a pressure on the
lower
part of the embankment. As with
foundations, this tends to créate increased pore water pressures and,
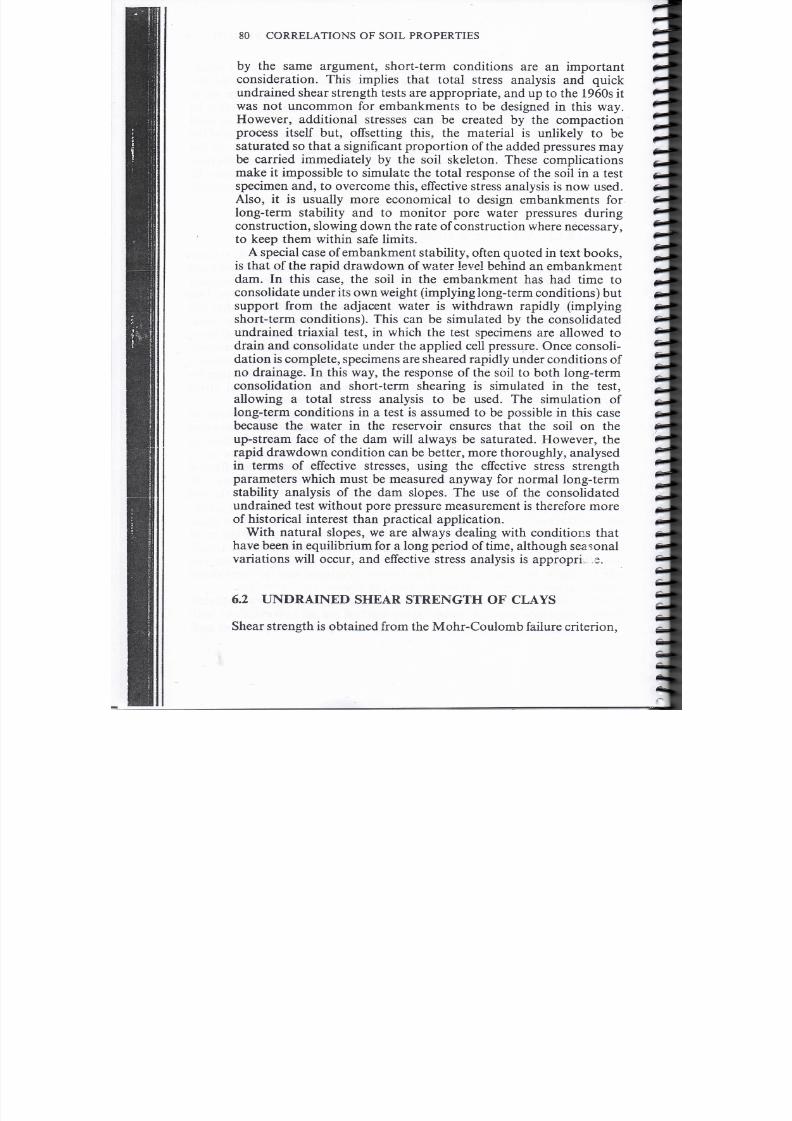
7/18/2019 Correl Soils Properties Carter&Bentley
http://slidepdf.com/reader/full/correl-soils-properties-carterbentley 86/136
80
CORRELATIONS
OF SOIL
PROPERTIES
by
the same argument, short-term conditions are an
important
consideration. This implies that total stress analysis and quick
undrained shear strength tests are approp riate, and
up
to the 1960s it
w as not
uncommon
for
emb ankments
to be
designed
in
this way.
However,
additional stresses
can be
created
by the
compaction
process itself but,
offsetting
this,
th e
material
is
unlikely
to be
saturated
so
that
a significant
proportion
of the
added pressures
m ay
be carried
immediately
by the soil
skeleton. These complications
make it impossible to simúlate the total response of the soil in a test
specimen and, to overeóme this,
effective
stress analysis is now used.
Also it is usually more economical to design embankments fo r
long-term stability
and to
monitor pore water pressures during
construction, slowing dow n the rate of construction
where
necessary,
to
keep
them
within
safe
limits.
A
special case
o f
emban km ent stabili ty,
often
quoted
in
text books,
is that of the rapid drawdown of water
level
behind an embankment
dam. In this case, the soil in the embankment has had time to
consolídate
under
its ow n
weight implying long-term cond itions)
but
support from
th e
adjacent water
is
w ithdraw n rapidly implying
short-term conditions). This can be simulated by the C onsolidated
undrained triaxial test,
in
which
th e
test specimens
are
allowed
to
drain and
consolídate
under the applied
cell
pressure. Once consoli-
dation
is
complete, specimens
are sheared
rapidly un der conditions
of
no drainage. In this way, the response of the soil to both long-term
consolidation
and
short-term shearing
is
simulated
in the
test,
allowing a
total
stress analysis to be used. The simulation of
long-term conditions
in a
test
is
assumed
to be
possible
in
this case
because the water in the reservoir ensures that the soil on the
up-stream
face
of the dam will al w ay s be saturated. However, the
rapid drawdown condition can be better more thoroug hly, analysed
in terms of eífective
stresses, using
the
effective
stress strength
parameters which musí be measured anyway for n ormal long-term
stability analysis
of the dam
slopes.
The use of the
Consolidated
undrained test witho ut pore pressure measurem ent is therefore more
of
historical
interest than practical application.
With
natural slopes,
we are
alw ays dealing
with
conditions that
have
been in equilibrium for a long period of time, although seasonal
variations will occur,
an d effective
stress analysis
is
appropri
e.
6 2 UNDR INED
SHEAR STRENGTH
OF
CLAYS
Shear strength is obtained
from
the
M ohr-Coulomb failure criterion,

7/18/2019 Correl Soils Properties Carter&Bentley
http://slidepdf.com/reader/full/correl-soils-properties-carterbentley 87/136
S H E A R S TR E N G TH
81
Table 6 1 E S T I M A T I N G THE S H E A R S T R E N G T H O F C L A Y S
Shear
strength
kN / m
2
)
<20
20-^W)
40-75
75-150
150-300
>300
Descriptive
term
Very so f t
Soft
Firm
Stiff
Very stif
Hard
Characteristics
Exudes between f ingers when squeezed
Moul ded
by
light
finger
pressure
Moul ded by s t r ong f inger pressure
Can be indented by t h u m b
Can be
indeníed
by
t h u m b nail
Note: thesc
strength
descriptions and tests conform w i th standard practice and with the recommendations of B.S.
5930 1981).
Table 6 2 T Y P I C A L S H E A R S T R E N G T H P R O P E R T IE S O F C O M P A C T E D C L A Y S
Soil
description
Class
Undrained shear
strength
kN/m)
As
compacted
Saturated
Silty
sands sand-si l t m ix
Clayey sands sand-clay m ix
Silts and clayey silts
Clays o f
lo w
plastici ty
Clayey silts, elastic silts
Clay of high plasticity
SM
SC
M L
CL
M H
CH
50
74
67
86
72
103
20
11
9
13
20
11
Uniíied
classif icat ion system.
Equat ion 6.1). Ho wever, fo r mos t sa turated
clays,
tested under quick
undrained condi t ions ,
the
angle
o f
she aring resistance
is
zero.
This
means that the shear s t rength of the
clay
is a fixed valué and is equal to
the apparent coh esión.
T he
valué
o f the
undrained shear s t rength
may
be
est imated
by
mould ing
a
piece
o f
clay between
the fingers and
applying
the observations indicated in Table 6.1.
Typical
valúes
for the
shear
s t rengths of
compacted
clays
are
given
in Table 6.2. Valúes
refer
to soils compacted to the m á x i m um dry
densi ty obta ined in the s tandard compact ion tes t : AASHTO T99
5.51b
rammer method)
or BS
1377:1975 Test
12
2.5kg ramme r
method) .
6 2 1 Remoulded shear strength
As discussed
in
Chapter
1, the
liquid
and
plástic limits
are
mois ture
contents
at
w hich soi l
has
specific valúes
o f
undrained sh ear s t rength.

7/18/2019 Correl Soils Properties Carter&Bentley
http://slidepdf.com/reader/full/correl-soils-properties-carterbentley 88/136
82 CORRELATIONS
OF
SOIL PROPERTIES
2
1.8
1 6
1.4
x 1.2
o
1 0
2
cr
0 8
6
4
2
Liquid
limt
0 .2
Plástic
l i m i t
Clay
Horten
London
Gosport
Shellhaven
LL
PL
30
16
73
25
80 30
97 32
Pl
Activity
14 0 36
48
0 96
50 0 89
65
1 27
I I I l i l i
J
I I I I I
l i l i
1
O.5 1 5 1O
Undrained
shear strength kN/ra
5O 100
2
Figure
6 .4
Correlation between shear strength
and liquidity índex after Skempton and
Noríhey,
1952)
It therefore follows that for a rem oulded soil the shear strength
depends on the valué of the
natural
m oisture
c ontení
in relation to the
liquid an d
plástic
limit valúes. This can be convenie ntly expressed by
using
th e
concept
of
liquidity índex defined by :
w
n
PL wn PL
Liquidity índex = -—
P
Pl
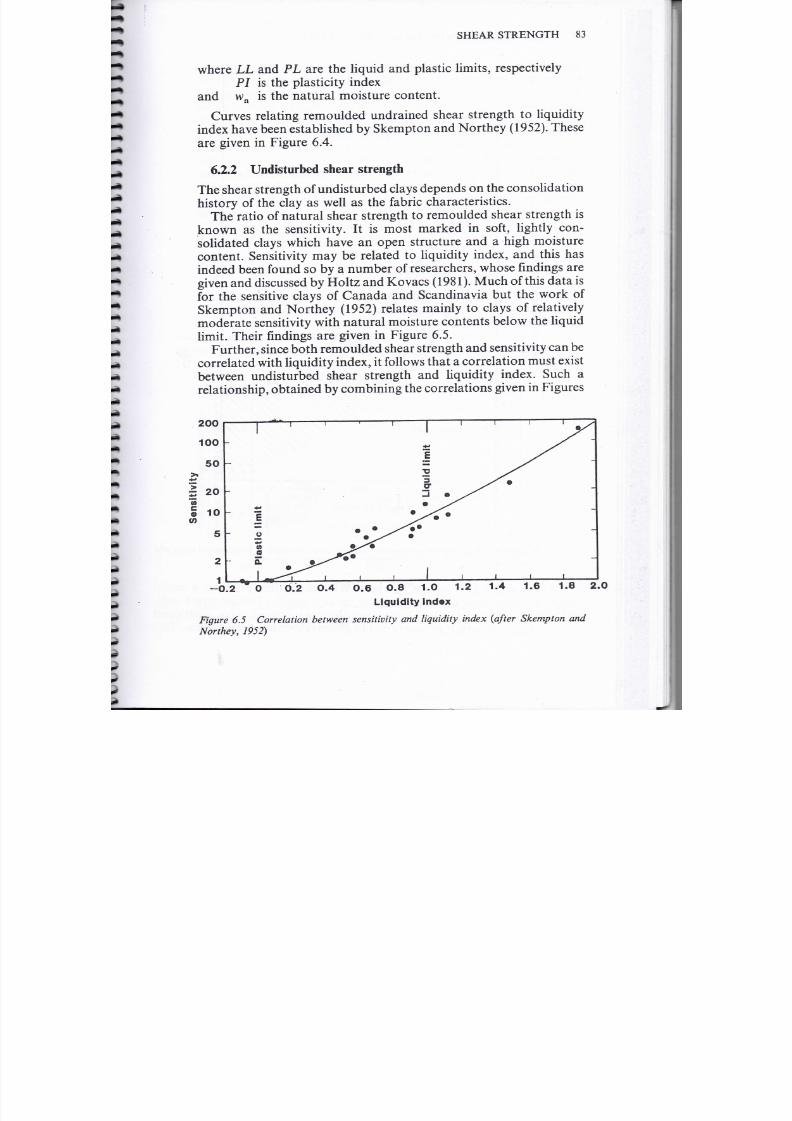
7/18/2019 Correl Soils Properties Carter&Bentley
http://slidepdf.com/reader/full/correl-soils-properties-carterbentley 89/136
SHEAR
STRENGTH 83
where
LL and PL are the liquid and
plástic lim its, respectively
PI is the
plasticity
índex
and w
n
is the natural moisture content.
Curves relating remoulded undrained shear strength to liquidity
índex
hav e been established by Ske m pton and No rthe y 1952). These
are given in Figure 6.4.
6 2 2 Undisturbed shear strength
The shear strength o f undisturbed clays depends on the consolidation
history of the clay as well as the fabric characteristics.
The ratio of natural shear strength to remoulded shear strength is
known
as the
sensitivity.
It is
most marked
in soft,
lightly con-
solidated clays which have
an
open structure
and a high
moisture
content
Sensitivity m ay
be
related
to
liquidity Índex,
and
this
has
indeed been found so by a num ber of researchers, whose findings are
given and discussed by Holtz and K ovacs 1981). M uch of this data is
for the
sensitive clays
of
Canadá
and
Scandinavia
but the
work
of
Skempton and Northe y 1952) relates m ainly to clays of relatively
modérate sensitivity with natural mo isture co ntents
below
th e liquid
limit. Their fíndings are
given
in
Figure 6.5.
Fu rther, since both remoulded shear stren gth
an d
se nsitivity
can be
correlated with liquidity Índex, it foliows that a
correlation
m ust exist
between undisturbed shear strength and liquidity índex. Such a
relationship,
obtained
by
combining
the
correlations
given
in
Figures
2
5O
20
§ 1
0 2 O 0 2 0 4 0 6 O 8 1 0 1 2 1 4 1 6 1 8 2 0
Liquidity ndax
Figure 6.5 Correlation between sensitivity and liquidity
índex
after Skempton an d
Northey, 1952)

7/18/2019 Correl Soils Properties Carter&Bentley
http://slidepdf.com/reader/full/correl-soils-properties-carterbentley 90/136
84
C O R R E L A T I O N S OF SOIL PROPERTIES
200
100
g 5O
x
JS
O
e
o
o
1
i
I I I 1
.
ti
0 2 0 4 0 6 0 8
iquidi ty indax
1
1 2
2
a
Figure 6.6 Relationship
between
th e natural shear slrength of undisturbed clays and
liquidity índex
6.4
and
6.5
is
shown
in
Figure 6.6 which then provides
a useful
predictive tool for assessing the shear strength of un disturbed soils.
It is
found
that for
m ost norma lly-consolidated clays, und rained
shear strength is
proportional
to eífective overburden pressure. This

7/18/2019 Correl Soils Properties Carter&Bentley
http://slidepdf.com/reader/full/correl-soils-properties-carterbentley 91/136
S H E A R STRENGTH 85
is to be
expected when
it is
remembered that ,
in terms of
eñective
stress,
shear
strength is basically a
frictional
phenomenon and
depends on confming pressure. If
th e
constant of proportionality
between shear strength
and
eñective overburden pressure
is
k n own
then shear strength
can be
inferred
from
eñective overburdenpressure; that is ,
from
depth.
This
problem h as been investigated by a
number
of
researchers, with
a view to
establishing
a
correlation
between
the
shear strength/ove rburden pressure ratio
and
some soil
classification param eter, typically the plasticity índex. Such a correla-
tion would be of great practical valué, since it would enable the
undrained shear strength (S u)
to be
estimated
from a
simple
classification test.
Historically,
muc h use has been m ade for normally consolidated
clays of the relationship of Skempton 1957):
<7V
0.11 0.0037P/
where,
P I
is the plasticity Índex. At first sight it is not evident that
SJ(j v should b e related to the plasticity Índex. Ho we ver, the valué of
0
can be
expected
to
depend
on the
shape, size, packing
and
mineral
composition of the clay particles, as
will
the plasticity
índex,
so the
two properties
are
related
in
some man ner see Figure 6.12). Figure
8
i
0)
n
Bjer rum(1972 ) aged
Skempton
(1957)
Bjerrum (1972) young'
Kenn0y(1976)
100
Plas ticity index
200
Figu re 6.7 Relationship betwee n the ratio of undrained shear strength to effective
overbu rden pressure
an d
plasticity index
for
normally-consolidated clays
(modified
after
Holtz and
Kovacs ,
1981).

7/18/2019 Correl Soils Properties Carter&Bentley
http://slidepdf.com/reader/full/correl-soils-properties-carterbentley 92/136
86
C O R R E L A T I O N S
OF
SOIL P R O P E R T I E S
6.7 includes
other results obtained
by a numb er of
researchers.
As can
be seen, their findings vary and should only be used wi th caution.
Ho w ever, such correlations particularly that
of
Skempton 1957)
are
useful for preliminary estímales and checking laboratory data on
normally Consolidated clays. For overconsolidated
clays,
Kenney
1959), stated that the relationship is influenced mainly by the stress
history and is essentially independent of plasticity Índex. A correla-
tion between
the
shear strength/overburden
pressure ratio and
liquidity
índex for
Norwegian quick clays
w as
presented
by
Bjerrum
and Simons 1960), as
indicated
in Figure 6.8. Ag ain, results show so
much
scatter that the interp retatio n of the results is open to q uestion,
and all that can be said with certainty is that, for Norwegian quick
clays, the
ratio
is around 0.1 to 0.15.
Besides
th e
influence
of geological history on undrained shear
strength,
the
stress history du ring test also
affects
results. Thus, shear
strengths obtained
by
unconfined
compression testing or triaxial
testing can be expected to difíer from those
obtained
by shear vane
Wroth, 1984). The relative valúes of the
shear
strengths have been
examined by a number of researchers, and the
ratio
of
true
und rained shear strength based on the back-analysis of em ban km ent
failures)
to shear vane valúes seems to depend on the plasticity índex,
as indicated by Figure 6.9.
Strictly, undraine d shear strength depends on the
effective
consoli-
dation pressure, which is the average of the
effective
overburden
o »
o
O
»
o
0 4
0
°3
•o
0.2
w
o
Liquidity Ín ex
Figure 6.8
Relationship between
the
ratio
of
undrained
shear
strength
an d effective
overburden
pressure and liquidity Índex for Norwegian clays after Bjerrum and
Simons, 1960)

7/18/2019 Correl Soils Properties Carter&Bentley
http://slidepdf.com/reader/full/correl-soils-properties-carterbentley 93/136
S H E A R STRENGTH 87
3k
o
v.
u.
Ü
1.4
1.2
1.0
0.8
6
0.4
D O
•
Bjerrum 1972)
Milligan 1972)
Ladd and
Foott 1974)
-
Flaate
and Preber
1974)
LaRochella et al. 1974)
D Holtz and Holm
1979)
*
- Layered and varved clays
B j e r r um s 1972)
recommended curve
« CH
20 40 6O
P l a s t i c i t y
í n d e x
80
1 0 O
120
Figure
6.9
Correlation factor
fo r
field vane test results, depending
on
plasticiíy índex ,
basedon b ack-analysis of embankment failures after Ladd, 1975 and Laddet al. 1977)
pressure
and the lateral pressures. For overconsolidated clays,
comparison of shear strength with effective consolidation pressure
gives better correlations than with
effective
overburden pressure.
According to Bjerrum (1972), w ork ing with normally-consolidated
late
g lacial clays , w hilst recent sediments
are normally
Consolidated,
older clays tend to be slightly overconsolidated, the overconsolida-
tion ratio depending somew hat on the plasticity Índex, as indicated in
Figure 6.10. Combining this w ith Bjerrum s shear
strength/overbur-
den
pressure relationships (Figure 6.7),
and
correcting
th e
resulting
shear strengths using the factor
//
from
Figure
6.9
Mesri (1975)
concluded
that the ratio of the field shear strength to effective
consolidation pressure was independent of plasticity índex and was
equal to 0.22. The scatter of results which ha
ve
gone into producing
this conclusión
are so
w ide that
it
mus t
be
viewed with great caution
but, if validated, it
could
be of practical valué.
Although the literature contains m uch debate
concerning
S
u
/a;
and
overconsolidation ratios
(Ladd
e t al,
1977; W roth , 1984), in p ractical
terms it is more straightforward to measure the undrained shear

7/18/2019 Correl Soils Properties Carter&Bentley
http://slidepdf.com/reader/full/correl-soils-properties-carterbentley 94/136
88
CO RRE L A T I O N S OF SOIL PRO PERT IES
2
2
40 6O
Plasticity índex
1
Figure 6.10
Relationship between overconsoliation ratio an d plasticity
Índex
fo r
late-glacial clays after
Bjerrum,
1972
5
4
3OO
•H
20 0
0
•a
D
.
Soil
groups refer
to
Unified
system
Terzaghi and Peck
1O 2 3O 4 5
SPT N valué blows/SOOmm
6O
Figure 6.11 Approximate correlations beíween undrained shear strength and standard
penetration test N-values
after
Terzaghi
an d Peck,
1967
and
Sowers,
1979}
strength of overconsolidated clays tha n to predict it from other
índices.
6 2 3 Predictions using the standard penetration test
Attempts
have been made
to
correlate
th e
unconfined compressive
strength
or the
undrained shear strength
of
clays with
the
results
of
standard penetration tests with varying degrees of success. Some
suggested relationships are
given
in Figure
6 11
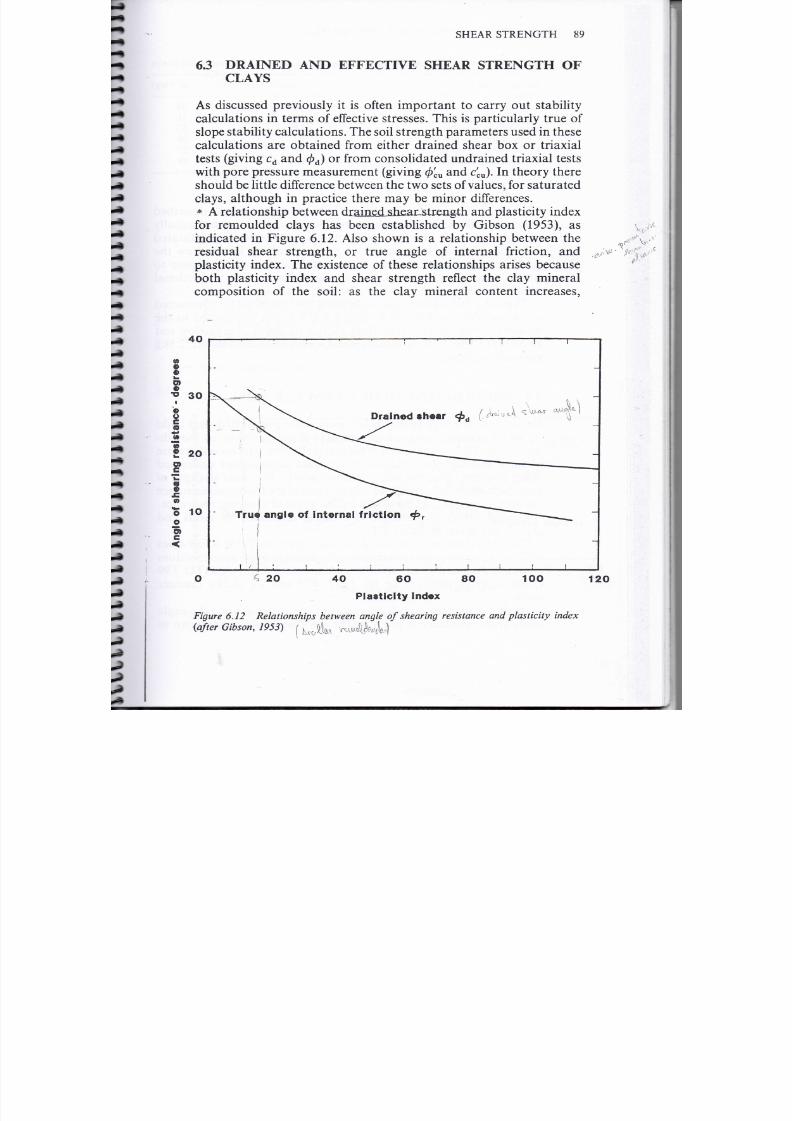
7/18/2019 Correl Soils Properties Carter&Bentley
http://slidepdf.com/reader/full/correl-soils-properties-carterbentley 95/136
S H E A R
STRENGTH 89
DR INED AND EFFECTIVE SHE R STRENGTH OF
CL YS
As discussed previously it is often impor tan t to carry out stability
calculations in
terms
of
effective
stresses. This is particularly truc o f
slope
s tabili ty calculation s.
T he
soil streng th param eters
used in
these
calculations are obtained f rom ei ther drained shear box or triaxial
tests (giving cd and < / > d or
f rom
Con solidated un drain ed triaxial tests
with
pore pressure measurement (giving < / > é
u and c
cu
). I n
theo ry there
should
be little
difíerence
between the tw o sets o f valúes, for sa turated
clays, although in practice there
may
be
minor differences.
*
A
relationsh ip between
diaÍnecLshjea£.stEejftgth and
p lasticity Índex
for remoulded clays
has
been established
by
Gibson (1953),
as
indicated in Figure 6.12. Also shown is a relationship between th e
residual shear strength, or true angle of internal
f r iction,
an dplasticity índex. The existence of these relationships arises because
both plasticity Índex and shear strength reflect the clay mineral
composition of the soil: as the clay mineral content increases,
4O
3
£ 2
w
o 1
o
i
Drained »h««r ¿
d
[_U ^M
Truo
angl©
of
internal friction
i
/
2
4
6 8
Plasticity indox
1
Figure
6.12 Relationships between angle
of
shearing resistance
and
plasticity Índex
after Gibson, 1953)
12

7/18/2019 Correl Soils Properties Carter&Bentley
http://slidepdf.com/reader/full/correl-soils-properties-carterbentley 96/136
90 C O R R E L A T IO N S OF
SOIL
PROPERTIES
Table 6 3
TYPICAL
A N G L E S OF E F F E C T I V E S H E A R I N G R E S I S T A N C E F OR C O M P A C T E D C L A Y S
Soil description
Class*
d e g )
Silty clays,
sand-silt
m ix
Clayey
sands,
sand-clay m ix
Silts and
clayey
silts
Clays
of
lo w
p lasticity
Clayey silts, elastic silts
Clays of
high plasticiíy
SM
SC
M L
CL
M H
CH
32
28
25
19
* Unified classification system.
plasticity índex mercases and shear strength decreases. As described
previously, the strength of clays, in eñective stress
terms,
is basically
frictional so
c =
0.
This
is
certainly
th e
case w ith rem oulded saturated
clays but
partially saturated clays, where meniscus
effects
draw
the
particles
together to produce inter-particle stresses, m ay appear to
have a
small
cohesión valué, though this itelf is a frictional
phenomenon.
Typical valúes of the angle of shearing resistance, 0 , for compacted
clays are
given
in
Table 6.3. Valúes
are for soils
compacted
to the
máx imum dry density according to the standard compaction test
(AASHTOT99,5.51brammermethod;orBS
1377:1975
test
12,2.5kg
rammer
method) .
6 4 SHEAR STRENGTH OF GR AN UL AR SOILS
Because
o f
their high perme ability, pore w ater pressures
do not build
up when granular soils are subjected to shearing forces, as
they
do
with clays. The com plicátion of total and effective stresses is therefore
avoided and the pheno m enon of apparent cohesión, or undrained
shear strength, does
no t
occur. Consequently,
the
she ar strength
o f
granular soils is defíned exclusively in terms of the frictional resistance
between the grains, as measured by the angle of shearing resistance.
Typical valúes
of the
angle
of
shearing resistance
fo r
sands
and
gravéis are given in
Table
6.4.
Typical valúes
for
compacted soils
are
given
in
Table 6.5. Valúes
refer to soil
com pacted
to
m á x i m um
dry
density
at
opt im um mois ture
content
as defíned in the standard compaction test: AASHTO T99
5.51b
rammer method)
or BS
1377:1975 test
12
2.5kg ramm er
method) .
A
relationship between
dry
density
or
relative de nsity
and the
angle
of shearing resistance is given by the US Navy 1982) , as show n in

7/18/2019 Correl Soils Properties Carter&Bentley
http://slidepdf.com/reader/full/correl-soils-properties-carterbentley 97/136
S H E A R
STRENGTH 9 1
ble
6 4
T Y P I C L V L Ú E S OF THE N G L E O F S H E R I N G R E S IS T N C E O F C O H E S IO N L E S S
S O I L S
Material
Unifo rm sand, round grains
Well-graded sand, angular grains
Sandy gravéis
Silty
sand
Inorganic
silt
Loóse
27
33
35
27-33
27-30
deg)
Dense
34
45
50
30-34
30-35
ble 6 5 TYPICAL V L Ú E S OF THE N G L E O F S H E R I N G R E S I S T N C E F O R C O M P C T E D
S ANDS
AND
G R A V E L S
So// description Class*
Angle
of
shearing
resistance, f > deg)
Well-graded sand-gravel mix tures
Poorly-graded sand gravel m ixtures
Silty gravéis, poo rly graded sand-gravel-silt
C layey gravéis, poorly graded san d-gravel-clay
Well-graded clean sand gravelly sands
Poorly-graded clean sands, gravelly sands
GW
GP
GM
GC
SW
SP
>38
>37
>34
>31
38
37
1 Unified classification
system.
O
O
c
o
50
O
• 40
a
c o
30
20
Material
type Unified classification)
Relative
density
1.2
1 4 1 6 1 8 2 0
Dry
density
-
t/m
3
Mg/m
3
)
2.2 2 4
Figure 6.13 Typical valúes ofdensüy an d angle o f shearing resistance o f cohesionless
soils modified after
US
Navy 1982)

7/18/2019 Correl Soils Properties Carter&Bentley
http://slidepdf.com/reader/full/correl-soils-properties-carterbentley 98/136
92
CORRELATIONS OF SOIL PROPERTIES
o
3
a
8
5
4
2
10
4
X
X
x
x
X
/
/
Relative density
Very
dense
Loóse
.
t*
ery
loóse A,
28 3 32 34 36
38
4 42
44 46
g of
shearing resistance °
Figure 6.14 Estimation
of the
angle
of
shearing resistance
of
granular soils from
standard
penetration test result after Peck
et
ai 1974)
Figure 6.13.
The
material types
indicated in the figure
relate
to the
Unified
classification
system . Peck et al. 1974) give
a
correla tion with
standard penetration test valúes, shown
in
Figure 6.14.
The
correla-
tion between
SPT
valúes
and
relative den sity
is
also
shown , enabling
a
comparison
to be
made with
the U S
Navy valúes.
Examination
of
Figures 6.13
and
6.14 show s reasonab le agreem ent
between the two correlations. H ow ever, considerable variation can
exist within each soil type, as indicated by Figure 6.15, which shows
plots
o f the
angle
of
shearing resistance against relative density
for a
number of sands.
6 5 L TER L PRESSURES IN A SOIL
MASS
Consideration
of
lateral pressures
is usu;-lly
associated with
the
design
of
retaining walls, basement walls pile foun datio ns
and
tunnels, where interest is centered on the m¿ iñ m um nd máximum
lateral
pressures
that
can
occur;
that is, on the
coefficients
of active
and passive pressure. Approximate solutions for active and
passive
pressure problem s can be obtained using the simple Cou lomb 1773)
wedge theory or by consideration of Mohr s circles of stress at failure
Rankine, 1857). The R ankine
approach
is still used for cohesive and
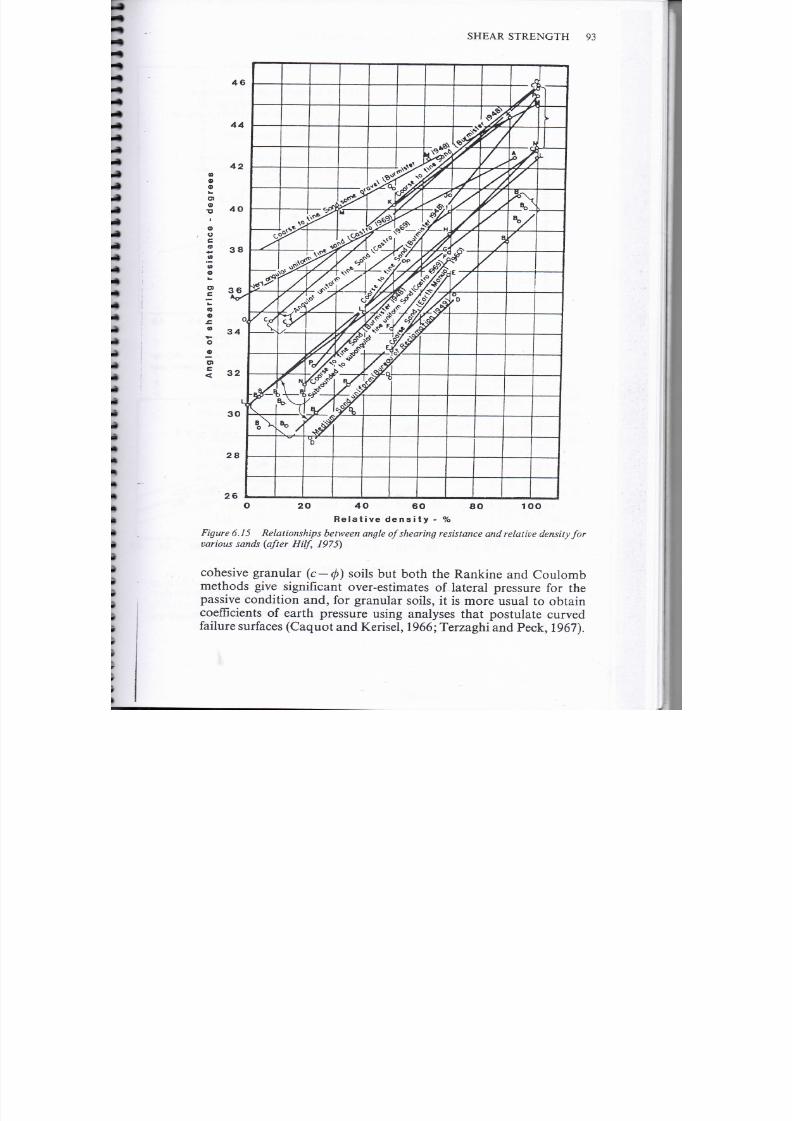
7/18/2019 Correl Soils Properties Carter&Bentley
http://slidepdf.com/reader/full/correl-soils-properties-carterbentley 99/136
S H E A R S T R E N G T H
93
<
e
o
O
O
e
20
O
60
Relativo density -
Figure 6.15 Relationship s beíween angle ofshearing resistance and
relaíive
density for
various sands after
Hilf,
1975)
cohesive granular c — < / > soils but both the Rankine and Coulomb
methods give
signifícant
over-estimates
of
lateral pressure
for the
passive condition and for granular soils, i t is more usual to obtain
coefficients
of earth pressure using analyses that postúlate curved
failure surfaces Caq uot and
Kerisel,
1966; Terzaghi and Peck, 1967).

7/18/2019 Correl Soils Properties Carter&Bentley
http://slidepdf.com/reader/full/correl-soils-properties-carterbentley 100/136
9 CORRELATIONS OF SOIL PROPERTIES
0.8
o
0 6
O
o
t_
O.4
o
O.2
U
D
Sangamon sand subang u la r )
•
W a b a s h s a n d s u b a n g u l a r )
O
Cha ta hooche e sand subangu la r )
Bras ted sand
o
Sand
Simons, 1958)
Belgium sand
4- Minnesota sand rounded)
X
Penn sy lvan ia sand angu la r )
O
28 30 32 34 36 38 40 42 44
Angle of shearing resistance, 0 - degrees
46
Figure 6.16
Correlation between th e coefficient of earth pressure at rest and the
angle of shearing resistance for normally-consolidated sands after Al-Hussaini and
Townsend,
1975}
0.8
K
n = 1 -
sin0 ±0.5
0.3
12 14
Ang le
of
s h e a r in g r e s i s t a n c e , 0 - degrees
Figure 6.17 Corre lation beíween the coefficient of earth pressure at rest and the angle
of shearing
resistance,
in
terms
ofeffective
stresses
after
Laddet al. 1977).
Key ío
data:
1) Brooker an d Ireland 1965), 2) Ladd 1965), 3) Bishop 1958), 4) Simons 1958),
5)
Campanella
and Vaid
1972),
6)
Compiled
by
Wroth 1972),
7)
Abdelhamid
an d
Krizek
1976)

7/18/2019 Correl Soils Properties Carter&Bentley
http://slidepdf.com/reader/full/correl-soils-properties-carterbentley 101/136
SHEAR STRENGTH 95
1.0
O
••
0.8
O
a
§ 0 6
m
0.4
o
ó 0.2
o
K
0
=
0.44 0.42 PI/100)
o
o o
•
Undisturbed
Disturbed or laboratory reconsolidated
from a
sediment
20 40 60 80
Plasticiiy
índex, Pl
100 120
Figure 6.18 Correlaíion between the coefficient ofearthpressure ai rest -
obtainedfrom
laboratory
tests and plasücily índex afíer Massarsch,
1979}
Active
and passive
pressures
represent the limit ing valúes of
lateral
earth pressure, w h e n
the
soil
has reached a
failure condi t ion ,
and
require a certain a mo unt of mo vem ent for pressures to at tain these
valúe s. This
can be of
practical impo rtance
in the
calculat ion
of
design
pressures behind rigid structures, such as strutted retaining
walls,
in
which
m ovem ent m ay
be
insufiícient
to
allow
the
soil
to reach a
passive state.
F or
such condit ions,
it is
useful
to be
able
to
est imate
t he
valué of hor izon tal s t ress in the un disturbed ground . This can not be
obtained from theoret ical considerat ions of limit equilibrium, as is
th e case fo r active and passive
pressures,
but
depends
on the
geological history o f the soil . H ow ev er,
using
an
approx imate
theory
Késdi , 1974
th e
coefficient
of
earth pressure
at
rest ,
K
Q
for a
normally-consolidated soil
can be
related
to the angle of
shearing
resistance:
This relat ionship has been found to
hold
t rue for normally-con-
solidated sands and clays, as indicated in Figures 6.16 and
6.17.
In
addi t ion, a relat ionship between K0 and plasticity
índex
has been

7/18/2019 Correl Soils Properties Carter&Bentley
http://slidepdf.com/reader/full/correl-soils-properties-carterbentley 102/136
96 C O R R E L A T I O N S O F
SOIL
P R O P E R T I E S
3
2 8
2 6
2 4
2 2.2
o
O
o
2.0
3
£ 1.8
a
£
C
9
°1 4
~ 1 2
Ü
6
0 4
i
T í
o Boston blue
clay, Pl=23
Ladd, 1965)
Brooker
and
ireland 1965)
Plasticity
índex
s
34 6 8 10
Overconsolidation ratio
2O 3O
Figure 6.19 Correlation between c oefficient
of
earth
pressure at
rest
and
overc onsolida-
tion ratio for clays of various plasicity índices data by Ladd, 1965, and Brooker and
Ireland, 1965; replotted by Ladd, 1971
obtained by M assarsch 1979), as shown in Figure
6.18.
The above
relationships are valid for normally Consolidated clays but for
overconsolidated clays the valué of
KQ
is heavily depend ent on the
overconsolidation
ratio. For
these clays,
K0 can be
estimated from
Figure
6.19
wh ich shows relationships between K
0 and
overconsoli-
dation
ratio
fo r clays of different plasticity
índex
valúes.

7/18/2019 Correl Soils Properties Carter&Bentley
http://slidepdf.com/reader/full/correl-soils-properties-carterbentley 103/136
Chapter
7
CALIFORNIA BEARING RATIO
7 1
TH
T ST
METHOD
The CBR
test
was
originally
developed at the
California División
of
Highways in the 1930s as parí of a study of pavement failures. Its
purpose was to provide an assessme nt of the relative stability of fine
crushed
rock
base
materials.
Later
its use was
extended
to
subgrades.
It
is now
widely used
for
pavement design
throughout the
world.
Ironically it was used for pavem ent design in California for only a
few
years
and was
superseded
by the
Hveem Stabilometer test.
During testing
a
plunger
is
made
to
penétrate
th e
soil which
is
contained
in a
standard
mould at a specified rate of
penetration.
The
resulting
load-deflection
curve
i s
compared
with
that obtained
for a
standard crushed rock. The test details ha ve been largely standar-
dized
and are
given
in the
AASHTO Standard Speciíications Test
T193
and in BS
1377:1975 Test
16 .
Slight variations exist between
th e
Am erican
and
British standards
but
these should have little
effect
on the CBR
valúes
and
arise purely
as a
result
of
converting
the
U.S.
specifícation to metric
units. However significant variations
in
sample preparation and test procedures can occur even within the
specifications. Th is can give rise to difficulties wh en comparing CBR
results from different sources. Table 7.1 show s some of the variations
between
methods.
The CBR
test
is
used exclusively
in
conjunction with pavement
design methods
and the
method
of
sample preparation
and
testing
must
relate
to the assumptions made in the design method as well as
to
assumed site conditions.
For
instance
th e
design method
m ay
assume that soaked CB R valúes are alw ays used regardless of actual
site conditions.
7.2
CO RRELATIONS WITH SOIL CLASSIFICATION
SYSTEMS
In view of the fact
that
early
pavem ent design methods were based
on
soil classification tests rath er trian
CBR
valúes
it
seems
a
reasonable
97

7/18/2019 Correl Soils Properties Carter&Bentley
http://slidepdf.com/reader/full/correl-soils-properties-carterbentley 104/136
98 C O R R E L A T I O N S OF SOIL P R O P E R T I E S
ble 7.1 V R I T I O N S OF T E S T
M E T H O D
FOR CBR T E S T
Density
The CBR is usually
quoted
for the assumed density of the soil in place. This
will
typically
be 90 , 95 or 100 dry density, as
specified
in either a standard
(2.5kg
rammer) or heavy (4.5kg rammer) compaction test .
Moisture contení
The aim is to test the specimen under the worst
likely
cond itions that w ill
occur
within
th e
subgrade.
In
practice, soil
is
usu al ly compacted
at
opt im um mois ture content ,
as
specified
in a
com paction test,
an d
then either tested imm ediately
or
soaked
for 4
days
before testing.
Surcharge
weights
Surcharge w eights are placed on the specimen before testing to simúlate the w eight of
pavement m aterials overlying
th e
subgrade.
In
practice,
3
w eights
are usually
used
b ut
this can vary . T he effect of the surcharge weights is more mark ed w ith granular soils .
Testing
top and bottom faces
It is usual A merican practice to test the bo ttom of the specimen w hereas in B ritain both
top and botto m faces are tested and the average take n. Since the top
face
usu ally gives a
lower CB R valué than th e bottom
face,
this variation c an significantly
affect
results.
Method
of
compaction
The AASHTO
specification
stipulates the use of dynam ic compaction
(using
a
rammer
but the BS specification allows the use of
static
compaction (using a
load
frame) or
dynamic compaction (using either
a
ram m er
or a
vibra t ing hamm er) .
Insitu valúes
If
tests
are
carried
out on
completed construction,
the
lack
of
confining
influence
o f the
mould an d drying out of the surface can affect results.
assumption that
CB R
valúes
are
related
to
soil
classification in
some
way.
However , CB R valúes depend not only on soil type b ut also on
density, moisture content and, to some extent,
method
of prepara-
tion. These factors must therefore be taken into account
when
considering correlations
between CBR and
soil cla ssification tests.
A num ber of attemp ts have been made to correlate CB R w ith soil
plasticity. A
correlation b etw een plasticity
Índex
and
C B R ,
for
design
purposes,
is
given
by the
Transport
and
Road Research Laboratory
(1970) ,
as
indicated inTable 7.2. This
is
based
on
wide
e-
perience
of
subgrade soil but is limited to British soils
compacte
at atural
moisture content according to the Ministry of Transport 1969)
specification. Thus, th e precise density and m oisture content condi-
tions
corresponding
to the given CB R valúes is not specified. This
severely limits the use of the
table
outside B ritain.
The valúes used b y the Transport and Road Research Laboratory
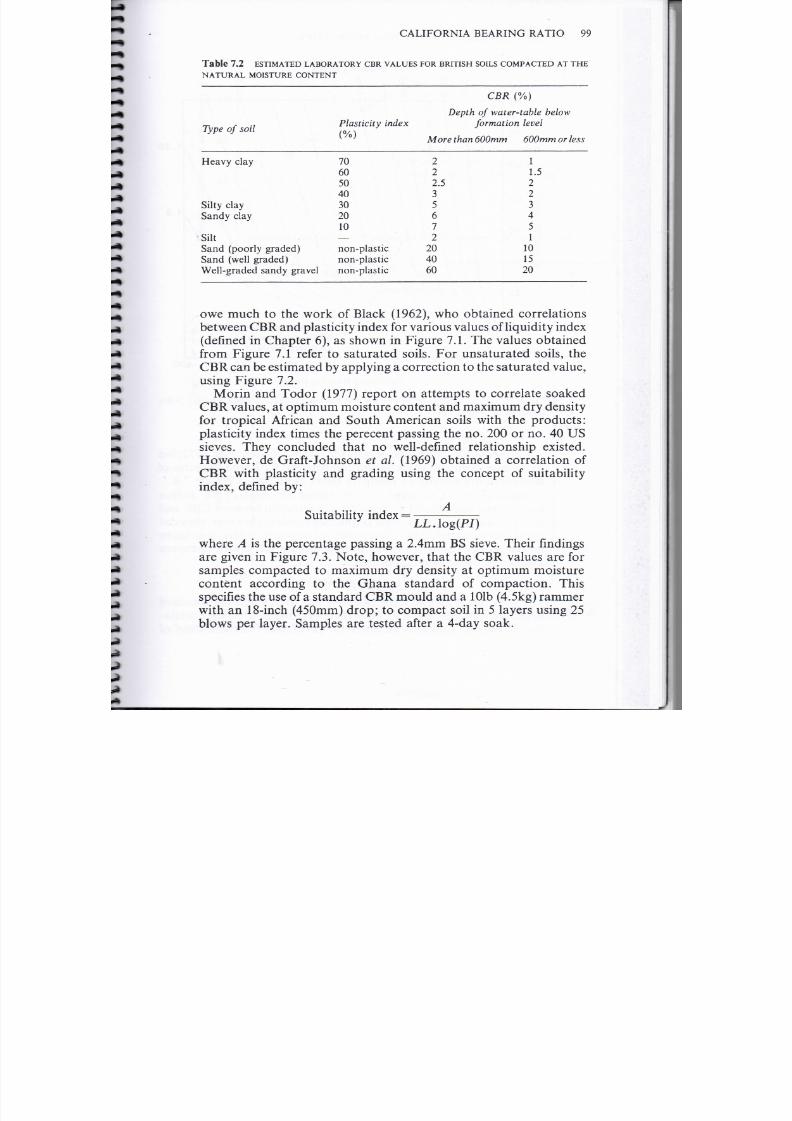
7/18/2019 Correl Soils Properties Carter&Bentley
http://slidepdf.com/reader/full/correl-soils-properties-carterbentley 105/136
C A L I F O R N I A B E A R I N G R A T I O
99
Table
7 2 E S T IM A T E D
L A B O R A T O R Y
C B R
V A L Ú E S
F O R
B R I T I S H S O I L S
C O M P A C T E D A T T H E
N T U R L M O I S T U R E C O N T E N T
C B R
( )
Ty pe
o f
soil
Plasticity
índex
D e pt h o f water table
below
formation level
More than
600mm
600mm o r less
Heavy clay
Silty clay
Sandy clay
Silt
Sand (poorly graded)
Sand
(well
graded)
W ell-graded sandy gravel
70
60
50
40
30
20
10
—
non-plas t ic
non-plast ic
non-plas t ic
2
2
2.5
3
5
6
7
2
20
40
60
1
1.5
2
2
3
4
5
1
10
15
20
ow e
m u c h
to the
w o r k
of
Black (1962),
w ho
obtained correlat ions
between
CBR and
plastici ty Índex
for
various valúes
of liquidi ty
Índex
(defined in
Chapter
6), as show n in
Figure 7.1.
The
valúes obtained
from Figure
7.1
refer
to
saturated soils.
For
unsaturated soils,
the
CB R can be estimated by applyin g a correction to the saturated valué,
using Figure 7.2.
Mor in
and
Todor
(1977)
report
on
attempts
to
correlate soaked
C B R
valúes,
at
op timum mo isture content
and
m á x i m u m
dr y
density
for tropical African and South American soils with the producís:
plasticity
índex
times
th e
perecent passing
the no. 20 0 or no. 40 US
sieves. They concluded that no
well-defíned
relat ionship existed.
However , de Graft -Johnson
et al.
(1969) obtained a correlation of
CBR
with plasticity
and grading
using
th e concept of
suitability
índex,
defined
by:
Suitabil ity
Índex
=
LL.log P/)
where A is the percentage passing a 2.4mm BS sieve. Their fmdings
are given in Figure 7.3. No te, how ever, that the CB R valúes are for
samples compacted
to
máximum
dry
density
at
opt imum mois ture
content according to the
Ghana
standard of compaction. This
specifies
the use of a standard CB R mould and a lOlb
(4.5kg)
ramm er
w i th
an
18-inch (450mm) drop;
to
compact soil
in 5
layers using
25
blows per layer. Samples are tested after a 4-day
soak.
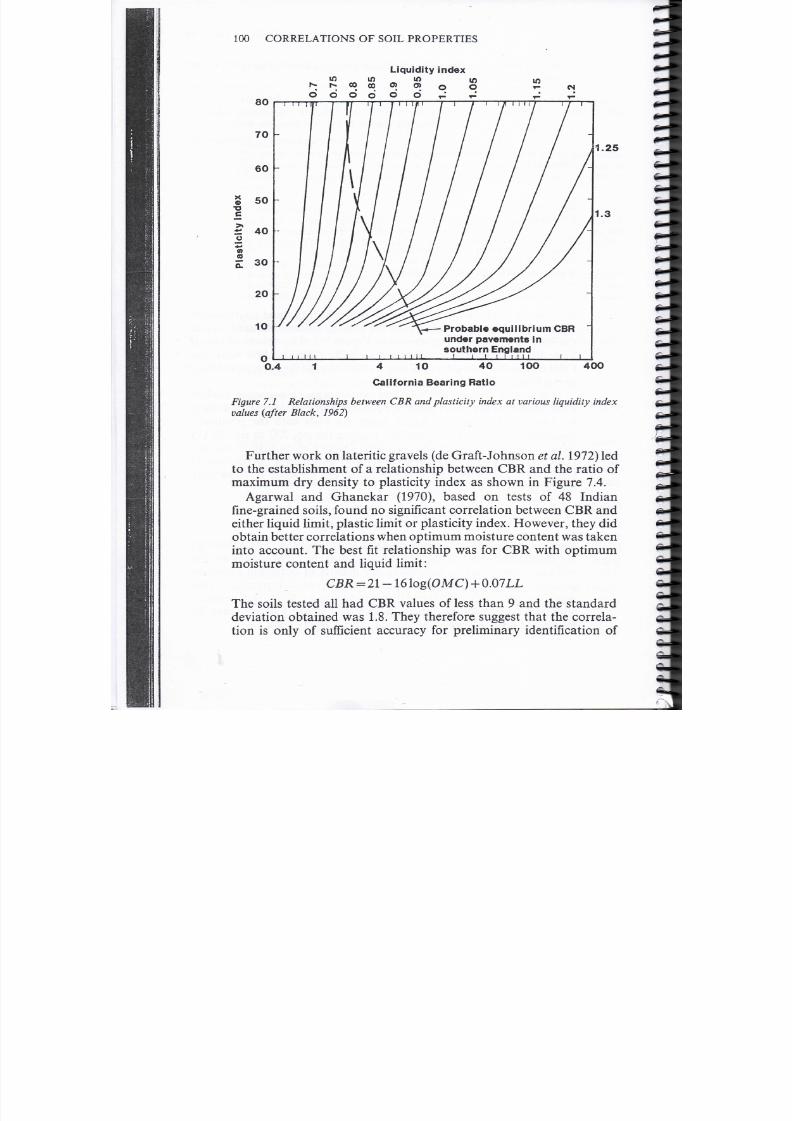
7/18/2019 Correl Soils Properties Carter&Bentley
http://slidepdf.com/reader/full/correl-soils-properties-carterbentley 106/136
100 CORRELATIONS OF SOIL PROPERTIES
iq ui i ty
índex
in
t í
N;
i» CO CO >
>
o O
O O O O O O* r-* T-
8
7O
6
5O
4
09
O
3
20
1
I 7 i
4
Probable •quilibrium
CBR
under
pavements
in
southern England
1
I I I I
I
1.25
1.3
4 10 40 1OO
California Bearing Ratio
40O
Figure 7.1 Relationships between CBR and plasticity índex at various liquidity
índex
valúes
after Black
1962)
Further work o n lateritic gravéis (de G raft- J o h n s o n
e t al.
1972) led
to the
establishmen t
of a
relationship between
CBR a n d t he
ratio
of
m á x i m u m
dry
de n s i t y
to
plastici ty Índex
as
s hown
in
Figure 7.4.
Agarwal an d Ghanekar (1970), based on tests of 48 I n d i a n
f ine-grained
soils,
f o un d n o
s ignif icant
correlation between C B R a n d
either
l iquid
l imit ,
plástic l imit
or
plast ici ty Ín dex. How ever, they
d id
obta in better correlat ions w hen opt imum mo isture con tent w as taken
into account .
T he
best
fi t
relat ionship
was for CBR
wi th o p t i m u m
m oi s t ure c on t en t
an d
l iquid l imi t :
T he
soils tested
all
had
C BR
valúes
of less
than
9 and the
s tandard
deviat ion obtained w as 1.8. T hey therefore suggest that th e correla-
t ion is only of sufficient accuracy fo r prel iminary
identif ication
of

7/18/2019 Correl Soils Properties Carter&Bentley
http://slidepdf.com/reader/full/correl-soils-properties-carterbentley 107/136
CALIFORNIA BEARING RATIO 1 1
100
80
5
60
4
20
o London
Clay
o
Brickearth Harmondsworth
• Black cotton soil Ngong
• Red coffee soil Thika Sagana
Unsaturated CBR = K X
saturated
CBR at
same
moisture
content
0.2
4
1.2
1.4
.6
0.8 1.0
Correction factor K
Figure 7.2 Correction of CBR valúes for
paríial
saíuration after Black, 1962
1.6
120
100
¿ o
8
i
O 6
40
20
O 2 3 4
Suitability índex S
Figure 7.3 Relaíionship beíween suitability Índex a nd soaked CBR valus after de
Graft-Johnson eí
al., 1969}
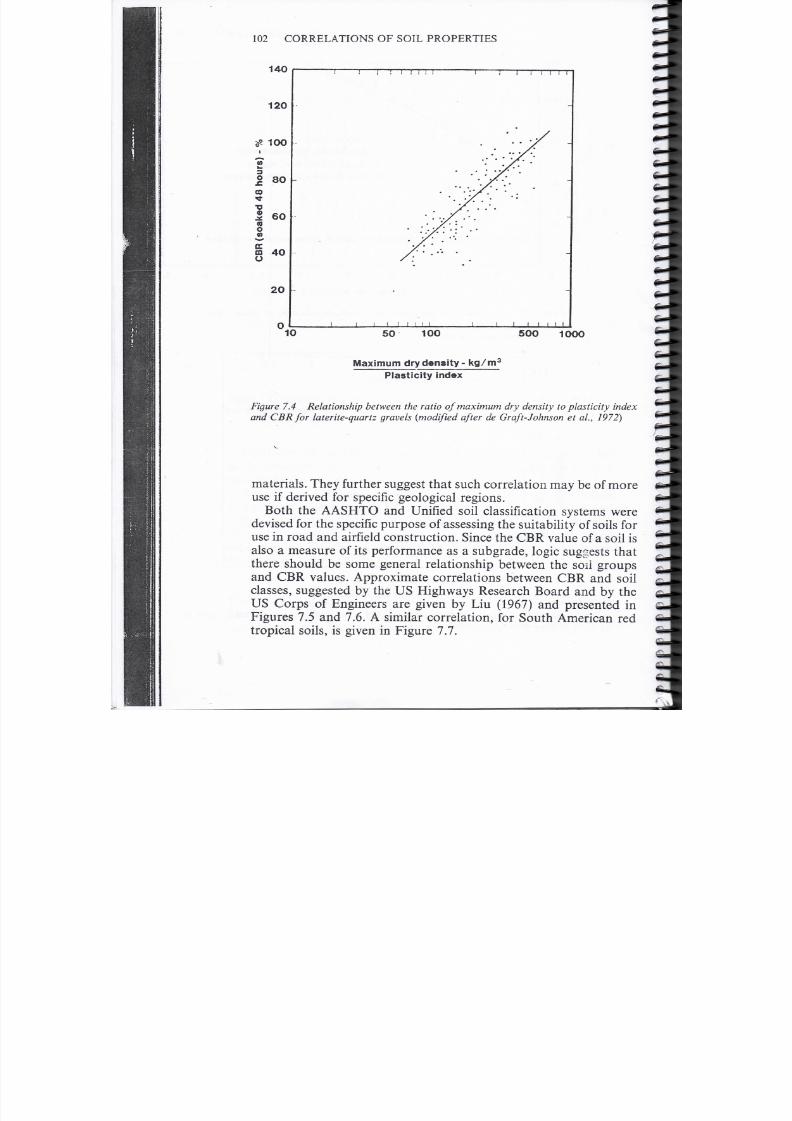
7/18/2019 Correl Soils Properties Carter&Bentley
http://slidepdf.com/reader/full/correl-soils-properties-carterbentley 108/136
102
C O R R E L A T I O N S
O F SOIL
PROPERTIES
140
2
1OO
O
3
¿C
8O
1 6
o
4
20
i l
1
l l
10
OO 10OO
Máximum
drydensity
kg/m3
Plasticity
índex
Figure
7.4
Relationship between
th e ratio
of
máximum dry densiíy lo plasticity
índex
an d CBRfor laterite-quartz gravéis modified after de Graft-Johnson et al., 1972}
materials. They fur ther suggest that such correlation m ay be of mo re
use if derived for
specifíc
geological regions.
Both th e A A SH T O and
Unifíed
soil
classification
systems were
devised for the specific purpose of assessing the suitability of soils for
use in road and
airfíeld
co nstru ction . Since the C BR valu é of a soil is
also a m easure of its perform ance as a subg rade, logic suggests that
there
should be some general relationship between the soil groups
and C BR v alúes. A p p roxim ate correlations betw een CB R and soil
classes suggested
by íhe US
Highways Research Board
and by the
U S Corps of Engineers are given by Liu 1967) and p resented in
Figures
7.5 and
7.6.
A
similar correlation,
for
South American
red
tropical soils, is given in Figure 7.7.

7/18/2019 Correl Soils Properties Carter&Bentley
http://slidepdf.com/reader/full/correl-soils-properties-carterbentley 109/136
C A L I F O R N I A B E A R I N G R A T I O 1 3
AASHTO
system
A - 1
A - 1 - a
b
A - 2 - 4
and
5
I
A - 2 - 6 and 7
A-3
A-4
A-5
A -6
and 7
GW
Unified system
em
S P a n
I <
GM
GC
SW
dSM
3P
ML
CL and CH
MH
OL and OH
2
4
6 8
1 15 2 3 4 6 8
Figure 7.5 Approximate relationships between soil classes and CBR valúes
after
Liu, 1967)
GM
[GW
GU
SP
ML CL
I su
sel
M H O L
[CH,OH
3 4
6 8 10 15 20 3O 40 60 80
Figure 7.6 Approximate relationships between
Unified
soil classes and CBR valúes
after
U S
rmy
Corps
of
Engineers, 1970)
A- 2 - 4
A-4
[A-2-6
A-5
A-6
A-7-5
A 7 6
6 8 10 15 20 30 40 60
8 1
150
Figure
7.7 Approximate relationships between
SHTO
soil classes and CBR valúes
for South American red tropical soils
after
Morin and Todor, 1975)

7/18/2019 Correl Soils Properties Carter&Bentley
http://slidepdf.com/reader/full/correl-soils-properties-carterbentley 110/136
104
C O R R ELA TIO N S
OF
SOIL PROPERTIES
7.3
CBR ND SHE R STRENGTH
The CBR test can be thought of as a bearing capacity problem in
m iniature, in w hich the standard plunger acts as a small
foundat ion.
Terzaghi's bearing capacity equation
for
circular fou ndation s
is:
where
c
Po
B
and
N
is the
cohesión
of the
soil
is
its bulk density
is the overburden pressure at the base of the plunger
is
the
diameter
of the
plunger
N
and
N
are
Terzaghi's bearing capacity factors.
For a saturated
clay
in undrained conditions, the angle of shearing
resistance, < / > (in terms of total stress) is zero. This gives bearing
capacity factors
of
J V
C
=
5.14
2
n),
N
a
=
l
and
N
v
= 0.
Thus,
the
third term in the equation
disappears
and, since overburden pressure
p
0
is
equal only
to the
relatively light pressure exerted
by the
surcharge weights,
the second
term
can
also
be
neglected.
The
equation thus reduces to:
This agrees
with
experience that the number of surcharge w eights
used affects the CBR valué for sands, for w hich
N
q is
much
greater,
but not for
clays.
Using
SI
units,
the CBR
valué
is
100
for a
plunger pressure
of
6900kN/m2 (10001b/in2) at a penetration of 2.5mm, giving:
4
u
x l O O
6900
= 0.09c
where
q
u and c are in kN/m
2
.
Work carried out by Black (1961) on single-sized sand and
correlations with other work fo r clay suggests
that
this approach
gives calculated CBR valúes that are cióse to m easured valúes for field
tests. Lab oratory CBR v alúes can be expected to be higher for sands
because
of the
restraining
iníluence of the
mould. Black (1961) also
sugests that,
when
calculating < j
u
the su stitu on:
c = s tan 0r
is used, where s is the soil suction and < ¿ > r is e true , ngle of internal
friction.
Since,
fo r
cohesive soils
the
true angle
oí
internal friction
can be
estimated from
th e
plasticity índex (see Figure
6.12),
this opens
up the
possibility of predicting both cohesión and CBR valúes from
plasticity Índex and soil suction valúes.

7/18/2019 Correl Soils Properties Carter&Bentley
http://slidepdf.com/reader/full/correl-soils-properties-carterbentley 111/136
Chapter
SHRINKAGE AND SWELLING
CHARACTERISTICS
Expansiva soils
are those tha t show a marked volume change with
increases and
decreases
of
mo isture
contení.
Such
swelling properties
are restricted to soils containin g clay minerals
which
are susceptible
to penetration of their chemical structure by water molecules.
Clay swelling and consequential g round heave is a common ann ual
phenomenon in áreas where prevailing climatic conditions lead to
signifícant seasonal wetting
and
drying,
th e
greatest
seasonal
heave
occurr ing
in regions w ith semi-arid climates wh ere pronou nced sho rt
wet
and
long
dry
periods lead
to
major moisture changes
in the
soil.
Moisture content changes may also res ult, in these regions and
others,
from
the activities of m an , such as, remov al of vegeta tion and
construction works.
8 1 IDENTIFICATION
The
simplest swelling
identification
test
is
called
th e free-swell
test
(Holtz and Gibbs 1956). The test is performed by slowly pouring
lOcm 3
o f dry
soil <42 5¿m i) into
a lOOcm3
graduated cylinder
fílled
with w ater, and observing the equilibrium swelled volume. Free swell
is
defined
as:
Final
vo lume) — I n i ti al
v o lume)
Free swell = \100( )
Initial volume
Table 8.1 gives
free
swelling data fo r some common clay minerals.
In field situations, the am oun t of swelling or shrinkage , or whe ther
any vo lum e change occurs at
all,
wiíl depend on a num ber o f factors,
such
as
moisture content changes, thickness
of the
deposit, initial
density, groundwater chemistry, confining pressures,
and
possibly
other
factors. However, commonly a fundamental
ingredient
is the
5
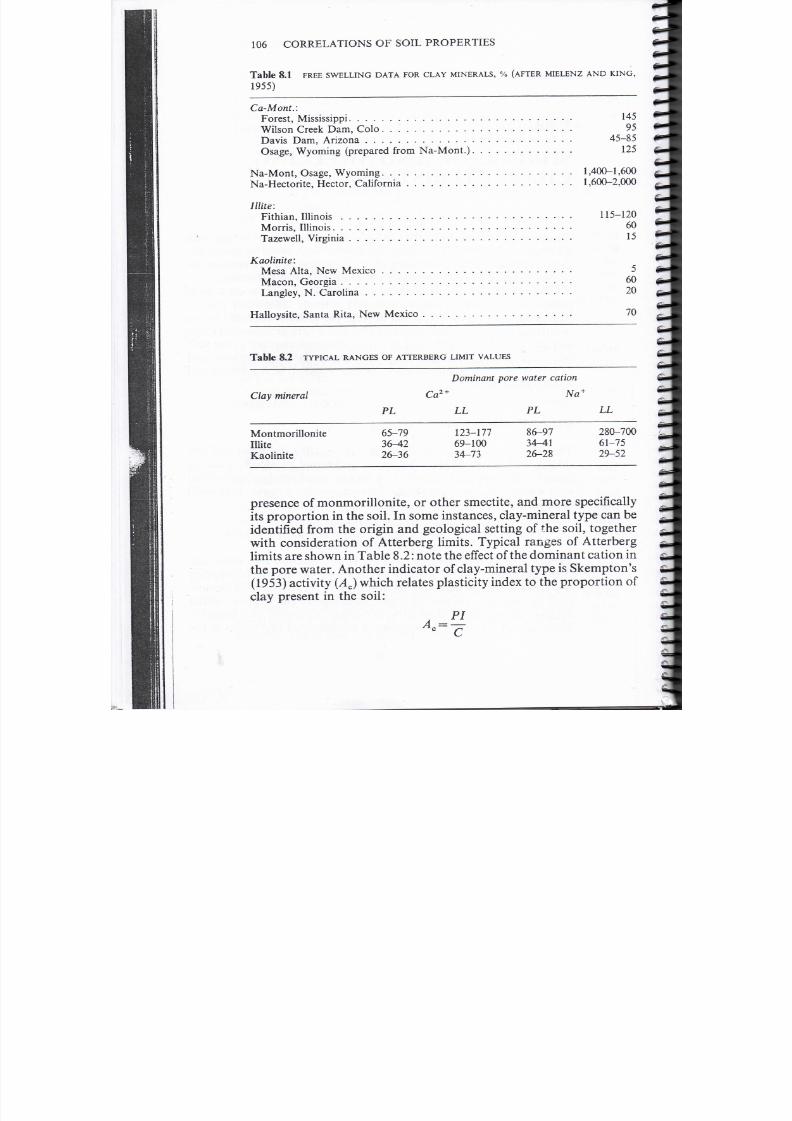
7/18/2019 Correl Soils Properties Carter&Bentley
http://slidepdf.com/reader/full/correl-soils-properties-carterbentley 112/136
10 6
CORRELATIONS
OF SOIL PROPERTIES
Table
8 1
F R E E
S W E L L I N G
D A T A
F O R
C L A Y M I N E R A L S ,
A F T E R M I E L E N Z
A N D
K I N G ,
1955)
Ca-Mont.:
Forest
Mississippi
W i ls on C r ee k D a m ,
Coló
D a vi s D a m , A r iz o n a
,
Osage
W y om in g
(prepared
f rom
N a - M o n t. ),
145
95
45-85
125
N a -M o n t , Osage W y om in g
1 400-1 600
N a-Hectorite , Héctor, California 1 600-2 000
I H ite:
Fithian, I l l inois .
Morris
I l l inois . .
Tazewell, Virginia
Kaolinite:
Mesa
A l ta ,
N e w M é x i co
Macón G e o rg i a
L a n g l e y , N. Carolina . .
Halloysite, Santa R ita , N ew M éxico
115-120
60
15
6
7
Table 8 2 T Y P I C A L R A N G E S O F A T T E R B E R G L I M I T V A L Ú E S
Clay mineral
PL
Dominant pore water catión
Ca2 Na*
LL PL LL
Montmoril lonite
Illite
Kaolinite
65-79
6
26-36
123-177
69-100
34-73
86-97
34-41
26-28
280-700
61-75
29-52
presence
of
m onm orillonite,
or
other smectite,
and
more specifícally
its
propo rtion
in
th e
soil.
In
some instances, clay-mineral type
can
be
identifica from the origin and geological se tting of the soil, tog eth er
with
consideration
of
A tterberg l imits. Typical tanges
of
A t te r b e rg
limits are sh ow n in Table 8.2: note the effect of the dom inant catión in
th e
pore w ater . A nother indicator
of
clay-mineral typ e
is
Skempton's
(1953) activity Ac) which relates plasticity índex
to the
proport ion
of
clay
present in the soil:

7/18/2019 Correl Soils Properties Carter&Bentley
http://slidepdf.com/reader/full/correl-soils-properties-carterbentley 113/136
S H R I N K A G E A ND S W E L L I N G C H A R A C T E R I S T I C S 107
where
C is the percentage f mer
th an 0.002m m .
Typical activity valúe s
are:
Sodium m ontm or i llon i te 7 .2
Calcium montmoril lonite 1.5
Illite
0.9 and
Kaolinite
0.33 0.46.
8 2 SWELLING POTENTIAL
An indication of the susceptibility of a
soil
to shrinkage or swe lling
due to decreases or increases in m oistu re content is provided by the
swelling potential test.
The
swelling potential
is defmed as the
percentage
swell of a
laterally confined sample which
has
been compacted
to
m á xi m u m
density
at
optimum mois ture conten t according
to the
standard
compaction
test
(BS 1377:1975 Test 12, 2.5kg ram m er m ethod or
AASHTO
T99, 5.51b ram m er m e thod) and then allowed to
swell
under a surcharge of 6.9kN/m2
(llb/in
2
) .
In order to give m eaning to the signifícance of swelling potential
valúes, descriptive
terms
are used for various ranges of swelling
potential, as indicated in Table 8.3.
Tabie J DESCRIPTIVE TERM S
FOR
SWELLING POTENTIAL
Swelling potential ( ) Description
0 1.5
Low
1.5 5 M é di um
5-25 High
25
+
V e r y high
8 2 1 Relation to other properties
The
sw elling poten tial test
is not
no rm ally carried out,
and a
n um b e r
of researchers hav e tried to correlate swelling potential w ith plasticity
índex . Since both the liquid an d plástic lim its and the sw elling
properties of a soil are governed by the am oun ts and types of
clay
minerals present,
it seems
reasonable
to
postúlate that such
a
correlation exists. Seed,
et al
(1962) established th e relationship:
— £r\ ÍDJ\2.4 4

7/18/2019 Correl Soils Properties Carter&Bentley
http://slidepdf.com/reader/full/correl-soils-properties-carterbentley 114/136
10 8
CORRELATIONS OF SOIL PROPERTIES
where
S
is the swelling potential
PI
is the plasticity Índex
and
K
is a
constant,
equal
to 3.6 x
10 ~5 .
This
equatio n applies to soils w ith
clay
contents of between 8 and
65 .
The calculated valué is pro bab ly accura te to
with in
about 33
of
th e laboratory valué. Al th oug h their resul ts are based on w ork wi th
artificial m ixtures
of
sands
and
clays,
the
correlation
has
been show n
to be
applicable
to
na tura l soils. Using
this
equation
and
allowing
for
th e possible 33 error in calculated valúes of swelling potential ,
ranges
of
plasticity
índex
valúes
may be obtained for the
various
classes
o f
sw elling pote ntial ,
as
indicated
in
columns
1 and 2 of
Table
8.4. Also indicated in the table are valúes suggested by Krebs and
Walker
(1971) .
A
correlat ion betw een swel l ing potent ial
and
plast ici ty Índex
w as
found by Chen
(1988),
based on
tests
of 321
undisturbed samples.
He
proposed:
where
=
0.2558
A
= 0.0838
and e is the
natura l num ber , 2 .718.
He
also
established a correlation of plasticity índex againt a
swelling
potent ial obtained
for a surcharge
pressure
of
48kN/m
2
(6.941b/in
2
). A comparison of various correlations between swelling
potent ia l
and
plasticity índex
is
shown
in
Figure 8.1. It should
be
noted that the Holtz and Gibbs
(1956)
correlation given in the figure
is not really comparable with the others s ince their volum e change
measurements
w ere carried out on air-dried specimens of undis turbed
soil.
T he
valúes given
in the chart are
therefore
not
strictly swelling
potential . This is discussed later in this section.
Table 8 4 I D E N T I F IC T I O N
OF
S W E L L I N G S O IL S B S E D
ON
P L S T IC I T Y I N D E X
Swelling potential
Plasticity
índex
Plasticity índex
Low (0-1.5 )
Médium (1.5-5 )
High (5-25 )
Very high (25 +
)
0-15
10-30
20-55
>40
0-15
15-24
25-46
>46
1 Based
on the
relationship given
by Seed el al
(1962).
2 Valúes according to Krebs and W alker (1971).
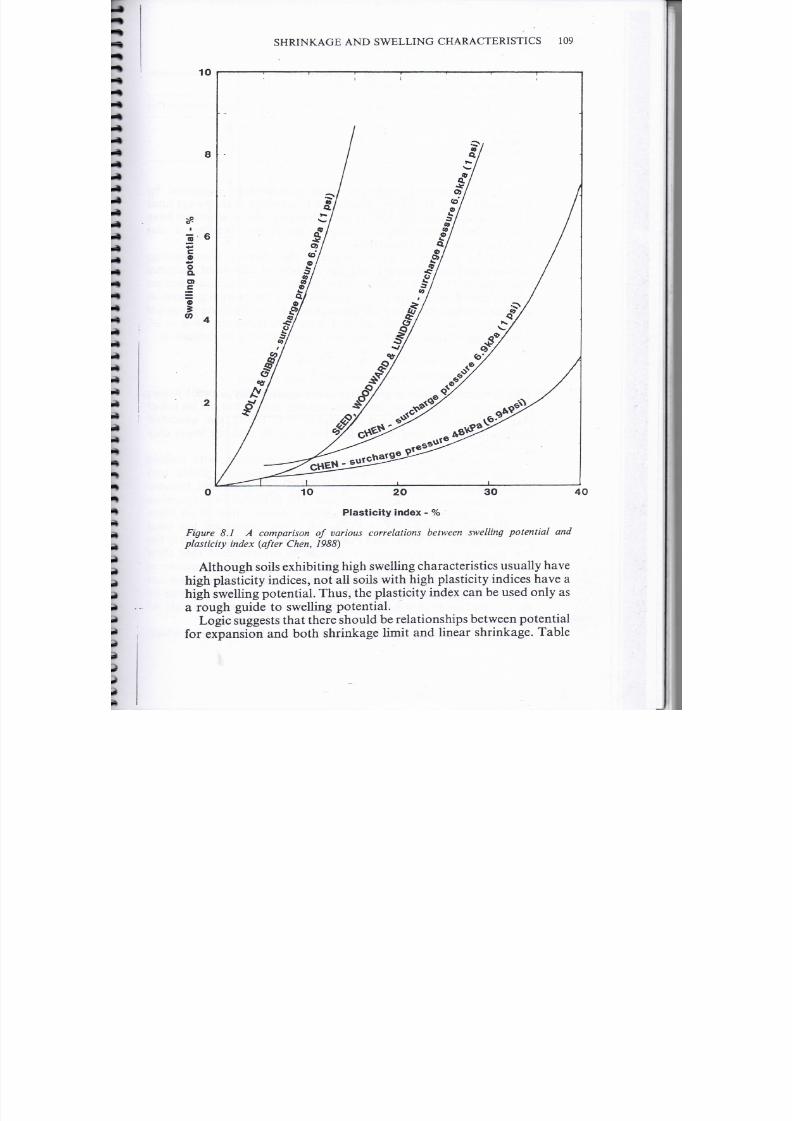
7/18/2019 Correl Soils Properties Carter&Bentley
http://slidepdf.com/reader/full/correl-soils-properties-carterbentley 115/136
S H R I N K A G E A N D
S W E L L I N G
CHARACTERI S TI CS 109
1
2
Plasticity índex
-
4
Figure 8.1 A comparison of various correlations between swelling
potential
and
plasticity índex after Chen, 1988)
Although
soils
exhibiting high swelling characteristics usually have
high plasticity Índ ices not all soils with high pla sticity Índices ha ve a
high swelling pote ntial. Thus the plasticity
índex
can be used on ly as
a
rough guide
to
swelling potential.
Logic suggests that th ere should be re la tionships between p otent ia l
for expansión
and
both shrinkage limit
and
linear shrinkage.
Table

7/18/2019 Correl Soils Properties Carter&Bentley
http://slidepdf.com/reader/full/correl-soils-properties-carterbentley 116/136
110
C O R R E L A T I O N S
O F SOIL
P R O P E R T I E S
ble 8.5
S U G G E S T E D C U I D E
TO THE
D E T E R M I N T I O N
OF
P O T E N T I L
FOR
E X P N S I Ó N
US ING S H R I N K A G E LIMIT
A N D
L I N E A R S H R I N K A G E
Potential for expansión
Shrinkage
limit
( )
Linear
shrinkage
( )
Critical
< 1 0
M arg in a l 10-12
Non-critical
>12
>8
5-8
0-5
8 .5
shows
a
general guide
for
these relationships suggested
by
Altmeyer (1955 ) . H owever , a l though
a
knowledge
of
shrinkage limit
is
useful
in assessing
potential
volum e changes, other researchers have
been unable to establish a conclusive correlation between it and
swelling
potential (Chen, 1988).
Work
by
Seed
et al
(1962) suggests that there
is a
correlation
between swelling potential and
trie
contení of clay-sized paríicles
(finer than 0.002mm). Unfortunately, the correlation includes factors
which
depend
on the type of clay
present.
They therefore suggested an
al ternat ive
approach using
the
concept
of
activi ty . Swelling potent ial
is
related
to
activity
as
shown
in
Figure 8 .2 . H owev er , Seed
et al
(1962) suggest that, when using this
figure,
activi ty
be defmed as:
A
Ac~C
This is because a
plot
of plasticity
índex
against clay
content
passes
through the origin for clay contents in excess of 40 but not for lower
clay
contents,
as
indicated
in
Figure 8.3. Using
th e
amended
definition helps to
compénsate
for
this,
for
soils with
the
lower clay
contents.
Holtz and
Gibbs
(1956) correlated volume change with colloid
content (defmed
as finer
than
0.00 I m m ) ,
plasticity Índex
and
shrinkage limit,
as
indicated
in
Figure 8.4. T hey suggest that, because
of
th e uncer ta in ty of the correlations, th e potential for expansión
should
be
assessed
by the
simultaneous consideration
of
all
three
correlations,
as
indicated
in
Table
8.6. Their procedure
has
been
adopted
by the US
W ater
and
Power R esources Service
(formerly the
US
Bureau
of
R eclamat ion) .
It
should
be
remembered that their
volume change measurements, whilst being
m a d e
at a pressure of
6.9kN/m
2 (llb/ in2) are for air-dried undisturbed soils and so are not
directly
comparable
with
th e
valúes
of
swelling
potential discussed
previously (see Figure 8.1). Also, their results are based on only 45
samples.
Figure
8 .5
shows
a
char t given
by
H oltz
and
K ovacs (1981) which
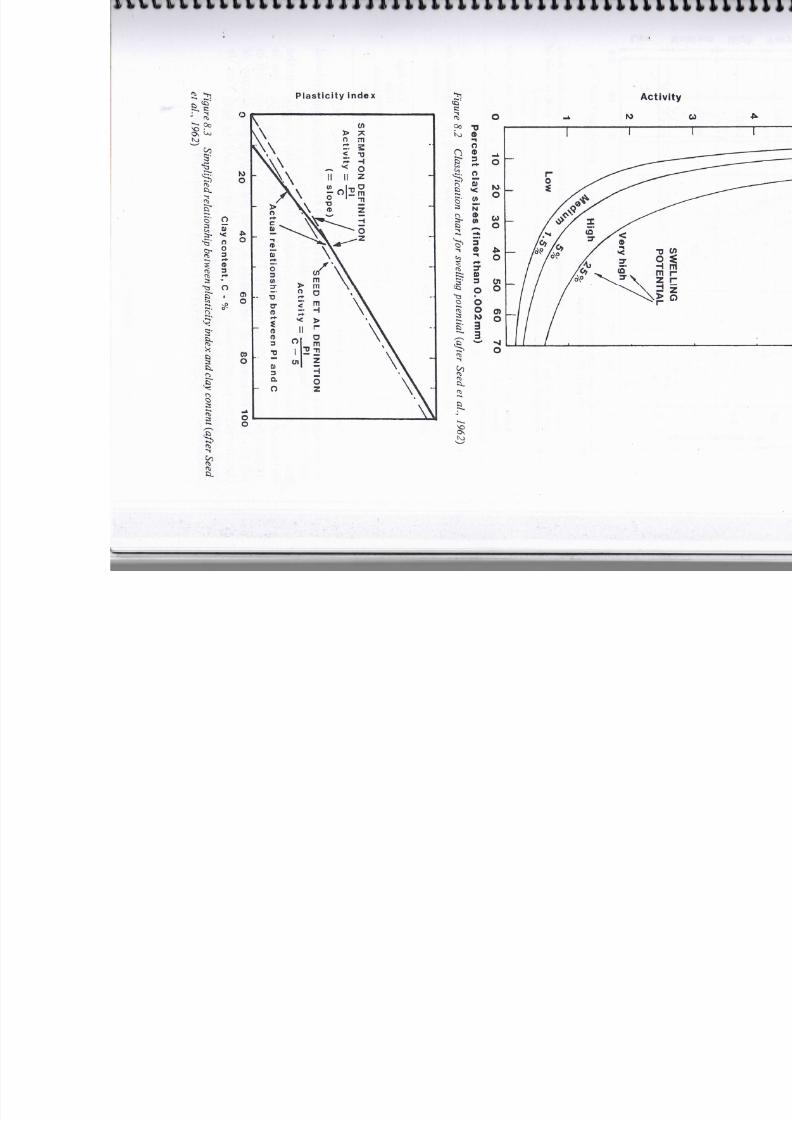
7/18/2019 Correl Soils Properties Carter&Bentley
http://slidepdf.com/reader/full/correl-soils-properties-carterbentley 117/136
Plasticity Índex
ctivit
'
O-
§
í
a
o
o

7/18/2019 Correl Soils Properties Carter&Bentley
http://slidepdf.com/reader/full/correl-soils-properties-carterbentley 118/136
112
C O R R E L A T I O N S
OF SOIL
PROPERTIES
o
40
32
4
16
8
40
uoiioid
contení
iess
than
O.OOlmm)
- mm
20 40 O 8 16 24
PSasiícíty
¡ndex
Shrinkag»
limit
-
Figure 8.4 Relationships beíween volume change and colloid contení, plasticiíy Índex
and
shrinkage limit, respectively
fo r
air-dry
to
saturated conditions under
a
load
of
6.9kN/m
2
Ipsí)
afíer
Holtz an d Gibbs, 1956)
Table
8 6 E S T I M A T I O N OF P O T E N T I A L V O L U M E C H A N C E S OF C L A Y S
A F T E R
H O L T Z AND
G I B B S 1956)
Data from Índex tests
Colloid
contení
fin r than
O.OOlmm
>28
20-31
13-23
<15
PI
SL
>3 5 <1 1
25-41
7-12
15-28
10-16
<18 >15
Probable expansión
total
volume
change*
>30
20-30
10-30
<10
Potential for
expansión
Very
high
High
Médium
Low
*Based on a loading of
6.9kN/m
2
(llb/in
z
).
gives a guide to the swelling and collapse susceptibility o f soils relate d
to
their liquid limit
and
in-situ
dry
density.
A more sophisticated
relationship
which can take im o account th e
change in moisture content
from
an initial valué to ituí ion is
presented
by
Weston(1980). This correlation,
established
foi soil
in
the Transvaal, is
essentially
a more fully
developed versión
of
previous relationships described by Williams (1957) and Van de
Merwe (1964). Swelling potential
is
given
by:
Swell
( ) =
0.000411
(WLWr4-17 (P)
0.386
1 2 33

7/18/2019 Correl Soils Properties Carter&Bentley
http://slidepdf.com/reader/full/correl-soils-properties-carterbentley 119/136
S H R I N K A G E
A N D
S W E L L I N G C H A R A C T E R I S T I C S 113
„
18
E
át
16
•o 14
12
1 O O O
8
Expansión
Collapse
2
4 6O
Liquid
H m i t
8
OO
Figure 8.5 A guide to the suscepübility to collapse o r expansión ofsoils,
based
on
liquid
limit
and insitu dry density after
Holíz
and Kovacs,
1981)
whe re
w ¡
is the ini t ia l
moi s tu r e con t en í
P is the
vertical pressure kN /m2) , under which swell
takes
place
a n d W Í S t h e
weighted
liquid limit defmed b y :
<0.425mm\0
where
LL
is the l iquid l imit
8 3 SWELLING PRESSURE
Once
a
potent ia l ly expan sive soil
has
been
identifíed
and a
q ual i ta t ive
indica t ion of the poten t ia l
swell
has been made , an ev aluat ion of the
swelling pressure
is
necessary
for
design purposes. Swelling pressure
can be determined from a one-dimensional oedometer test; a number
of variat ion s of this test ha ve been developed Jennings and Kn ight ,
1957;
Bu rlan d, 1975) but co mm on ly the specimen is
flooded
and the
load required to mainta in
constant
volume is recorded
(Fredlund,
1969).
Alternatively,
th e swelling pressure can be predicted from
empirical relat ionships wi th more rout inely measured parameters .
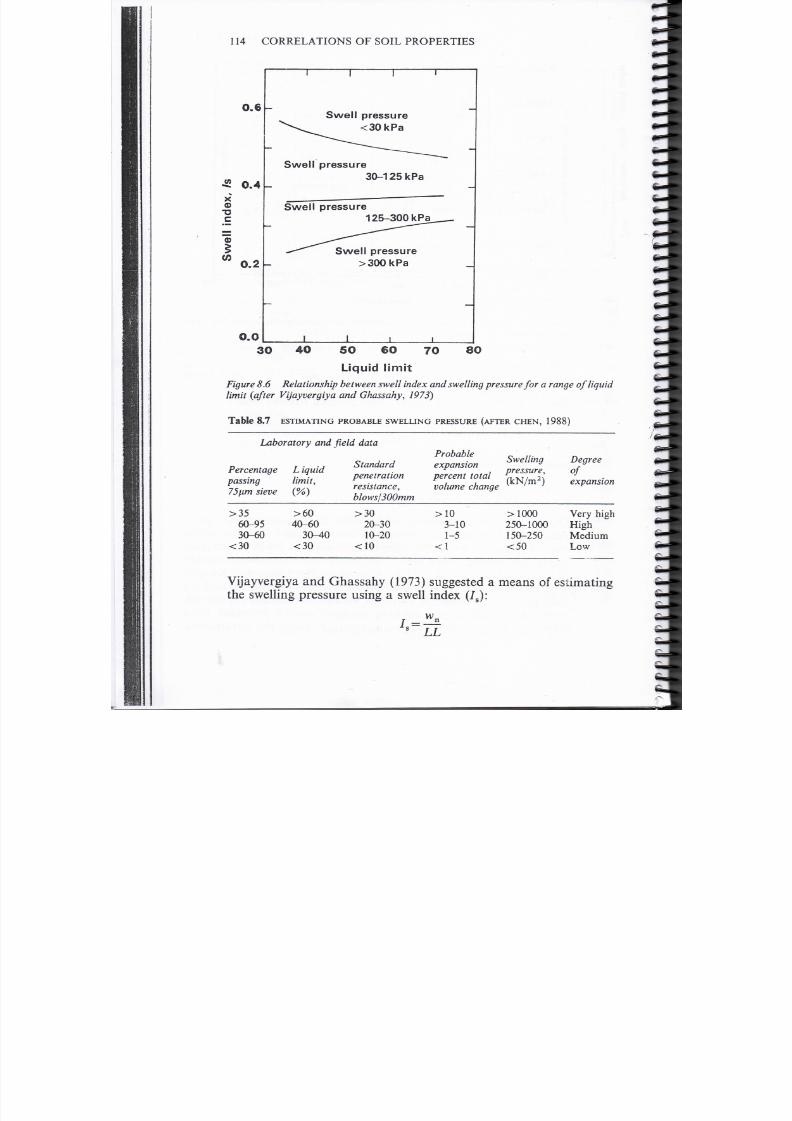
7/18/2019 Correl Soils Properties Carter&Bentley
http://slidepdf.com/reader/full/correl-soils-properties-carterbentley 120/136
114
CO RRE L A T I O N S
OF SOIL PROPERTIES
6
• 0 4
•D
C
3
C D
2
0 0
Sweil pressure
<30kPa
Swell pressure
30 125kPa
Sweil pressure
125 300
kPa
Swell
pressure
>300kPa
30
40 6
70
80
Liquid limit
Figure
8.6 Relationship between swell
índex
a nd swelling pressure for a range ofliquid
limit
after Vijayvergiya and Ghassahy,
1973)
ble 8 .7 E S T IM A T I N G P R O B A B L E S W E L L I N G P R E S S U R E A F T E R C H E N , 1988)
Laboratory and
jield data
Percentage
passing
75um siete
>35
60-95
30-60
<30
L
iquid
limit,
( )
>60
40-60
30-40
<30
Standard
penetraí ion
resisíance,
blows¡300mm
>30
20-30
10-20
<10
rnhflhlp
expansión
percent
total
volume
change
>10
3-10
1-5
<1
Swelling
pressure,
kN/m
2
)
>1000
250-1000
150-250
<50
Degree
of
expansión
Very high
High
Méd ium
Low
Vijayvergiya and Ghassahy 1973 ) suggested a means of esí imating
the swelling pressure using a swell índex
(/
s
):
LL
7/18/2019 Correl Soils Properties Carter&Bentley
http://slidepdf.com/reader/full/correl-soils-properties-carterbentley 121/136
S H R I N K A G E AN D SWELLIN G CH A RA CTERISTICS 115
where w n =
n atural w ater
contení
( ) and
LL = liquid limit.
The
relationship betw een
s an d swelling
p ressure, across
a
r ange
of
liquid limits, is show n in F igure 8.6. Based on experience w ith
expensive
soils
in the
Rocky Mountain
área
of the
United
States,
Chen (1988) suggested a
predictive
relation ship for sw elling pressure
using percentage of fines, liquid limit and the
standard
penetration
resistance,
as
given
in
Table 8.7. No te th at
th e 'probable expans ión
given in Table 8.7 is the sw ell ing poten tial for a coníming load of
48kN/m
2 (10001b/ft2), based
on the
premise that this
is a
typical
foundat ion
pressure
for light
s tructures.
During
th e
past decade
a
number
of
theoretical equations have
been developed for compu ting heave in expan sive soils. Mo st require
an evaluation of the sw elling pressure (Rama Rao an d Fredlun d,
1980; Fredlund et al 1980)
but
some
are
based
on
measurement
of
soil
suction (Snethen, 1980; Johnson, 1980).

7/18/2019 Correl Soils Properties Carter&Bentley
http://slidepdf.com/reader/full/correl-soils-properties-carterbentley 122/136
Chapter
FROST SUSCEPTIBILITY
Two
potentially damaging
e f fects are
associated wi th frost action
in
soils, the
e xpansión
and lifting of the
ground
in
win te r (frost he aving
and f rost
boiling)
and the
loss
of
be aring capacity d uring
the
spring
thaw.
Soils
that
display
one or
bo th
of these
mani f e s ta t ions
are
referred
to as frost susceptible , The
problem
of f rost
damage
is
wides pread: it
occurs
in te mpérate regions where the re is seasonal soil
freezing as well as in the high lati tude permafrost regions.
9 1
ICE SEGREGATION
Simple
free zing of in ters t i t ial wa t e r causes l i t t le ground uplift .
Frost
heave
occ urs to a
much
greater e xtent where water i s free to enter the
soil
and
migrate
to the
freezing
f ront.
At the
f reezing
front
layers
of
clear ice grow
parallel
to the ground surface by displacing the
overlying
soil layer. The migrating water must come largely
from
groundwater
below
the
layer
in
which
ice is
s egregat ing,
for ice and
frozen
ground
will e í fectively
p r even t
any
downward percola t ion
from
the
ground sur face .
Ic e
segregation
c an
occur ,
not only
where
the
freezing penetrales to saturated soils below the wa te r
table
but
also
when the f reezing front pene trates unsaturate d soils in the
capillary
fringe abo
ve the water table .
The
the rmodynamics
of
mois ture moveme nt
to the f ree zing front
are complex; a useful summary is given by Harris (1987). One
considera t ion
is the prese nce of films of unfroze: adsorbed wa t e r in
frozen
soils, separating soil
ic e f rom
soil
partéele, an d
enabling
particle-free ice lenses to develop (Tagaki
197S
.
Another
is the
concept
of
sec ondary frost he aving whic h involves
the
movement
of
moisture in a frozen fringe abo ve the 0°C isotherm (Miller, 1972;
Konrad
and
Morganstern, 1981). However,
for
practical purposes
the
mec hanism
o f
mois ture movem ent
can be
considered
to be
driven
by suc t ion pressure generated
by ice
g rowth
at the
freezing f ront .
116

7/18/2019 Correl Soils Properties Carter&Bentley
http://slidepdf.com/reader/full/correl-soils-properties-carterbentley 123/136
FROST
SUSC EPTIBILITY 117
Four
facto rs are of particular
signifícance
in
affecting
the
amount
of
ice
segregation during
soil freezing; the
pore size
of the soil, the
moisture supply,
th e
rate
of
heat extraction
and the confming
pressure. Th eory
and
observation
indícate
that
the
suction poten tial
of
soils and their susceptibility to ice segregation increáses as pore
size
decreases.
However,
th e
low
perm eability o f he avy clays m ay
restrict
water migration sufficiently to prevent
significant
ice segregation
(Penner, 1968).
Thus
highly frost susceptible soils possess pore size
distributions wh ich produce
an
optimum com bination
of
soil su ction
and permeability. In view of the cióse correspondence between pore
size and grain size, and the relative ease w ith which the latter may be
measured,
frost
susceptibility criteria based on soil textures are
frequently used.
9 2 GRA IN
SIZES
The freezing behaviour of soils with varying grain size distributions
has been the subject of m uch s tudy . Beskow (1935) show ed
that frost
heaving increáses rapidly
from
nearly zero
for
coarse sand
to a
máximum in the fine
silt sizes, from which
it
slowly declines
to
approach zero again
in
heavy clays.
For
engineering purposes
Beskow
proposed
a
división
of
soils into
non-frost
susceptible
and
frost
susceptible groups,
and
presented
an empiricaly
derived grading
(Figure
9.1).
This
m ay be simplified to a
general statemen t
that
coarse
and
médium sands
are
generally non-frost susceptible,
that
is ice
lenses do not normally develop w hen they freeze, whereas fine sands,
silts and all but the
heaviest clays
are
frost susceptible
and are
subject
to considerable ice lensing during
freezing,
providing a water supply
is
present. Glossop and Skem pton (1945) observed that
well sorted
soils
in w hich less than 30 of the particles are silt size are non-frost
heaving.
Casagran de (1932) suggested tha t
the
particle size critical
to
soil
heave is 0.02mm : if the proportion of such
particles
is
less than
1 , no
heave
is
expected,
but
considerable heaving
m ay
occur
if
this
amount
is o
ver
3 in
non-uniform soils
and o ver 10 in
very
uniform
soils. The
influence
of the <0.02mm fraction was also
demonstrated
by
Kaplar (1970)
for
gravelly sands w here
the
coarser
fraction was
progressively remo ved. F igure
9.2
shows
th e
relation-
ship between average rate
of
heave
(mm/day) and the
percentage
finer
than 0.02mm; these results were obtained und er
specific
laboratory
conditions
and
they should
only be
used
as a
guide
to the field
response. A qualitative
classification
of frost
susceptibility based
entirely on grain size and used in Sw edish
practice
(Hansbo, 1975) is
given
in Table 9.1.

7/18/2019 Correl Soils Properties Carter&Bentley
http://slidepdf.com/reader/full/correl-soils-properties-carterbentley 124/136
Average
rate
o
heave
m m d a y
Percent
p
,-«.
o
ti
Ü
C J
«
5
2
2
O
<3
§
sx
3
«>
t
U
S
V;
?
a
a
B
S
» -
» ^
C3-
5
EX
2
u
5
o
í
N

7/18/2019 Correl Soils Properties Carter&Bentley
http://slidepdf.com/reader/full/correl-soils-properties-carterbentley 125/136
FROST
SUSCEPTIBILITY
11 9
Table 9 1 F R O S T S U S C E P T I B I L IT Y O F
S O I L
G R O U P S : S W E D I S H P R A C T I C E A F T E R H A N S B O ,
1 9 7 5 )
Group
I
II
Frost susceptibility
or
danger
None
Modéra te
Soils
G rave l, sand ,
Fine clay (>4
gravelly tills
0 clay f conten í ) ;
I I I
Sírong
sandy tills, clayey t i lls wi th
>16 fines
1
Silt, coarse clay
(clay
f content
15-25 );
silty tills
f
Defined as 2/j .m.
Defined
sO . O ó m m .
Reed
et al.
(1979) noted that predict ions
from
grain size distribu-
tions failed to take account of the fact that soils c an exist at
different
states
of den sity and therefore porosity, yet they hav e the sam e grain
size
dis t r ibut ion .
They derived expressions for pred icting
frost
heave
Y ,
in m m / d ay ) , and one of their sim pler expressions, based on pore
diameters, is:
Y
=1.694(D
40
/D
80
)-
0.3805
where
D40
and D
80
are the pore diam eters whereby 40 and 80 of
the pores are larger respectively.
9 PLASTICITY
Frost susceptibil i ty tends
to b e a feature of
silty
and
sandy clays, that
is, soils of low to m édiu m plastici ty. Table 9.2 gives a correlation of
Table 9 2 P R E L I M I N A R Y I D E N T I F I C A T I O N O F F R O S T S U S C E P T I B L E S O I L S
Permeability rating
Identification
Frost susceptibility
High permeabi l i ty
Intermedía te
permeabi l i ty
Low
permeabi l i ty
Granular:
< 10 finer
than
5um
G r a n ul a r:
> 10 finer
than
5um
Cohesive:
PI<20
Cohesive:
PI>20
Not susceptible
Susceptible
Not
susceptible

7/18/2019 Correl Soils Properties Carter&Bentley
http://slidepdf.com/reader/full/correl-soils-properties-carterbentley 126/136
V«ry
Hlfh
Hlfh
Madlum
Low
Very
L ow
30.0
ravolly SAND, SW
Clayey
QRAVEL. QM-QC
QRAVEL,
QM-QC
Loan CLAY, CL
Clay«i
QRAVEL
Sandy
QRAVEL
QP
SANOS
SM-8C
and SC
I l tyQRAVELS
Gravo ly
and
Sandy
CLAYS
CL
SW-SM,
SP-SM
/and
SM
h«av« 1 o O
du«
to
Sandy
QRAVELS
In
« I t u
1920
fraozing
o f
por» water
10
P«rc«ntag fln r than 0-02mm
100
«aturatlon
r
igure 9.3 Average rate ofhe^e plotted against
per
centage finer than 0.02rv°nfrom
labor atory tests
of a
range of M r
al
soils after Kaplar, 1974

7/18/2019 Correl Soils Properties Carter&Bentley
http://slidepdf.com/reader/full/correl-soils-properties-carterbentley 127/136
FROST SUSCEPTIBILITY 121
Table 9 F R O S T
S U S C E P T I B I L I T Y
O F S O I L S
R E L A T E D
T O
S O IL C L A S S I F I C A T I O N A F T E R
us
A R M Y
C O R P S O F E N G I N E E R S A N D K R E B S A N D W A L K E R
1971
Group
Description
Fl
Gravelly
soils:
3-20
finer
than
0.02mm
F2
S a n d s : 3-15
finer
than 0.02mm
F3 (a) Gravelly soils:
>20
finer t h a n 0.02mm
(b ) Sands (except silty fine s a n ds ) : > 15 f iner t h a n 0.02mm
(b )
Cla y s:
PI>12
(c) Varved
clays:
w i t h uniform conditions
F4 (a) Silts : including sandy
silts
(b ) Fine silty sands: > 15 finer than 0.02mm
(c)
Lean clays:
PI<12
(d) Varved clays: with non-uniform condit ions
frost
susceptibility and
permeab i l ity w ith grading
and
plasticity
Índex
suitable for preliminary
identification
based on recommendations
by the Tran sp o r t and Road Research Laboratory (1970). A similar
classification sys tem (T able 9.3) involving grading and plasticity w as
established by Linell
et al
(1963) and is used by the U.S. Corps of
Engineers
to
assess
frost
susceptibil i ty
for
pavement design. Once
again th e critical particle size is given as 0.02mm. T he
groups
are in
order of increasing frost suscept ibi l i ty , with group F 4 soils being
particularly
frost
susceptible. A
relationship
show ing the average rate
of heave
(mm/day )
for a
range
of
soil gro up s ,
defined by the Unified
system, is given in Figure 9.3.
Migrat ion of water and frost heaving are
also
influenced by the
mineralogy
of the clay
fraction.
Clay
minerals with
expandable
s t ructures are
able
to
hold
more water but the water is relatively
immobile
compared with
non-expandable
clay minerals. Conse-
q uent l y , strong frost heaving
is
more likely
to be
associated w ith soils
where the fines are devoid of montmori l lomite and related minerals.

7/18/2019 Correl Soils Properties Carter&Bentley
http://slidepdf.com/reader/full/correl-soils-properties-carterbentley 128/136
R F R N S
AASHTO, 1982. Standard
specifications
fo r transportador materials and methods of
testing
and sampling. American Association of State Highw ay and Trans portatio n
Officials.
ASTM, 1970. Standard test method f or
classification
of
soils
for engineering purposes.
American Association for Testing and M aterials, ASTM Designation D2487-1969.
Abdelhamid, M. S. and Krizek, R. J., 1976. At rest lateral earth pressure of a
consolidating
clay. Proceedings of ASCE Journal ofthe Geotechnical Engineering
División
102:
721-738.
Agarwai,
K. B. and Gh ane kar, K . D., 1970. Prediction o f CBR
from
plasticity
characteristics
of
soils. Proceedings of 2nd South-east Asían Conference on
Soil
Engineering Singapore,
571-576.
Al-Hussaini, M. M., 1977. Contribution to the engineering soil classification of
cohesionless soils. Final repo rt, misce llaneous paper S-77-21, U.S.
A r my
Engineer
Waterways Experimení
Station, Vicksburg, Mississippi, 70pp.
Al-Hussaini, M. M. and Townsend, F. C., 1975. Investigation of K0 testing in
cohesionless
soils.'
Technical Report S-75-11, U.S. Army Engineer Waterways
Experimental Station, Vicksb urg, Mississippi, 70pp.
Altmeyer, W. T.,
1955. Discussion
of
engineering properties
of
expansive
clays.
Proceedings ASCE Journal
of
Soil Mechanics and Foundation División 81 .
Atterberg, A.,
1911.
Lerornas
fórhallande
till
vatten, deras plasticitetsgránser
cch
plastiitetsgrader (The beh aviou r of clays
with
wate r, their limits of plasticity an d
their degrees
of
plasticity). Kungliga Lantbruksakademiens
Handlingar
oc h Tidskrift
50(2): 132-158; also in International Mitteilungen fü r Bodenkunde 1: 10-43.
Azzouz, A. S., Krizek, R. J. and Corotis, R. B., 1976. Regression analysis of soil
compressibility. Soils and Found ations 16(2): 19-29.
BS
1377, 1975. Methods
of
test
fo r
soils
fo r
civil engineering purposes, British
Standards Institution.
BS 5930,1981. Code of practice for site investigations. British Standards Ins titutio n.
BSI
1957. Site Investigation. British Standard
Code of
Practice,
CP
2001.
Beskow, G., 1935. Soil freezing an d frost heaving with special application to roads and
railways. Swedish Geotechnical Society, Series
C, no.
375.
Bishop, A. W., 1958. Test requirem ents of me asuring the coe^cient of earth pressure at
rest.
Proceedings
of Conference on
Earth Pressure
Problt
is, Bru;¿ els, 1:
2-14.
Black, W. P. M., 1961. The calculation of laboratory and i n s i t M valúas of Californ ia
bearing ratio
from bearing
capacity data.
Geotechnique
11 -21
Black, W. P. M., 1962. A method o f estimating the CBR of cohesi „ soils, ai piasticity
data. Geotechnique
12:
271-272.
Bjerrum, L., 1954. Geotechnical properties of Norwegian marim. clays. Geotechnique
4:
49-69.
Bjerrum, L., 1972. Embankments
on
soft ground.
Proceedings
o f
SCE Specialty
Conference
on
Performance
of Earth an d Earth-Supported Structures Purdue
University,
2:
1-54.
7/18/2019 Correl Soils Properties Carter&Bentley
http://slidepdf.com/reader/full/correl-soils-properties-carterbentley 129/136
REFERENCES 123
Bjerrum, L. and Simons, N.
E.
1960. Comparison of shear stre ngth characteristics of
normally Consolidated
clays.
Proceedings ofthe
ASCE Research Conference on
the
Shear Strength of
Cohesive
Soils
Boulder:
711-726.
Bowles,
J. E ., 1982. Foundation Ana lysis and Design. McG raw-H ill, Singapore, 816pp.
Bozozuk,
M. and
Leonards
G. A .,
1972.
The
Gloucester test
fill. Proceedings ofthe
Earth
and
Earth-Supported Structures Purdue University, 1: 299-317.
Brooker, E.W. and Ireland, H.
O.
1965. Earth pressures at rest related to stress
history. Canad ian Geotechnical Journal 2: 1-15.
Burland,
J. B. 1975. Discussion.
Proceedings
ofóth
Regional
Conference
fo r
África
on
Soil
Mechanics and
Foundation Engineering 1: 168-169.
Campanella, R. G. and Vaid, Y. P., 1972. A simple
K 0- t riaxial
cell. Canadian
Geotechnical Journal 9: 249-260.
Caquot, A. and Kerisel J. 1966. Traite de Mechanique des Sois Gauthier-Villars,
París 509pp.
Cárter, M. 1983. Geotechnical Engineering Handbook. Pentech Press, London, 226pp.
Casagrade, A ., 1932a. Discussion on
frosí
heaving.
Proc.
Highways
Research Board
12 : 169.
Casagrande,
A .,
1932b. Research
on the A tterberg
limits
of
soils.
Public Roads
13(8):
121-136.
Casagrande A., 1948. Classification and identificaíion of soils. Transact ions ASCE
113:
901-932.
Casagrande, A. and Fadum R. E., 1940. Notes
on
soil testingfor engineering purposes.
Harvard University
Gradúate
School of Engineering, pu blication 268.
Castro G. 1969.
Liquefaction
ofSands. Ha rvard Soil Me chanics Series, No. 81 112pp.
Chen F. H. 1988. F oundations on E xpansive Soils. Developm ent in Geotechnical
Engineering
no. 12, Elsevier, Amsterdam, 280pp.
Cou lom b, C.A., 1773 (1976). Essai sur u ne application des regles de max im us et
minimus á
quelques problémes
de
statique,
relatifs á
l architecture. M émoies
de
Mathématique et de Physiqu e, Presentes a l Académie R oyale des Siences par divers
Savns,
et
lüs
dans
ses
Assemblées
París
7:
343-382
(Volume
for
1773 published
in
1776).
de Graft-Johnson, J. W. S. and Bhatia, H. S. 1969. The engineering characteristics of
the lateritic gravéis of Ghana. Proceedings of
7th
International Conference on Soil
Mechanics
and
Foundation Engineering México, 2: 13-43.
de G raft-Johnson, J. W.
S.
Bhatia, H. S. and Yaboa, S. L. 1972.
Influence
of geology
and physical properties on strength characteristics of lateritic gravéis for road
pavemenís. Highway Research Board Record 4 5: 87-104.
ESOPT.
1982.
Proceedings of 2nd European
Symposium
on Penetration Testing
Amsterdam.
Edén W. J.
1971.
Sample
triáis
in overconsolidated sensitive clay. In:
Sampling ofSoil
an d Rock ASTM special technical publication no. 483.
Flaate
K. and
Preber
T.
1974. Stability
of
road embankm ents.
Canadian Geotechnical
Journal
11: 72-88.
Fredlund,
D. G.
1969. Consolidometer test precedural factors affecting
swell
proper-
ties.
Proceedings
of 2nd
International
Conference
on
Expansive Clay Soils Texas
435-456.
Fredlund
D. G. Hasan J. U. and Filson H. L.
1980.
The
prediction
of total
heave.
Proceedings
of
4íh
International Conference on Expansive Soils 1-17.
Gibbs H.J., 1969. Discussion on expansive soils and m oisture movement in partially
saturated soils. Proceedings of7th International
conference
on Soil Mechanics and
Foundation
Engineering.
México City.
Gibbs H. J. and Holtz W.
G.
1957. Research on determining the density of sand by

7/18/2019 Correl Soils Properties Carter&Bentley
http://slidepdf.com/reader/full/correl-soils-properties-carterbentley 130/136
124 C O R R E L A T I O N S
OF SOIL
PROPERTI ES
spoon
penetration
testing.
Proceedings of
4th
International
Conference on Soil
Mechantes and
Foundation Engineering
London,
1: 35-39.
Gibson,
R . E.,
1953. Experim ental
determ ination of the
tru e cohesión
and
true angle
of
internal
friction
in clays. Proceedings of 3rd International Conference on Soil
Mechanics
and
Foundation Engineering Zurich, 126-130.
Glossop,
R. and Skem pton, A. W.
1945. Particle size
in
silts
an d
sands.
J.
Inst.
C ivil
Engineers 25:
81-105.
Gregg,
L. E., 1960. Earthworks. In: K. B. Woods Editor), Highway Engineering
Handbook, McGraw-Hil l .
Hansbo,
S.,
1975.
Jordmatariallára.
Almquist
an d
Wiksell Fórlag
AB,
Stockholm,
218pp.
Harrison,
J. A.
1988. Using
the BS
cone penetrometer
for the
determination
of the
plástic limit of soils. Geotechnique 38 :
433—438.
Harris, C. 1987. Mechan isms of mass mov em ent in periglacial env ironm ents. In: Slope
Stability
Eds. M. G. Anderson and K. S. R ichards) , John Wiley, 531-560.
Hazen, A., 1911. Discussion of Dams on Sand Foundations. Transactions ASCE 73:
199-203.
Hilf,
J.
W.,
1975. Compacted
Fill. In: H. F.
Winterkorn
and H. Y.
Fang
Editors) ,
Foundation Engineering Handbook. V an N os t rand Reinholcí.
Holtz, R. D. and Broms, B. B., Sweden.
Proceding
o f ASCE Speciality Conference
on
Performance of
Earth
and Earth-Supported Structures Purdue Universi ty, 1:
435-464.
Holtz, R. D. and Holm, G., 1979. Test em ban km ent on an organic silty clay.
Proceeding
oflth
European
Conference on
Soil Mechanics
and
Foundation Engineer-
ing
Brigh ton , 3: 79-86.
Holtz, R. D. and Kovacs, W. D., 1981. An Introduction to
Geotechnical
Engineering.
Prentice-Hall,
New Jersey, 733pp.
Holtz, W. G. and Gibbs, H .
J.,
1956. Engineering properties of expansive clays.
Transactions
ASCE 121:
641-677.
INSITU.
1986. Proceedings
o f
ASCE Speciality
Conference.
INSITU
86 ,
Blacksburg.
ISOPT. 1988.
Proceedings of Is t International Symposium on Penetration Testing
Orlando.
Jennings, J. E.B. and Knight, K. 1957. The
prediction
of total heave
from
the double
oedometer test. Trans.
S.
Afr. Instn. Civ. Engrs.
7:
285-291.
Johnson, L.
D.,
1980. Field test sections on expansive
soil.
Proceedings of 4th
International Conference on Expansive Soils.
Joslin, J.
G.,
1959. Óhio s typical mois ture - de nsity curves. Symposium
on
A pplication
of
Soil Testing in Highway Design an d Construction
ASTM Special
Technical
Publication, 239: 119-123.
Kaplar,
C .
W., 1974. U.S.
Army
Cold Regions Research Laboratory, CRREL Report ,
250.
Karlsson,
R.,
1977. Consistency Limits. Swedish Council for
Building
Research,
document D6,
40pp.
Kenney, T. C., 1959. Discussion of
Geotechnical properties
of glacial lake clays.
Proceedings ASCE Journal
of
Soil Mechanics
an d
Foundation División 85:
67-79.
Kenney,
T.
C., 1976. Formal
and
geotechnical characteristics
of glacial-lake carved
soils.
Laurits
Bjerrum Memorial
Volume -
Contributions
to
Soil Mechanics,
Norwegian
Geotechnical Institute, Oslo,
15-39.
Kezdi, A ., 1974. Handbook of Soil Mechanics
Vol.
J: Soil Physics. Elsevier.
Konrad, J-M.
and Morgenstern, N. R.,
1981.
The
segregation potential
of a
freezing
soil . Canadian Geotechnical Journal,
18:
482-491.
Krebs,
R. D. and
Walker,
E.
D., 1971.
Highway Materials.
McGraw-Hil l .
7/18/2019 Correl Soils Properties Carter&Bentley
http://slidepdf.com/reader/full/correl-soils-properties-carterbentley 131/136
REFERENCES 125
Publication
272, Department
of
Civil Engineering, Massachusetts Institute
of
Technology, 107pp.
Ladd C.
C .,
1975. Foundation Design
of Embankments
Constructed on Connecíicut
Valley
Varved Clays. Research Report R75-7, Geotechnical Publication 343,
Department of Civil Engineering, Massachusetts Institute of Technology, 438pp.
Ladd
C. C. and
Foote,
R.,
1974.
A new
design procedure
fo r
stability
of soft
clay.
Proceedings
ASCE Journal ofthe Geotechnical Engine ering División, 100: 763-786.
Ladd,
C.
C. Foote
R.,
Ishihara,
K.
Schlosser,
F. and
Poulos,
H. G.
1977.
Stress-deformation
and
strength characteristics. Proceedings of 9th International
Conference on Soil Mechan ics and
Foundation
Engineering, Tokyo 2: 421-494.
Ladd,
C. C. and
Luscher,
U.
1965. Engineering p roperíies
o f t he soils underlying the
M.I.T. campus. Research repo rt R65-68, Dep artmen t of Civil Engineering, Mass-
achusetts Institute
of Technology.
Ladd, R.
S.
1965. Use of
electrical
pressure transducers to measure
soil
pressure.
Research Report R65-48. Soil Publication 180, Department of Civil Engineering,
Massachusetts Institute
of
Technology, 79pp.
Lambe, T. W. and Whitrnan, R. V., 1979. Soil Mechanics. John Wiley, New York ,
553pp.
Lañe
K. S . and Washburn, D.
E.
1946. Capillary tests by capillorimeter an d
soil
filled
tubes. Proceedings Highway Research Board.
La
Rochelle,
P.
Trak,
B. Tavenas F. and
Roy ,
M.
1974. Failure of
a
test embank ment
on
a sensitive
Champlain
clay deposit.
Canadian
Geotechnical
Journal, 1:142-164.
Leonards
G. A ., 1976. Estimating consolidation settlements of
shallow
fo undations on
overconsolidated
clays,
Tran spo rtatio n Research Board , special report 163.
Leonards,
G . A. and
Girault,
P.
1961.
A
s tudy
o f t h e
one-dimensional consolidation
test. Proceedings
of the 5th
International Conference
on
Soil Mechanics
an d
Foundation Engineering,
París
1: 116-130.
Liao,
S. C. and
W hi tman,
R. V.
1986. Ov erbu rden Correction Factors
for SPT in
Sand.
Proceedings
ASCE Journal of Geotechnical
Engineering
División,
112:
373-380.
Liu,
T.
K.
1967.
A
review
o f
engineering
soil classification systems. Highway Research
Board Record, 156: 1-22.
Lowe,
J.
Zacchea
P. F. and
Feldman,
H.
S. —964. Consolidation testing wi th back
pressure.
Proceeding
ofASCE Journal ofSoil
Mechanics a nd
Found ation División, 90 :
69-86.
Massarsch K.
R.,
1979. Lateral earth pressure in normally consolidated clay.
Proceedings
of7th
European Conference on Soil Mechan ics and Found ation Engineer-
ing,
Brighton, 2: 245-250.
Menard, L. and Rousseau, J. 1962. L evalu aíion des tassements tendances nouv elles.
Sols-Soils,
1: 13-28.
Menzenbach,
E.
1967. Le capacidad suportante de pilotes y grupos de pilotes.
Technologia Ingeneria Civil), Series
2, No. 1.
Mesri
G.
1973. The
coefficient
of secondary compression.
Proceedings
ASCE Journal
ofSoil Mechanics an d Foundation División, 99 : 123-137.
Mesri,
G. and
Godlewski,
P.
M. 1977. Time
and
stress compressibility interrelation-
ships. Proceedings ASCE Journal o f Geotechnical Engin eering División, 103:
417- 30.
Meyerhof, G. G. 1936. Penetration tests and bearing capacity of cohesionless soils.
Proceedings ASCE Journal
o f
Soil Mechanics
an d
F oundation División, 82.
Meyerhof, G. G. 1974. General Report: outside Europe. Proceedings of
European
Symposium on Penetration Testing,
Stockholm
2: 40-48.
Mielenz R. C. and King M.
E. 1955. Physical-chemical properíies
and
engineering
performance of clays. Calif. Div. Mine s Bull., 196-254.
Miller
R. D.
1972. Freezing
and
heaving
of saturated and
unsaturated
soils. Highways
Research
Record, 393: 1-11.

7/18/2019 Correl Soils Properties Carter&Bentley
http://slidepdf.com/reader/full/correl-soils-properties-carterbentley 132/136
126 CORRELATIONS OF SOIL PROPERTIES
Mil l igan
V . 1972.
Discussion
of E m b a n k m e n t s on
soft
g r o u n d . Proceedings
ofASCE
Specialty Conference on Performance of Earth and Earth-Supported Structures.
Purdue Universi ty
3: 41-48.
Ministry of
Transport
1969. Specificaíion fo r road and b r idge works . HMSO.
Mitchel l J. K. and Gardner W. S. 1975. In-si tu measurement of
v o l u m e
change
characteristics. Proceedings ofthe ASCE Specialty
Conference
on
In-situ measure-
ment ofSoil Properties. Raleigh N. Carol ina 2: 333.
Mitchell J. K. 1976.
Fundamental
of
Soil Behaviour.
John Wiley 422pp.
Mor in W. J. and
Todor
P.C. 1977. La ten tes and laíeritic soils and other problem
soils
o f t h e
t ropics. U ni ted States Agency for Interna tional Developmen t AlO/csd
3682.
Peck R. B. and B azaraa A. R. S .
S.
1969. D iscussion. Proceedings ASCE Journal of
Soil Mechanics and Foundation División, 95:
305-309.
Peck R. B. H a n s o n W. E. and Thorn burn T . H . 1974. Founda tion Engineering. John
Wiley London
514pp.
Pen ner E. 1968. Pa rticle size as a basis for pred ictin g
frost
action in soils. Soils and
Foundations 8: 21-29.
Poulos
H. G. and
Davis
E.
H.
1974. Elastic Solutions for Soil and Rock Mechanics.
John Wüey N ew Y o r k 41ípp.
Ra ma Rao R. and Fredlund D.G. 1988.
Closed-form
heave
solutions
for expansive
soils. Proceedings
SCE
Journal ofGeotechnical Engine ering División, 114: 573-588.
Rankine W. J . M. 1857. O n
the
stab il i ty of loóse earíh.
Philosophical Transactions of
the
Royal
Society,
Lon don 147.
Reed M . A .
Lovel
C . W . Alíschaeffi A. G. and Wood L. E. 1979.
Frost
heav ing r a te
predicted from pore size distribution.
Canadian Geotechnical
Journal, 16: 463-472.
Robertson P. K. and Companel la R. G. 1983. Interpre tat ion of cone pene trat ion tests
Part
I:
Sand.
Canadian Geotechnical Journal, 20: 718-733.
Roscoe K. H.
Schofield
A. N. and Wroth C. P. 1958. On the y ielding of soils.
Geotechnique,
8:
2-52.
Seed
H .
B.
W oodw ard R. J . and Lu n dg r a n
R. 1962. Prediction
of
swelling po tential
of
compacted clays. Proceedings ASCE Journal of Soil Mechanics and Foundation
División,
88: 107-131.
Seed H. B. 1976. Evaluat ion of soil l iquefaction effects on
level
g round during
ear thquakes . SCE Speciality Session, Liquefaction Problems
in
Geotechnical
Engineering, Prepr int 2752 ASCE Nation al Conv ention
Sept./Oct.
1976
1-105.
Simons
N. E. 1958. Discussion of test requirements fo r m easuring th e coefñcient of
earth pressure at rest.
Proceedings
of Conference on
Earth pressure Problems,
Brussels
3:
40-53.
Singh R. Henkel D. J. and Sangrey D. A. 1973. Shear an d K
0
swelling of
overconsolidated clay. Proceedings ofSth International
Conference on
Soil Mechan-
ics
and Foundation Engineering, 367-376.
Skempton
A .
W.
1944. Notes
on the
compressibil i ty
o f
clays. Qu at. Journ. Geol. Soc.,
100:119-135.
Skempton
A .
W. 1953.
Th e
colloidal activity
of
clays.
Proceedings
of 3rd
International
Conference
on Soil Mechanics and Foundation •qineering, Zur ich 57-61.
Skempton A. W. 1954. The pore pressure
coeL.
. snts A and B.
Geotechnique
4:
143-147.
Skempton A. W. and Nor they R. D. 1952. The sensitivity o f clays. G eotechnique, 3 :
30-53.
Skempton A. W. and Bjerrum L. 1957. A contribution to the settlement analysis of
founda t ions
on clay. Geotechnique, 7 : 168-178.
Ske mp ton A. W. 1986. Standa rd penetration test procedures and effects in sand of
overbu rden pressure relative density particle size ageing and overconsolidation.
Geotechnique
36:
425-447.

7/18/2019 Correl Soils Properties Carter&Bentley
http://slidepdf.com/reader/full/correl-soils-properties-carterbentley 133/136
REFERENCES 127
Snethen D. R. 1980. Characterization of expansiva soils using soil suction data.
Proceedings
of 4th
International
Conference on
Expansive Soils 1:
54-15.
Sowers
G.
F.
1979.
Introductory Soil Mechanics
and
F oundations.
Macmillan.
Tagaki
S.
1979. Segregation
freezing as the
cause
of
suction forcé
for ice
lens
format ion.
Engineering Geology 13 :
92-100.
Tavenas
F.
Lebland
P.
Jean
P.
and
Leroueil
S.
1983a.
The
p ermeability
of
na ture
soft clays.
Part
I:
Methods
of
laboratory measurement. Canadian Geotechnical
Journal
20: 629-644.
Tavenas
F.
Jean P. Lebland P. and Leroueil S. 1983b. The permeability o f na tura l
soft clays. Part II: Permeability characteristics.
C anadian Geotechnical Journal
20:
645-660.
Tavenas
F. and
Leroueil
S.
1987. State
of the art on
laboratory
an d in-situ
stress-strain-time behaviour of clays. Proceedings of International
Symposium
on
Geotechnical Engineering
of Soft
Soils México City
1-46.
Taylor
D. W.
1948.
Fundam entáis
ofSoil
Mechanics.
John Wiley
N ew
Yo rk 700pp.
Terzaghi K. and Peck R. B. 1967. Soil Mechanics in Engineering Practice. John
Wiley
London 729pp.
Teng W. C. 1962. Fou ndatio n Design. Prentice Hall Englewood
Cliffs
N.J.
Tho rbu rn S. 1963. Tentative correlation chart for the standard penetration test in
non-cohesive soils.
Civil Engineering Public
Works
Review.
Tok imats u K. and Yo shim i Y. 1983. Em pirical correlations of soil liquefactio n based
on
SPT N-values and fines con ten í .
Soils
and
F oundations
23:
56-74.
Tomlinson M. J. 1980. Foundation Design and Construction. Pitman Lon don
793pp.
Transport and Road Research La bora tory 1970. A guide to the structural design of
new
pavements. TRRL Road Note
29 HMSO.
U.S. Army Corps of Engineers 1970. En gineering and design: pavement design for
frost
conditions. Corps of Engineers EM-110-345-306.
U.S. A rm y Engineer Waterways Exp erimen t Station 1960. The
Unified
Soil Classifica-
tion System. Technical memorándum
No.
3-357.
U.S. Bureau
of
Reclam ation 1974. Earth Manual. Denver
810pp.
U.S. Federal Av iation Agency 1984. Ai rpo rt Paving. Advisory Circular
150/5320-6.
U.S. Navy 1982. Design Manual: Soil Mechanics Foundations and Earth
Structures
N avy
Facilities Engineering Command
Navfac
U.S. Naval Publications and
Forms Center.
V an der Merwe D. H. 1964. Prediction of heave from the plasticity Índex and
percentage
clay
fraction
of
soils. Civil Engineer in South
África
6:
103-107.
Vijayvergiya
V. N. and Ghazzaley O. L 1973. Prediction of swelling p otential fo r
natural clays. Proceedings
ofSrd
International
Conference on
Expansive Soils
Haifi
1:227-236.
Wallace G. B . and Otto W . C. 1964. Differential settlement at Selfridge A ir Forcé
Base.
Proceedings ofASCE Journal
ofSoil
Mechanics
and
Foundation División
9 :
197-20.
Weston D. J. 1980. Expansive roadbed treatm ent for Southern África. Proceedings of
4íh International Conference on
Expansive Soils.
1:
339-360.
Williams
A. A. B.
1957.
Discussion.
Trans. S. Afr. Instn. Civ. Engrs.
8.
Wo ods K. B. and Litehiser R .R . 1938. Soil mech anics applied to highway engineering
in
Ohio.
Ohio
State Univ ersity Engineering Experimental Station Bulletin 99.
Wroth
C . P.
1972. General theories
of
earth pressures
and
deformation. Proceedings
of5th European
Conference
on
Soil M echanics
a nd
Foundation Eng ineering Madrid
2: 33-52.
Wroth C. P. and Wood D. M. 1978. The correlation of índex properties with some
basic engineering properties of soils. Canadian G eotechnical Journal 15:
137-145.
Wroth
C.
P.
1984.
The
interpreta tion
of
insitu soil tests.
Geotechnique
34:
449-489.
7/18/2019 Correl Soils Properties Carter&Bentley
http://slidepdf.com/reader/full/correl-soils-properties-carterbentley 134/136
IN X
AASHTO soi l
classification
system 14
21 27 34 35
and CBR valúes 102
compared
w i th th e Uni f íed
system
37
38
AASHTO standard compact ion tests
44
Activity 11
and expansive m inerals 107
and plasíiciíy
índex
10 6
and swell ing potent ial 110
Adsorpt ion
complex
4
Angle of in ternal friction 12 89
Angle
of
shearing resistance
12 76 89
ASTM/Unif ied soil classif icat ion
system
14
and CBR valúes 102
and
frost susceptibiliíy
121
se e
also Uni f íed
soil classification
system
Atterberg
limits
see Consistency limits
BS soil classification system 14 17
27-29
BS soil descriptions 17
BS s tandard compaction tests 44
Bulk
density 39
California Bearing ratio
2 97 98
and liquidity Índex 99
and m áx im um
dry
density 99 100
and
opt imum moisture content
100
and
plast ici ty Índex
98 100
and
shear strength
104
an d soil classification 102
and suitability índex 99
Casagrande soil classification
system
14
Cations
223
Classifícation systems fo r soils
review 13 14
for
frost susceptibility
119 121
see a lso under AA SHT O BS
Unif íed
systems
Collapse potent ial
and densi ty
111
112
Coefficient
of
c omp ressibil i ty
56 57
typical
va lúes
61
Coefficient
of cu rva t u re 17
Coeffícient
of earth pressure
92-96
active
92 93 95
passive 92 93 95
at rest 95
Coeffícient of
p ermeabi l i ty 5 0 5 1
and consolidat ion 65
and
grading 51 53
and soil classification 51
typical
valúes
51
Coefficients of secondary
con solidation 68 69
Coefficient
of
uniformity
17
Coefficient
of
volume
compressibility
56 57
Cohesión 6 76-78
Cohesión soils 4
Compacted densi ty 43^47
and CBR 99 100
and shear st rength 81
Compaction tests 43^45 49
Compressibility 55
Coefficient of 56 57 61
coefficiení of
vo lum e
56 57
Compression Índex
58
modified 58
valúes and corre la t icns 60
Consistency limits . 6 7
and consolidation
11
an d expansiveness 106
and shear st rength 11
se e
also Liquid
Plástic a nd Shrinkage
limits
Consolidation 2 55
and consistency limits 10
and compressibility 65
128
7/18/2019 Correl Soils Properties Carter&Bentley
http://slidepdf.com/reader/full/correl-soils-properties-carterbentley 135/136
and pe rmeabi i i t y 65
coeff ic ien í
o f
65-68
pa r a m e í e r s 55-58
t heory 58
Conso l ídome íe r
55
C o n s t r a i n e d m o d u l u s 60
Drained
shear
s t r en g t h
see shear s trength
D e f o m a t i o n m o d u l u s
60
Dry
density
39
Effec t ive
shear
s t reng íh
se e shear
s í r eng th
Effec t ive
stresses
76, 78-80
E x p a n s i v e
soils 11,
12,
105-107
Free
swell 105
Frost
heave
11 9
Frost susceptibility 116 11 7
and g rad ing 117-119
and plasticiíy
Índex
119-121
and soil classificaíion
119,
121
iden í i f í ca t i on o f
soil
119
Grad ing
1-3
and frost suscept ib i l i ty 117-119
and pe rmeabi i i ty 53
classifications 4
effects o n
o the r prope r í i e s
2
Hazen s fo rm ula
53
Hveem s íabi lometer
116
97
Ice
segregaíion
Ilute
107
In te rna l f r i c t i on , angle
o f
Kaol in i t e 107
1 2 , 8 9
Lateral earth pressures
92-96
se e also coefficient o f
earíh pressure
Linea r shr inkage
and
swelling
poíential 110
Liqu id i ty Índex
82
and CBR 99
and
shear stren gth 81-84
and
sens i t ivi ty
83
Liquid
l imit 6-8 10-12
and CBR 99
and swe l ling po ten t ia l 1 10
and swell ing pressure
115
M á x i m u m d r y
dens i íy
45
and CBR
99,100
a n d o p í i m u m
m o i s í u r e c o n t e n t
46
and s he a r s t r eng th 81
s t a n d a r d cu rves f o r 49
M o d i f i e d compress ion Índex
58
M o i s íu r e c o n t e n t
and
swell ing p o t e n t i a l
112, 11 3
Mois íure-densi ty curves , íypical 49
M o n t m o r i l l o n i t e
106, 107,
121
O e d o m e í e r
55
O p t i m u m m o i s t u r e c o n t e n í
45
and CBR 100
an d
m á x i m u m
d ry
d ens i ty
46
and
p las t i c i íy
46
íypical
mo is lu re -dens i íy cu rves
49
Overconso l ida íed
c lays
86, 87
Parl ic le s ize d is t r ibut ion
see
Grading
Perm eab i l i í y 2
and
conso l ida l ion
65
and grading 51, 53
and
soil classification
51
coeff ic ient of 50, 51
Plast ic i íy 3, 6
Plasíiciíy
í ndex
7, 11
and
a c í iv i íy
106
and CBR 98, 100
and
f rosl susceplibi l i íy
119-121
an d swelling poíeníial 107, 112, 113
Plástic limit 6-8 10-12
and op t imum moisture co n tent 46
Píate
bear ing
tesí
74, 75
Poisson s raíio 60, 73
Relaí ive
dens i íy
40
Secondary com press ion
55
coefficienís of 68, 69
Sensiíiviíy 83
Seítlement 58, 59
co r rec í ions 6 2 , 6 5
of
sands
and
gravéis
70-75
Shear ing
resisíance, angle
of 76
Shear s í rengíh 2
76-92
and CBR 104
and cons is íency l imiís 10
and
l iqu id i íy
í ndex 82
and SPT va lúes 88

7/18/2019 Correl Soils Properties Carter&Bentley
http://slidepdf.com/reader/full/correl-soils-properties-carterbentley 136/136
P R C
i K í ic,b
and s we l í ing pote ní ia l 110
dra ined 89
eífective
89, 90
of ciays
89, 90
of granular soi ls 90-92
parameters 76
r e m o u l d e d
81-83
tota l and
e ffecí ive 78-80
u n d r a i n e d
80-88
Shrinkage l imit 6 , 9-11
Sieve
analys is
se e
Grading
Sieve
sizes
3
Smectite 106
Soil c lass i f icat ion sys tems,
see
Class i f icat ion sys tems
see
also under AASHTO,
BS,
U n i f i e d
systems
Stabil i ty
analysis
79, 80
Standard compact ion te s i s 43-45
one
p o i n t
test 49
Standard peneíra í ion
test
40-43,
70-72
and seí t leme ní 71,
72
and
undrained shear
s t r eng t h
8 8
Suct ion pressure
116
S ui íab i l i ty índe x 99
Swell Í n d e x 11 4
Swel í ing p o t e n t i a í Í 0 7
and d e n s i í y 111, 112
and l inear shrinka ge 110
and l iqu id l imit 112
and
m oi s t ure c o n t e n í
112-,
113
and
p la s t i c i íy Índe x 107-109,
112
and
shr inkage l imi t
110,
112
and vert ica l pressure
112,
113
Swel í ing
pressure 113-115
and l iqu id l imit 115
an d SPT
va lu é
115
and swel l
Í nde x
114
Tota l and
efiective stress
analysis 78-80
76
Undra ined shear s t reng íh
see
shear s í rengíh
*Unified soi l c lass i f icat ion sys tem
and CBR
v a l ú e s
102
and frost
suscept ibí l i ty
121
compared w i t h o íher sys tems
Y o u n g s m o d u l u s
59
4
8


