ORIGINAL ARTICLE doi:10.1111/j.1558-5646.2012.01642.x CORRELATED EVOLUTION OF BEAK MORPHOLOGY AND SONG IN THE NEOTROPICAL WOODCREEPER RADIATION Elizabeth Perrault Derryberry, 1,2,3 Nathalie Seddon, 4 Santiago Claramunt, 1 Joseph Andrew Tobias, 4 Adam Baker, 4 Alexandre Aleixo, 5 and Robb Thomas Brumfield 1 1 Museum of Natural Science and Department of Biological Sciences, Louisiana State University, Baton Rouge, Louisiana 70803 2 E-mail: [email protected]3 Department of Ecology and Evolutionary Biology, Tulane University, New Orleans, Louisiana 70118 4 Department of Zoology, Edward Grey Institute, University of Oxford, South Parks Road, Oxford OX1 3PS, UK 5 Coordenac ¸˜ ao de Zoologia, Museu Paraense Em´ ılio Goeldi, Caixa Postal 399, CEP 66040–170, Bel ´ em, Par ´ a, Brazil Received October 13, 2011 Accepted February 24, 2012 Mating signals may diversify as a byproduct of morphological adaptation to different foraging niches, potentially driving speci- ation. Although many studies have focused on the direct influence of ecological and sexual selection on signal divergence, the role of indirect mechanisms remains poorly understood. Using phenotypic and molecular datasets, we explored the interplay between morphological and vocal evolution in an avian radiation characterized by dramatic beak variation, the Neotropical wood- creepers (Dendrocolaptinae). We found evidence of a trade-off between the rate of repetition of song syllables and frequency bandwidth: slow paced songs had either narrow or wide frequency bandwidths, and bandwidth decreased as song pace increased. This bounded phenotypic space for song structure supports the hypothesis that passerine birds face a motor constraint during song production. Diversification of acoustic characters within this bounded space was correlated with diversification of beak morphology. In particular, species with larger beaks produced slower songs with narrower frequency bandwidths, suggesting that ecological selection on beak morphology influences the diversification of woodcreeper songs. Because songs in turn mediate mate choice and species recognition in birds, these results indicate a broader role for ecology in avian diversification. KEY WORDS: Ecological adaptation, magic traits, mechanical constraints, phylogenetic comparative analyses, signal evolution, suboscine birds, vocal performance. Speciation often entails the divergence of signals used in species recognition and mate choice (Fisher 1930; Dobzhansky 1937, 1940; Mayr 1963; Coyne and Orr 2004), and the evolutionary importance of signal divergence has been demonstrated empiri- cally in many taxa (e.g., Drosophila: Coyne and Orr 1989, birds: Grant and Grant 1997, frogs and insects: Gerhardt and Huber 2002, crickets: Shaw and Parsons 2002). Understanding the forces underlying signal evolution is thus an important aspect of under- standing the process of species diversification. Ecological factors, such as those that affect signal transmission (Morton 1975) and production (Podos and Nowicki 2004b), appear to be important drivers of signal evolution. A wealth of evidence across a diver- sity of taxa suggests that habitat-dependent selection on signal transmission shapes signal evolution (Morton 1975; Wiley and Richards 1978; Ryan et al. 1990; Wiley 1991; Boughman 2002; Slabbekoorn and Smith 2002b; Leal and Fleishman 2004; Seddon 2005; Cummings 2007; Derryberry 2009). There is also increas- ing evidence of indirect effects via ecological selection on traits related to signal production. Such traits have been referred to as “magic traits” (Gavrilets 2004) when they affect the production 1 C 2012 The Author(s). Evolution
Transcript
ORIGINAL ARTICLE
doi:10.1111/j.1558-5646.2012.01642.x
CORRELATED EVOLUTION OF BEAKMORPHOLOGY AND SONG IN THENEOTROPICAL WOODCREEPER RADIATIONElizabeth Perrault Derryberry,1,2,3 Nathalie Seddon,4 Santiago Claramunt,1 Joseph Andrew Tobias,4
Adam Baker,4 Alexandre Aleixo,5 and Robb Thomas Brumfield1
1Museum of Natural Science and Department of Biological Sciences, Louisiana State University, Baton Rouge, Louisiana
3Department of Ecology and Evolutionary Biology, Tulane University, New Orleans, Louisiana 701184Department of Zoology, Edward Grey Institute, University of Oxford, South Parks Road, Oxford OX1 3PS, UK5Coordenacao de Zoologia, Museu Paraense Emılio Goeldi, Caixa Postal 399, CEP 66040–170, Belem, Para, Brazil
Received October 13, 2011
Accepted February 24, 2012
Mating signals may diversify as a byproduct of morphological adaptation to different foraging niches, potentially driving speci-
ation. Although many studies have focused on the direct influence of ecological and sexual selection on signal divergence, the
role of indirect mechanisms remains poorly understood. Using phenotypic and molecular datasets, we explored the interplay
between morphological and vocal evolution in an avian radiation characterized by dramatic beak variation, the Neotropical wood-
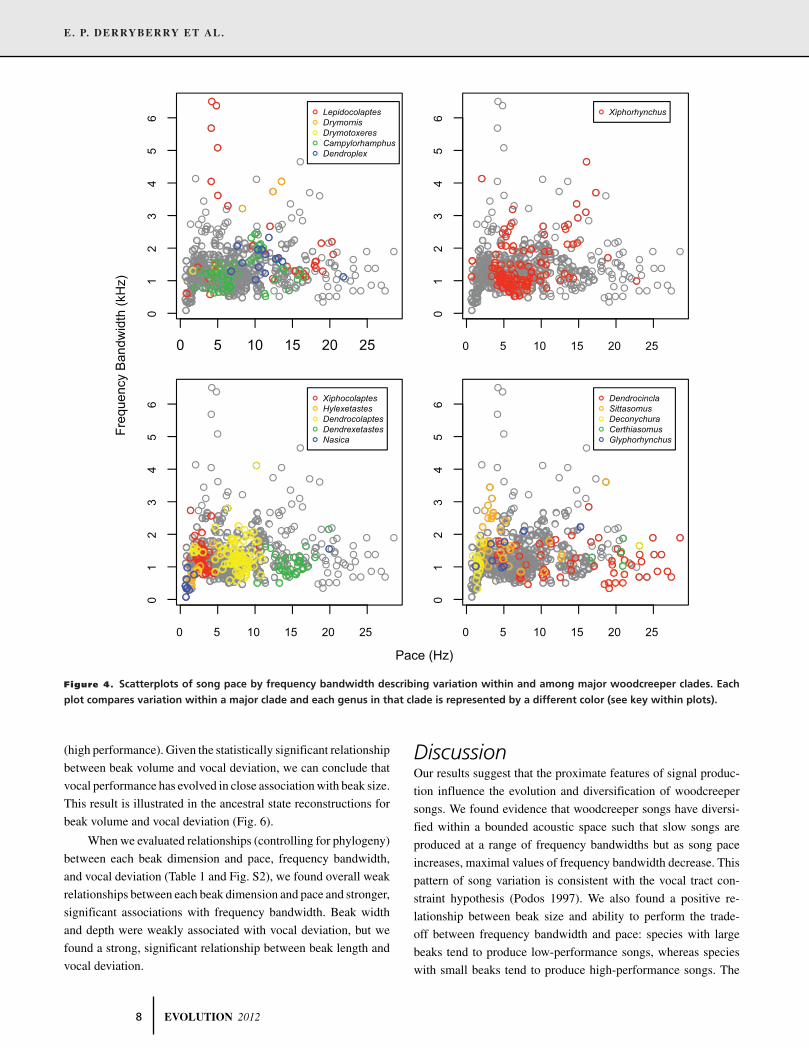
creepers (Dendrocolaptinae). We found evidence of a trade-off between the rate of repetition of song syllables and frequency
bandwidth: slow paced songs had either narrow or wide frequency bandwidths, and bandwidth decreased as song pace increased.
This bounded phenotypic space for song structure supports the hypothesis that passerine birds face a motor constraint during
song production. Diversification of acoustic characters within this bounded space was correlated with diversification of beak
morphology. In particular, species with larger beaks produced slower songs with narrower frequency bandwidths, suggesting that
ecological selection on beak morphology influences the diversification of woodcreeper songs. Because songs in turn mediate mate
choice and species recognition in birds, these results indicate a broader role for ecology in avian diversification.
drocolaptes, Dendrexetastes, and Nasica), some of whom have
beaks with the largest volume (Figs. 1 and 6), show greater ossi-
fication of the rostrum, more solidly constructed skulls, and deep
and broad muscle attachments, which suggests that those beaks
can exert and tolerate greater forces (Feduccia 1973). Strong-
billed woodcreepers also typically eat large invertebrates and even
some small vertebrates. Strong forces may be needed to subdue
prey and crush exoskeletons. For several species of woodcreepers
(i.e., Campylorhamphus), their beaks are larger not because they
are wider (as in Darwin’s finches) but because they are longer.
And, indeed, we found evidence suggesting that bill length is the
best predictor of vocal performance in woodcreepers. We also
found that bill length is a good predictor of frequency bandwidth
(Table 1). These results align with the results of a previous study
on woodcreeper song structure, which found a significant rela-
tionship between bill length and acoustic frequency (Palacios and
Tubaro 2000). As discussed by Palacios and Tubaro (2000), a
relationship between bill length and frequency is consistent with
the idea that the suprasyringeal vocal tract has resonating prop-
erties (Nowicki 1987) and that longer beaks add proportionally
more to the length of the vocal tract, thus reducing its resonating
frequency (Podos and Nowicki 2004a).
But what explains the relationship between bill length and
the trade-off between song rate and frequency? Long beaks may
need extra muscle mass to maintain comparable biting force at
the tip of the beak (e.g., the lever effect). Thus, similar to oscines,
woodcreepers with larger beaks might be more limited in their
ability to open and close their beaks widely and rapidly because
massive beaks and muscles are more difficult to move quickly.
Another possibility is that a morphological character associated
with bill length explains variation in both frequency and temporal
characteristics of woodcreeper song. Indeed, Palacios and Tubaro
(2000) found a significant and positive correlation between beak
length and body mass. Because body mass scales with the size
of the syringeal membrane, the vibrating frequency of which de-
termines the acoustic frequency of a vocalization (Nowicki and
Marler 1988), variation among species in body mass might explain
1 0 EVOLUTION 2012
CORRELATED BEAK AND SONG EVOLUTION IN SUBOSCINES
variation in acoustic frequency. Body mass may also constrain the
maximum note repetition rate if woodcreepers use minibreaths
during song production similar to some oscines and nonoscines
(Wild et al. 1998; Suthers 2001). The maximum rate of mini-
breaths is dependent on the mass of the abdominal-thoracic cavity
walls that must oscillate at the respiratory frequency, such that an
increase in body mass decreases the maximum note repetition rate
(Suthers 2001).
A recent surge of research on suboscine birds has revealed
that many of the same processes driving the evolution of song in
oscines are also important in suboscines, including direct adapta-
tion of song structure to the signaling environment (reviewed in
Slabbekoorn and Smith 2002a; Seddon 2005; Tobias et al. 2010),
natural selection on species recognition (Seddon 2005; Seddon
and Tobias 2010), and sexual selection (Tobias and Seddon 2009;
Tobias et al. 2011). In addition, studies have shown that tracheo-
phone suboscine songs are similar to oscine songs in that they
function in mate attraction and territory defense (Tobias et al.
2011), and that very minor song divergence can mediate species
recognition and potentially reproductive isolation (Seddon and
Tobias 2007, 2010). Here, we present evidence indicating that
suboscine song evolution is also constrained by the complex mo-
tor patterns involved in the production of sound, as was first
demonstrated in oscines. However, although the general form of
biomechanical constraint appears to be similar between these two
widely separated branches of the passerine tree, we have shown
that contrasts (e.g., the size of the performance acoustic space,
position of the upper bound regression, and exact nature of re-
lationship between beak size and performance) are also appar-
ent. These findings highlight the need for further research into
the proximate mechanisms involved in sound production in su-
boscines, as the similarities and differences between clades will
generate new and testable hypotheses about how biomechanical
limitations influence traits used in animal communication.
In summary, our results show that the songs of a major
Neotropical bird radiation have diversified within the bounded
acoustic space of bandwidth by pace and that a significant amount
of this diversification in song structure is explained by variation
in beak shape. We hypothesize that strong ecological selection
during the adaptation of woodcreepers to different habitats and
foraging niches promotes divergence in beak morphology among
species, and that this leads, indirectly, to acoustic divergence in
songs. Our results add weight to previous studies proposing a link
between beak size and song structure in suboscines (Palacios and
Tubaro 2000; Seddon 2005), suggesting that correlated evolution
via biomechanical constraints may be widespread in birds. This is
consistent with the idea that beak morphology serves as a “magic
trait” not only in some oscine clades but across the entire passer-
ine radiation (> 5000 species), and that “magic traits” themselves
are relatively widespread (Servedio et al. 2011). Nonetheless, we
still have much to learn about the extent to which ecological se-
lection on beak morphology has had a pleiotropic effect on the
diversification of song, and the extent to which song divergence
in turn influences reproductive isolation in suboscine clades. Fur-
ther studies of the causes and consequences of suboscine song
evolution are required.
ACKNOWLEDGMENTSWe thank J. Podos, M. J. Blum and two anonymous reviewers for helpfulcomments on earlier drafts of the manuscript. We are also grateful to nu-merous collectors and institutions for providing vocalizations, specimensand tissues (see Tables S1-S3); C. Burney, G. Bravo, A. Cuervo, and L.Naka for sequence data; J. Podos for emberizid data; and C. Heibl for codefor figures. This research was supported in part by National Science Foun-dation grants DBI-0400797 and DEB-0543562 to RTB; CNPq (Brazil)grants 310593/2009–3, 574008/2008–0, and 476212/2007–3 to AA; aSigma Xi Grant-in-Aid of Research to SC; a Royal Society University Re-search Fellowship to NS and a John Fell Fund grant (University of Oxford)to JAT.
LITERATURE CITEDAmes, P. L. 1971. The morphology of the syrinx in passerine birds. Bull.
Peabody Mus. Nat. Hist. 37:1–194.Badyaev, A. V., R. L. Young, K. P. Oh, and C. Addison. 2008. Evolution on a
local scale: developmental, functional, and genetic bases of divergencein bill form and associated changes in song structure between adjacenthabitats. Evolution 62:1951–1964.
Ballentine, B. 2006. Morphological adaptation influences the evolution of amating signal. Evolution 60:1936–1944.
Ballentine, B., J. Hyman, and S. Nowicki. 2004. Vocal performance influencesfemale response to male bird song: an experimental test. Behav. Ecol.15:163–168.
Barker, F. K., G. F. Barrowclough, and J. G. Groth. 2002. A phylogenetic hy-pothesis for passerine birds: taxonomic and biogeographic implicationsof an analysis of nuclear DNA sequence data. Proc. R. Soc. Lond. B269:295–308.
Barker, F. K., A. Cibois, P. Schikler, J. Feinstein, and J. Cracraft. 2004.Phylogeny and diversification of the largest avian radiation. Proc. Natl.Acad. Sci. USA 101:11040–11045.
Beckers, G. J. L., R. A. Suthers, and C. ten Cate. 2003. Pure-tone birdsong byresonance filtering of harmonic overtones. Proc. Natl. Acad. Sci. USA100:7372–7376.
Blackburn, T. M., J. H. Lawton, and J. N. Perry. 1992. A method of estimatingthe slope of upper bounds of plots of body size and abundance in naturalanimal assemblages. Oikos 65:107–112.
Boughman, J. W. 2002. How sensory drive can promote speciation. TrendsEcol. Evol. 17:571–577.
Brumfield, R. T., J. G. Tello, Z. A. Cheviron, M. D. Carling, N. Crochet,and K. V. Rosenberg. 2007. Phylogenetic conservatism and antiquityof a tropical specialization: army-ant-following in the typical antbirds(Thamnophilidae). Mol. Phylogenet. Evol. 45:1–13.
Cardoso, G. C., and Y. Hu. 2011. Birdsong performance and the evolutionof simple (rather than elaborate) sexual signals. Am. Nat. 178:679–686.
Chesser, R. T. 1999. Molecular systematics of the rhinocryptid genus Pterop-tochos. Condor 101:439–446.
———. 2004. Molecular systematics of New World suboscine birds. Mol.Phylogenet. Evol. 32:11–24.
EVOLUTION 2012 1 1
E. P. DERRYBERRY ET AL.
Claramunt, S. 2010. Discovering exceptional diversifications at continentalscales: the case of the endemic families of Neotropical suboscine passer-ines. Evolution 64:2004–2019.
Claramunt, S., E. Derryberry, R. T. Chesser, A. Aleixo, and R. T. Brumfield.2010. Polyphyly of Campylorhamphus, and description of a new genusfor C. pucherani (Dendrocolaptinae). Auk 127:430–439.
Coyne, J. A., and H. A. Orr. 1989. Patterns of speciation in Drosophila.Evolution 43:362–381.
———. 2004. Speciation. Sinauer Associates, Sunderland, MA.Cummings, M. 2007. Sensory trade-offs predict signal divergence in surf-
perch. Evolution 61:530–545.Dane, B., C. Walcott, and W. H. Drury. 1959. The form and duration of
the display actions of the Goldeneye (Bucephala clangula). Behaviour14:265–281.
Derryberry, E. 2009. Ecology shapes birdsong evolution: variation in habitatand morphology explains variation in white-crowned sparrow song. Am.Nat. 174:24–33.
Derryberry, E., S. Claramunt, R. T. Chesser, A. Aleixo, J. Cracraft, R. G.Moyle, and R. T. Brumfield. 2010. Certhiasomus, a new genus of wood-creeper (Aves: Passeriformes: Dendrocolaptidae). Zootaxa 2416:44–50.
Derryberry, E., S. Claramunt, G. Derryberry, R. T. Chesser, J. Cracraft, A.Aleixo, J. Perez-Eman, J. Remsen Jr., and R. T. Brumfield. 2011. Lineagediversification and morphological evolution in a large-scale continentalradiation: the Neotropical ovenbirds and woodcreepers (Aves: Furnari-idae). Evolution 65:2973–2986.
Dobzhansky, T. 1937. Genetics and the origin of species. Columbia Univ.Press, New York, NY.
———. 1940. Speciation as a stage in evolutionary divergence. Am. Nat.74:312–322.
Drummond, A. J., S. Y. W. Ho, M. J. Phillips, and A. Rambaut. 2006. Relaxedphylogenetics and dating with confidence. PLoS Biol. 4:e88.
Drummond, A. J., and A. Rambaut. 2007. BEAST: Bayesian evolutionaryanalysis by sampling trees. BMC Evol. Biol. 7:214.
Feduccia, A. 1973. Evolutionary trends in the Neotropical ovenbirds andwoodcreepers. University of California, Berkeley, CA.
Fisher, R. A. 1930. The genetical theory of natural selection. Clarendon Press,Oxford.
Freckleton, R. P., P. H. Harvey, and M. Pagel. 2002. Phylogenetic analysis andcomparative data: a test and review of evidence. Am. Nat. 160:712–726.
Freed, L. A., S. Conant, and R. C. Fleischer. 1987. Evolutionary ecology andradiation of Hawaiian passerine birds. Trends Ecol. Evol. 2:196–203.
Gavrilets, S. 2004. Fitness landscapes and the origin of species. PrincetonUniv. Press, Princeton, NJ.
Gerhardt, H. C., and F. Huber. 2002. Acoustic communication in insects andanurans. Univ. of Chicago Press, Chicago and London.
Goller, F., M. J. Mallinckrodt, and S. D. Torti. 2004. Beak gape dynamicsduring song in the zebra finch. J. Neurobiol. 59:289–303.
Grant, B. R. 2003. Evolution in Darwin’s finches: a review of a study on IslaDaphne Major in the Galapagos Archipelago. Zoology 106:255–259.
Grant, P. R. 1968. Bill size, body size, and the ecological adaptations of birdspecies to competitive situations on islands. Syst. Biol. 17:319–333.
———. 1972. Convergent and divergent character displacement. Biol. J. Linn.Soc. 4:39–68.
Grant, P. R., and B. R. Grant. 1997. Genetics and the origin of bird species.Proc. Natl. Acad. Sci. USA 94:7768–7775.
Grenier, J. L., and R. Greenberg. 2005. A biogeographic pattern in sparrow billmorphology: parallel adaptation to tidal marshes. Evolution 59:1588–1595.
Groth, J. G., and G. F. Barrowclough. 1999. Basal divergence in birds and thephylogenetic utility of the nuclear RAG-1 gene. Mol. Phylogen. Evol.12:115–123.
Hackett, S. J. 1996. Molecular phylogenetics and biogeography of tanagers inthe genus Ramphocelus (Aves). Mol. Phylogen. Evol. 5:368–382.
Harmon, L. J., J. T. Weir, C. D. Brock, R. E. Glor, and W. Challenger. 2008.GEIGER: investigating evolutionary radiations. Bioinformatics 24:129–131.
Hausberger, M., J. M. Black, and J. P. Richard. 1991. Bill opening and soundspectrum in barnacle goose loud calls: individuals with ‘wide mouths’have higher pitched voices. Anim. Behav. 42:319–322.
Hellmayr, C. E. 1925. Catalogue of birds of the Americas Part IV. FieldMuseum of Natural History Zoological Series 13, Chicago, IL.
Herrel, A., J. Podos, S. K. Huber, and A. P. Hendry. 2005a. Bite performanceand morphology in a population of Darwin’s finches: implications forthe evolution of beak shape. Funct. Ecol. 19:43–48.
———. 2005b. Evolution of bite force in Darwin’s finches: a key role forhead width. J. Evol. Biol. 18:669–675.
Herrel, A., J. Podos, B. Vanhooydonck, and A. P. Hendry. 2008. Force-velocitytrade-off in Darwin’s finch jaw function: a biomechanical basis for eco-logical speciation? Funct. Ecol. 23:119–125.
Hoese, W. J., J. Podos, N. C. Boetticher, and S. Nowicki. 2000. Vocal tractfunction in birdsong production: experimental manipulation of beakmovements. J. Exp. Biol. 203:1845–1855.
Huber, S. K., and J. Podos. 2006. Beak morphology and song features covaryin a population of Darwin’s finches (Geospiza fortis). Biol. J. Linn. Soc.88:489–498.
Irestedt, M., J. Fjeldsa, U. S. Johansson, and P. G. P. Ericson. 2002. Systematicrelationships and biogeography of the tracheophone suboscines (Aves :Passeriformes). Mol. Phylogen. Evol. 23:499–512.
Irestedt, M., J. Fjeldsa, L. Dalen, and P. G. P. Ericson. 2009. Convergentevolution, habitat shifts and variable diversification rates in the ovenbird-woodcreeper family (Furnariidae). BMC Evol. Biol. 9.
Janicke, T., S. Hahn, M. S. Ritz, and H. U. Peter. 2008. Vocal performancereflects individual quality in a nonpasserine. Anim. Behav. 75:91–98.
Johnson, K. P., and M. D. Sorenson. 1998. Comparing molecular evolu-tion in two mitochondrial protein coding genes (Cytochrome b andND2) in the dabbling ducks (Tribe: Anatini). Mol. Phylogen. Evol. 10:82–94.
Lambrechts, M. M. 1996. Organization of birdsong and constraints on perfor-mance. Pp. 305–320 in D. E. Kroodsma and E. H. Miller, eds. Ecologyand evolution of acoustic communication in birds. Cornell Univ. Press,Ithaca.
Leal, M., and L. J. Fleishman. 2004. Differences in visual signal design anddetectability between allopatric populations of Anolis lizards. Am. Nat.163:26–39.
Maddison, W. P., and D. R. Maddison. 2011. Mesquite: a modular system forevolutionary analysis. Version 2.6. Available at http://mesquiteproject.org.
Mallarino, R., P. R. Grant, B. R. Grant, A. Herrel, W. P. Kuo, and A. Abzhanov.2011. Two developmental modules establish 3D beak-shape variation inDarwin’s finches. Proc. Natl. Acad. Sci. USA 108:4057–4062.
Marantz, C. A., A. Aleixo, L. R. Bevier, and M. A. T. Patten. 2003. FamilyDendrocolaptidae (Woodcreepers). Pp. 358–447 in J. del Hoyo, A. Elliot,and D. A. Christie, eds. Handbook of the birds of the world. LynxEdicions, Barcelona.
Mayr, E. 1963. Animal species and evolution. Harvard Univ. Press,Cambridge, MA.
Morton, G. A. 1975. Ecological sources of selection on avian sounds. Am.Nat. 109:605–624.
Moyle, R. G., R. T. Chesser, R. T. Brumfield, J. G. Tello, D. J. Marchese,and J. Cracraft. 2009. Phylogeny and phylogenetic classification ofthe antbirds, ovenbirds, woodcreepers, and allies (Aves: Passeriformes:Furnariides). Cladistics 25:386–405.
1 2 EVOLUTION 2012
CORRELATED BEAK AND SONG EVOLUTION IN SUBOSCINES
Muller, J. P. 1878. On certain variation in the vocal organs of the Passeres thathave hitherto escaped notice. MacMillan, London.
Nowicki, S. 1987. Vocal-tract resonances in oscine bird sound production—evidence from birdsongs in a helium atmosphere. Nature 325:53–55.
Nowicki, S., and P. Marler. 1988. How do birds sing? Music Percept. 5:391–426.
Nowicki, S., M. W. Westneat, and W. Hoese. 1992. Birdsong: motor functionand the evolution of communication. Semin. Neurosci. 4:385–390.
Palacios, M. G., and P. L. Tubaro. 2000. Does beak size affect acoustic fre-quencies in woodcreepers? Condor 102:553–560.
Paradis, E., J. Claude, and K. Strimmer. 2004. APE: analyses of phylogeneticsand evolution in R language. Bioinformatics 20:289–290.
Pasch, B., A. S. George, P. Campbell, and S. M. Phelps. 2011. Androgen-dependent male vocal performance influences female preference inNeotropical singing mice. Anim. Behav. 82:177–183.
Patek, S. N., and T. H. Oakley. 2003. Comparative tests of evolutionarytradeoffs in a palinurid lobster acoustic system. Evolution 57:2082–2100.
Pfennig, D. W., and K. S. Pfennig. 2010. Character displacement and theorigins of diversity. Am. Nat. 176:S26–S44.
Podos, J. 1997. A performance constraint on the evolution of trilled vocal-izations in a songbird family (Passeriformes: Emberizidae). Evolution51:537–551.
———. 2001. Correlated evolution of morphology and vocal signal structurein Darwin’s finches. Nature 409:185–188.
Podos, J., and A. P. Hendry. 2006. The biomechanics of ecological speciation.Pp. 301–321. in A. Herrel, T. Speck, and N. P. Rowe, eds. Ecology andbiomechanics: a mechanical approach to the ecology of animals andplants. CRC Press, Boca Raton, FL.
Podos, J., and S. Nowicki. 2004a. Beaks, adaptation, and vocal evolution inDarwin’s finches. Bioscience 54:501–510.
———. 2004b. Performance limits on birdsong production. Pp. 318–341 in
P. Marler and H. Slabbekoorn, eds. Nature’s musicians: the science ofbirdsong. Elsevier/Academic Press, New York.
Podos, J., S. K. Huber, and B. Taft. 2004a. Bird song: the interface of evolutionand mechanism. Annu. Rev. Ecol. Evol. Syst. 35:55–87.
Podos, J., J. A. Southall, and M. R. Rossi-Santos. 2004b. Vocal mechanics inDarwin’s finches: correlation of beak gape and song frequency. J. Exp.Biol. 207:607–619.
Podos, J., D. C. Lahti, and D. L. Moseley. 2009. Vocal performance andsensorimotor learning in songbirds. Adv. Study Behav. 40:159–195.
Prychitko, T. M., and W. S. Moore. 1997. The utility of DNA sequencesof an intron from the B-fibrinogen gene in phylogenetic analysis ofwoodpeckers (Aves: Picidae). Mol. Phylogen. Evol. 8:193–204.
R-Development-Core-Team. 2008. R: a language and environment for statisti-cal computing. Foundation for Statistical Computing, Vienna. Availableat http://www.R-project.org. Accessed October 13, 2011.
Raikow, R. J. 1994. A phylogeny of the woodcreepers (Dendrocolaptinae).Auk 111:104–114.
Remsen, J. V., Jr., C. D. Cadena, A. Jaramillo, M. Nores, J. F. Pacheco,J. Perez-Eman, M. B. Robbins, F. G. Stiles, D. F. Stotz, and K. J.Zimmer. 2011. A classification of the bird species of South Amer-ica. Am. Ornithologists’ Union. Available at http://www.museum.lsu.edu/∼Remsen/SACCBaseline.html.
Riede, T., R. A. Suthers, N. H. Fletcher, and W. E. Blevins. 2006. Songbirdstune their vocal tract to the fundamental frequency of their song. Proc.Natl. Acad. Sci. USA 103:5543–5548.
Rising, J., A. Jaramillo, J. L. Copete, S. Madge, and P. Ryan. 2011. Familyemberizidae (buntings and New World Sparrows) in J. del Hoyo, A.
Elliot, and D. A. Christie, eds. Handbook of the Birds of the World.Lynx Edicions, Barcelona, Spain.
Ryan, M. J., and E. A. Brenowitz. 1985. The role of body size, phylogenyand ambient noise in the evolution of bird song. Am. Nat. 126:87–100.
Ryan, M. J., R. B. Cocroft, and W. Wilczynski. 1990. The role of environmentalselection in intraspecific divergence of mate recognition signals in thecricket frog, Acris crepitans. Evolution 44:1869–1872.
Sanın, C., C. D. Cadena, J. M. Maley, D. A. Lijtmaer, P. L. Tubaro, andR. T. Chesser. 2009. Paraphyly of Cinclodes fuscus (Aves: Passer-iformes: Furnariidae): Implications for taxonomy and biogeography.Mol. Phylogen. Evol. 53:547–555.
Seddon, N. 2005. Ecological adaptation and species recognition drives vocalevolution in neotropical suboscine birds. Evolution 59:200–215.
Seddon, N., and J. A. Tobias. 2007. Song divergence at the edge of Amazonia:an empirical test of the peripatric speciation model. Biol. J. Linn. Soc.90:173–188.
———. 2010. Character displacement from the receiver’s perspective: speciesand mate recognition despite convergent signals in suboscine birds. Proc.R. Soc. Lond. B 277:2475–2483.
Servedio, M. R., G. S. Doorn, M. Kopp, A. M. Frame, and P. Nosil. 2011.Magic traits in speciation: ‘magic’ but not rare? Trends Ecol. Evol.26:389–397.
Shaw, K. L., and Y. M. Parsons. 2002. Divergence of mate recognition behaviorand its consequences for genetic architectures of speciation. Am. Nat.159:S61–S75.
Sibley, C. G., and B. L. Monroe. 1990. Distribution and taxonomy of birds ofthe world. Yale Univ. Press, New Haven, CT.
Slabbekoorn, H., and T. B. Smith. 2002a. Bird song, ecology and speciation.Philos. Trans. R. Soc. Lond. B 357:493–503.
———. 2002b. Habitat-dependent song divergence in the little greenbul:an analysis of environmental selection pressures on acoustic signals.Evolution 56:1849–1858.
Smith, T. B. 1990. Natural selection on bill characters in the two bill morphsof the African finch Pyrenestes ostrinus. Evolution 44:832–842.
Stotz, D. F., J. W. Fitzpatrick, T. A. Parker III, and D. K. Moskovits. 1996.Neotropical birds: ecology and conservation. Univ. of Chicago Press,Chicago, IL.
Suthers, R. A. 1997. Peripheral control and lateralization of birdsong. J.Neurobiol. 33:632–652.
———. 2001. Peripheral vocal mechanisms in birds: are songbirds special?Neth. J. Zool. 51:217–242.
Suthers, R. A., and F. Goller. 1997. Motor correlates of vocal diversity insongbirds. Pp. 235–288 in J. Nolan, ed. Current ornithology. PlenumPress, New York.
Suthers, R. A., F. Goller, and C. Pytte. 1999. The neuromuscular control ofbirdsong. Philos. Trans. R. Soc. Lond. B 354:927–939.
Tinbergen, N. 1952. ‘Derived’ activities; their causation, biological signif-icance, origin, and emancipation during evolution. Q. Rev. Biol. 27:1–32.
Tobias, J. A., and N. Seddon. 2009. Signal design and perception in Hypoc-
nemis antbirds: evidence for convergent evolution via social selection.Evolution 63:3168–3189.
Tobias, J. A., J. Aben, R. T. Brumfield, E. Derryberry, W. Halfwerk, H.Slabbekoorn, and N. Seddon. 2010. Song divergence by sensory drivein Amazonian birds. Evolution 64:2820–2839.
Tobias, J. A., V. Gamarra-Toledo, D. Garcia-Olaechea, P. C. Pulgarin, andN. Seddon. 2011. Year-round resource defence and the evolution ofmale and female song in suboscine birds: social armaments are mutualornaments. J. Evol. Biol. 24:2118–2138.
EVOLUTION 2012 1 3
E. P. DERRYBERRY ET AL.
Tubaro, P. L., D. A. Lijtmaer, M. G. Palacios, and C. Kopuchian. 2002.Adaptive modification of tail structure in relation to body mass andbuckling in woodcreepers. Condor 104:281–296.
Vaurie, C. 1971. Classification of the ovenbirds (Furnariidae). Witherby,London.
Wainwright, S. A., W. D. Biggs, J. D. Currey, and J. M. Gosline.1982. Mechanical design in organisms. Princeton Univ. Press,Princeton, NJ.
Westneat, M. W., J. H. Long, W. Hoese, and S. Nowicki. 1993. Kinematicsof birdsong—functional correlation of cranial movements and acousticfeatures in sparrows. J. Exp. Biol. 182:147–171.
Wild, J. M., F. Goller, and R. A. Suthers. 1998. Inspiratory muscle activityduring bird song. J. Neurobiol. 36:441–453.
Wiley, R. H. 1991. Associations of song properties with habitats for territorialoscine birds of eastern North-America. Am. Nat. 138:973–993.
Wiley, R. H., and D. G. Richards. 1978. Physical constraints on acousticcommunication in the atmosphere. Implications for the evolution ofanimal vocalizations. Behav. Ecol. Sociobiol. 3:69–94.
Willis, E. O. 1967. The behavior of bicolored antbirds. Univ. of CaliforniaPress, Berkeley and Los Angeles.
Associate Editor: K. Petren
Supporting InformationThe following supporting information is available for this article:
Figure S1. Bayesian estimate of phylogenetic relationships among species of woodcreepers (Passeriformes: Furnariidae:
Dendrocolaptinae) as inferred from a partitioned analysis of three mitochondrial and three nuclear genes.
Figure S2. Song pace, frequency bandwidth, and vocal deviation as a function of each dimension of beak size.
Table S1. Catalogue numbers, locality information, and data for vocal samples.
Table S2. Specimen numbers, locality information, and beak measurements for samples included in morphological analyses.
Table S3. Accession numbers and locality information for samples included in the Dendrocolaptinae phylogeny.
Table S4. Song data for OTUs included in analyses of morphological constraints on song performance.
Supporting Information may be found in the online version of this article.
Please note: Wiley-Blackwell is not responsible for the content or functionality of any supporting information supplied by the
authors. Any queries (other than missing material) should be directed to the corresponding author for the article.