Correlation Analysis and Prediction of Cryptocurrencies using Machine Learning MSc Research Project MSc in Data Analytics Syed Ifthikar Student ID: x17109132 School of Computing National College of Ireland Supervisor: Dr. Catherine Mulwa
Transcript
Correlation Analysis and Prediction of Cryptocurrencies using Machine Learning
MSc Research Project MSc in Data Analytics
Syed Ifthikar Student ID: x17109132
School of Computing National College of Ireland
Supervisor: Dr. Catherine Mulwa
National College of Ireland
MSc Project Submission Sheet
School of Computing
Student Name:
Syed Ifthikar
Student ID:
X17109132
Programme:
Data Analytics
Year:
2018
Module: MSc Research Project Supervisor:
Dr. Catherine Mulwa
Submission Due Date: 20/12/2018
Project Title: Correlation Analysis and Prediction of Cryptocurrencies using Machine Learning
Word Count: 7685 Page Count: 27
I hereby certify that the information contained in this (my submission) is information pertaining to research I conducted for this project. All information other than my own contribution will be fully referenced and listed in the relevant bibliography section at the rear of the project. ALL internet material must be referenced in the bibliography section. Students are required to use the Referencing Standard specified in the report template. To use other author's written or electronic work is illegal (plagiarism) and may result in disciplinary action. Signature:
………………………………………………………………………………………………………………
Date:
………………………………………………………………………………………………………………
PLEASE READ THE FOLLOWING INSTRUCTIONS AND CHECKLIST Attach a completed copy of this sheet to each project (including multiple copies)
□
Attach a Moodle submission receipt of the online project submission, to each project (including multiple copies).
□
You must ensure that you retain a HARD COPY of the project, both for your own reference and in case a project is lost or mislaid. It is not sufficient to keep a copy on computer.
□
Assignments that are submitted to the Programme Coordinator Office must be placed into the assignment box located outside the office. Office Use Only Signature: Date: Penalty Applied (if applicable):
1
Correlation Analysis and Prediction of Cryptocurrencies using Machine Learning
Syed Ifthikar x17109132
Abstract Cryptocurrency prediction and price analysis has emerged one of the popular trends
in the forecasting domain. Since the skyrocketing price rise of cryptocurrencies, the same time last year in December 2017, it has investors waiting for a right opportunity to invest in this new age digital money which is now a commodity. The aim of this project is to help investors with an understanding of a relationship between cryptocurrencies using the correlation coefficient analysis and predicting them using different data mining algorithm models. This project investigates different statistical correlation techniques as Spearman, Pearson and Kendall for the top five cryptocurrencies ranked as per their market capitalization. The project validates the performance of different machine learning algorithms using the RMSE error rate value. Seven different algorithms were used for the prediction models out of which LSTM had a good performance, whereas Random Forest did poorly amongst all cryptocurrencies. This project will help investors with better investment decisions for such volatile cryptocurrency markets and provide insights on cryptocurrency price movement directions as well as relativity between them.
1 Introduction Prediction of cryptocurrencies is not a new introduced phenomenon. Predictions have been around since the introduction of stocks, where researchers have tried various data analytical and other techniques to analyze these stocks and predict them accurately for investors. Today with advanced data analytical and machine learning tools and technologies, companies and organizations have incorporated predictions in every aspect of business function ranging from product launch sales to customer churns and predictions through social media user comments. The domains are also not limited to technological or investment companies, there has been forecasting done for weather, water usage, traffic, health, fundraising, retail, etc., to name a few. Hence, the importance of forecasting can be deemed one of the important factors when gaining an edge in any kind of domain or investment. Cryptocurrency analysis and predictions have been sought after due to the increasing values of these crypto-coins since their inception. Along with stock and equity markets, there is a new investment market dominated by none other than cryptocurrencies. Investment companies ranging from public sector banks to private investments have been encouraging their client profiles to invest their funds into these cryptocurrencies for sooner, faster and bigger returns.
2
The rise and fall of prices in the stock market is commonplace. Similarly, it’s more volatile with the cryptocurrencies. Prices vary between 40-80 percent giving a huge factor of uncertainty amongst its investors due to its volatile nature. Therefore, the correlation analysis and prediction of these cryptocurrencies are often checked by regular investors for smart investing. The aim of this project is to help these investors with better investment opportunities, using the correlation analysis and prediction of the top 5 cryptocurrencies (Bitcoin, Ethereum, EOS, Litecoin, and Bitcoin Cash) based on their market capitalization value.1
1.1 Motivation and Background Cryptocurrency is the new age digital money which has impacted the financial world, since the launch of its first crypto-coin called Bitcoin Nakamoto (2008). Today, it’s almost been a decade since when there are more than 1700 cryptocurrencies,2 traded under the major exchanges available to the public. The reason cryptocurrencies are getting popular is due to their various advantages ranging from being fast, secure, scalable, trustworthy, reliable, decentralized and more. The fascination of owning this digital money has pushed it to being a commodity more than being a currency. Hence, the returns are to be considered huge which cryptocurrency investors have ever seen since past couple of years. This was when Bitcoin rose from the ashes and reached a peak price of close to 20,000 dollars at the end of the year in 2017,3 paving way for new billionaires making their money through investing in this cryptocurrency. This gave in to frenzy within the investor community and also to the general public. This was somewhat the start of cryptocurrency investing boom where everyone wanted to bet their money on. Today, there are different type of cryptocurrencies with different technologies and functionality. The charts of market capital are still led by Bitcoin today, owing to its popularity amongst investors. Alternate coins or Altcoins were created as an alternate to blockchain technologies, where apart from incorporating the genetics of being a cryptocurrency; most of them have been created to solve real world problems with practical use cases. Some of them with practical use cases are Bitcoin for payments and value storer, Ethereum for smart contracts, Monero for anonymity/privacy, Factom for decentralized notary, Dash for digital cash with instant/private transfer, Golem for digital super computers, Siacoin for decentralized cloud storage, Iota for internet of things, Ripple as bank’s cryptocurrency and Civic for universal digital identity.4 Hence, looking at their potential investors is even more interested in investing in new technologies and specially cryptocurrencies which incorporate them. Also, projects being developed such as Taipei cities smart city and Japans energy trading platform using Iota cryptocurrency as one such example, gives investors more traction and hope for better returns.
• RQ: “To what extent can the prices of the different cryptocurrencies (Bitcoin, Ethereum, EOS, Litecoin, and Bitcoin Cash) be predicted using the different machine learning algorithms (Moving Averages (Simple, Double, Triple), Arima, Sarima, Random Forest and LSTM) for investors to make better investment decisions?”
Sub Research Question
• Sub RQ: “To what magnitude (positive/negative) are the different cryptocurrency prices (Bitcoin, Ethereum, EOS, Litecoin, and Bitcoin Cash) correlated with each other, measured using statistical techniques (Spearman, Pearson and Kendall correlation coefficients) to help smart trading for investors?”
1.3 Research Project Objectives and Contributions The research project objectives below are proposed with respect to the research questions posed in this project with a set roadmap for completing this project successfully. Objective 1: The first objective is to source the price data for Bitcoin, Ethereum, Bitcoin Cash, Ripple and EOS cryptocurrencies. Objective 2: Cleaning and processing the data as per the project research question. Objective 3: EDA or different types of exploratory data analysis of the cleaned and sourced data. Drawing different relationships and understanding the data better. Objective 4: Developing a correlation matrix and measuring them with statistical techniques such as Spearman, Pearson and Kendall correlation techniques. This objective shall answer our sub research question posed. Objective 5: At this stage the algorithms are implemented for predictive modelling and evaluating their results. Objective 6: This is the final stage where the prediction results of different algorithms would be compared for different cryptocurrencies, fulfilling our main research question.
Contributions: The contribution of this research project to the body of knowledge is through the gaps analyzed within the literature review and the importance of the research questions posed. Based on the project objectives below are the contributions:
4
• Correlation analysis using statistical techniques for the Bitcoin, Ethereum, Bitcoin Cash, Litecoin and EOS cryptocurrencies.
• Comparison structure between all machine learning models developed for Bitcoin, Ethereum, Bitcoin Cash, Litecoin and EOS cryptocurrencies.
Rest of the technical report is structured as follows. Chapter 2 presents an investigation into existing literature available for cryptocurrencies and machine learning. Based on the results of investigated results of the literature, Chapter 3 presents the scientific methodology and architecture framework used to develop this research, based on the modified CRISP-DM approach. Chapter 4 presents the exploratory data analysis (EDA) and the correlation analysis using the Spearman, Pearson and Kendall coefficients. Chapter 5 presents the implementation, evaluation and the results of the algorithms developed. Finally, Chapter 6 presents the conclusion of the implemented research and recommended future work. 2 Related Work 2.1 Introduction Cryptocurrency related research has been extensive. Since the launch of the first ever cryptocurrency a decade ago which is “Bitcoin: A Peer-to-Peer Electronic Cash System” Nakamoto (2008), there are a number of papers which are available to discuss every aspect of this cryptocurrency. Similarly, with the launch of altcoins, there is research related to the real-world problem the respective altcoin is trying to address. Since most of the scientific papers are associated with Bitcoin, the related work in this section would be to critically review and investigate the available research on prediction of cryptocurrencies conducted using machine learning.
2.2 A Critical Review of Machine Learning Methods and Techniques Used in Cryptocurrency
As per Scott (2014) there were more than 650 Bitcoin related research papers available, but only a few discussing machine learning. Shah and Zhang (2014) added further to include that machine learning is likely used in the prediction of Bitcoin for much research related purpose. A latent source model introduced by Chen et al. (2013) was efficient in providing up to 89% returns in a span of 50 days. This model was further enhanced for accuracy by pattern and feature selecting attributes by Shah and Zhang (2014). Blockchain network feature selection was used by Madan et al. (2015) with 120, 60, and 30-minute interval time deltas, implementing Support Vector Machine (SVM), Binomial Logistic Regression classifier (GLM) and Random Forest (RF). However, generalization of the model was unsure due to the results not being cross validated. Whereas, a similar approach achieved an accuracy of 55% attempted by Greaves and Au (2015) developing an Artificial Neural Network (ANN)
5
with Support Vector Machine (SVM) model. This was using the Bitcoin blockchain examination with network-based features on controlled exchange prices and unusual stability. Bitcoin volatility prediction problem was addressed by Pichl and Kaizoji (2017) implementing Artificial Neural Network (ANN) for their time series prediction. A 10-day moving sample with 2 hidden layers were used for the prediction of the logarithmic returns, but the research did not yield results as expected and required sophisticated deep neural networks to be utilized for subsequent research utilization for better performance. A rollover framework was developed by Jang and Lee (2018) using Bayesian Neural Network (BNN) in order to select the features and gave a better performance than other models. A granular structure of Bitcoin price values at every 15 minutes was used by Nakano et al. (2018) for the developed 7-layer Artificial Neural Network (ANN) providing optimum results for a small sample of time period. Similarly, Hegazy and Mumford (2016) had the Bitcoin values at every 8-minute captured, smoothening it with a weighted linear regression. They leveraged Gaussian Discriminant Analysis (GDA), Logistic Regression, Weighted Linear Regression, boosted classifiers along with Recurrent Reinforcement Learning which modelled market behaviour effectively. Dropout regularization is well explained by Wager et al. (2013) to prevent overfitting and noise when training the data and to improve the modelling performance. However, the research by Hegazy and Mumford (2016) assumes absence of trade loss during high volatility situations, which might not be effective during real time trading scenarios. Amjad and Shah (2017) were able to use almost 3 years of Bitcoin data, implementing Logistic Regression, Random Forest and Linear Discriminant Analysis (LDA) with an accuracy of 70% with a Sharpe Ratio of 2.0 consistently for a training and testing period of a few 2-4 together. Also, the automated trading platform for Bitcoin developed using 25 attributes were granularly tested at 30 and 60 minute intervals implemented by Madan et al. (2015) and providing an accuracy of 98.7%. However, other models like Random Forest and Generalized Linear Model (GLM) developed were only able to reach an accuracy of close to 50%. A non- parametric technique implemented by Zhang et al. (2014), used a correlation-based approach for higher performance and when combined with the parametric approach, the performance peaked. A Bayesian optimized Recurrent Neural Network (RNN) and Long Short-Term Memory (LSTM) developed by McNally et al. (2018) achieved 52% accuracy for its classification, whereas ARIMA performed poorly. Hence, nonlinear models performed better as compared to linear models.
2.3 Comparison of Techniques Used in Cryptocurrency Prediction
2.3.1 Moving Averages Moving averages play an important role when smoothing out the data points in a time series data set. The assumption of linearity it makes helps in decomposing data points into trends, seasonality and noise. Multiple smoothing techniques are involved when smoothing the data for further prediction and analysis. Simple Moving Average (SMA) is one of the techniques used by McNally et al. (2018) to recognize trends within the dataset. As per his research the Bitcoin cryptocurrency data being investigated, lacked any kind of seasonality. Hence,
6
advanced techniques such as Exponential Moving Average (EMA), Double Moving Average (DMA) and Triangular Moving Average (TMA) are preferred. Double Moving Average (DMA) and Triangular Moving Average (TMA) is similar to the Simple Moving Average (SMA), with the difference being the averages calculated based on the previous averages found. Whereas, Exponential Moving Average (EMA) takes into consideration the list of all data points with a weight attached to it based on timestamps. This technique has helped create investment portfolios as such by Eisl et al. (2015) and also Bitcoin automated trading strategy developed by Żbikowski (2016) as described in his book.
2.3.2 ARIMA and SARIMA – (Seasonal) Auto Regressive Integrated Moving Average
Autoregressive Integrated Moving Average (ARIMA) being a great choice for prediction problems is due to the linear assumptions in regard to the data. Literature involving Autoregressive Integrated Moving Average (ARIMA) based prediction models is vastly available Chen et al. (2013). One of the papers by Bakar and Rosbi (2017) utilizing this technique gave average performance due to the high volatility of cryptocurrencies i.e. Bitcoin in this case. Also, a recent research by Karakoyun and Cibikdiken (2018) did not yield good results in this domain. However, it has been suggested to provide good results for predictions performed on other data sets Paul et al. (2013). SARIMA is one of the varieties of the ARIMA model, following the same concepts as ARIMA. The S in the SARIMA stands for the seasonal factor within the data for analysis. There is not much research available for this technique being used for cryptocurrency prediction. Similarly, SARIMAX is a sub model of SARIMA allowing for more than one exogenous variable for analysis Pekar and Binner (2017).
2.3.3 Long Short-Term Memory (LSTM) A part of the Recurrent Neural Network (RNN), Long Short-Term Memory (LSTM) is a deep neural network beneficial for forecasting due to the forget and remember gates used in the framework. Long Short-Term Memory (LSTM) handles inconsistencies in a much better way than the Multi-Layer Perceptron (MLP) and Recurrent Neural Network (RNN) by learning long term dependencies and recognizing the temporal element. While researching Bitcoin volatility, Pichl and Kaizoji (2017) categorized Long Short-Term Memory (LSTM) to be used to achieve higher accuracy in predictions while concluding the research. Hence, another research done by Karakoyun and Cibikdiken (2018) discussed earlier, provided better results for Long Short-Term Memory (LSTM) outperforming Autoregressive Integrated Moving Average (ARIMA) with a value of 1.40 (MAPE) Mean Absolute Percentage Error. However, time series forecasting done between Long Short-Term Memory (LSTM) and Gated Recurrent Unit (GRU) by Torres and Qiu (2018) did not provide any significant difference of results between the two.
2.4 Identified Gaps in Cryptocurrency Prediction
7
The gaps in cryptocurrency prediction have been clearly identified where Scott (2014) identifies only a few papers related to being researched in this domain. Though there are a few more research papers being added to the list throughout the years, but the numbers are still low as compared to others. There are a few recent papers discussing and comparing the techniques for a particular cryptocurrency, i.e. Bitcoin one of which is by Rebane et al. (2018) and Phaladisailoed and Numnonda (2018). However, one of the studies by Hitam and Ismail (2018) does compare a multitude of cryptocurrencies for the predictive performance, but it focusses on a few classifiers with deep neural nets for prediction and not the many other regression techniques available to be investigated. This project helps in investigating and addressing these gaps with a set of correlation and regression techniques used for the analysis, prediction and comparison of the top 5 cryptocurrencies.
2.5 Conclusion The above literature makes it evident of the amount of research available in this domain and the gaps still being filled. Our approach in this area is more comprehensive in this regard, due to the extent of the research and investigation with the various techniques used. This gives us an area of opportunity to use a regression based problem solving approach to explore, predict and compare the top 5 cryptocurrencies in the market as of writing this project. Also, the validation metric (Root Mean Square Error - RMSE) used in this project is difficult to compare for any improvement or identified gaps, as this error being of good or bad value is dependent on the size of the data used for the respective research. 3 Scientific Research Methodology Approach Used,
Architecture Design, Data Preparation and Evaluation
3.1 Introduction This chapter presents the scientific methodology and the architecture design used for the implementation of this project. The framework will further explain the components involved in this project which makes it robust and how the end user is able to query the data from a three tier architecture design.
3.2 Scientific Research Methodology Approach The scientific research methodology approach used to implement the cryptocurrency prediction models is CRISP-DM. CRISP-DM Wirth and Hipp (2000), is a widely used scientific framework modified and utilized to achieve the project objectives in a scientific manner. This methodology also enables a well-structured and documented format for a trouble-free revision Azevedo and Santos (2008). Below are the six stages of CRSIP-DM as per Figure 1. The framework has been modified to suit the project needs as per the research objectives.
8
Figure 1: CRISP-DM Modified Scientific Research Methodology
Project Understanding – Understanding of the cryptocurrency prediction project. Data Exploration – Exploration and Correlation Analysis of cryptocurrency data. Data Cleaning –Cleaning and pre-processing of the data for the cryptocurrencies. Predictive Modelling – Analyzing and modelling prediction algorithms for cryptocurrencies. Implementation and Evaluation – Implementing algorithms for cryptocurrency prediction. Results Presentation – Presenting the evaluated results of cryptocurrency prediction models.
3.3 Architecture Design The design of this project is based on three-tier architecture, client, business logic and the data persistent tier as displayed in Figure 2. Below are further details on the architecture system design. Tier 1 (Client) – Here the end user is able to query the cryptocurrency data to generate the relevant output and visualize the results of the cryptocurrency modelling using the available visualization toolkit.
9
Tier 2 (Business Logic) – At this tier, the algorithms and modelling techniques on cryptocurrencies are performed i.e Moving Averages (Simple, Double, Triple), Arima, Sarima, Random Forest and LSTM (RNN), which is then used by the business as per the requirement to help the end users. Tier 3 (Data Tier) – The data persistent tier is where the cryptocurrency data is sourced, cleaned, pre-processed and stored in a csv format.
Figure 2: Architecture Design
3.4 Data Collection Cryptocurrency data is widely available from multiple websites. On the lookout for the historical data for the project, a few points regarding the project had to be considered. To start with, it was the timeframes of cryptocurrencies since which they existed and how it may affect the predictive performance of each. In one such case is the Bitcoin, where there is a data spread across for many consecutive years with multiple formats and time differences, available on a daily, hourly and even minute spreads of data collections. However, looking at the other end there are quite a few new entry cryptocurrencies which have climbed the market capitalization charts like EOS block chain. The data for this particular cryptocurrency was only available since its launch in 2017.5 Hence, the collection of the data was based on the project objectives to be achieved. Also, for fair implementation and prediction of these cryptocurrencies, the daily data was collected only between 2017 and 2018, as this formed an intersection for data points in existence for all cryptocurrencies. This was through the website called cryptodatadownload which helped to
5 https://coinmarketcap.com/
10
source free historical data to be downloaded for our project.6 The exchange chosen was Hit- BTC Exchange which is one of the famous exchanges within Europe.7 It has over 800 cryptocurrencies being available and traded in the market as of writing this project.8 This completes Objective 1 of this project.
3.5 Data Pre-Processing Data pre-processing for all cryptocurrencies was done in Python. Once the data was sourced and collected, the dataset was then imported to python. Using the most effective data structure and data analysis (pandas) package toolkit, the existing data was first analyzed before any cleaning, put within a data-frame. The closing price distribution of each of the cryptocurrencies was plotted on a graph with a month wise gap using (matplotlib) library installed, to analyze the trend amongst these cryptocurrencies. Also, the candlestick charts were plotted to analyze the volatility measure of these cryptocurrencies. Later, a correlation matrix heat map for all of these cryptocurrencies using the function (corrmat). This was done by configuring the environment with the data visualization library (seaborn) based on matplotlib. For stationarity, statistics and predictive analytics a python module (statsmodels) was used. For deep neural network such as LSTM, the deep learning libraries (scikit-learn and keras) were used focused on enabling faster implementation. The imputations of missing values, along with the execution and analysis were done using Python itself. Further information regarding the processing of the data has been defined in the configuration manual. This completes Objective 2 of this project.
3.6 Software Technologies and Programming Analysis Toolkit The analysis tool chosen for this project has been open source programming language Python.9 Python with its dependencies as an open source software has been proved to be efficient and flexible with the processing and completion of this project. Anaconda Distribution Navigator has been the backend for the package dependencies.10 Jupyter Notebook with its availability through the web browser using the local host, is used to access the Python using the Anaconda Distribution Navigator.11 Further description, plots and graphs regarding the data analysis has been detailed in the configuration for better understanding regarding the implementation of this project.
3.7 Evaluation Methodology Correlation analysis performed in this project is tested through the statistical techniques which is the Spearman’s, Kendall’s and Pearson’s correlation coefficients. These are the most common measures for bivariate data. There are few studies related to the statistical impact of each. One of them is by Hauke and Kossowski (2011) which compares the statistical power 6 https://www.cryptodatadownload.com/ 7 https://www.coingecko.com/en/exchanges/hitbtc 8 https://coinmarketcap.com/exchanges/hitbtc/ 9 https://www.python.org/downloads/ 10 https://www.anaconda.com/what-is-anaconda/ 11 https://jupyter.org/
11
of these tests concluding the Pearson’s correlation coefficient to be more statistically powerful unless the data is skewed to a large extent. Whereas for prediction accuracy, the evaluation metric used in this project is the Root Mean Square Error – RMSE. Though r and r square have been well explained by Li (2017) in her research but this evaluation is more tilted towards correlation and not accuracy. Whereas, RMSE is employed widely not just in prediction literature, but also in signal processing Lahmiri and Bekiros (2019). ACF, PACF plots are then used to infer parameters and residuals for machine learning algorithms where required.
3.8 Conclusion This chapter concludes the scientific research methodology approach used, architecture design, data collection as well as data preparation and evaluation techniques being justified. This chapter concluded the completion of Objective 1 and Objective 2 as defined for the project in Section 1.3. 4 Exploratory Data and Correlation Coefficient Analysis 4.1 Introduction This chapter entails the exploration of different price distributions, candlestick charts to analyze any trends and seasonality. It also includes the correlation analysis for the Spearman, Pearson and Kendall Coefficients for the top 5 cryptocurrencies.
4.2 Exploratory Data Analysis (EDA) Dataset for all cryptocurrencies sourced have been exploratory analyzed in order to identify the trends for each of the cryptocurrencies. Using price distribution figures and candlestick charts will help understand the data visually and how it variates through the time series. Visual charts help the most when the data has a volatile spread. This helps us know the movement of the price and with the application of the necessary techniques to analyze it further for the prediction.
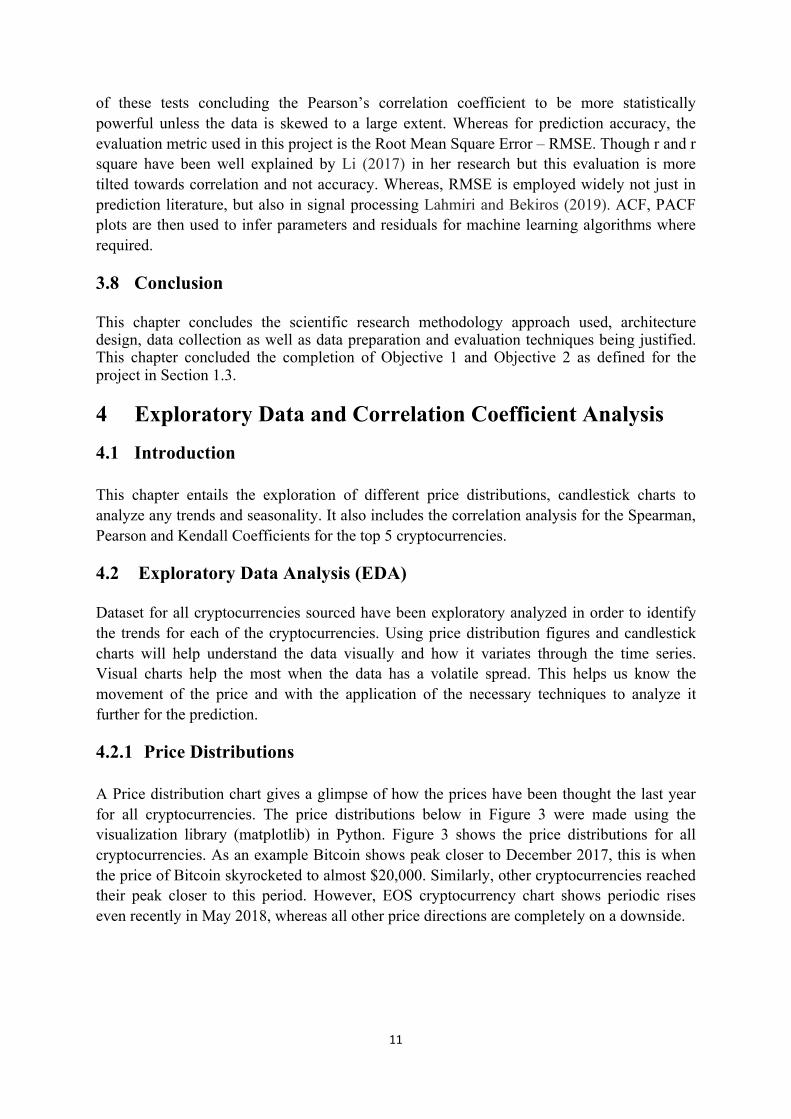
4.2.1 Price Distributions A Price distribution chart gives a glimpse of how the prices have been thought the last year for all cryptocurrencies. The price distributions below in Figure 3 were made using the visualization library (matplotlib) in Python. Figure 3 shows the price distributions for all cryptocurrencies. As an example Bitcoin shows peak closer to December 2017, this is when the price of Bitcoin skyrocketed to almost $20,000. Similarly, other cryptocurrencies reached their peak closer to this period. However, EOS cryptocurrency chart shows periodic rises even recently in May 2018, whereas all other price directions are completely on a downside.
12
Figure 3: Price Distribution Charts for all five cryptocurrencies
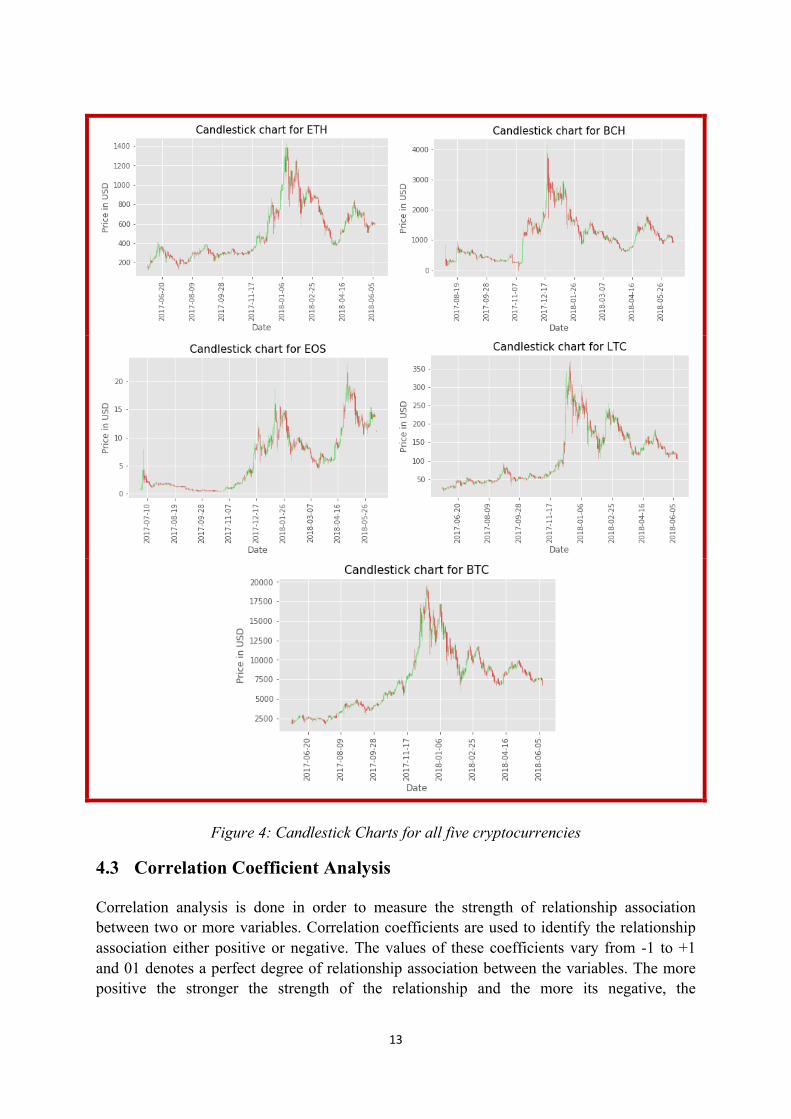
4.2.2 Candlestick Charts Candlestick charts are good at analysing the market fluctuations and how the market performs. The candlestick charts in Figure 4 were created using the libraries (matplotlib and pandas) with the candlestick_ohlc function. The candlestick charts show how volatile the cryptocurrency markets are. The green candles are an indication of the price moving upwards and the red indicates the movement of price downwards. It’s clear on how the trend keeps varying amongst all the cryptocurrencies and making the market volatile.
13
Figure 4: Candlestick Charts for all five cryptocurrencies
4.3 Correlation Coefficient Analysis Correlation analysis is done in order to measure the strength of relationship association between two or more variables. Correlation coefficients are used to identify the relationship association either positive or negative. The values of these coefficients vary from -1 to +1 and 01 denotes a perfect degree of relationship association between the variables. The more positive the stronger the strength of the relationship and the more its negative, the
14
relationship strength is inversely associated with the dependent variable. This project has three types of statistic correlation measures analyzed as below for the top 5 cryptocurrencies.
4.3.1 Spearman Correlation Spearman Rank Correlation is a non-parametric statistical technique measuring the degree of relationship association between the variables. It does not have any assumptions on data distribution and just requires the data to be ordinal. Figure 5 gives the formula, result and heat map generated to calculate the Spearman Rank Correlation. The output was obtained through the corrmatt function in the pandas library. All the results are positively correlated showing a positive relationship between all cryptocurrencies. The least correlation coefficient was between EOS and Bitcoin of 0.66.
Figure 5: Spearman Correlation Coefficient formula and results
4.3.2 Pearson Correlation Pearson Correlation is one of the most popular of the correlation statistic techniques. It is used for variables related linearly and normally distributed. It also includes an assumption of linearity and homoscedasticity. Figure 6 gives the formula, result and heat map generated to calculate the Pearson Correlation. The least correlation coefficient even in the Pearson Correlation was between EOS and Bitcoin of 0.56.
15
Figure 6: Pearson Correlation Coefficient formula and results
4.3.3 Kendall Correlation Kendall Correlation is also a non-parametric statistical technique similar to Spearman Rank Correlation, measuring the dependence strength between two or more variables. Figure 7 gives the formula, result and heat map generated to calculate the Kendall Correlation. The least correlation coefficient was between EOS and Bitcoin of 0.40.
Figure 7: Kendall Correlation Coefficient formula and results
16
4.4 Conclusion The price distribution charts and candlestick charts are a good method of exploring the data to understand how the distributions exist within the dataset. However, correlation coefficients are very handy in terms of understanding the relationships between different features within the dataset. The Pearson correlation coefficient is one of the popular methods for variables distributed normally and Spearman correlation coefficient would be better utilised for non-linear relationships. The use of statistical techniques is just to achieve the purpose of the intended study. Hence, looking at the figures, they have been consistent for all cryptocurrencies for all statistical correlation tests, though far from each other in numbers. The highest positive correlation strength within all statistical models were Bitcoin and Litecoin, whereas the least were Bitcoin and EOS. None of them had any negative correlation coefficients. This helps us understand that the price movements across cryptocurrencies are somewhat correlated with each other and hence they follow a similar trend when moving upwards or downwards. This completes Objective 3 and 4 of this project. 5 Implementation, Evaluation and Results of
Cryptocurrency Prediction Models
5.1 Introduction This chapter illustrates the modelling of prediction algorithms for cryptocurrencies. It also, includes the stationarity check with the statistical test done before the prediction algorithms were implemented. The evaluation metric used to evaluate the models has been well defined. The results are then discussed and also compared with the performance of other regression models.
5.2 Root Mean Square Error (RMSE) The Root Mean Square Error (RMSE) has been used as the evaluation metric for this project. It gives the error rate for the prediction models implemented. This error measures the distance of the residuals from regression data line. This error describes the spread of residuals around the line of best fit and then squares them. This validation metric is useful for analyzing the error in regression model and to minimize them. The formula in Figure 8 describes the Root Mean Square Error (RMSE) in mathematical form, where “Yi” represents the predicted value and the “Yi-Hat” represents the actual value in the error. This has been implemented using the mean_squared_error function in the scikit-learn library.
17
Figure 8: RMSE formula
5.3 Stationarity Check with Seasonal Decomposition of Time Series Stationarity check is generally performed on time series data to check if the data is stationary or not. This is done due to the time series data belonging to a different temporal structure than its traditional classification counterparts. This is to make sure the assumptions with the consistency of the observed values are handled to be specific and not violating these assumptions with the addition of seasonality, trend and other time dependent components. Figure 8 shows the rolling mean and standard deviation of the Bitcoin “Open” price, the decomposition of the Bitcoin price with respect to the trends, seasonality and residuals. It also represents the Dickey Fuller Test result which shows that the time series data chosen is very much stationary as the p-value is close to 0.5, being statistically significant. Similar stationarity checks have been performed for other cryptocurrencies to analyze the p-value and if the data is suitable for performing the predictive analytics. The details of it are further described in the configuration manual.
18
Figure 9: Dickey-Fuller Test Results and Decomposition Series for Bitcoin
5.4 Implementation, Evaluation and Results of Moving Averages
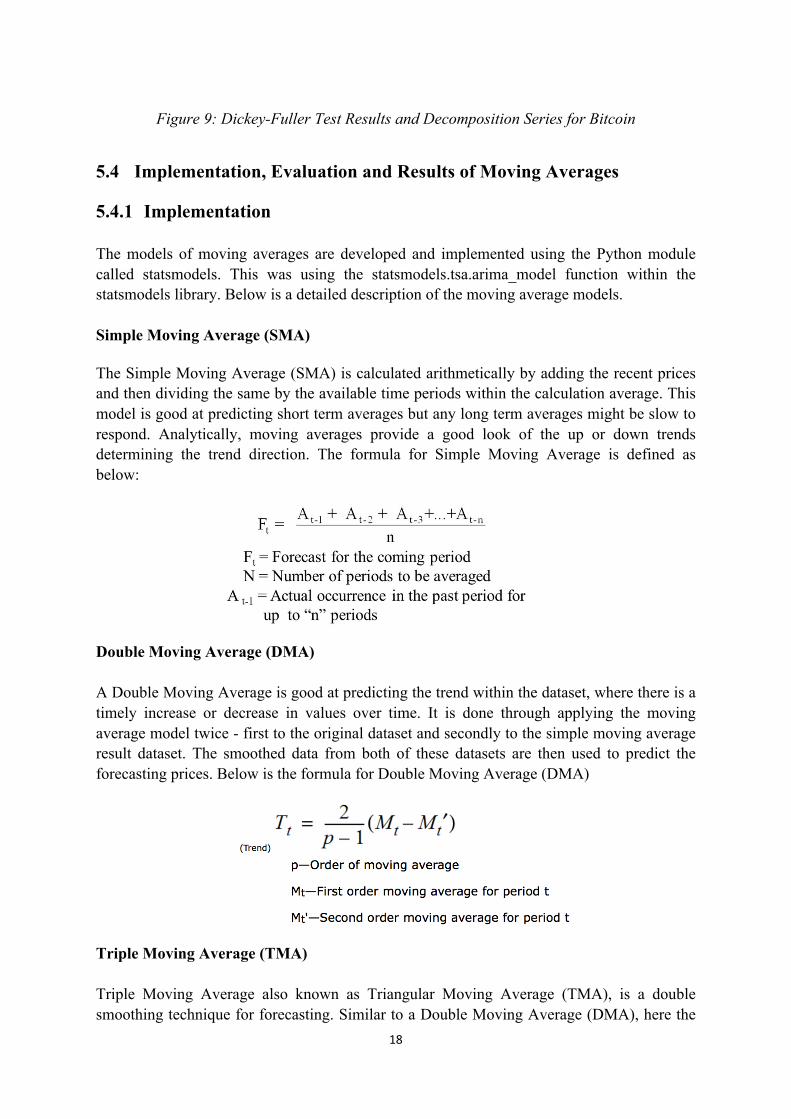
5.4.1 Implementation The models of moving averages are developed and implemented using the Python module called statsmodels. This was using the statsmodels.tsa.arima_model function within the statsmodels library. Below is a detailed description of the moving average models. Simple Moving Average (SMA) The Simple Moving Average (SMA) is calculated arithmetically by adding the recent prices and then dividing the same by the available time periods within the calculation average. This model is good at predicting short term averages but any long term averages might be slow to respond. Analytically, moving averages provide a good look of the up or down trends determining the trend direction. The formula for Simple Moving Average is defined as below: Double Moving Average (DMA) A Double Moving Average is good at predicting the trend within the dataset, where there is a timely increase or decrease in values over time. It is done through applying the moving average model twice - first to the original dataset and secondly to the simple moving average result dataset. The smoothed data from both of these datasets are then used to predict the forecasting prices. Below is the formula for Double Moving Average (DMA) Triple Moving Average (TMA) Triple Moving Average also known as Triangular Moving Average (TMA), is a double smoothing technique for forecasting. Similar to a Double Moving Average (DMA), here the
19
averages are averaged twice or more times for the resulting values. Though, this technique is not so good at predicting long term (volatile) changes in direction, it is good for short term changes in the trend and prediction. Below is the formula for Triple Moving Average (DMA):
5.4.2 Evaluation and Results The results shown in Table 1 give a brief perspective of how the models performed across the different cryptocurrencies. The error rate for Bitcoin was the highest and EOS the lowest in value. However, this is not to be confused with Bitcoin having a larger error rate than its lower counterpart EOS. This difference is due to the price, as Bitcoin has the highest worth amongst all cryptocurrencies, whereas EOS has the lowest. When describing Root Mean Square Error (RMSE) it was discussed that the error is dependent on the values within the dataset. The interesting thing to note in this result is the values being comparatively consistent for all models except for a few changes in the lower end of the decimals. This shows that the concept of averaging the values overtime using the different techniques used for the project provide similar result.
Table 1: Comparative results of all five cryptocurrencies for SMA, DMA and TMA models
RMSE Error Value SMA DMA TMA
Bitcoin 540.82 542.88 546.42
Ethereum 41.10 41.06 41.07
EOS 0.84 0.84 0.84
Litecoin 11.30 11.29 11.27
BCH 143.08 142.10 142.05
5.5 Implementation, Evaluation and Results of ARIMA Model
5.5.1 Implementation ARIMA or Auto-Regressive Integrated Moving Average model relies on past values to forecast any predictions, using any historical patterns in the data values. The order parameters (p,d,q) are the components specified within the algorithm. A Box-Jenkin’s technique is usually referred to the ARIMA model fitting. ARIMA consists of 3 components:
• AR (p) - The lags specified in the model
20
• I (d) - Differencing component for non-stationary values • MA(q) - Number of error terms in the model
The model used for Bitcoin had the components set as (1,0,5) with the opening price as the dependent variable. The I(d) component was set as 0 as the dataset did not require any differencing due to it being stationary. The lag value was set as 1 with 5 error terms. The non-seasonal ARIMA equation is as follows:
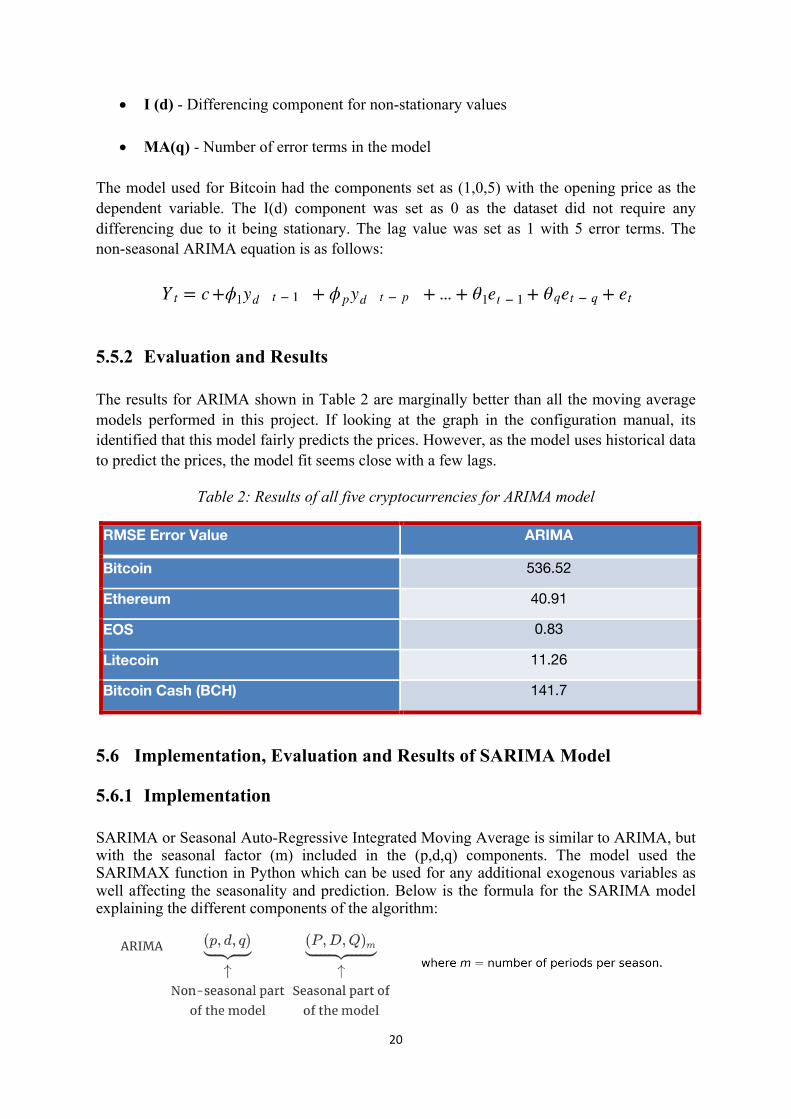
5.5.2 Evaluation and Results The results for ARIMA shown in Table 2 are marginally better than all the moving average models performed in this project. If looking at the graph in the configuration manual, its identified that this model fairly predicts the prices. However, as the model uses historical data to predict the prices, the model fit seems close with a few lags.
Table 2: Results of all five cryptocurrencies for ARIMA model
RMSE Error Value ARIMA
Bitcoin 536.52
Ethereum 40.91
EOS 0.83
Litecoin 11.26
Bitcoin Cash (BCH) 141.7
5.6 Implementation, Evaluation and Results of SARIMA Model
5.6.1 Implementation SARIMA or Seasonal Auto-Regressive Integrated Moving Average is similar to ARIMA, but with the seasonal factor (m) included in the (p,d,q) components. The model used the SARIMAX function in Python which can be used for any additional exogenous variables as well affecting the seasonality and prediction. Below is the formula for the SARIMA model explaining the different components of the algorithm:
21
5.6.2 Evaluation and Results SARIMA has outperformed ARIMA comparatively with better results as per Table 3. Adding the seasonality order within the SARIMAX function in Python did improve the results. However, all cryptocurrencies due to their volatile nature lacked seasonality and their graphs emerged repetitive. The covariance matrix has been mapped further for SARIMA with residuals detailed in the configuration manual.
Table 3: Results of all five cryptocurrencies for SARIMA model
RMSE Error Value SARIMA
Bitcoin 521.9
Ethereum 38.66
EOS 0.78
Litecoin 10.69
Bitcoin Cash (BCH) 139.27
5.7 Implementation, Evaluation and Results of Random Forests Model
5.7.1 Implementation Random Forests is a supervised ensemble algorithm. It uses an ensemble of decision trees to calculate the overall result with an introduction of randomness in the operation. These decision trees are mainly trained with a bagging method which uses various different learning models to increase the result overall. To implement Random Forests a new column was created shifting the open value to one step ahead and splitting the data into training (70%) and testing (30%). Other independent variables were then used (‘High’, ‘Low', ‘Open',' Close’, 'Volume To’) in order to predict the dependent variable “Open_Next”. Below is an overview of Random Forests.12
Being an ensemble method, expectation was that this model would perform better than the other implemented algorithms in this project. However, as per Table 4 the performance of the models was bad even when compared to the simple moving averages. The RMSE score was too high for all cryptocurrencies.
Table 4: Results of all five cryptocurrencies for Random Forests model
RMSE Error Value Random Forests
Bitcoin 691.35
Ethereum 45.57
EOS 1.08
Litecoin 13.37
Bitcoin Cash 166.07
23
5.8 Implementation, Evaluation and Results of (LSTM) Model
5.8.1 Implementation LSTM or Long Short-Term Memory is a a type of Recurrent Neural Network specially designed to long term dependency issue. Unlike RNN, LSTM has a cell state regulated by structured gates. The sigmoid layer helps control this gate, controlling the cell state. This helps LSTM to account for information passed through these gates both short and long term. Using the keras and scikit-learn library designed for deep neural networks, the LSTM model was built. After normalizing the data using the minmaxscaler function the data was split into training (70%) and testing (30%). With a lookback function the training model was reshaped and ran with 300 epochs with Adam optimizer. The loss value was plotted, and accuracy being calculated using RMSE figures. Below is a framework of the LSTM network.13
Figure 11: LSTM Network
5.8.2 Evaluation and Results The results displayed in Table 5 show that the LSTM’s outperformed all other models in this project with a good RMSE error, with the exception of EOS cryptocurrency. This is due to the neural networks performing better than other naive techniques. However, the EOS
cryptocurrency RMSE error was more than a few other models implemented in this project. This could generally be due to the hyper parameters or the optimizer.
Table 5: Results of all five cryptocurrencies for LSTM model
RMSE Error Value LSTM
Bitcoin 360.98
Ethereum 30.68
EOS 0.98
Litecoin 7.58
Bitcoin Cash 75.50
5.9 Discussion, Comparison of Developed Models and Conclusion Table 6 provides a comparison of the different models except the Moving Averages which have been compared in Section 5.4.2. From the comparison table, there is an understanding of the performance improvements throughout the experiments being carried out, lowering the error value with an exception of Random Forest. However, the improvements do not differentiate between the different cryptocurrencies being compared. This is due to the different price values associated with the respective cryptocurrencies and their correlation with each other remaining consistent. The performance of these models could be improved with different tuning parameters such as optimizers and the number of epochs being used, along with different training splits. Also, since the dataset is small, this could take additional variables available such as hash rate, transaction values, mining blocks, etc., to improve prediction values. The moving averages performed poorly when trying to average the averages using DMA and TMA. Also, using SARIMA did improve the results with no much seasonality within the cryptocurrency dataset. This was done to study if there are any improvements with the seasonality order when the dataset depicts none. The results do show the performance of deep neural networks such as LSTM which were able to give an impressive error performance. This concludes the final chapter of implementation, evaluation and results. Also, this takes us to the completion of the final Objectives (5 and 6) outlined in Section 1.3 of this project.
Table 6: Comparative results of all five cryptocurrencies for LSTM, Random Forests, Sarima and Arima
25
RMSE Error Val LSTM Random Forests SARIMA ARIMA
Bitcoin 360.98 691.35 521.9 536.52
Ethereum 30.68 45.57 38.66 40.91
EOS 0.98 1.08 0.78 0.83
Litecoin 7.58 13.37 10.69 11.26
Bitcoin Cash 75.50 166.07 139.27 141.7
6 Conclusion and Future Work The project objectives have been successfully achieved and hence answering the research question and sub research question posed. This was done using the correlation coefficients calculated using the different statistical techniques such as Spearman, Pearson and Kendall correlation coefficients. The understanding achieved through this experiment was the positive association and strength of the relationship. All cryptocurrencies were more or less correlated with each other positively. The implementation of different regression models helped us go from a basic simple moving average to neural networks with LSTM. The LSTM performed the best, whereas Random Forest model performed the worst. The expectations from this project were to find any exclusive differences from the different algorithms and models run. However, the results for all cryptocurrencies across all models performed very similarly. This might explain how the prediction performance can show closely related results though selecting different variables for the test. This can be attributed due to the positive correlation between the different cryptocurrencies which has been validated in this project with the different statistical techniques used. These experiments are a case study on understanding on how cryptocurrencies can be predicted while being volatile but also a relationship drawn with the techniques used. The experiments do have limitations due to the size of the dataset as the neural networks learn better with more historical values. Still, LSTM was able to perform better than the others. Any extended research on this paper may involve using more variable values extending to a lengthier historical period of time to build better models. The approach for the future work could also involve real-time cryptocurrency prediction using these algorithms using an automated system helping investors to trade, when the price goes high or low depending on the prediction
Acknowledgements I would like to thank my supervisor Dr. Catherine Mulwa for her help and support throughout my thesis module. Her guidance has been the utmost paving the path for this project completion. I would also like to extend my special thanks to Subiya Mahin for her patience and support for the past year during my journey and my quest to attain a wealth of knowledge through this Master of Science Program in Data Analytics.
26
References Amjad, M. and Shah, D., 2017, February. Trading Bitcoin and Online Time Series Prediction. In NIPS 2016 Time Series Workshop (pp. 1-15). Azevedo, A.I.R.L. and Santos, M.F., 2008. KDD, SEMMA and CRISP-DM: a parallel overview. IADS-DM. Bakar, N.A. and Rosbi, S., 2017. Autoregressive Integrated Moving Average (ARIMA) Model for Forecasting Cryptocurrency Exchange Rate in High Volatility Environment: A New Insight of Bitcoin Transaction. International Journal of Advanced Engineering Research and Science, 4(11). Chen, G.H., Nikolov, S. and Shah, D., 2013. A latent source model for nonparametric time series classification. In Advances in Neural Information Processing Systems (pp. 1088-1096). Eisl, A., Gasser, S. and Weinmayer, K., 2015. Caveat Emptor: Does Bitcoin Improve Portfolio Diversification?. Greaves, A. and Au, B., 2015. Using the bitcoin transaction graph to predict the price of bitcoin Hauke, J. and Kossowski, T., 2011. Comparison of values of Pearson's and Spearman's correlation coefficients on the same sets of data. Quaestiones geographicae, 30(2), pp.87-93. Hegazy, K. and Mumford, S., 2016. Comparitive automated bitcoin trading strategies. CS229 Project. Hitam, N.A. and Ismail, A.R., 2018. Comparative Performance of Machine Learning Algorithms for Cryptocurrency Forecasting. Indonesian Journal of Electrical Engineering and Computer Science, 11(3). Jang, H. and Lee, J., 2018. An empirical study on modeling and prediction of bitcoin prices with bayesian neural networks based on blockchain information. IEEE Access, 6, pp.5427-5437. Karakoyun, E.Ş. and Çıbıkdiken, A.O., 2018. Comparison of ARIMA Time Series Model and LSTM Deep Learning Algorithm for Bitcoin Price Forecasting. Proceedings of MAC 2018 in Prague, p.171. Lahmiri, S. and Bekiros, S., 2019. Cryptocurrency forecasting with deep learning chaotic neural networks. Chaos, Solitons & Fractals, 118, pp.35-40. Li, J., 2017. Assessing the accuracy of predictive models for numerical data: Not r nor r2, why not? Then what?. PloS one, 12(8), p.e0183250. Madan, I., Saluja, S. and Zhao, A., 2015. Automated bitcoin trading via machine learning algorithms. URL: http://cs229. stanford. edu/proj2014/Isaac% 20Madan, 20. McNally, S., Roche, J. and Caton, S., 2018, March. Predicting the price of Bitcoin using Machine Learning. In Parallel, Distributed and Network-based Processing (PDP), 2018 26th Euromicro International Conference on (pp. 339-343). IEEE.
27
Nakamoto, S., 2008. Bitcoin: A peer-to-peer electronic cash system. Nakano, M., Takahashi, A. and Takahashi, S., 2018. Bitcoin technical trading with artificial neural network. Paul, J.C., Hoque, M.S. and Rahman, M.M., 2013. Selection of Best ARIMA Model for Forecasting Average Daily Share Price Index of Pharmaceutical Companies in Bangladesh: A Case Study on Square Pharmaceutical Ltd. Global Journal of Management and Business Research Pekar, V. and Binner, J., 2017. Forecasting Consumer Spending from Purchase Intentions Expressed on Social Media. In Proceedings of the 8th Workshop on Computational Approaches to Subjectivity, Sentiment and Social Media Analysis (pp. 92-101). Phaladisailoed, T. and Numnonda, T., 2018, July. Machine Learning Models Comparison for Bitcoin Price Prediction. In 2018 10th International Conference on Information Technology and Electrical Engineering (ICITEE) (pp. 506-511). IEEE. Pichl, L. and Kaizoji, T., 2017. Volatility Analysis of Bitcoin Price Time Series. Rebane, J., Karlsson, I., Denic, S. and Papapetrou, P., 2018. Seq2Seq RNNs and ARIMA models for cryptocurrency prediction: A comparative study. Scott, B., 2014. Bitcoin academic research. The Heretic’s Guide to Global Finance: Hacking the Future of Money, 30. Shah, D. and Zhang, K., 2014, September. Bayesian regression and Bitcoin. In Communication, Control, and Computing (Allerton), 2014 52nd Annual Allerton Conference on (pp. 409-414). IEEE. Torres, D.G. and Qiu, H., 2018. Applying Recurrent Neural Networks for Multivariate Time Series Forecasting of Volatile Financial Data. Wager, S., Wang, S. and Liang, P.S., 2013. Dropout training as adaptive regularization. In Advances in neural information processing systems (pp. 351-359). Wirth, R. and Hipp, J., 2000, April. CRISP-DM: Towards a standard process model for data mining. In Proceedings of the 4th international conference on the practical applications of knowledge discovery and data mining (pp. 29-39). Citeseer. Żbikowski, K., 2016. Application of Machine Learning Algorithms for Bitcoin Automated Trading. In Machine Intelligence and Big Data in Industry (pp. 161-168). Springer, Cham. Zhang, K., 2014. Learning time series data using cross correlation and its application in bitcoin price prediction(Doctoral dissertation, Massachusetts Institute of Technology).