Correlation between Braden Scale and Palliative Performance Scale in advanced illness Vincent Maida, Francis Lau, Michael Downing, Ju Yang Maida V, Lau F, Downing M, Yang J. Correlation between Braden Scale and Palliative Performance Scale in advanced illness. Int Wound J 2008;5:585–590. ABSTRACT This study describes the significant correlation between the Braden Scale (BS) and the Palliative Performance Scale (PPS) in patients with advanced illness that has not been previously reported. The analysis was based on a prospective sequential case series of 664 patients suffering from advanced illness who were referred to a regional palliative medicine programme in Toronto, Canada. Baseline BS and PPS scores assessed within 24 hours of referral were considered for analysis. After controlling for age, gender, consult site and diagnosis (cancer versus non cancer), we observed a significant positive correlation between baseline PPS and BS scores (r ¼ 0885, P , 0001). These findings suggest that for patients with advanced illness where BS is not routinely used, PPS could be considered as a proxy for pressure ulcer risk assessment. Key words: Advanced illness • Braden Scale • Palliative care • Palliative Performance Scale • Pressure ulcers INTRODUCTION Patients with advanced illness are in transition from curative care to supportive and palliative care (1). The overall management of such patients is complex as multiple management issues exist. Wound management is increasingly being recognised as a major domain in their overall care. Patients with advanced illness experience a wide range of wound-related concerns (1) . Pressure ulcers represent up to 57% of all wounds seen in this clinical context (1) . Significant controversy exists regarding pres- sure ulcers; one position is that they are completely preventable and thus their occur- rence reflects negligence and neglect, while the other position asserts that they are largely inevitable and represent part of the natural history of advanced illness. The truth lies somewhere in between these two extreme positions. The Braden Scale (BS) (Figure 1), first devel- oped in 1984 by Braden and Bergstrom (2), is a tool designed to assess the patient’s level of risk in developing pressure ulcers. The BS is comprised of six subscales that assess a patient’s sensory perception, the skin’s exposure to moisture, activity level, mobility, nutritional status, and friction and shear. For five of the subscales (sensory perception, mobility,activity, moisture and nutrition), the scores range from 1 to 4, with 4 representing the highest. The last subscale (friction and shear) ranges from 1 to 3. The sum of the six subscale scores yields the total BS score, which can range from 6 to 23. Key Points • the Braden Scale (BS), first developed in 1984 by Braden and Bergstrom, is a tool de- signed to assess the patient’s level of risk in developing pressure ulcers Authors: V Maida, MD, BSc, CCFP, ABHPM, Division of Palliative Medicine, William Osler Health Centre, University of Toronto, Toronto, Canada; F Lau, PhD, School of Health Information Science, University of Victoria, Victoria, Canada; M Downing, MD, Division of Palliative Care, University of British Columbia, British Columbia, Canada, British Columbia Cancer Agency, and Victoria Hospice, School of Health Information Science, University of Victoria, Victoria, Canada; J Yang, BSc, School of Health Information Science, University of Victoria, Victoria, Canada Address for correspondence: Dr V Maida, MD, BSc, CCFP, ABHPM, 101 Humber College Boulevard, Toronto, Ontario, Canada M9V 1R8 E-mail: [email protected]ORIGINAL ARTICLE ª 2008 The Authors. Journal Compilation ª 2008 Blackwell Publishing Ltd and Medicalhelplines.com Inc • International Wound Journal • Vol 5 No 4 585
Transcript
Correlation between BradenScale and PalliativePerformance Scale inadvanced illnessVincent Maida, Francis Lau, Michael Downing, Ju Yang
Maida V, Lau F, Downing M, Yang J. Correlation between Braden Scale and Palliative Performance Scale inadvanced illness. Int Wound J 2008;5:585–590.
ABSTRACTThis study describes the significant correlation between the Braden Scale (BS) and the Palliative PerformanceScale (PPS) in patients with advanced illness that has not been previously reported. The analysis was based ona prospective sequential case series of 664 patients suffering from advanced illness who were referred toa regional palliative medicine programme in Toronto, Canada. Baseline BS and PPS scores assessed within24 hours of referral were considered for analysis. After controlling for age, gender, consult site and diagnosis(cancer versus non cancer), we observed a significant positive correlation between baseline PPS and BS scores(r ¼ 0�885, P , 0�001). These findings suggest that for patients with advanced illness where BS is not routinelyused, PPS could be considered as a proxy for pressure ulcer risk assessment.
INTRODUCTIONPatients with advanced illness are in transition
from curative care to supportive and palliative
care (1). The overall management of such
patients is complex as multiple management
issues exist.Woundmanagement is increasingly
being recognised as a major domain in their
overall care. Patients with advanced illness
experience a wide range of wound-related
concerns (1). Pressure ulcers represent up to
57%of allwounds seen in this clinical context (1).
Significant controversy exists regarding pres-
sure ulcers; one position is that they are
completely preventable and thus their occur-
rence reflects negligence and neglect, while the
other position asserts that they are largely
inevitable and represent part of the natural
history of advanced illness. The truth lies
somewhere in between these two extreme
positions.
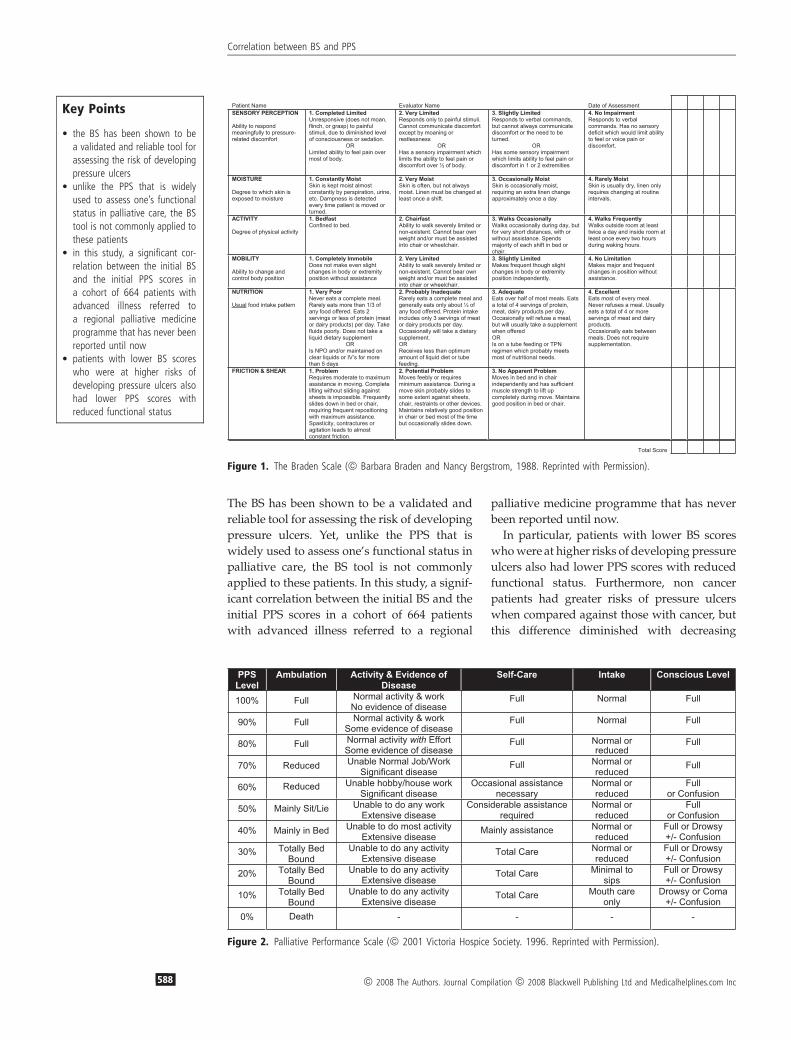
The Braden Scale (BS) (Figure 1), first devel-
oped in 1984 by Braden and Bergstrom (2), is
a tool designed to assess the patient’s level of
risk in developing pressure ulcers. The BS is
comprised of six subscales that assess a patient’s
sensory perception, the skin’s exposure to
moisture, activity level, mobility, nutritional
status, and friction and shear. For five of the
subscales (sensory perception,mobility, activity,
moisture and nutrition), the scores range from 1
to 4, with 4 representing the highest. The last
subscale (friction and shear) ranges from 1 to 3.
The sum of the six subscale scores yields the
total BS score, which can range from 6 to 23.
Key Points
• the Braden Scale (BS), firstdeveloped in 1984 by Bradenand Bergstrom, is a tool de-signed to assess the patient’slevel of risk in developingpressure ulcers
Authors: V Maida, MD, BSc, CCFP, ABHPM, Division ofPalliative Medicine, William Osler Health Centre, University ofToronto, Toronto, Canada; F Lau, PhD, School of HealthInformation Science, University of Victoria, Victoria, Canada; MDowning, MD, Division of Palliative Care, University of BritishColumbia, British Columbia, Canada, British Columbia CancerAgency, and Victoria Hospice, School of Health InformationScience, University of Victoria, Victoria, Canada; J Yang, BSc,School of Health Information Science, University of Victoria,Victoria, CanadaAddress for correspondence: Dr V Maida, MD, BSc,CCFP, ABHPM, 101 Humber College Boulevard, Toronto,Ontario, Canada M9V 1R8E-mail: [email protected]
ORIGINAL ARTICLE
ª 2008 The Authors. Journal Compilation ª 2008 Blackwell Publishing Ltd and Medicalhelplines.com Inc • International Wound Journal • Vol 5 No 4 585
Lower total scores are associated with a higher
risk of developing pressure ulcers. A number of
studies have been conducted to determine the
predictive validity of the BS (3–5). From these
studies, five risk levels of developing pressure
ulcers have been identified: 19–23 not at risk,
15–18mild risk, 13–14moderate risk, 10–12high
risk and �9 very high risk.
The Palliative Performance Scale (PPS) (Fig-
ure 2) is used to assess the functional status of
palliative care patients (6). The PPS has five
dimensions including the patient’s ambulation,
activity level and evidence of disease, self-care,
oral intake and level of consciousness. The PPS
has 11 levels from PPS 0% to PPS 100% in 10%
increments. A patient at PPS 0% is dead, while
at PPS 100% is mobile and healthy. Since its
introduction in 1996, the PPS has become
a popular assessment tool used by clinicians to
communicate the functional status of palliative
care patients to aide in care planning and
delivery (7). The PPS has also been found to be
highly predictive in estimating the survival
duration of critically ill patients in palliative
care settings (8).
Presently, there is no risk assessment tool that is
entirelyexact.Furthermore, the successofany tool
is predicated onwhether health care professionals
are actually tracking their results and trends and
acting upon them. Regarding predictive validity,
the BS has shown sensitivities that range from
70% to 100%andspecificities ranging from64%to
90% (3). Therefore, it tends to over predict the
likelihood of developing pressure ulcers. Ulti-
mately, the optimal mode of assessing pressure
ulcer risk may involve the use of a composite
assessment that usesmultiple validated tools (BS,
PPS, etc.) along with consideration of other risk
factors suchascomorbid illness (diabetesmellitus,
paralysis, spinal deformity, etc.) and other param-
eters such as laboratory tests (haemoglobin,white
cell count, erythrocyte sedimentation rate (ESR),
C-reactive protein (CRP), serum albumin, etc.).
METHODSSix hundred and sixty-four sequential patients
were eligible for the study. They represented
patients referred to a consultative combined
community and hospital-based palliative med-
icine programme for consideration of support-
ive and palliative care. This programme serves
an estimated population of 750 000 within the
northwest quadrant of Metropolitan Toronto,
Canada. Recruitment for this study was com-
menced with new referrals on 1 May 2005 and
ended on 30 June 2006. All patients or their
substitute decision makers provided consent to
have their clinical data registered in a research
database. The study protocol was approved by
the research ethics board of the William Osler
Health Centre in Toronto, Canada.
Each patient in this study had an initial PPS
and BS assessment performed by a member of
the palliative medicine consult team within
24 hours of the referral. Other data included in
this study were the patient’s age, gender, first
consult site (home or hospital) and diagnosis
type (cancer or non cancer). Statistical analyses
were performed with SPSS 16�0. Frequency
distributions were examined overall and in
two groups categorised by diagnosis type.
Pearson chi-squared test was used to examine
the relationship between diagnosis type and
each of the variables. General linear regression
was used to test the correlation between PPS
and BS and other variables.
RESULTS
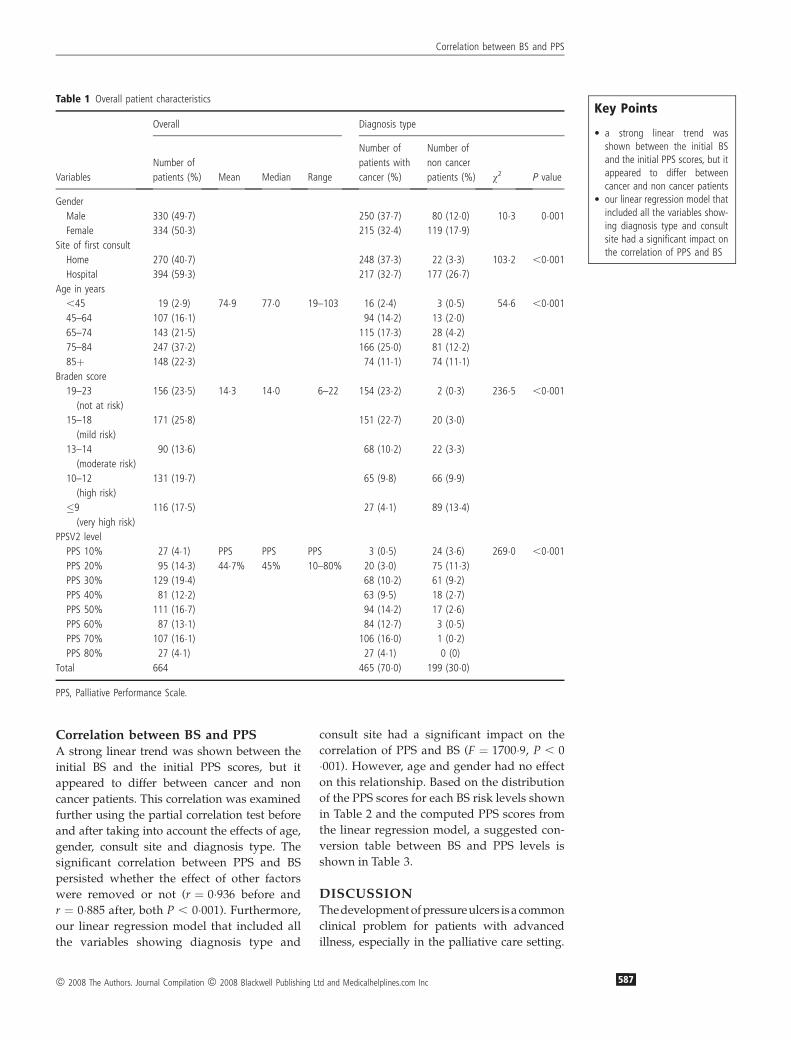
Patient characteristicsOf the 664 patients in this study, 465 (70�0%)
were diagnosed with cancer and the remaining
199 (30�0%)were non cancer. Althoughmale and
female patients were distributed evenly overall,
there were significantly more male patients in
this cohort with cancer (w2 ¼ 10�3, P ¼ 0�001).Just overhalfof thepatients (59�4%)hadtheir first
consult in the hospital, but patients with cancer
were more likely to have their first consult at
home (w2 ¼ 103�2, P , 0�001). Compared with
the median age of 77 years, patients with cancer
were younger than those with non cancer:
72�5 years (cancer) versus 80�6 years (non can-
cer) (w2 ¼ 54�6, P , 0�001). These patient char-
acteristics are shown in Table 1.
BS and PPS assessmentsOverall, the initial BS scores in this study
ranged from6 to 22with amedian score of 14�0.The initial PPS scores ranged from PPS 10% to
PPS 80% with a median of PPS 45%. The
diagnosis type had a significant impact on the
patients’ PPS and BS levels (w2 ¼ 236�5 for PPSand w2 ¼ 269�0 for BS, both P , 0�001). Specif-ically, non cancer patients had significantly
higher occurrence of lower PPS and BS scores
when compared against those with cancer. The
patterns of PPS and BS scores are shown in
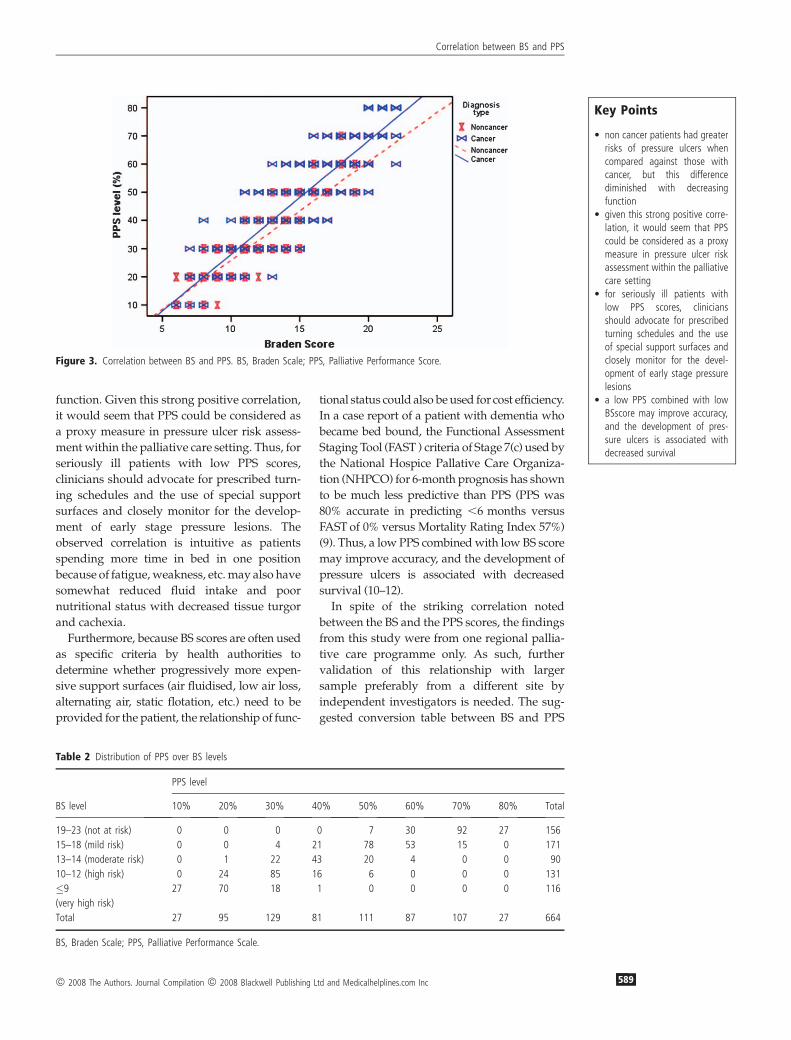
Figure 3.
Key Points
• the Palliative Performance Scale(PPS) is used to assess thefunctional status of palliativecare patients
• the PPS has also been found tobe highly predictive in estimat-ing the survival duration ofcritically ill patients in palliati-vecare settings
• presently, there is no riskassessment tool that is entirelyexact
• the success of any tool ispredicated on whether healthcare professionals are actuallytracking their results and trendsand acting upon them
• the optimal mode of assessingpressure ulcer risk may involvethe use of a composite assess-ment that uses multiplevali-dated tools (BS, PPS, etc.)along with consideration ofother risk factors such ascomorbid illness (diabetes mel-litus, paralysis, spinal deformity,etc.) and other parameters suchas laboratorytests (haemoglo-bin, white cell count, ESR,CRP,serum albumin, etc.
• of the 664 patients in thisstudy, 465 were diagnosed withcancer and the remaining 199were non cancer
Correlation between BS and PPS
586 ª 2008 The Authors. Journal Compilation ª 2008 Blackwell Publishing Ltd and Medicalhelplines.com Inc
Correlation between BS and PPSA strong linear trend was shown between the
initial BS and the initial PPS scores, but it
appeared to differ between cancer and non
cancer patients. This correlation was examined
further using the partial correlation test before
and after taking into account the effects of age,
gender, consult site and diagnosis type. The
significant correlation between PPS and BS
persisted whether the effect of other factors
were removed or not (r ¼ 0�936 before and
r ¼ 0�885 after, both P , 0�001). Furthermore,
our linear regression model that included all
the variables showing diagnosis type and
consult site had a significant impact on the
correlation of PPS and BS (F ¼ 1700�9, P , 0
�001). However, age and gender had no effect
on this relationship. Based on the distribution
of the PPS scores for each BS risk levels shown
in Table 2 and the computed PPS scores from
the linear regression model, a suggested con-
version table between BS and PPS levels is
shown in Table 3.
DISCUSSIONThedevelopmentofpressureulcers is a common
clinical problem for patients with advanced
illness, especially in the palliative care setting.
• a strong linear trend wasshown between the initial BSand the initial PPS scores, but itappeared to differ betweencancer and non cancer patients
• our linear regression model thatincluded all the variables show-ing diagnosis type and consultsite had a significant impact onthe correlation of PPS and BS
Correlation between BS and PPS
ª 2008 The Authors. Journal Compilation ª 2008 Blackwell Publishing Ltd and Medicalhelplines.com Inc 587
The BS has been shown to be a validated and
reliable tool for assessing the risk of developing
pressure ulcers. Yet, unlike the PPS that is
widely used to assess one’s functional status in
palliative care, the BS tool is not commonly
applied to these patients. In this study, a signif-
icant correlation between the initial BS and the
initial PPS scores in a cohort of 664 patients
with advanced illness referred to a regional
palliative medicine programme that has never
been reported until now.
In particular, patients with lower BS scores
whowere at higher risks of developing pressure
ulcers also had lower PPS scores with reduced
functional status. Furthermore, non cancer
patients had greater risks of pressure ulcers
when compared against those with cancer, but
this difference diminished with decreasing
Figure 1. The Braden Scale (ª Barbara Braden and Nancy Bergstrom, 1988. Reprinted with Permission).
Figure 2. Palliative Performance Scale (ª 2001 Victoria Hospice Society. 1996. Reprinted with Permission).
Key Points
• the BS has been shown to bea validated and reliable tool forassessing the risk of developingpressure ulcers
• unlike the PPS that is widelyused to assess one’s functionalstatus in palliative care, the BStool is not commonly applied tothese patients
• in this study, a significant cor-relation between the initial BSand the initial PPS scores ina cohort of 664 patients withadvanced illness referred toa regional palliative medicineprogramme that has never beenreported until now
• patients with lower BS scoreswho were at higher risks ofdeveloping pressure ulcers alsohad lower PPS scores withreduced functional status
Correlation between BS and PPS
588 ª 2008 The Authors. Journal Compilation ª 2008 Blackwell Publishing Ltd and Medicalhelplines.com Inc
function. Given this strong positive correlation,
it would seem that PPS could be considered as
a proxy measure in pressure ulcer risk assess-
ment within the palliative care setting. Thus, for
seriously ill patients with low PPS scores,
clinicians should advocate for prescribed turn-
ing schedules and the use of special support
surfaces and closely monitor for the develop-
ment of early stage pressure lesions. The
observed correlation is intuitive as patients
spending more time in bed in one position
because of fatigue, weakness, etc.may also have
somewhat reduced fluid intake and poor
nutritional status with decreased tissue turgor
and cachexia.
Furthermore, because BS scores are often used
as specific criteria by health authorities to
determine whether progressively more expen-
sive support surfaces (air fluidised, low air loss,
alternating air, static flotation, etc.) need to be
provided for the patient, the relationship of func-
tional status could also be used for cost efficiency.
In a case report of a patient with dementia who
became bed bound, the Functional Assessment
Staging Tool (FAST ) criteria of Stage 7(c) used by
the National Hospice Pallative Care Organiza-
tion (NHPCO) for 6-month prognosis has shown
to be much less predictive than PPS (PPS was
80% accurate in predicting ,6 months versus
FAST of 0% versus Mortality Rating Index 57%)
(9). Thus, a low PPS combinedwith low BS score
may improve accuracy, and the development of
pressure ulcers is associated with decreased
survival (10–12).
In spite of the striking correlation noted
between the BS and the PPS scores, the findings
from this study were from one regional pallia-
tive care programme only. As such, further
validation of this relationship with larger
sample preferably from a different site by
independent investigators is needed. The sug-
gested conversion table between BS and PPS
Figure 3. Correlation between BS and PPS. BS, Braden Scale; PPS, Palliative Performance Score.
• non cancer patients had greaterrisks of pressure ulcers whencompared against those withcancer, but this differencediminished with decreasingfunction
• given this strong positive corre-lation, it would seem that PPScould be considered as a proxymeasure in pressure ulcer riskassessment within the palliativecare setting
• for seriously ill patients withlow PPS scores, cliniciansshould advocate for prescribedturning schedules and the useof special support surfaces andclosely monitor for the devel-opment of early stage pressurelesions
• a low PPS combined with lowBSscore may improve accuracy,and the development of pres-sure ulcers is associated withdecreased survival
Correlation between BS and PPS
ª 2008 The Authors. Journal Compilation ª 2008 Blackwell Publishing Ltd and Medicalhelplines.com Inc 589
levels also requires independent validation of its
accuracy. In addition, this studyonly considered
BS and PPS values at baseline without tracking
the relation over time.
CONCLUSIONSPressure ulcers are highlyprevalent in the setting
of patients with advanced illness. They are
associatedwith increasedmorbidity andmortal-
ity, reduced quality of life and escalating health
care expenditures. BS has been shown to be an
effective screening tool for risk assessment for the
development of pressure ulcers in a number of
clinical scenarios. This study shows a strong
linear correlation between BS and PPS in the
setting of patients with advanced illness referred
for supportive andpalliative care. Therefore, PPS
should be considered as a proxy measure for BS
in the pursuit of screening for pressure ulcer risk
in the setting of supportive and palliative care.
ACKNOWLEDGEMENTSWe wish to thank Shiraz Irani and Linda
Trozzolo for their work in data collection and
Darren Hamilton for his editorial assistance.
Funding support for the study has been pro-
vided by the Canadian Institutes for Health
Research New Emerging Team grant in Pallia-
tive and End-of-life Care.
REFERENCES1 Maida V, Corbo M, Dolzhykov M, Ennis M, Irani S,
Trozzolo L. Wounds in advanced illness: a preva-
lence and incidence study based on a prospective
case series. Int Wound J 2007;5:305–14.
2 Braden BJ, Bergstrom N. Clinical utility of the
Braden Scale for predicting pressure sore risk.
Decubitus 1989;2:44–6, 50–1.
3 Braden BJ, Maklebust J. Preventing pressure ulcers
Table 3 Suggested conversion between BS and PPS levels*
BS PPS
19–23 (not at risk) PPS 60%–PPS 80%
15–18 (mild risk) PPS 50%–PPS 60%
13–14 (moderate risk) PPS 40%
10–12 (high risk) PPS 30%–PPS 40%
�9 (very high risk) PPS 10%–PPS 20%
BS, Braden Scale; PPS, Palliative Performance Scale.*PPS ¼ �8�99 þ 3�77 (BS) � 3�25 site þ 2�35 Diagnosis,where site ¼ 0 for home and 1 for hospital and Diagnosis ¼ 0for non cancer and 1 for cancer.
Key Points
• further validation of this rela-tionship with larger samplepreferably from a different siteby independent investigators isneeded
• the suggested conversion tablebetween BS and PPS levels alsorequires independent validationof its accuracy
• this study only considered BSand PPS values at baselinewithout tracking the relationover time
• PPS should be considered asa proxy measure for BS in thepursuit of screening for pres-sure ulcer risk in the setting ofsupportive and palliative care
Correlation between BS and PPS
590 ª 2008 The Authors. Journal Compilation ª 2008 Blackwell Publishing Ltd and Medicalhelplines.com Inc